• Skip to content

Hull Joint Strategic Needs Assessment

Search Results for: climate

Geographical Area

This topic area covers statistics and information relating to the Hull’s physical geographical area and some information relating to the environment including local strategic need and service provision. Further demographic, health and wellbeing information relating to specific geographical areas such as electoral wards under Ward Profiles within Place. Further information on the environmental factors of Air Pollution and Climate Change can be found within Health and Wellbeing Influences.

More information relating to the population differences between the NHS geography (based on patients registered with Hull GPs) and the local authority (based on residents of Hull) and the difference in these estimates from different data sources is given on Population Estimates under Population. Further information on the differences in the type of housing and household composition within Hull can be found on Housing and Households under Health and Wellbeing Influences.

This page contains information from the Office for Health Improvement & Disparities’ Fingertips. Information is taken ‘live’ from the site so uses the latest available data from Fingertips and displays it on this page. As a result, some comments on this page may relate to an earlier period of time until this page is next updated (see review dates at the end of this page).

In July 2022, Clinical Commissioning Groups (CCGs) ceased to exist and were replaced by the Integrated Care System. Data will still be available at CCG level for some time after July 2022 so the JSNA will continue to reference CCGs and Hull CCG as well as the larger geographical area Humber, Coast and Vale which included Hull CCG. New data is becoming available for Hull’s Health and Care Partnership and is referred to as sub Integrated Care Board and referenced by 03F for Hull within Fingertips, as well as data being available for the larger local geographical area – the Humber and North Yorkshire Health and Care Partnership or Humber and North Yorkshire Integrated Care Board.

Headlines

  • The geographical boundaries in Hull are tight and exclude the more affluent suburban areas unlike other cities. This means that Hull is ranked among the most deprived local authorities in England.
  • It is estimated that 45% of Hull’s population live in the bottom fifth of areas nationally based on the Access to Healthy Assets and Hazards index which measures multidimensional features of the built environment including accessibility to retail services (fast food outlets, pubs, gambling stores, etc), health services, green spaces and overall air quality. The index can be considered to be a measure of the unhealthy environments present. The percentage in Hull is far greater than England (21%) and the other 14 local authorities across the Yorkshire and Humber region (range 1.3% to 32.6%). Outside the concentrated density of London (where most local authorities have the majority of the population in the bottom fifth including the City of London where all their population is included in the bottom fifth of areas), Hull has among the highest percentages being fifth highest of the 120 upper-tier local authorities outside London.
  • Hull is 71.6 kilometres square and has around 3,800 residents per square kilometre. Hull is in the top fifth of lower-tier local authorities with the highest population density.
  • It is likely that some people in Hull move to the ‘leafy suburbs’ in East Riding of Yorkshire just outside Hull’s boundary each year. The more aspirational, successful and motivated people will tend, on average, to have increased mobility, and this affects the employment and skills profile of Hull.
  • Owing to Hull’s somewhat isolated location, people may be less likely to be influenced by positive health factors occurring elsewhere.
  • The geographical boundaries for Hull local authority are the same as for Hull’s Health & Care Partnership (sub Integrated Care Board area), although the population size if different. The estimate resident population was 275,401 people from the Office for National Statistics mid-year 2024, but the number of patients registered with Hull GPs was 314,215 patients as at July 2025 (and around 8% of these patients live in East Riding of Yorkshire). Furthermore, the GP registration file includes almost 20,000 ‘extra’ residents compared to the Office for National Statistics resident population estimates (8% of total residents in the registration file). Some of these ‘extra’ residents are likely to be ‘ghost’ patients who are have moved away but have not registered with another GP in England (either because they haven’t been ill since moving or they moved abroad – some of which may have been students).

The Population Affected – Why Is It Important?

In order to improve health and reduce inequalities, it is important to understand the make-up of the local population, the geographical area and the environment. Features within the geographical areas, such as rivers or the location of residential, commercial and industrial areas, or the way in which boundaries have been derived can all influence the health needs of the local population, and also their access to services.

As the World Health Organisation states “Humans interact with the environment constantly. These interactions affect quality of life, years of healthy life lived, and health disparities.”  WHO defines environment, as it relates to health, as all the physical, chemical, and biological factors external to a person, and all the related behaviours. From Healthy People 2020, environmental health consists of preventing or controlling disease, injury, and disability related to the interactions between people and their environment.

The World Health Organisation estimate that 24% of the global disease burden and 23% of all deaths can be attributable to environmental factors, and that this figure is higher for children aged 0-14 years (36% for deaths). The overall figures are lower in high income countries and it is estimated that this figure is around 14% on average in Europe in relation to deaths. However, there are large inequalities both between and within countries.

Environmental factors include indoor and outdoor air pollution, climate change, extreme weather events, flooding, drought, unsafe drinking water, chemical and radiation exposures, leaks and contaminations including contaminated land, exposure to lead, asbestos and other substances and chemicals, exposure to other adverse substances in the home such as mould, noise pollution, light pollution, and a number of other environmental factors.

While Hull has relatively good air quality, air pollution is a major cause of premature death and disease, and is the single largest environmental health risk in Europe according to the European Environmental Agency.

The Intergovernmental Panel on Climate Change state that we are currently experiencing the greatest change in the natural environment in human history. The threat of climate change as a result of the increase of greenhouse gases by human activity is pushing known planetary boundaries in areas such as species loss, air quality, natural resources and extreme weather events. The increasing global population expansion and dietary change is putting pressure on agriculture and land use.

As stated by the government, the transition to a low carbon society to combat these environmental threats provides challenges in energy generation and its use, urban transport to combat air quality and improve physical health and improving the resilience and adaptability of our communities particularly the most vulnerable.

The Hull Picture

About Hull

The city and port of Hull lies on the north bank of the Humber estuary and is positioned at the gateway to Europe. It is linked to the national motorway networks from the west via the M62 and to the south across the Humber Bridge via the M180. Hull’s city boundary is roughly semi-circular with a radius of approximately 4.4 miles or 7 kilometres. The city is compact and highly urbanised. It is one of the most densely populated local authorities in the Yorkshire and Humber region. Hull serves large rural and coastal areas in neighbouring local authorities, and is surrounded by the East Riding of Yorkshire to the north, east and west, and by the Humber estuary to the south. The River Hull runs through the middle of the city from north to south with industries traditionally located around the rivers of Hull and the Humber forming an inverted T-shape of industrial areas in Hull. Hull is flat and low lying which has previously resulted in problems with flooding (in 2007 due to heavy rainfall and in 2013 due to a tidal surge). With the tight urban boundary, many small towns and villages in neighbouring East Riding of Yorkshire are located on the periphery of the boundary, and generally constitute the ‘leafy suburb’ areas of the city. As a result of these more affluent suburb areas falling outside the city boundary (unlike many other local authorities where parts of these suburb areas fall within a city’s boundary), Hull is among the most deprived local authorities in England.

The Hull travel-to-work areas, which covers a large percentage of East Riding of Yorkshire, has one of the highest levels of commuter self-containment in the country. This means that Hull has high levels of visitor populations who visit Hull for work, retail and leisure purposes.

Hull has some outstanding cultural and historic assets, many of national and international significance. Hull has a good distribution of parks and open spaces, and green space makes up around a third of land use (34.4%). The largest land use is then followed by domestic gardens (20.6%), roads (13.0%), domestic buildings (8.6%), non-domestic buildings (6.4%), water (2.5%), paths (1.6%) and rail (0.6%), with the remaining 12.3% defined as other land uses. Hull is a total of 7,154 hectares.
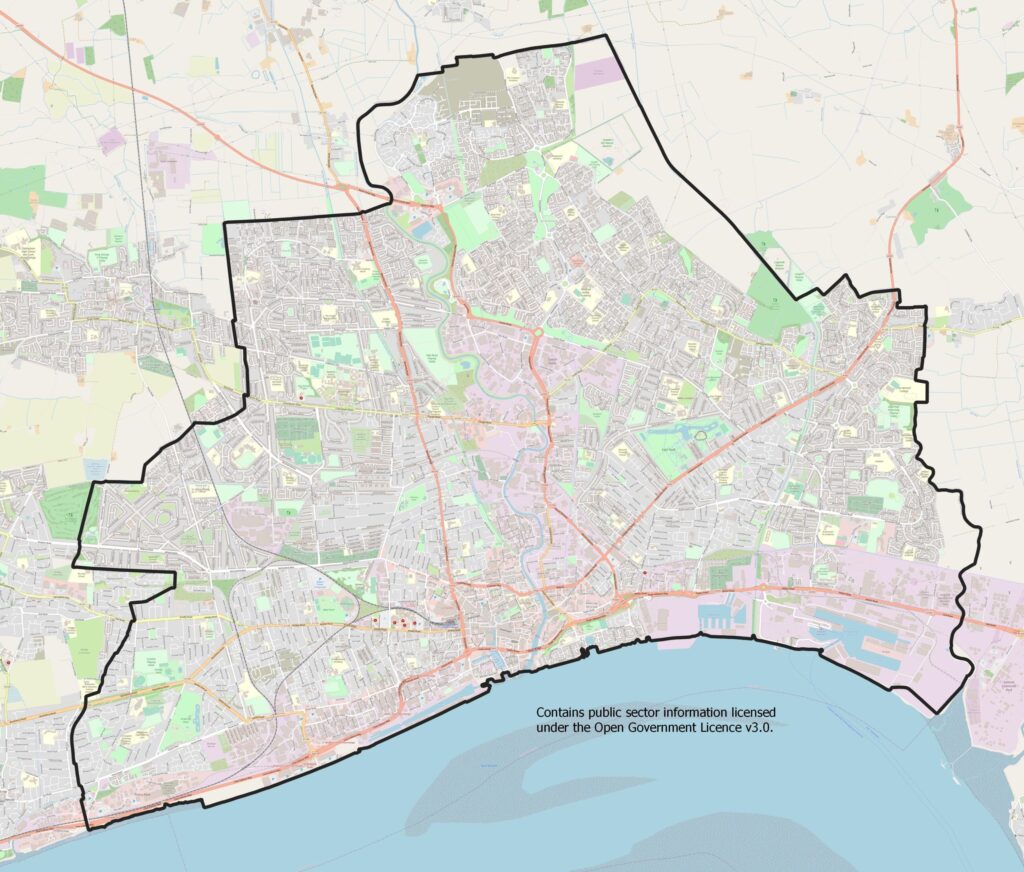
Map of Hull
Map of Hull

Since Hull was announced as the UK’s City of Culture 2017, numerous multi-million pound investments have revitalised and transformed the city centre. Investments of more than £1 billion have flowed into the city, creating thousands of jobs, and over £3 billion in total from public and private investment. Thousands of volunteers helped deliver the cultural programme in 2017 with nine in ten people in Hull taking part in City of Culture events. Visitor numbers increased dramatically. Following on from its success, the City of Culture legacy has been embedded in every stage of the UK City of Culture journey and has been the topic of the 2016 Director of Public Health Annual report with a ten-year Cultural Strategy 2016-2026 launched in a bid to sustain the economic boom and “put culture and the arts at the heart of Hull’s regeneration and development”.

Hull’s Tight Geographical Boundaries

In relation to the characteristics of Hull, one problem relatively unique to Hull is its tight geographical boundaries. Most cities such as Hull are relatively deprived, but most other local authority or NHS boundaries include some more affluent suburban areas. Hull has very few affluent suburbs within its boundaries, and it is estimated that a number of people in Hull move to the ‘leafy suburbs’ in East Riding of Yorkshire just outside Hull’s boundary each year. The people that tend to move will often do so because of children and better schools, better quality and choice of housing, etc. The more aspirational, successful and motivated people will tend, on average, to have increased mobility. This also affects the employment and skills profile of Hull. Furthermore, owing to Hull’s somewhat isolated location, people may be less likely to be influenced by positive health factors and changes occurring elsewhere in other geographical areas. Due to Hull’s high levels of deprivation and tight boundaries, Hull is often at the bottom of national league tables and among the ‘worst’ for various indicators for both health and the wider determinants of health. As a result, there are often negative comments made about Hull, which can influence attitudes, health and lifestyle. Within local qualitative research projects, there were certainly some residents that had a “what’s the point?” attitude with regard to their health and lifestyle changes, however, others felt that this was just an excuse “You can lead a healthy lifestyle anywhere, it’s not the place – I staunchly defend Hull– it’s about choices”.

From the Office for National Statistics population estimates for 2024, Hull is 71.6 kilometres square and has an estimated 3,846 residents per square kilometre. Hull is in the fifth of lower-tier local authorities in terms of having high population density.

Hull’s Location Within the Yorkshire and Humber Region

Hull is one of 15 unitary authority in the Yorkshire and the Humber region, and Hull is both a lower-tier and upper-tier local authority as are the other 14 local authorities in the region (North Yorkshire was previously split into seven lower-tier local authorities).
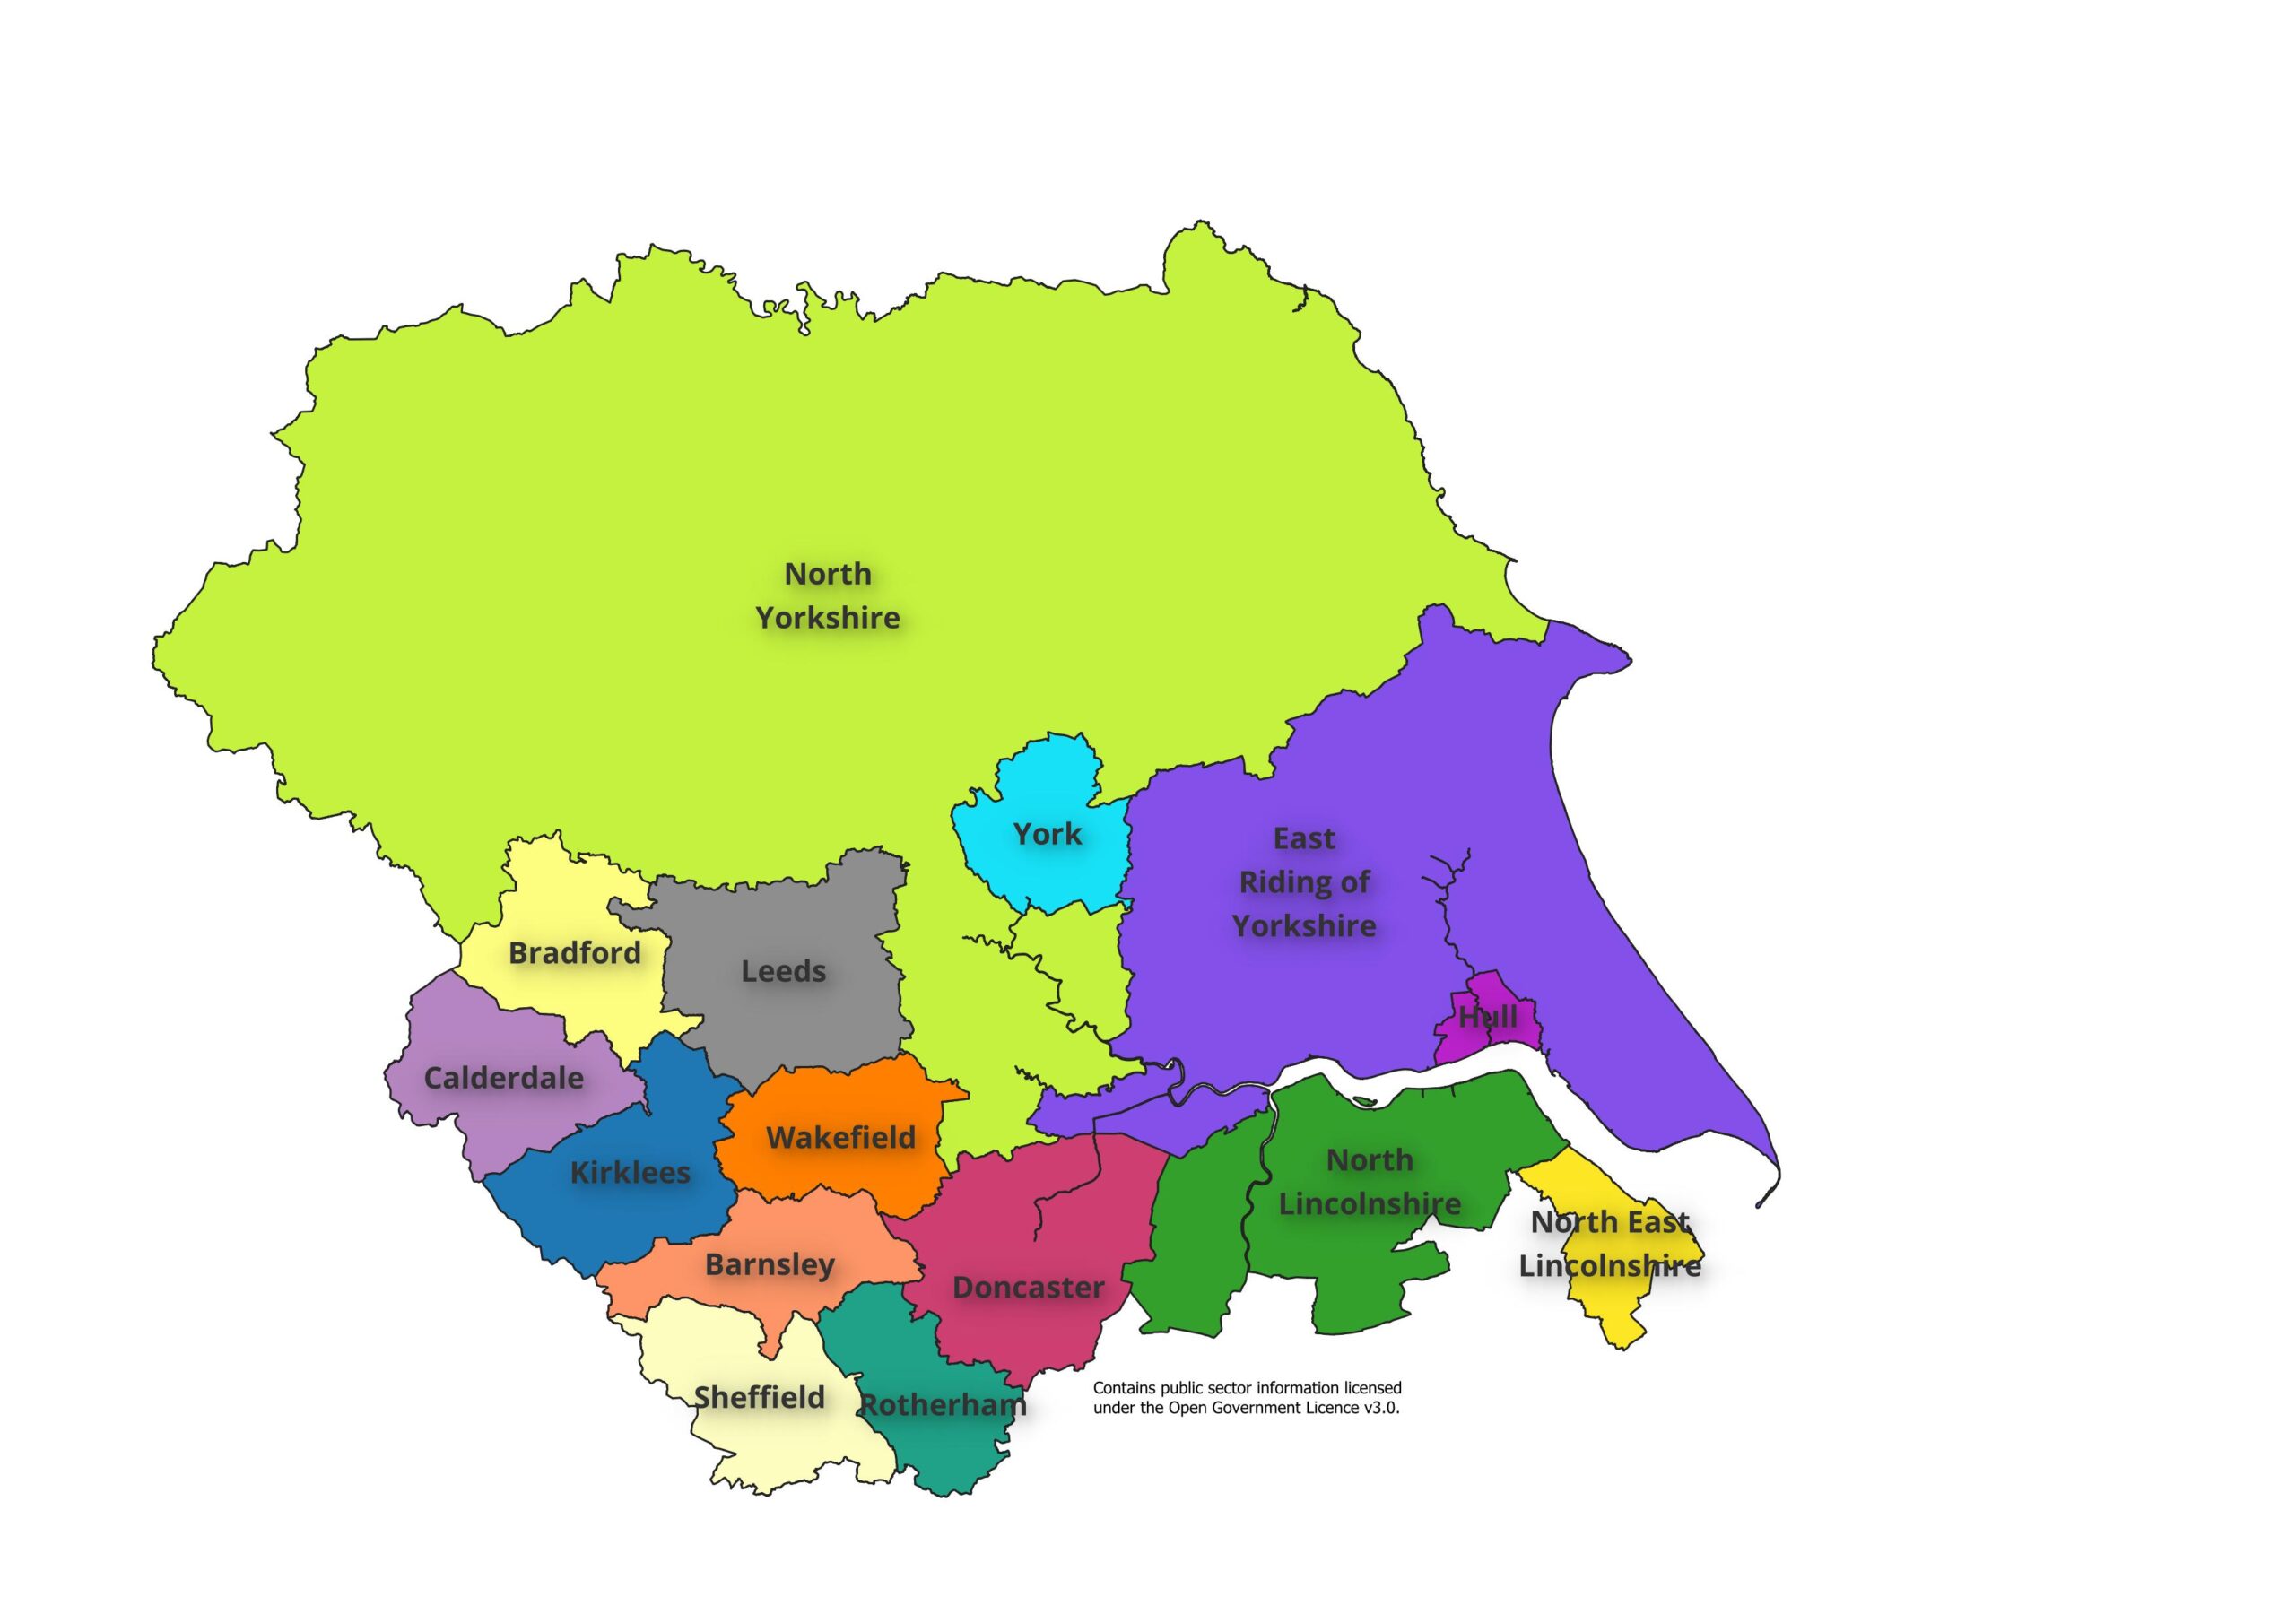
Local authorities in the Yorkshire and the Humber region

Hull’s Electoral Wards

There were 23 wards in Hull prior to May 2018 and this had been the case for more than a decade. In May 2018, the number of wards in Hull reduced to 21, and the boundary of every single ward changed. Some changes were relatively minor, but other changes were much more substantial. The names of around half of the wards remained the same despite changes to all the boundaries. These also ranged from relatively minor changes to entirely new names for some wards. Prior to April 2023, Hull was divided into seven Area Committee Areas each covering three wards with North Carr, Kingswood, and West Carr in Foredyke Area, Beverley & Newland, Orchard Park, and University in Northern Area, Ings, Longhill & Bilton Grange, and Sutton in East Area, Holderness, Marfleet, and Southcoates in Park Area, Drypool, Newington & Gipsyville, and St Andrew’s & Docklands in Riverside Area, Boothferry, Derringham, and Pickering and West Area, and Avenue, Bricknell, and Central in Wyke Area.

As at January 2026, there are six Area Committee Areas made up from Hull’s 21 wards. The names of these Area Committee Areas may change in due course. Further information on the Area Committee Areas prior to January 2026 can be found in our Glossary.
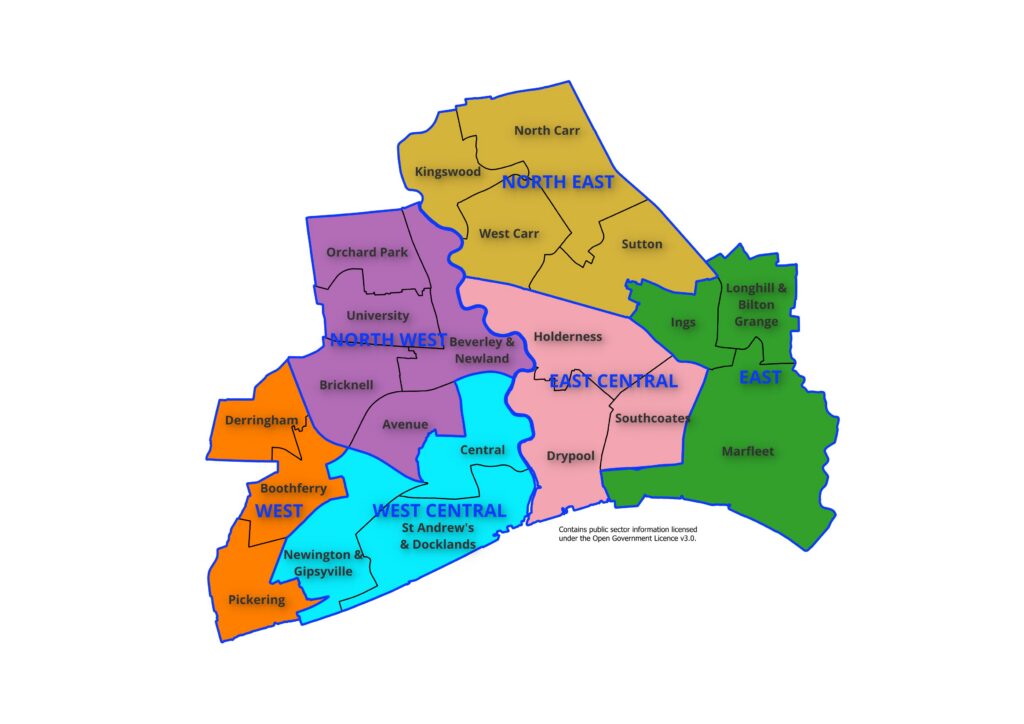
Map showing the 21 wards and six Area Committee Areas in Hull, January 2026.

Geographical Boundaries Relating to the NHS

The other key geographical boundary for Hull in terms of health relate to those associated with the NHS.

Prior to April 2013, the NHS comprised of Primary Care Trusts (PCTs), and between April 2013 and June 2022, the local NHS geographical area was made up from Clinical Commissioning Groups (CCGs). There were also Sustainability and Transformational Partnerships (STPs) made up of a number of local CCGs. Prior to July 2022, Hull was included within the Humber, Coast and Vale (HCV) STP (which included five other local CCGs: North Yorkshire, Vale of York, East Riding of Yorkshire, North Lincolnshire and North East Lincolnshire). The STPs were later transformed into Health and Care Partnerships (HCPs), and there have been further changes to the NHS geography in July 2022 with Integrated Care Systems.

The Integrated Care System (ICS) is made of up two core statutory elements at system level formerly came into effect on 1 July 2022 when CCGs ceased to exist. The ICSs are where major decisions are made, and overarching strategies agreed. The Integrated Care Boards (ICB) replace CCGs and are focused on the core NHS services, with responsibilities including NHS funding, commissioning and workplace planning. The Integrated Care Partnerships (ICP) have a broad focus, covering ICB-wide strategy, public health, social care, and wider issues impacting the health and wellbeing of the population. There will continue to a Place element within the ICS, and this will involve the planning of localised services and secondary and community care. NHS England sees ‘place’ as the key driver of change within ICSs and they are expected to be where the majority of work actually occurs. Data will continue to available at CCG level for some time and as a result CCG will still be referenced within our Joint Strategic Needs Assessment, and will gradually be replaced over time as the new system is embedded and new data becomes available at the new geographical levels.

The Office for Health Improvement & Disparities’ Fingertips includes some information at sub-ICB level, and Hull is referenced by its CCG code of 03F.

All areas within the Humber and North Yorkshire Integrated Care Board are:

  • 02Y – East Riding of Yorkshire
  • 03F – Hull
  • 03H – North East Lincolnshire
  • 03K – North Lincolnshire
  • 03Q – Vale of York
  • 42D – North Yorkshire

Hull’s Place element is Hull’s Health and Care Partnership, and the Humber, Coast and Vale Health and Care Partnership also ceased to exist and Hull is included in the Humber and North Yorkshire Health and Care Partnership or the Humber and North Yorkshire Integrated Care Board (ICB).

The geographical boundary of the local authority is the same as the boundary for the NHS in Hull, although the population size if different. The resident population is estimated to be 275,401 people in 2024, but the number of patients registered with Hull GPs in July 2025 is 314,251 patients (and around 8% of these patients live in East Riding of Yorkshire). For more information about the difference between the resident population and registered population, see Population Estimates under Population.

The local authority and sub Integrated Care Board boundaries are coterminous for Hull, North East Lincolnshire and North Lincolnshire, and are similar for East Riding of Yorkshire local authority. However, they differ substantially for North Yorkshire and York local authorities. North Yorkshire upper-tier local authority previously contained seven lower-tier local authorities of Selby, Craven, Richmondshire, Harrogate, Hambleton, Ryedale and Scarborough. The Vale of York sub Integrated Care Board contains York local authority and what was previously Selby and parts of Hambleton and Ryedale lower-tier local authorities. Additionally, Vale of York also contains part of East Riding of Yorkshire local authority (around Pocklington).
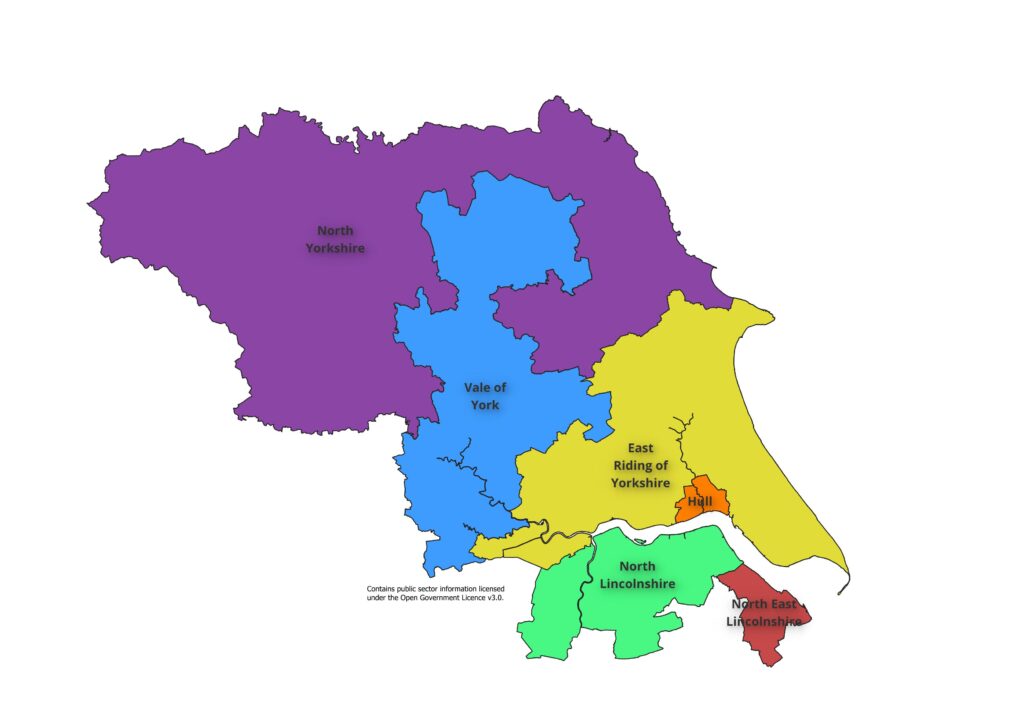
Sub-Integrated Care Boards within Humber and North Yorkshire Integrated Care Board

Environmental Factors

Access to Healthy Assets and Hazards Index

The Access to Healthy Assets and Hazards (AHAH) index is designed to allow policy and decision makers to understand which areas have poor environments for health, and to help move away from treating features of the environment in isolation.

The Access to Healthy Assets and Hazards index is comprised of four domains: access to retail services (fast food outlets, gambling outlets, pubs/bars/nightclubs, off licences, tobacconists), access to health services (GP surgeries, A&E hospitals, pharmacies, dentists and leisure centres), the physical environment (green and blue spaces) and levels of air pollution (nitrogen dioxide (NO2), particulate matter smaller than 10 microns (PM10) and sulphur dioxide (SO2)). The Access to Healthy Assets and Hazards index provides a summary of an area’s relative performance on these indicators (the second and third domains conceptualised as health promoting and the first (access to retail) as health demoting. It therefore provides information on how conducive to good health an area is relative to other areas, for the specific indicators.

Public Health England’s (now the Office for Health Improvement & Disparities) Spatial Planning for Health document states that an ‘ever-increasing body of research indicates that the environment in which we live is inextricably linked to our health across the life course. For example, the design of our neighbourhoods can influence physical activity levels, travel patterns, social connectivity, mental and physical health and wellbeing outcomes.’ The indicator is intended to support interventions to improve the health promoting qualities of the environment, and is primarily aimed at those working in public health roles in local authorities.

The Access to Healthy Assets and Hazards index is constructed given equal weight to the different measures and domains. It is therefore designed as a balanced description of an area with regard to these domains, and not as a summary of the health impacts on the population.

Overall Index

The Access to Healthy Assets and Hazards index is originally produced at lower layer super output area geographical level as an average of values for constituent postcodes but has been presented at local authority level in the Office for Health Improvement & Disparities’ Fingertips.

The Access to Healthy Assets and Hazards index is presented as percentage of the total population residing in lower super output areas defined as in the bottom 20% of all areas on the Access to Healthy Assets and Hazards Index as a percentage of the total population of the area.

In 2024, the Access to Healthy Assets and Hazards Index is very high in Hull with 44.7% of Hull’s population residing in the bottom fifth of areas nationally in relation to the Access to Healthy Assets and Hazards Index. The percentage nationally is 20.9% and across the other 14 lower tier local authorities in the region the range is from 1.3% to 32.6%.

In London, 23 of the 33 upper-tier local authorities have a higher percentage of their populations living within areas in the bottom fifth of areas nationally in relation to the Access to Healthy Assets and Hazards Index due to the high population density of many London local authorities. This includes 11 London upper-tier local authorities where three-quarters or more of their populations are living within areas in the bottom fifth of areas nationally in relation to the Access to Healthy Assets and Hazards Index including the City of London where all its population fall into this category. Outside London, Hull has the fifth highest percentage among the 120 upper-tier local authorities outside London being lower than Thurrock (74%), Liverpool (53%), Leicester (47%) and Oldham (45%).

Compared with benchmark
Better
Similar
Worse

Not Compared

Lower
Similar
Higher
Indicator Period
England
Yorkshire and the Humber region (statistical)
Kingston upon Hull
East Riding of Yorkshire
North East Lincolnshire
North Lincolnshire
York
North Yorkshire UA
Barnsley
Doncaster
Rotherham
Sheffield
Bradford
Calderdale
Kirklees
Leeds
Wakefield
Access to Healthy Assets & Hazards Index
(Persons All ages)
2024 20.9 18.2 44.7 9.4 23.6 10.7 1.3 13.4 10.2 6.2 9.7 13.7 32.6 5.1 13.1 30.3 18.8
Indicator Period
England
Yorkshire and the Humber region (statistical)
Kingston upon Hull
East Riding of Yorkshire
North East Lincolnshire
North Lincolnshire
York
North Yorkshire UA
Barnsley
Doncaster
Rotherham
Sheffield
Bradford
Calderdale
Kirklees
Leeds
Wakefield
Access to Healthy Assets & Hazards Index
(Persons All ages)
2024 20.9 18.2 44.7 9.4 23.6 10.7 1.3 13.4 10.2 6.2 9.7 13.7 32.6 5.1 13.1 30.3 18.8

Office for Health Improvement & Disparities. Public Health Profiles. 2026 https://fingertips.phe.org.uk © Crown copyright 2026

Despite the very high levels in Hull, the index has decreased considerably since 2016 when nine in ten residents lived in the worst fifth of areas of England in relation to the index, although there was a large decrease between 2016 and 2017 to 46% with only relatively minor changes to 2022 and 2023.

In 2024, it is estimated that 120,220 residents in Hull live within areas defined as the bottom fifth of areas nationally based on the Access to Healthy Assets and Hazards Index.

Compared with benchmark
Better
Similar
Worse

Not Compared

Lower
Similar
Higher
Access to Healthy Assets & Hazards Index (Persons All ages)
Period
Kingston upon Hull
Yorkshire and the Humber region (statistical)
England
Count
Value
95%
Lower CI
95%
Upper CI
2016 • 233157 90.0% - - 22.2% 21.2%
2017 • 120814 46.3% - - 14.1% 21.1%
2022 • 114694 44.3% - - 19.9% 22.6%
2024 • 120220 44.7% - - 18.2% 20.9%

Source: Consumer Data Research Centre

Office for Health Improvement & Disparities. Public Health Profiles. 2026 https://fingertips.phe.org.uk © Crown copyright 2026

Information relating to version 4 of the Access to Healthy Assets and Hazards index is available at lower layer super output area geographical level. There are 33,755 lower layer super output areas in England, and the percentile score has been calculated for each of the 168 lower layer super output areas in Hull. The index was updated in July 2024. The air pollution data is from the Department for Environment, Farming and Rural Affairs (DEFRA) for 2022. Locations of health facilities data is available quarterly so the data will relate to data from 2024, and retail facilities location data and the blue and green space indicators relate to data within the last year or so.

As Hull is a city and a relatively densely populated city with tight boundaries, it does mean that there is not far to travel with regard to access to healthcare in that that most of the population are as short drive away from the nearest dentist, GP, hospital and pharmacy. This results in Hull having a relatively good score in relation to to the health index. However, this also means that drive times are low to ‘unhealthy’ places such as fast food outlets, gambling outlets, pubs/bars/nightclubs, off licences and tobacconists. Areas with more dense areas of industry and cities with more roads will also tend to have higher levels of pollution than more rural areas. Hull tends to have a relatively high number of green spaces (as mentioned above around one-third of Hull is green space) and with the proximity of the Humber estuary and the River Hull, there is also only a short drive to the nearest blue space in Hull.
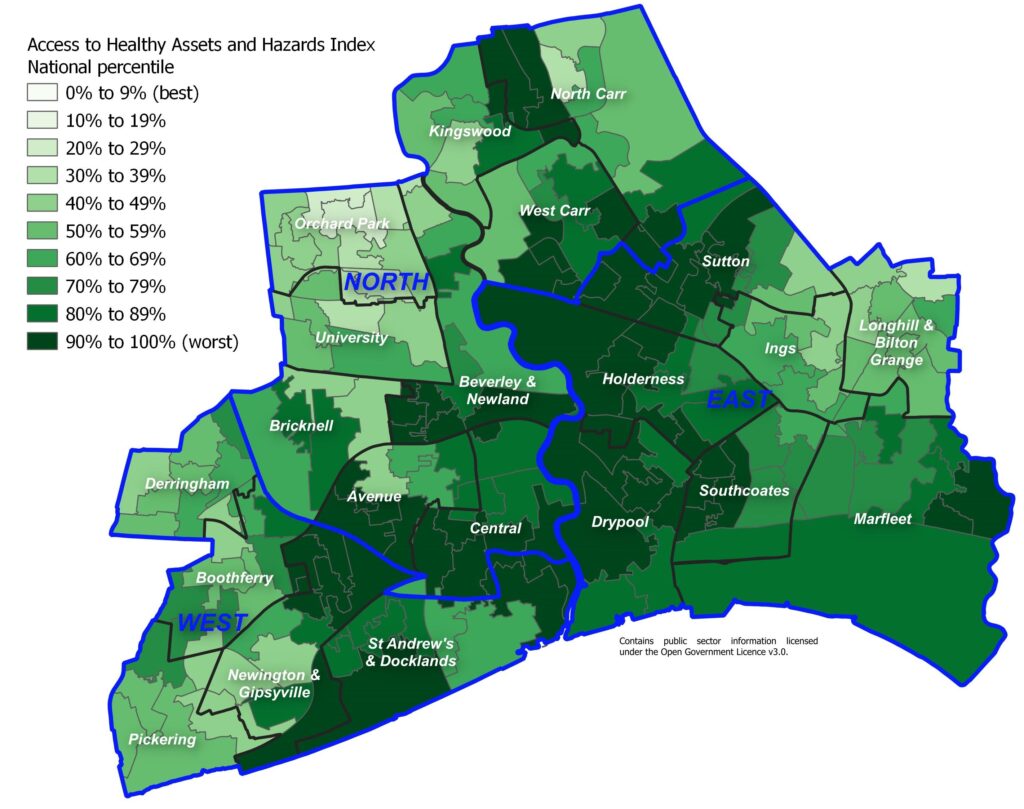
Access to Healthy Assets and Hazards Index: national percentiles
Usefulness and Problems Associated with the Index

It is useful to examine the index as a whole, but with the caveats associated with some of the individual components of the index, it is also useful to examine the individual components to assess potential issues or hazards for people living in the different areas of the city. The individual components of the index are mapped below.

Whilst the index is useful to examine the distribution of assets and hazards, it is also imperative that local knowledge is used to assess individuals components of the index and to recognise that the index does not portray the full picture with regards to healthy assets and hazards for the following reasons:

  • Many of the indicators are based on drive times with an inherent assumption that residents have access to a car or van. In a city with good transport networks and problems with parking, car ownership tends to be lower than more rural areas and car ownership is lower in more deprived areas of the city as well as areas closer to the city centre. From the 2021 Census, 35% of household had no cars or vans in the household compared to 23% for England. If people need to rely on public transport, cycling or walking then it is likely that travel times are longer. This is particularly the case if it is necessary to catch more than one bus and also there could be cost implications too. In many cases, from anecdotal evidence, people in Hull are less likely to travel to services if they need to catch more than one bus, and some of the more deprived areas of Hull do not have direct services into the city centre.
  • Drive times to the nearest dentist does not reflect any access, and it is likely that most dental surgeries are not accepting new NHS clients so access to dental services in Hull is difficult particularly for people living in deprived areas who are less able to pay for private dental services.
  • Drive times to the nearest blue space and the ‘greenness’ of the immediate area does not reflect quality of that space or accessibility. As Hull is on the Humber estuary and has the River Hull running through the city, most areas in Hull have low drive times to the nearest blue space, but the banks of the Humber estuary and River Hull are not necessarily places where most people would want to spend much leisure time. Green space is measured by satellites as the average Normalised Difference Vegetation Index as close to summer equinox as possible. The Normalised Difference Vegetation Index takes a value from zero (no vegetation or dead vegetation) to one (very healthy vegetation) and the measure of green space in the Access to Healthy Assets and Hazards index uses the average Normalised Difference Vegetation Index for an 80 metre radius around the postcode centroid for each postcode (the rational is that the average extent of a postcode in the UK is around 160 metres by 160 metres). Therefore, it is essentially measuring the ‘greenness’ of an area. This does not necessarily equate to assess and quality of that space. Other people’s gardens would be included in the green space measure. Furthermore, even if the green space is a public space, other factors may influence its use such as feelings of safety (and feelings of safety do differ by deprivation in Hull).
  • Drive times to other facilities such as those related to healthcare or leisure facilities do also not take into other factors related to access such as cost, quality or waiting times, etc.
  • The measure will not include informal networks in relation to illegal products such as tobacco or alcohol. The majority of alcohol is purchased in off-licences, shops and supermarkets which are not taken into account as the nearest pub, bar or nightclub is included in the index.
  • Access to fresh fruit and vegetables are very important in relation to having a healthy lifestyle and there are many areas in Hull where there is a lack of such access which include some of the more deprived areas such as Orchard Park.

Some of the indicators counter each other in that Hull’s tight boundaries mean that there is a relatively high concentration of health-related and ‘unhealthy’ retail facilities so these domains balance each other out. The same is true for blue and green space as areas of the city close to the River Hull have less green space. This is another reason why it is useful to examine the indicators and domains separately.

Health Domain

As mentioned above, drive times do not fully capture access to high quality healthcare as quality, waiting times, access and lack of a car or van is not taken into account. This will particularly be the case for access to dentistry due to the lack of NHS dentists and the potentially prohibitive cost of private dentistry in the most poorest areas of the city. Nevertheless, the maps will show areas of Hull that are more accessible in terms of drive times to the nearest dentists, GPs, hospital and pharmacy.

The following map illustrates the distance from the nearest dentist in terms of driving time. All residents live within a six minute drive of their nearest dental surgery, but this does not necessarily mean that they have access to dental care particularly NHS dental care.
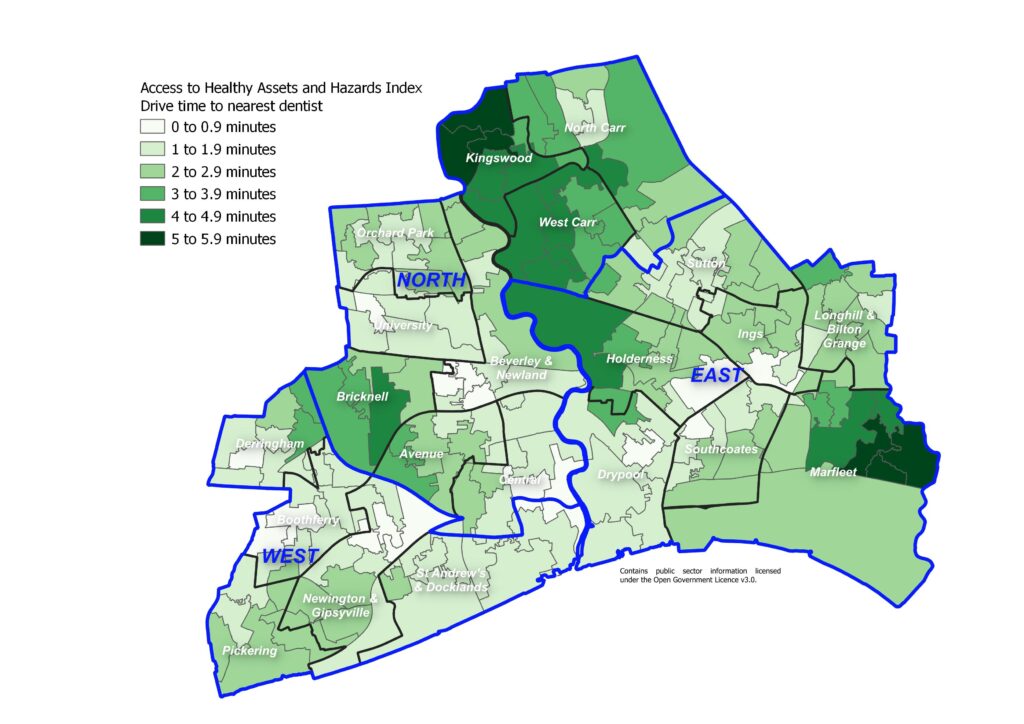
Access to Healthy Assets and Hazards Index: drive time to nearest dentist

The following map illustrates the distance from the nearest GP in terms of driving time. All residents live within a five minute drive of their nearest GP surgery
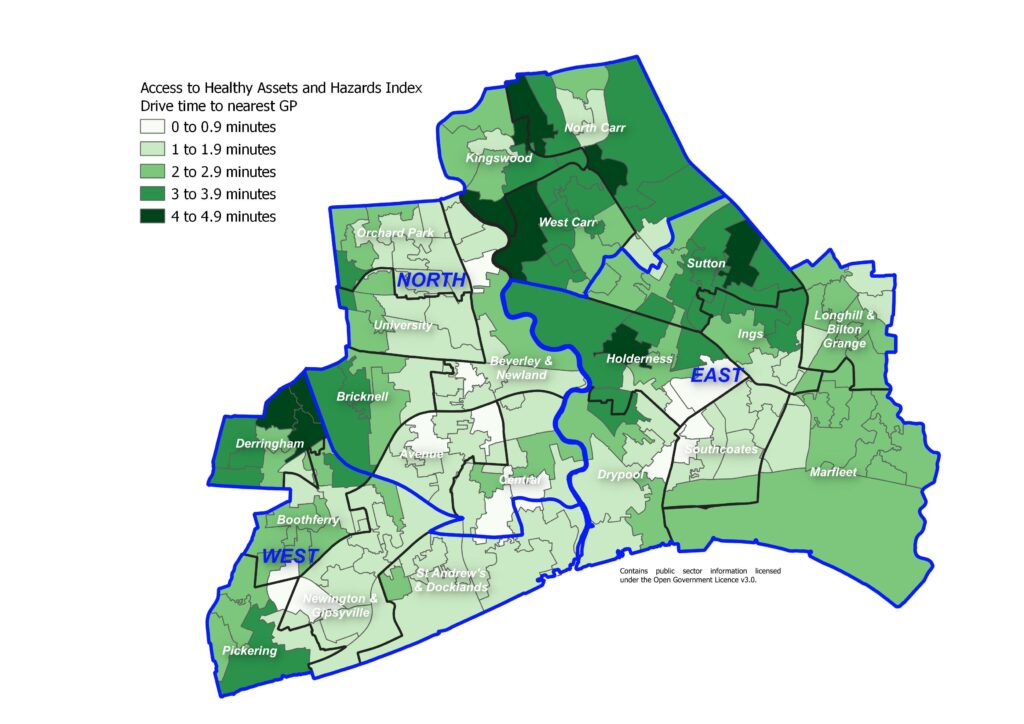
Access to Healthy Assets and Hazards Index: drive time to nearest GP

The following map illustrates the distance from the nearest hospital in terms of driving time. All residents live within a five minute drive of their nearest hospital.
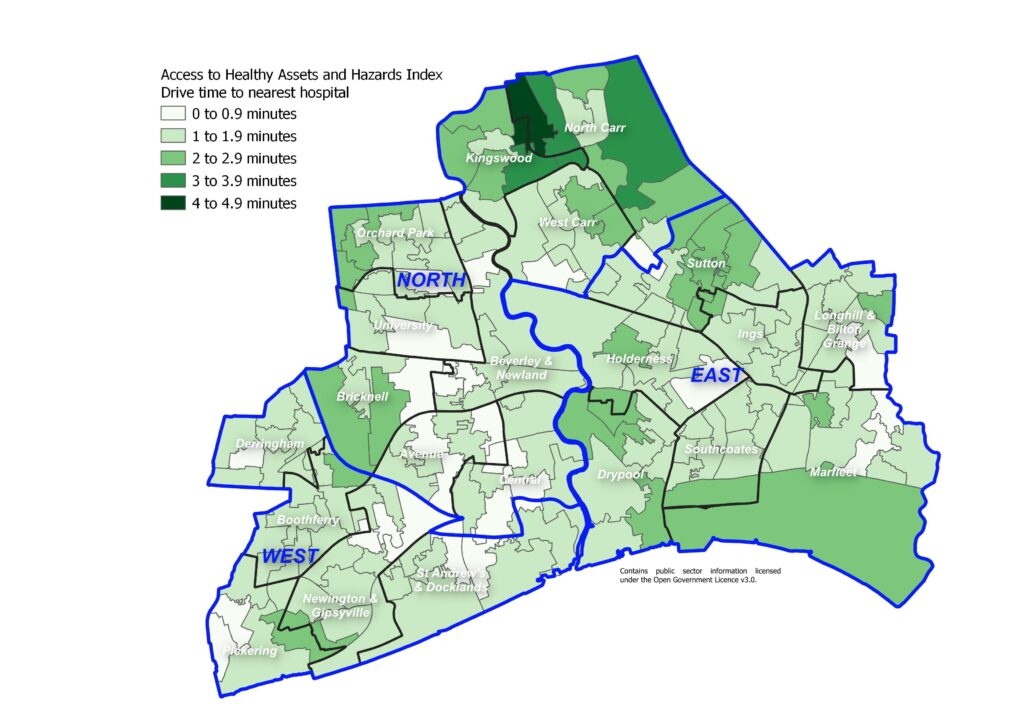
Access to Healthy Assets and Hazards Index: drive time to nearest hospital

The following map illustrates the distance from the nearest pharmacy in terms of driving time. All residents live within a five minute drive of their nearest pharmacy.
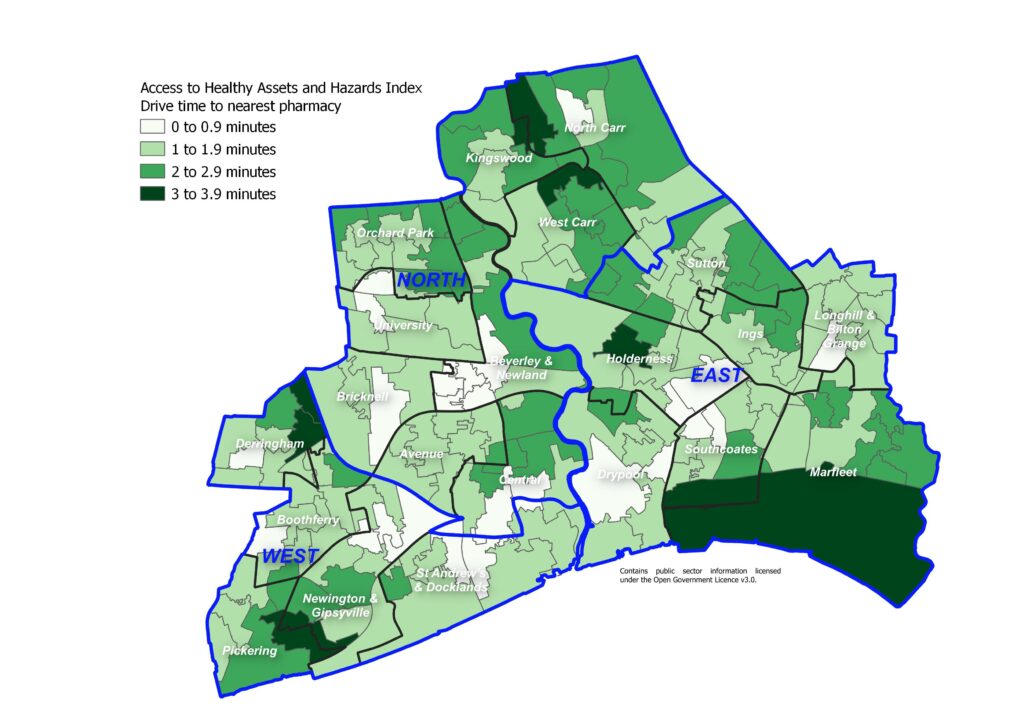
Access to Healthy Assets and Hazards Index: drive time to nearest pharmacy

With Hull being a compact city with low drive times to health facilities, the majority of areas of Hull perform well in relation to the other geographical areas across the country particularly areas of Hull around the city centre, up Beverley Road (on the boundary splitting Avenue and Central wards, and splitting University and Orchard Park wards from Beverley & Newland) along Holderness Road (on the boundary splitting Southcoates from Holderness), along Anlaby Road where the hospital lies (splitting the southern boundary of Central from St Andrew’s & Docklands), along Cottingham Road (splitting University and Bricknell wards) and Spring Bank West (which runs from Central through parts of Avenue towards Boothferry). Areas to the north and east of the city such as Kingswood, North Carr, West Carr, Holderness, Sutton and Marfleet tend to have higher drive times to health facilities compared to other areas of Hull. The percentile scores range from 2 to 83 so none of Hull’s 168 lower layer super output areas are the the worst 10% nationally in terms of drive times to health facilities.
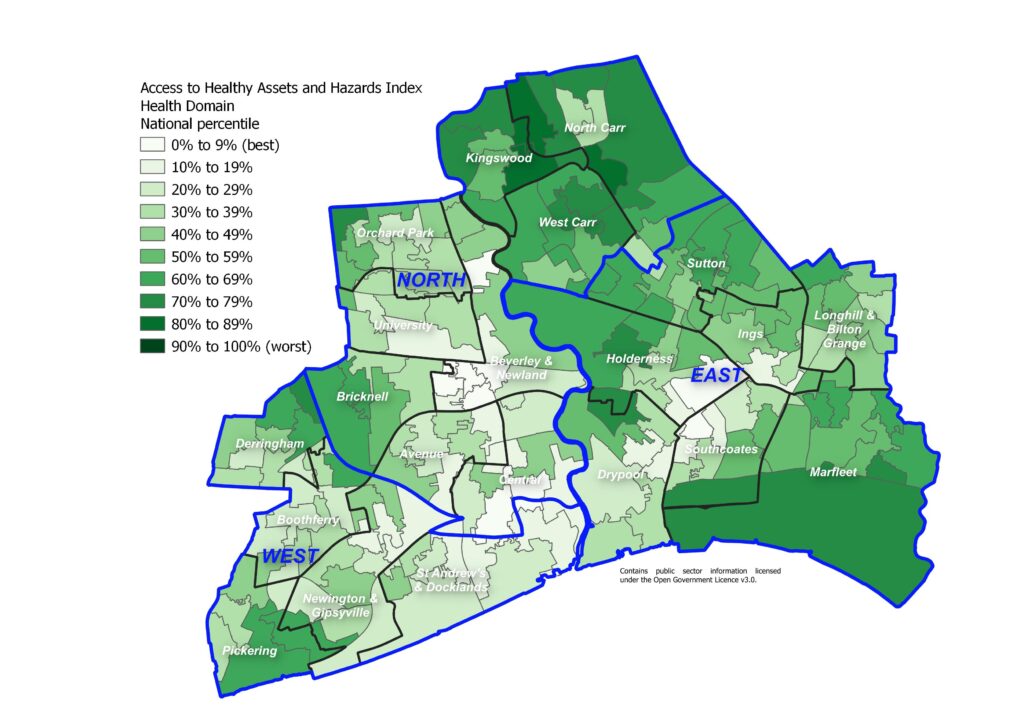
Access to Healthy Assets and Hazards Index - health domain: national percentiles
Access to Healthy Assets and Hazards Index – health domain: national percentiles
Retail Environment

The following map illustrates the distance from the nearest fast food outlet in terms of driving time. It can be seen that the majority of Hull residents live in an area where it is only a couple of minutes drive from the nearest fast food outlet, and all areas of Hull are within a five minute drive of fast food.
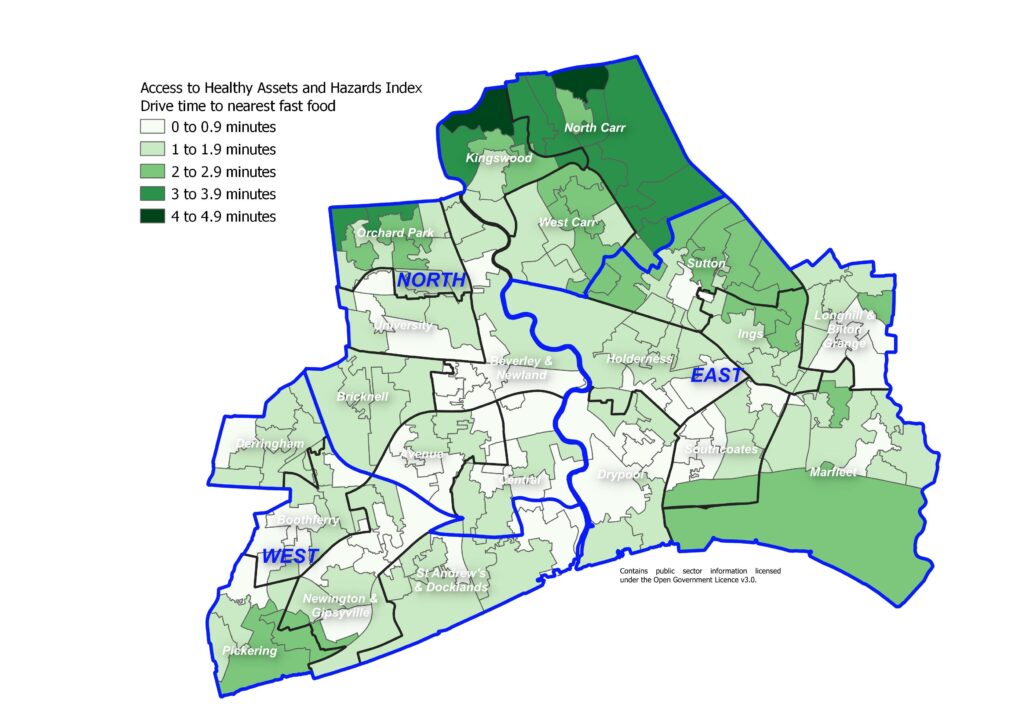
Access to Healthy Assets and Hazards Index: drive time to nearest fast food outlet

Information relating to the density of fast food outlets can also be found under Diet and Nutrition Among Adults under Lifestyle Factors under Adults.

The following map illustrates the distance from the nearest pub, bar or nightclub in terms of driving time. The majority of residents of Hull live within a five minute drive of the nearest pub, bar or nightclub with only some areas to the north of the city in Kingswood and North Carr having a slightly longer drive time, although all residents live within an eight minute drive of the nearest pub, bar or nightclub.
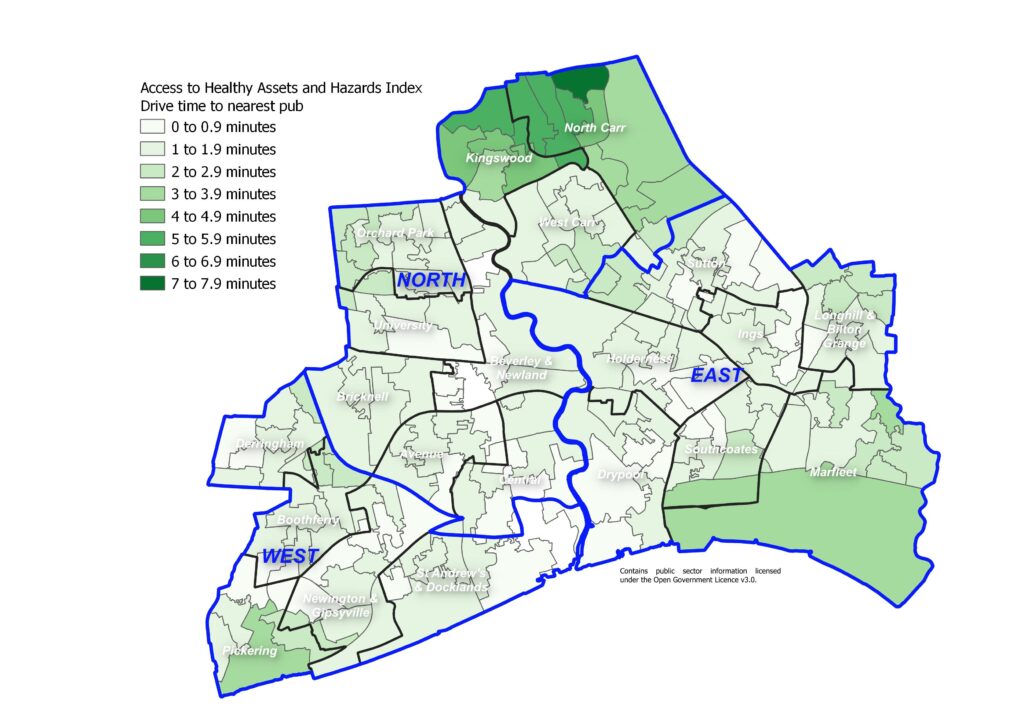
Access to Healthy Assets and Hazards Index: drive time to nearest pub

The following map illustrates the distance from the nearest gambling outlet in terms of driving time. The majority of residents of Hull live within a five minute drive of the nearest gambling outlet with only some areas to the north of the city in Kingswood and North Carr having a slightly longer drive time, although all residents live within an eight minute drive of the nearest gambling outlet.
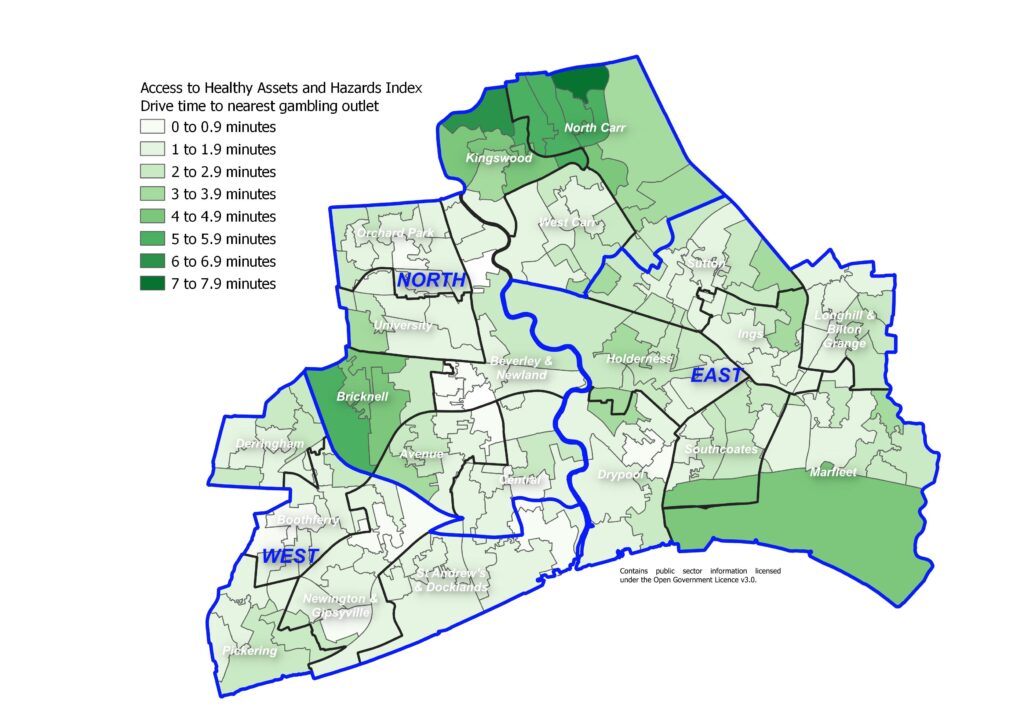
Access to Healthy Assets and Hazards Index: drive time to nearest gambling outlet

The following map illustrates the distance from the nearest tobacconist or vape store in terms of driving time. As with pubs, bars and nightclubs and with gambling outlets, the majority of residents of Hull live within a short minute drive of the nearest tobacconist or vape store with only some areas to the north of the city in Kingswood and North Carr having a slightly longer drive time, although all residents live within an an 11 minute drive of the nearest tobacconist or vape store.
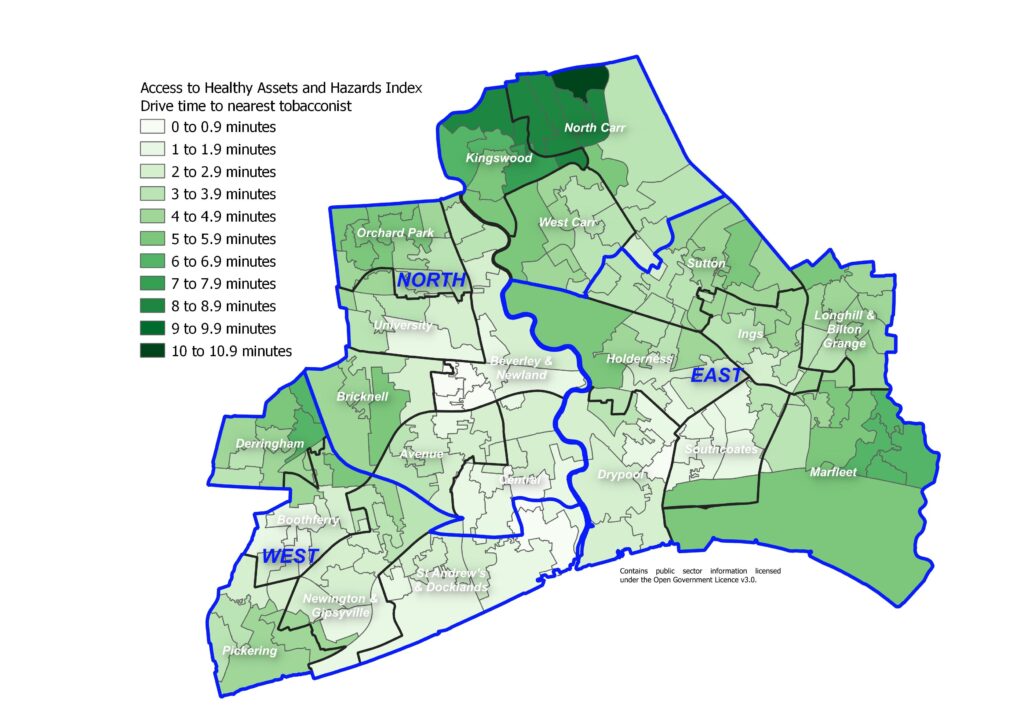
Access to Healthy Assets and Hazards Index: drive time to nearest tobacconist

The following map illustrates the distance from the nearest leisure centre in terms of driving time. The majority of residents living around the city centre, to the south west of the city, and around the University are only a few minutes drive from the nearest leisure centre. Residents living on the north, north west and east boundaries of Hull have a slightly longer drive time, although all residents are within a nine minute drive of the nearest leisure centre.
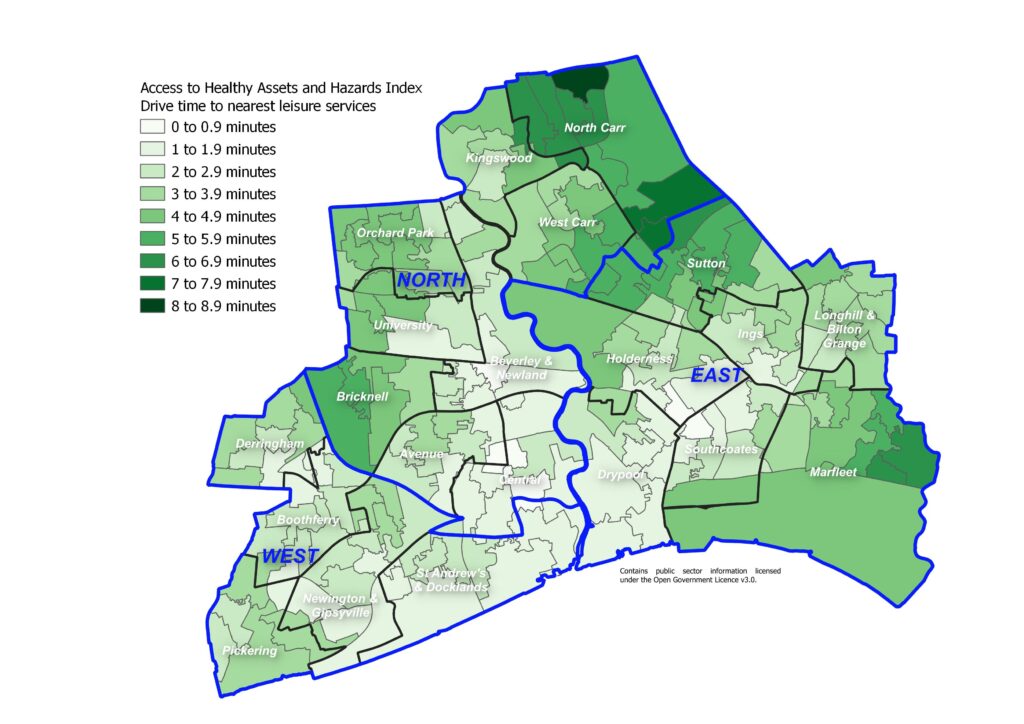
Access to Healthy Assets and Hazards Index: drive time to nearest leisure services

With Hull being a compact city with low drive times to retail facilities, the majority of areas of Hull perform poorly in relation to the other geographical areas across the country with relatively low drive times to fast food outlets, pubs, tobacconists and gambling outlets). The worst areas in Hull tend to be similar areas to those which performed well on the health domain as they are areas close to main roads with a relatively high number of retail and health units. These areas include areas around the city centre, up Beverley Road, along Holderness Road, along Anlaby Road (all the way along from Central ward to Hull’s boundary in Boothferry, along Hessle Road (in St Andrew’s & Docklands and Newington & Gipsyville wards), along Cottingham Road and along part of Sutton Road (within Beverley & Newland ward linking West Carr and Orchard Park wards). Areas to the north and east of the city such as Kingswood, North Carr, West Carr, Holderness, Sutton and Marfleet tend to have higher drive times to health facilities compared to other areas of Hull. The percentile scores range from 13 to 100 so none of Hull’s 168 lower layer super output areas are the the best 10% nationally in terms of drive times to retail facilities. Seven in ten of Hull’s lower layer super output areas are in the worst 50% of areas of England in terms of short distances from fast food outlets, pubs, tobacconists and gambling outlets. Areas in Kingswood and North Carr in particular are among the best areas in terms of the retail domain.
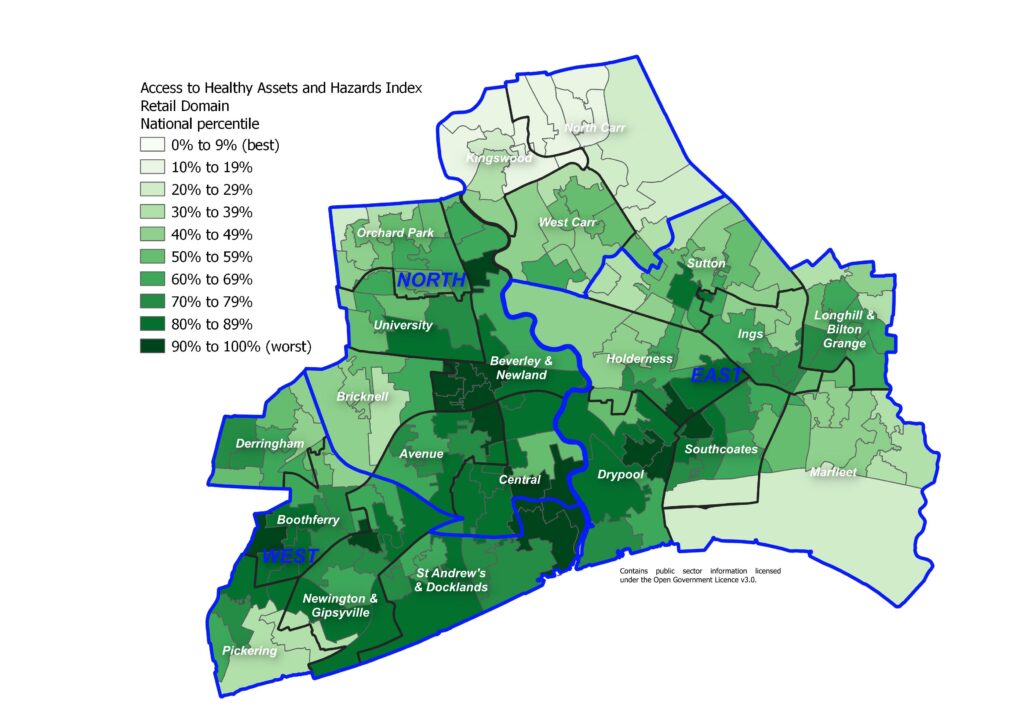
Access to Healthy Assets and Hazards Index - retail domain: national percentiles
Access to Healthy Assets and Hazards Index – retail domain: national percentiles
Access to Blue and Green Space

As mentioned above, drive times do not fully capture access to good quality, safe blue and green space where residents want to spend their time for health-related reasons.

The following map illustrates the distance from nearest blue space in terms of driving time.
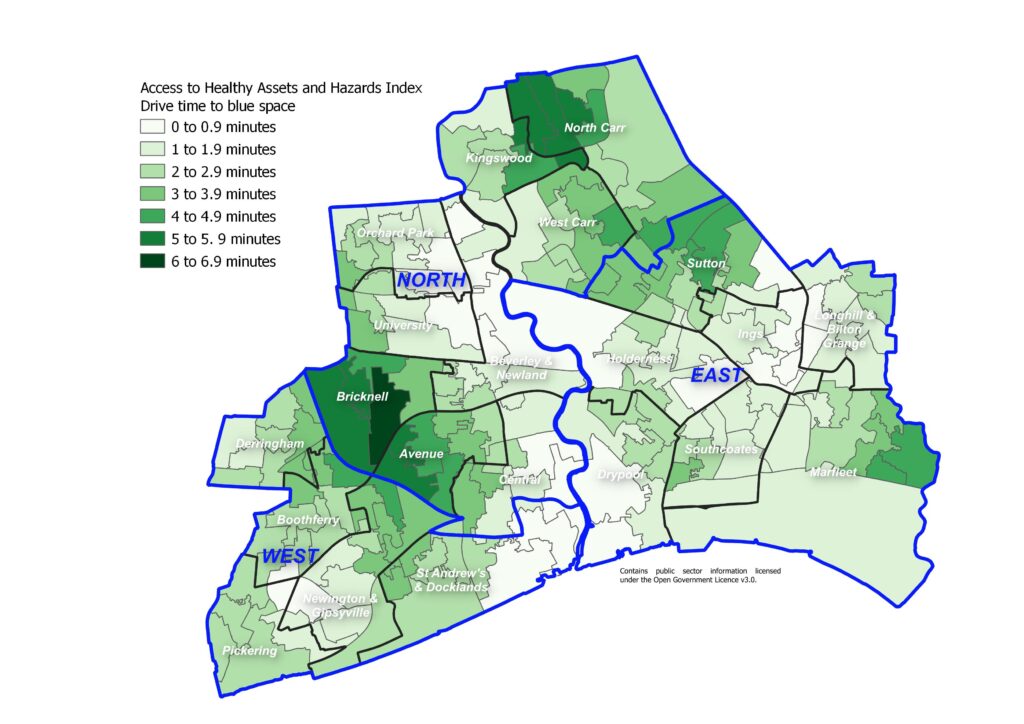
Access to Healthy Assets and Hazards Index: drive time to nearest blue space

As mentioned above, green space is measured by satellites as the average Normalised Difference Vegetation Index as close to summer equinox as possible. The Normalised Difference Vegetation Index takes a value from zero (no vegetation or dead vegetation) to one (very healthy vegetation) and the measure of green space in the Access to Healthy Assets and Hazards index uses the average Normalised Difference Vegetation Index for an 80 metre radius around the postcode centroid for each postcode (the rational is that the average extent of a postcode in the UK is around 160 metres by 160 metres). Therefore, it is essentially measuring the ‘greenness’ of an area. This does not necessarily equate to assess and quality of that space. Other people’s gardens would be included in the green space measure. Furthermore, even if the green space is a public space, other factors may influence its use such as feelings of safety (and feelings of safety do differ by deprivation in Hull).

It can be seen that there is less green space in the more industrial areas of the city (an inverted T-shape along the south boundary following the A63 and from south to north following the route of the River Hull up the middle of the city).
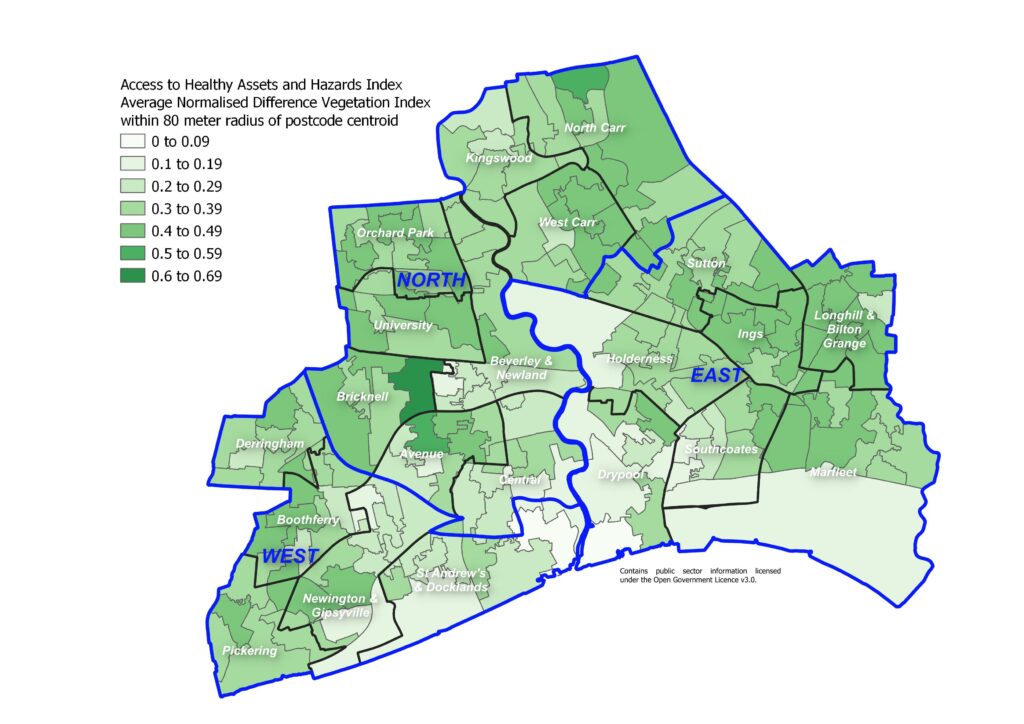
Access to Healthy Assets and Hazards Index: average Normalised Difference Vegetation Index (level of 'greenness') within an 80 metre radius around the postcode centroid (combined into average for each lower layer super output area)
Access to Healthy Assets and Hazards Index: average Normalised Difference Vegetation Index (level of ‘greenness’) within an 80 metre radius around the postcode centroid (combined into average for each lower layer super output area)

Given that drive times to the nearest blue and green space in Hull is relatively low, it is perhaps a surprise that Hull has such a range of areas from best to worst in terms of drive time to blue space and green space nearby with the percentile scores ranging from 3 to 99 in Hull. However, to an extent the blue and greens spaces counterbalance each other. The more industrial areas of Hull generally tend to be close to blue space, but tend to have the lowest scores for ‘greenness’. So this might be a factor in explaining the range in Hull.

Areas around the west from Bricknell in the north to St Andrew’s & Docklands and Newington & Gipsyville in the south, areas near Drypool and Southcoates, and areas near Kingswood and North Carr tend to be the worst areas in Hull in terms of access to blue and green space.
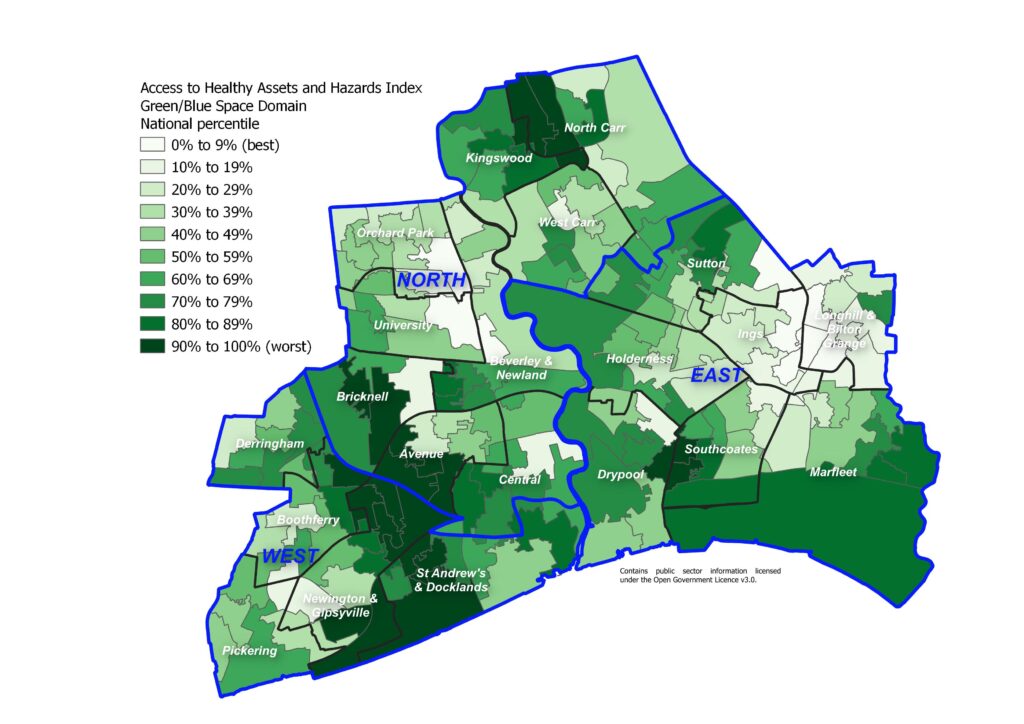
Access to Healthy Assets and Hazards Index - green/blue space domain: national percentiles
Access to Healthy Assets and Hazards Index – green/blue space domain: national percentiles
Air Pollution

The following map illustrates the average annual levels of nitrogen dioxide. Levels of air pollution tend to be higher along main arterial travel routes and in areas with higher levels of industry and this is the case for Hull. Furthermore, as the prevailing wind in the UK is predominantly from the south-west, this generally means that air pollution levels tend to be higher in easterly areas.
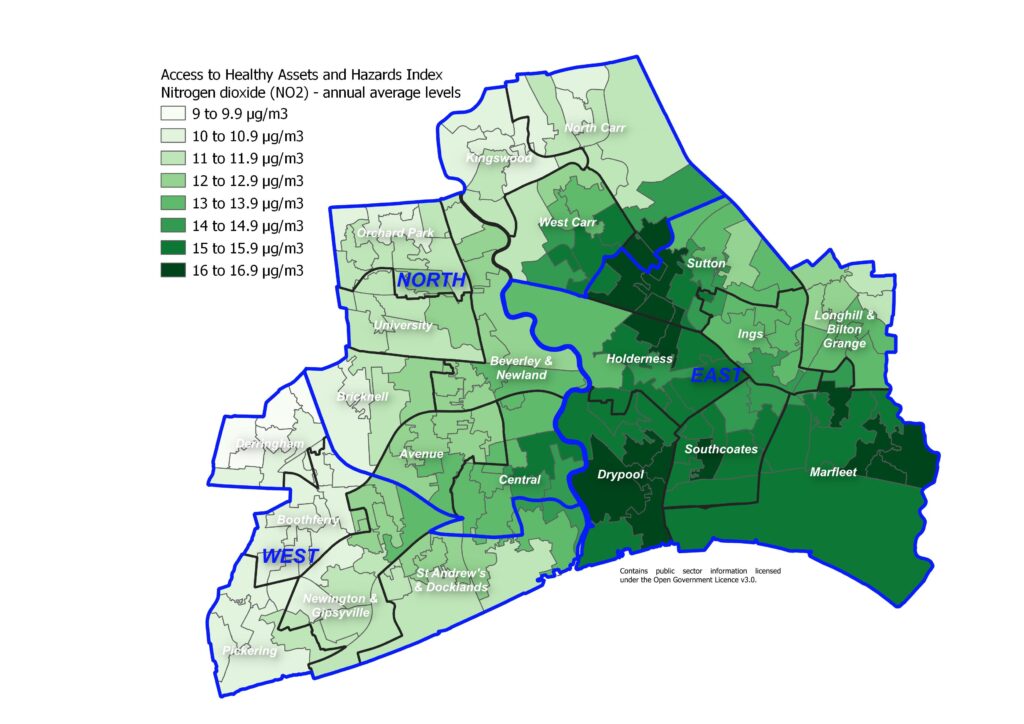
Access to Healthy Assets and Hazards Index: annual average levels of air pollution - nitrogen dioxide (NO2)
Access to Healthy Assets and Hazards Index: annual average levels of air pollution – nitrogen dioxide (NO2)

The following map illustrates the average annual levels of sulphur dioxide. There appears to be two pockets of areas with relatively high levels of sulphur dioxide in Hull and areas further away from these two areas tending to have the lowest levels compared to the Hull average.
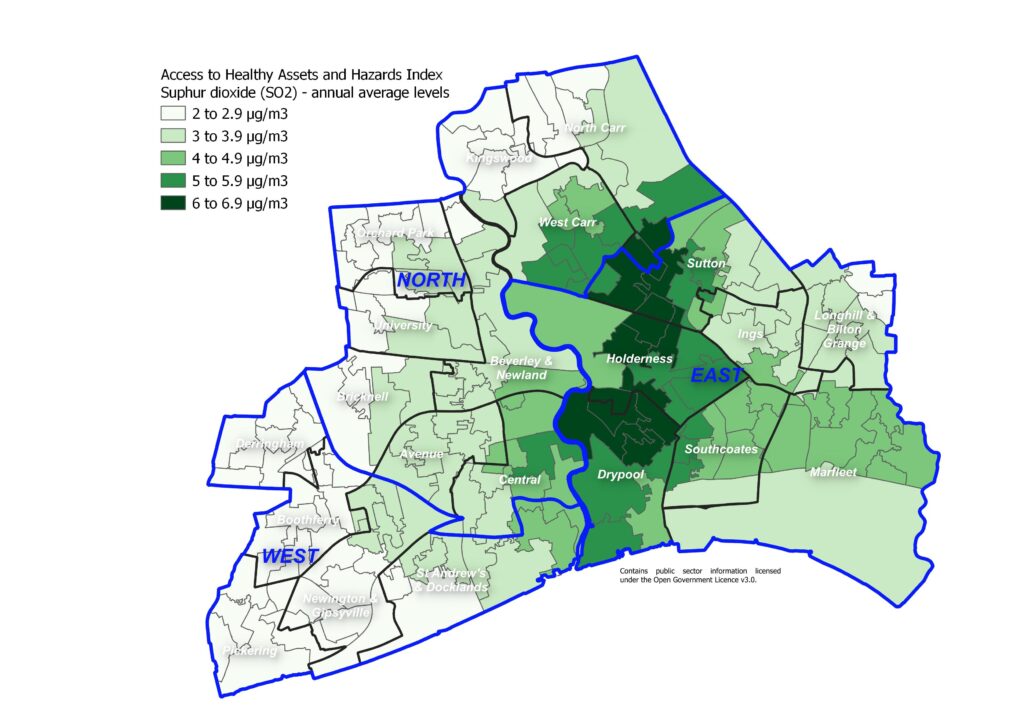
Access to Healthy Assets and Hazards Index: annual average levels of air pollution - sulphur dioxide (SO2)
Access to Healthy Assets and Hazards Index: annual average levels of air pollution – sulphur dioxide (SO2)

The following map illustrates the average annual levels of particulate matter with size less than 10 microns.
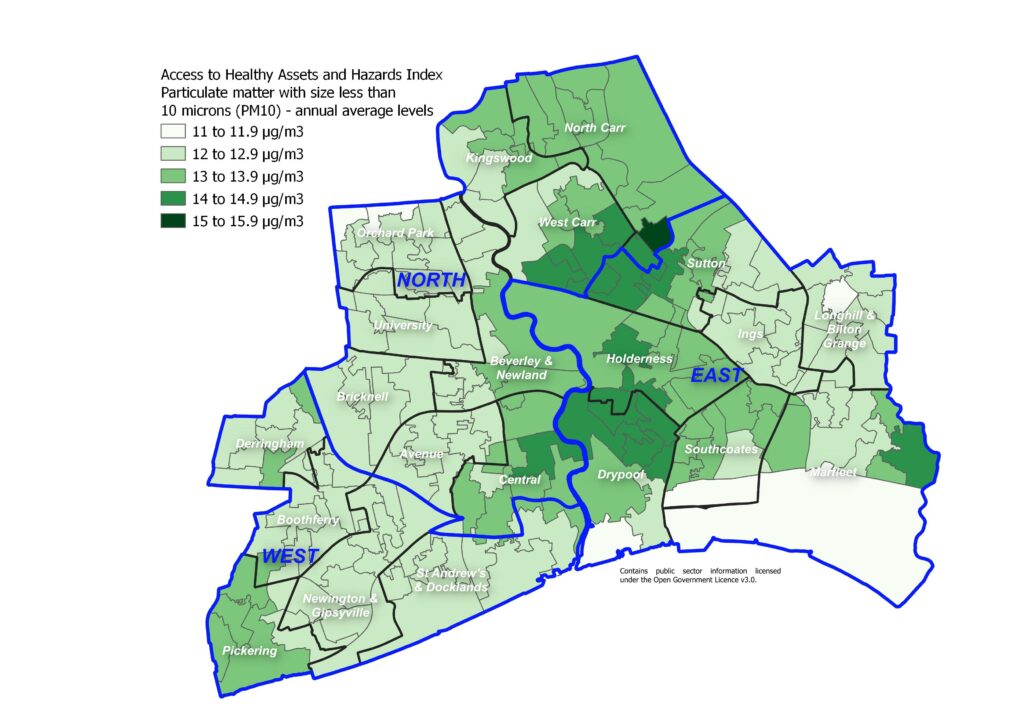
Access to Healthy Assets and Hazards Index: annual average levels of air pollution - particulate matter less than 10 microns in size
Access to Healthy Assets and Hazards Index: annual average levels of air pollution – particulate matter less than 10 microns in size

The levels of air pollution in terms of average annual levels of nitrogen dioxide, sulphur dioxide and particulate matter with size less than 10 microns are high relative to other areas of England. This is not particularly surprising as most cities with relatively high density of roads and industry compared to rural areas will tend to have relatively high levels of air pollution. Not surprisingly, the areas with the highest levels of pollution are those with the higher levels of industry and in the east where the prevailing wind will tend to increase levels of air pollution.

The percentile scores range from 68 to 100 so none of Hull’s 168 lower layer super output areas are the the best 60% nationally in terms of air pollution levels. Four in ten of Hull’s lower layer super output areas are in the worst 10% of areas of England in terms air pollution levels, and almost seven in ten of the areas are in the worst 20% nationally. All but two of Hull’s 168 lower layer super output areas are in the worst 30% of areas nationally in terms of air pollution.
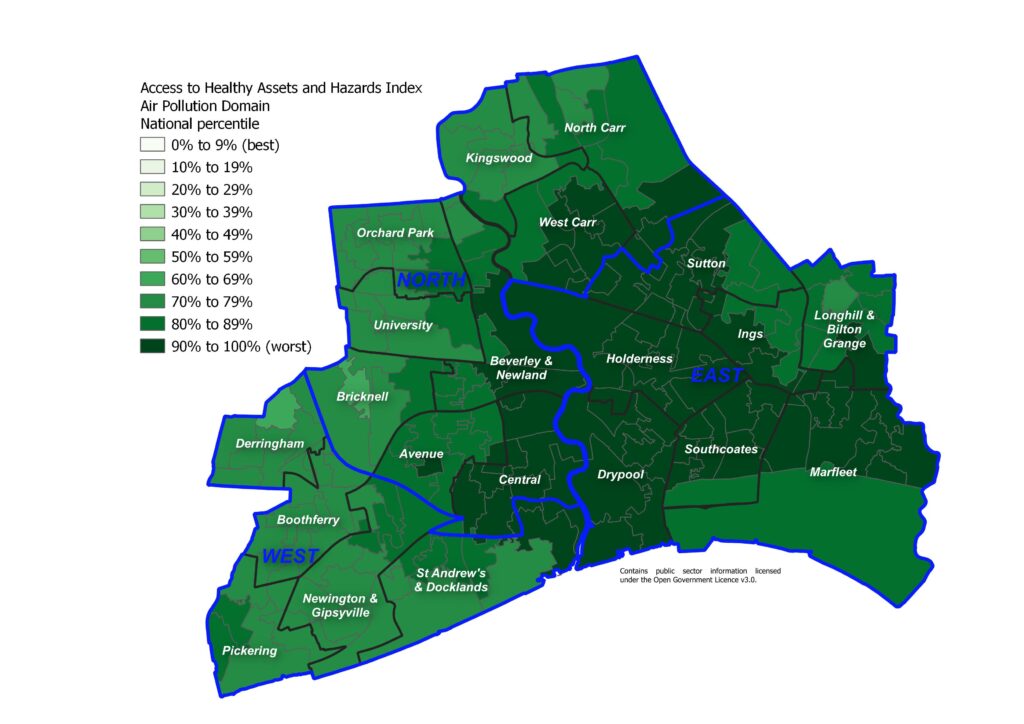
Access to Healthy Assets and Hazards Index - air pollution domain: national percentiles
Access to Healthy Assets and Hazards Index – air pollution domain: national percentiles

Further information on the environmental factors of Air Pollution and Climate Change can be found within Health and Wellbeing Influences.

Strategic Need and Service Provision

Most of the above factors in terms of physical and organisational boundaries are fixed and not amenable to change. However in the absence of altered local authority boundaries, they reinforce the need for close and collaborative working with local geographic partners, particularly in the East Riding of Yorkshire, and areas included within the the Humber and North Yorkshire Health and Care Partnership. The upside of Hull’s tight boundaries is that access to central services in Hull City Centre is relatively good for the majority of the public, with good transport links radiating to and from the City Centre. Links such as bus routes are often less good between communities “around the edge” of Hull, which may be physically near to one another but not have easy access.

The aim of the Humber and North Yorkshire Health and Care Partnership is to work together to help everyone have the best start in life, live well and grow older well. Making sure that every child has the best start in life, making sure that everyone can access the right care and support when their health changes, supporting people to be independent and in control as they get older, and making sure that people can talk about what they want to happen when when they die. Their priorities are as follows:

  • Helping people to look after themselves and stay well;
  • Making sure services are joined across health and care;
  • Making sure we have the right care in certain areas; and
  • Making sure we are using our resources well.

The Humber and North Yorkshire Health and Care Partnership’s approach may be different across the different geographical areas depending on the characteristics within each area.

There has been significant recent investment in Hull revealed within Hull’s City Plan both before, during and after the City of Culture year of 2017.

The ambitions of the Hull’s City Plan are to make Hull the leading hub for renewable energy industries (UK Energy City), make Hull a world-class visitor destination (Destination Hull) by capitalising on Hull’s role as UK City of Culture 2017, the multi-million pound investment into the city’s cultural and tourism infrastructure, and making Hull a place of opportunity for all, building strong and resilient communities by focusing on safeguarding the most vulnerable, prevention and early intervention, and making money go further (Community and Opportunity). Significant progress has already been made in these areas, and it is necessary to ensure that this momentum is built upon and developed within the wider context of the need to de-carbonise the economy to reduce the impact of climate change and ensure effective resilience to climate change.

Since January 2013, Hull City Council has held the highest Green Accreditation for its environmental management system, Investors in the Environment and undertaken work to reduce its carbon emissions in line with its corporate targets. It has also undertaken climate adaptation risk assessment for Housing, Museums and Gallery, Waste Management, and Parks and Transport services.

It is necessary to work together to maintain and expand an environment that promotes physical activity and active lifestyle opportunities in everyday settings for all ages.  There is also a need to work with partners to ensure the design of the built environment discourages crime and fear of crime.

We need to increase access to traditional environmental spaces including parks, nature areas, gardens, cycle paths, recreational paths and water courses to improve physical and mental well-being and ensure that these are maintained in a sustainable way.

There should be support for sustainable and seasonal approaches to food use within the City to support healthy eating within health and care environments through the Green Kitchen Standard and support residents in cooking and eating healthily.

In terms of improving the environment for the people of Hull, it is important that any measures in the proposed climate change strategy and proposed action plan consider the implications on and as far as possible complement those in the Air Quality Strategy, as some could have a detrimental impact on air quality. For example, monitoring during the COVID-19 lockdown indicates that as direct emissions from vehicles decrease (mono nitrogen oxide and nitrogen dioxide combined) it has the potential to result in an increase in the concentrations of other potentially harmful gases, such as ozone, and only a minimal reduction in the emissions of particulate matter. This has implications and will need to be considered when advocating a change to electric vehicles.

Resources

Ward and Area Committee Area Profiles

Humber and North Yorkshire Health and Care Partnership. https://humberandnorthyorkshire.org.uk/

Public Health England (now Office for Health Improvement & Disparities). Spatial Planning for Health: An evidence resource for planning and designing healthier places, 2017.
https://assets.publishing.service.gov.uk/media/5b59b090e5274a3ff828c70c/spatial_planning_for_health.pdf

Updates

This page was last updated / checked on 3 March 2026.

This page is due to be updated / checked in October 2026.
Mental Health and Emotional Wellbeing Among Children and Young People

This topic area covers statistics and information relating to mental health and emotional wellbeing among children and young people in Hull including local strategic need and service provision. Further information relating to Mental Health and Emotional Wellbeing Among Adults is given under Health Factors within Adults. Further information on Learning Disabilities, Mental Ill Health and Children with Special Educational Needs or Disabilities is provided under Vulnerable Groups. Information relating to hospital admissions for self-harm, alcohol and substance use can be found within A&E Attendances and Hospital Admissions under Health Factors under Children and Young People. More information on mental health and emotional wellbeing and early intervention is also available under Early Help and Prevention Programme under Child Development within Children and Young People.

Emotional wellbeing, bullying, frequency of worrying about different things, and feelings of safety have all been collected within Hull’s Young People Health and Wellbeing Surveys. This page contains information collected in the latest 2024 Young People Health and Wellbeing Survey.

This page contains information from the Office for Health Improvement & Disparities’ Fingertips. Information is taken ‘live’ from the site so uses the latest available data from Fingertips and displays it on this page. As a result, some comments on this page may relate to an earlier period of time until this page is next updated (see review dates at the end of this page).

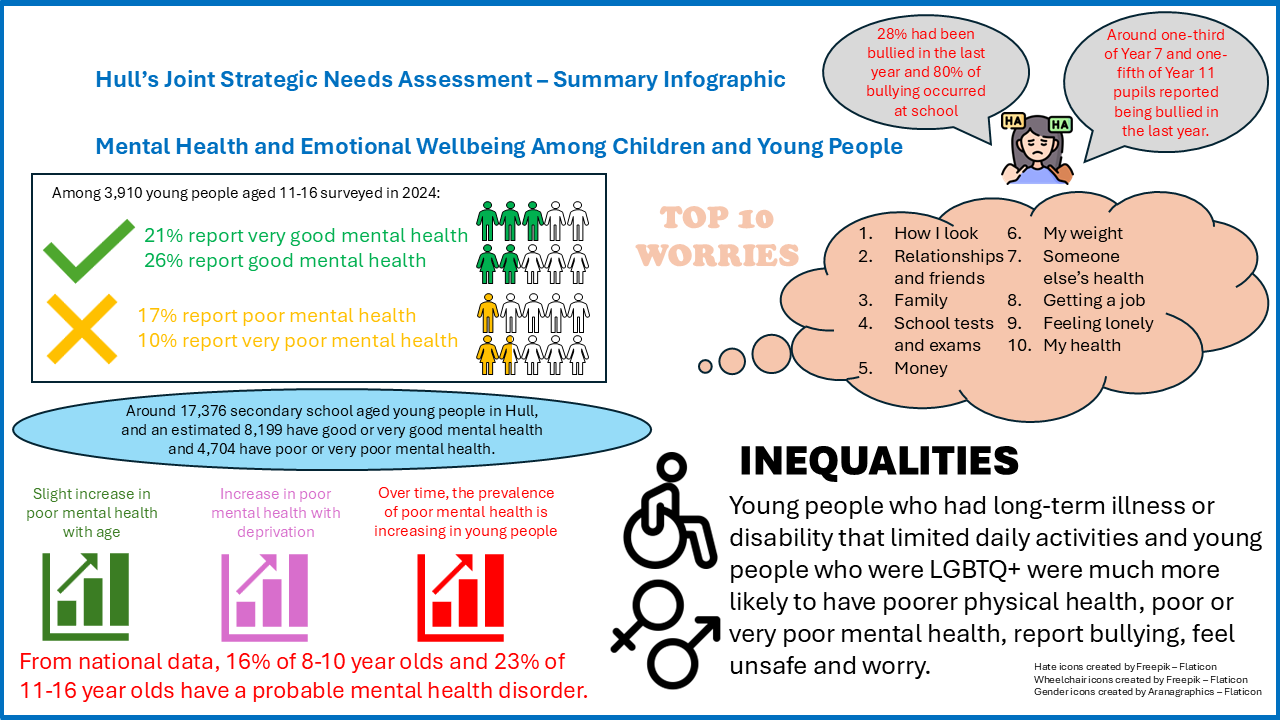
Summary Infographic

Mental Health and Emotional Wellbeing Among Children and Young People - Summary Infographic, April 2026
Mental Health and Emotional Wellbeing Among Children and Young People – Summary Infographic, April 2026

Headlines

  • Health Needs Assessments have been completed in Hull for emotional wellbeing and mental health among young people in 2023, and among pre-school children in 2022.
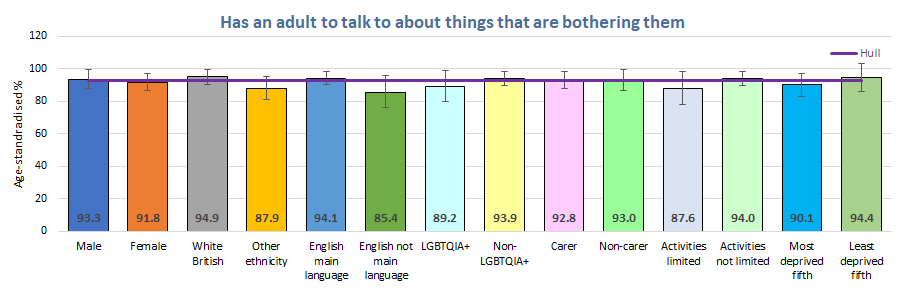
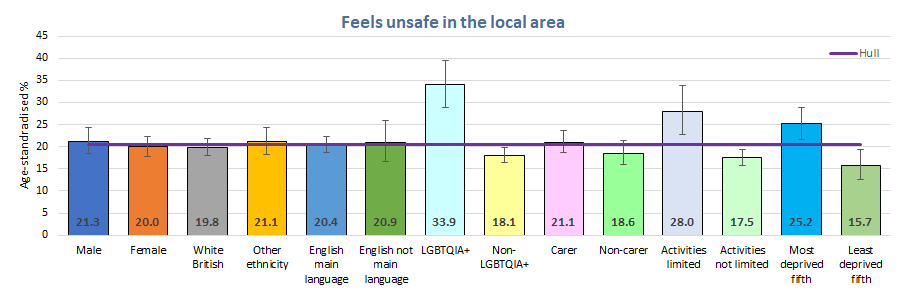
  • From the local Young People Health and Lifestyle Survey 2024 which involved almost 4,000 pupils attending eight of Hull’s 13 main-stream secondary schools, 47% reported good or very good mental health, but 27% reported poor or very poor mental health. Just over one-quarter (28%) had been bullied in the last year and almost all children (93%) had an adult to talk to if things were bothering them. Three-quarters of young people felt safe in their local area.
  • At the time of the survey, it was estimated that 17,376 secondary school age young people lived in Hull, and this would equate to around 8,199 young people with good or very good mental health, 4,704 with poor or very poor mental health and 4,792 having been bullied in the last year.
  • There were relatively small differences in the percentage who had good or very good mental health across the school years, but marked differences between males and females. Overall, 59% of males reported good or very good mental health compared to 38% of females. Young people who were LGBTQ+ and young people whose daily activities were limited by long-term illness or disability had much lower percentages reporting good or very good mental health (28% and 38% respectively).
  • Around one in five males in school years 7 (aged 11-12 years) to 10 (aged 14-15 years) reported poor or very poor mental health, but this was higher at 29% among males in Year 11 although there is uncertainty around the findings among males in Year 11 as the numbers surveyed are relatively low. Females had much higher levels of poor or very poor mental health at 27% among those in Year 7 increasing to 35% among those in Year 10 before falling slightly to 33% in Year 11. Levels of poor or very poor mental health were much higher among young people who were LGBTQ+ (45%) and young people whose daily activities were limited by long-term illness or disability (44%).
  • Young people worried most about how they looked with 27% worrying about this a lot and 17% worrying about this quite a lot. They also worried most frequently about family (43%), relationships and friends (42%), school tests and exams (39%), money (35%), their weight (33%) and someone else’s health (30%). Younger pupils were more likely to worry about most of the life factors that they were asked about with the exception of money, school tests and exams, and getting a job. Females were also more likely to worry about things compared to males. Four in ten young people living in the most deprived fifth of areas of Hull worried a lot or quite a lot about money compared to just over one-quarter (26%) of young people living in the least deprived fifth of areas of Hull.
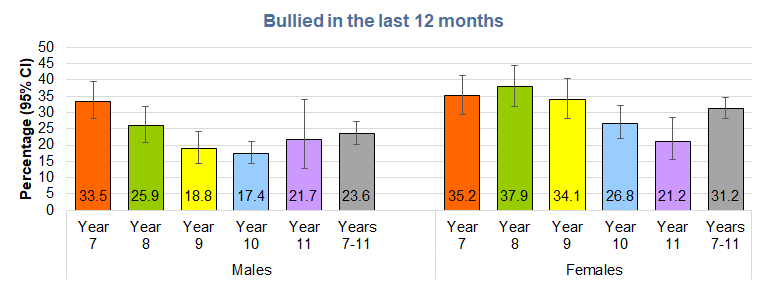
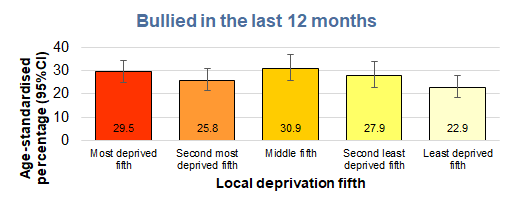
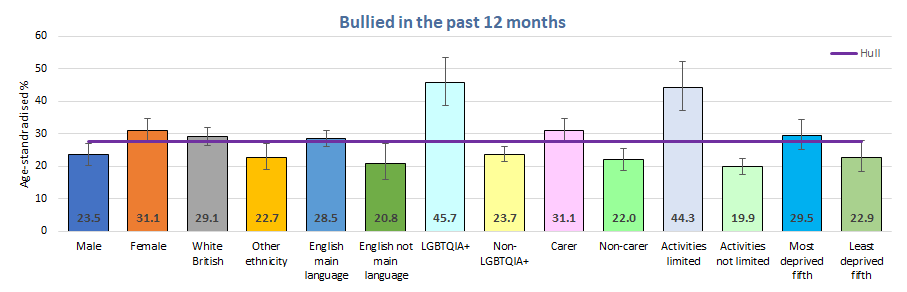
  • Females were more likely to state they had been bullied in the last year compared to males (31% versus 24%), and Year 7 pupils were more likely to have experienced bullying compared to Year 11 pupils for both males (34% of Year 7 males, 17% for Year 10 males and 22% for Year 11 males) and females (35% of Year 7 females, 38% of Year 8 females and 21% of Year 11 females).
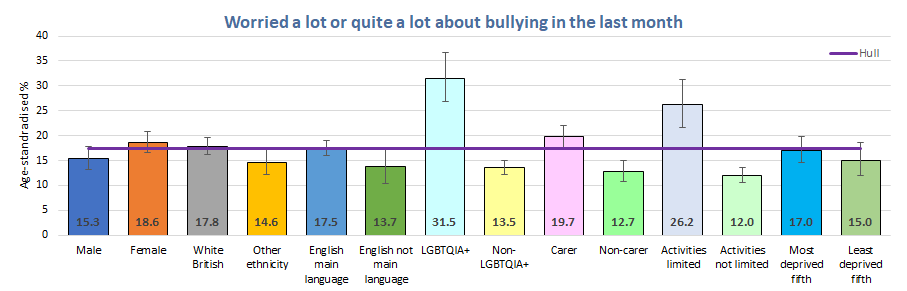
  • Young people who were LGBTQ+ (46%) and young people whose daily activities were limited by long-term illness or disability (44%) were much more likely to have been bullied in the last year. As a consequence, young people who were LGBTQ+ (32%) and young people whose daily activities were limited by long-term illness or disability (26%) were much more likely to worry a lot or quite a lot about bullying compared to 17% overall.
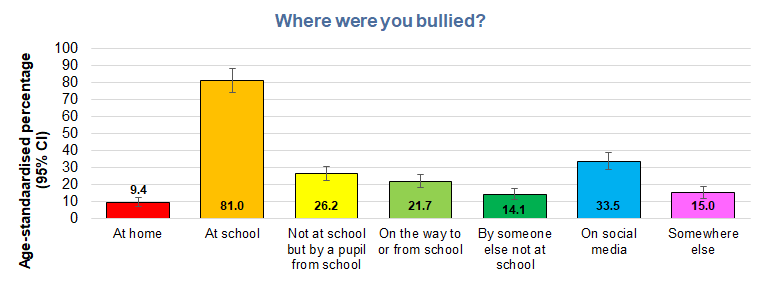
  • Eight in ten of those who had been bullied in the last year stated that it had occurred at school (81%) with 26% occurring not at school but by a pupil from school, 22% on the way to or from school, and 14% by someone else not at school. One-third had been bullied on social media, 9% had been bullied at home, and 15% reported being bullied somewhere else. Over three-quarters of bullying was name-calling and teasing, 60% was having lies or rumours spread about them, and 56% were bullied in relation to their appearance.
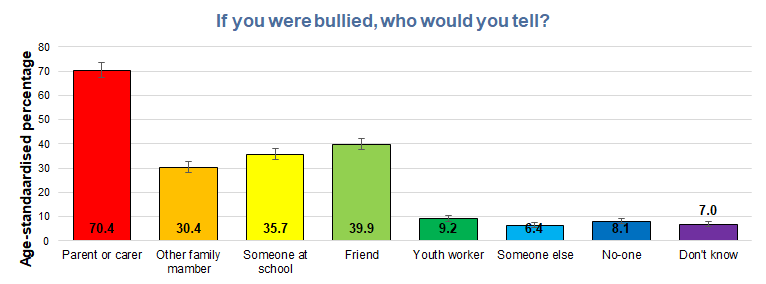
  • Seven in ten would tell a parent or carer if they were bullied, 40% would tell a friend, 36% would tell someone at school and 30% would tell another family member. Overall, 8% stated they would tell no-one, and 7% stated they didn’t know if they would tell anyone.
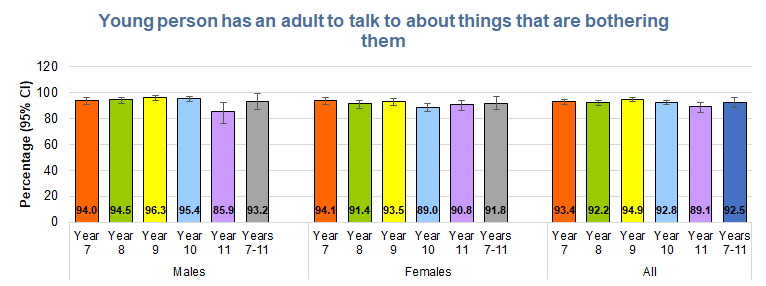
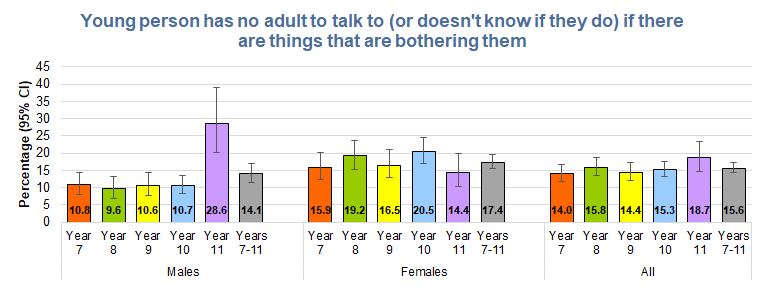
  • Over nine in ten of young people had someone to talk to if things were bothering them, although if the young people who stated they didn’t know were included then around 10% of males in Years 7 to 10 stated they had no-one to talk to or didn’t know increasing to 29% for Year 11 males. For females, the percentages varied between 16% and 21% between the school years and was 17% overall. Whilst the percentage is high for Year 11 males, there is uncertainty around the estimate given the relatively small number of Year 11 males that participated in the local survey.
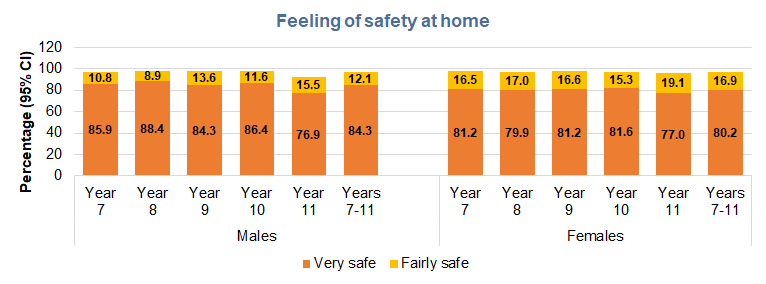
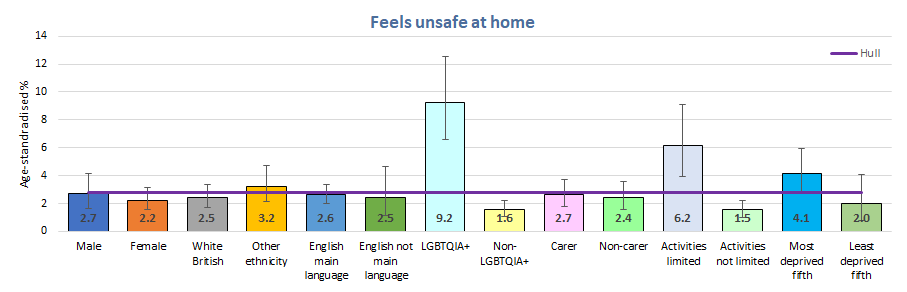
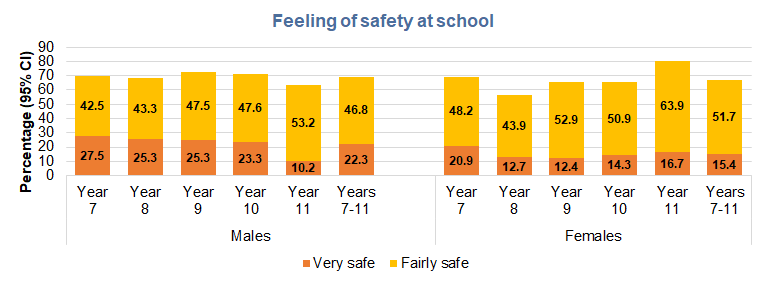
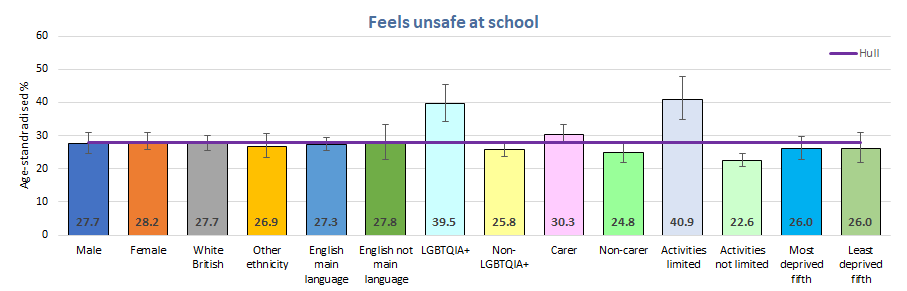
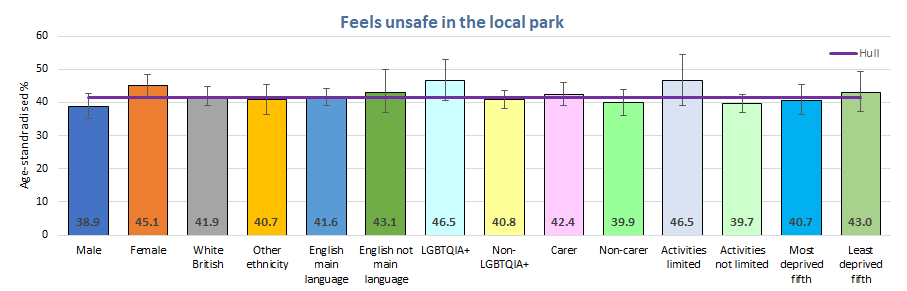
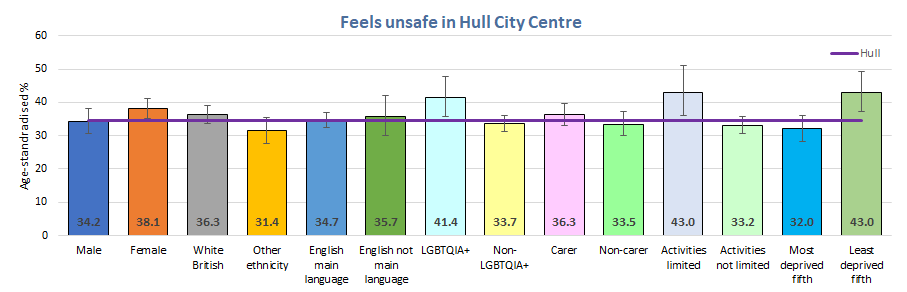
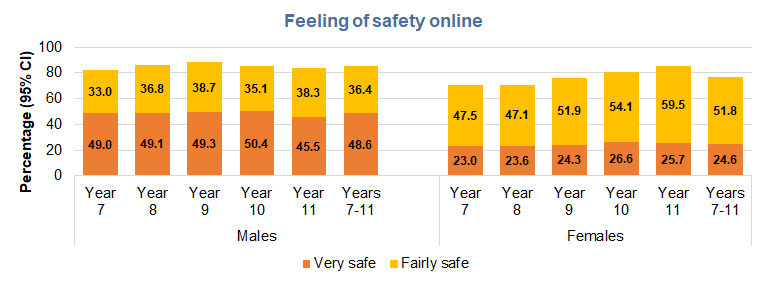
  • Over 95% of young people surveyed in the local Health and Wellbeing Survey in 2024 felt safe at home. Overall, 2.7% of males and 2.2% of females felt very unsafe or a bit unsafe at home, but this was considerably higher among young people who were LGBTQ+ (9%), and young people whose daily activities were limited by long-term illness or disability (6%). Around three-quarters of young people felt safe in their local area, over two-thirds felt safe at school, almost six in ten males and around half of females felt safe in the local park and in Hull city centre, and over three-quarters of males and females felt safe online although the percentages increased with age with females. Young people who were LGBTQ+ and young people whose daily activities were limited by long-term illness or disability were more likely to feel unsafe at home, in the local area, at school and in Hull city centre, but there was no real differences for them for feelings of safety in the local park and feelings of safety whilst online.
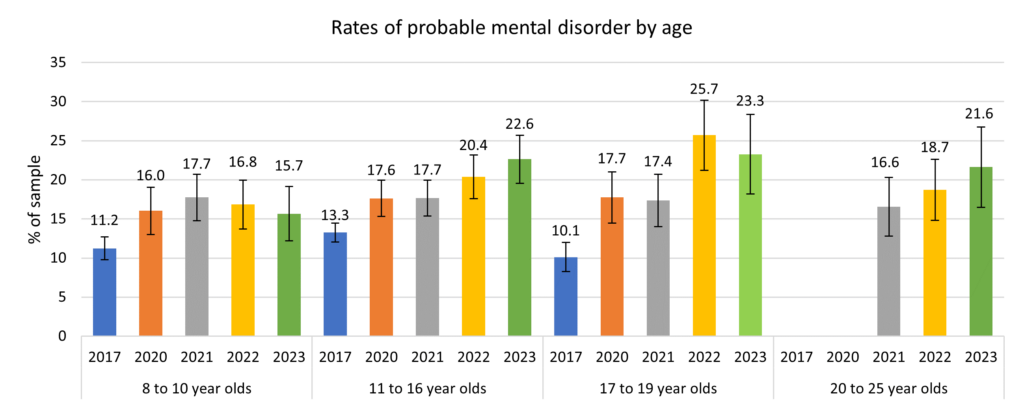
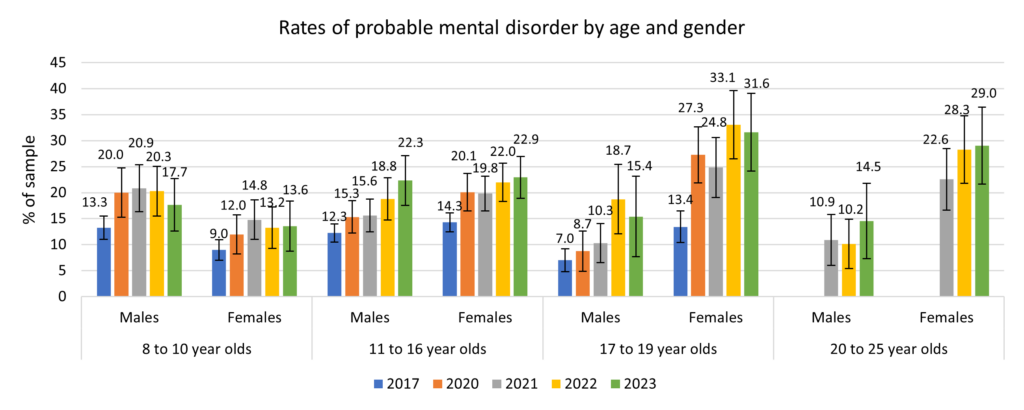
  • From the Mental Health of Children and Young People in England survey in 2023, it is estimated that 15.7% of 8-10 year olds, 22.6% of 11-16 year olds, 23.3% of 17-19 year olds and 21.6% of 20-25 year olds have a probable mental health disorder in England. The percentages have risen sharply since 2017. The prevalence estimates for young people in England were lower among females aged 8-10 years compared to males, but the reverse was true for older ages. Using these prevalence estimates from England for 2023, out of the 63,705 children and young people aged 8-25 years estimated to live in Hull in 2024, it is estimated that 13,472 have a probable mental health disorder. The report also represents some stark information in relation to the impact and consequence of factors such as poverty, illness, worklessness and homelessness in relation to mental health with a much higher percentage of young people with probable mental health facing multiple, overlapping challenges rooted in poverty, instability and inequality. As Hull is among the most deprived local authorities in England, it is therefore likely that the total number of young people estimated to have a probable mental health condition in Hull based on national prevalence estimates is an under-estimate of the true number.
  • From the Mental Health of Children and Young People in England survey in 2023, it is estimated that 2.6% of 11-16 year olds, 12.5% of 17-19 year olds and 5.9% of 20-25 year olds have an eating disorder. Using these prevalence estimates from England for 2023, out of the 53,096 children and young people aged 11-25 years estimated to live in Hull in 2024, it is estimated that 3,143 have an eating disorder.
  • Children and young people who are LGBTQ+, living in poverty, have adverse childhood experiences, who live with a parent with poor mental health, have recognised special educational needs or disabilities, are excluded from school, have poor housing, are being looked after or are leaving or have left care, who are a young carer and/or who are experiencing bereavement all have higher levels of poor mental health and emotional wellbeing. Many of these factors are present together which compound and magnify poor mental health and emotional wellbeing.
  • For 2023/24, just under half of children (48%) who were looked after in Hull had a strengths and difficulties questionnaire score that was of concern in Hull compared to 41% for England. The percentage in Hull was statistically significantly higher than England, although for the years 2015/16 to 2022/23, the percentage in Hull has been comparable or lower than England, and 2023/24 is the first year that the percentage in Hull has been significantly higher than England.
  • The COVID-19 pandemic and likely subsequent cost of living crisis has impacted detrimentally on mental health and emotional wellbeing among young people, and referrals into Children and Young People Mental Health Services at a national level have increased dramatically in the last few years. In the Centre for Young Lives’ 2025 State of Childhood Vulnerability report, which was published in July 2025, they warn that the COVID-19 pandemic is still casting a long shadow over millions of children in England five years on. They also present statistics illustrating that the circumstances facing children and young people have deteriorated in relation to deprivation, poverty, financial resilience, homelessness, school absence, special educational needs, autism, mental health, not in education, training or employment, and violence. Factors which all have a detrimental impact on mental health and emotional wellbeing. Societal changes in the last few years in relation to social media is considered to adversely affect children and young people’s mental health and emotional wellbeing.

The Population Affected – Why Is It Important?

World Health Organisation (WHO) state that mental health is an integral and essential component of health. The WHO constitution states: “Health is a state of complete physical, mental and social well-being and not merely the absence of disease or infirmity.” An important implication of this definition is that mental health is more than just the absence of mental disorders or disabilities.

WHO state mental health is a state of well-being in which an individual realises his or her own abilities, can cope with the normal stresses of life, can work productively and is able to make a contribution to his or her community. Mental health is fundamental to our collective and individual ability as humans to think, emote, interact with each other, earn a living and enjoy life. On this basis, the promotion, protection and restoration of mental health can be regarded as a vital concern of individuals, communities and societies throughout the world.

They go on to say that multiple social, psychological, and biological factors determine the level of mental health of a person at any point of time. For example, violence and persistent socio-economic pressures are recognized risks to mental health. The clearest evidence is associated with sexual violence. Poor mental health is also associated with rapid social change, stressful work conditions, gender discrimination, social exclusion, unhealthy lifestyle, physical ill-health and human rights violations. There are specific psychological and personality factors that make people vulnerable to mental health problems. Biological risks include genetic factors.

Thus poor mental health can have a detrimental effect on all aspects of life undermining self-esteem, confidence and enthusiasm for life. Social and emotional well-being in children creates the foundations for healthy behaviours and educational attainment. It also helps prevent other things like substance use and mental health problems. Social and emotional well-being provides personal competencies (such as emotional resilience, self-esteem and interpersonal skills) that help to protect against risks relating to social disadvantage, family disruption and other adversity in life. Such competencies provide building blocks for personal development which will enable children and young people to take advantage of life chances. 

Evidence shows that poor social and emotional wellbeing predicts a range of negative outcomes in adolescence and adulthood. The National Institute for Health and Care Excellence state that negative parenting and poor quality family or school relationships place children at risk of poor mental health. Early intervention in childhood can help reduce physical and mental health problems and prevent social dysfunction being passed from one generation to the next. 

A general low mood can include sadness, anxiety, worry, tiredness, low self-esteem, frustration and anger and people with poor mental health sometimes can deal with this by smoking more, eating excessively and unhealthy diets and not exercising. Depression can involve continuous low mood, feelings of hopelessness and helplessness, low self-esteem, feeling tearful, feeling irritable and intolerant of others, having no motivation of interest in things, finding it difficult to make decisions, not getting any enjoyment out of life, having suicidal thoughts or thoughts of self-harming, and feeling anxious or worried. As a consequence, poor mental health influences all aspects of life, a person’s physical health, their family, their education and training, their workplace and employment, and their involvement in their community.

In recent years, there has been increasing acknowledgement of the important role mental health plays in achieving global development goals, as illustrated by the inclusion of mental health in the Sustainable Development Goals. Depression is one of the leading causes of disability. Suicide is the second leading cause of death among 15-29-year-olds. People with severe mental health conditions die prematurely – as much as two decades early – due to preventable physical conditions.

Despite progress in some countries, people with mental health conditions often experience severe human rights violations, discrimination, and stigma.

Many mental health conditions can be effectively treated at relatively low cost, yet the gap between people needing care and those with access to care remains substantial. Effective treatment coverage remains extremely low.

Increased investment is required on all fronts: for mental health awareness to increase understanding and reduce stigma; for efforts to increase access to quality mental health care and effective treatments; and for research to identify new treatments and improve existing treatments for all mental disorders. In 2019, WHO launched the WHO Special Initiative for Mental Health (2019-2023): Universal Health Coverage for Mental Health to ensure access to quality and affordable care for mental health conditions in 12 priority countries to 100 million more people.

Mental health conditions are increasing worldwide. Mainly because of demographic changes, there has been a 13% rise in mental health conditions and substance use disorders in the last decade (to 2017). Around 20% of the world’s children and adolescents have a mental health condition, with suicide the second leading cause of death among 15-29-year-olds. Approximately one in five people in post-conflict settings have a mental health condition.

Mental health conditions can have a substantial effect on all areas of life, such as school or work performance, relationships with family and friends and ability to participate in the community. Two of the most common mental health conditions, depression and anxiety, cost the global economy US$1 trillion each year. Mental Health First Aid estimates that mental health costs the UK economy £105 billion each year.

Despite these figures, the global median of government health expenditure that goes to mental health is less than 2%. 

The Hull Picture

Needs Assessment 2023

A Health Needs Assessment Children and Young People Emotional Wellbeing and Mental Health was undertaken in March 2023.

CYP Emotional WB & Mental Health Needs Assessment March 2023

Needs Assessment of Children Aged 2-4 Years 2022

A mini needs assessment on mental health was undertaken in 2022 for children aged 2-4 years in Hull.

MH_NeedsAssessment_Aged2to4years2022

Hull’s Young People Health and Wellbeing Survey 2024

Eight of Hull’s 13 main-stream secondary schools took part in Hull’s Young People Health and Wellbeing Survey between 6 March and 3 May 2024 with a total of 3,910 young people aged 11-16 years taking part. Further details can be found on Hull’s Young People Health and Wellbeing Surveys.

Young people were asked about bullying, if they had been treated unfairly, if they had good or poor mental health, if they had an adult to talk to as well as feelings of safety in their local area.

The prevalence estimates generally differed for males and females, and across the five school years, Year 7 (aged 11-12 years) to Year 11 (aged 15-16 years) so the age-standardised percentages were calculated which adjusted to account for the differences in the prevalence by age, and in effect give a summary measure over all age groups taking into account the total number of children living in Hull within those age ranges.

There were a small number of Year 11 boys surveyed so the results should be treated cautiously for this group.

The age-standardised percentages were as follows for some of the measures of mental health and emotional wellbeing:

  • 47.2% had good or very good mental health.
  • 27.1% had poor or very poor mental health.
  • 27.6% had been bullied in the last year.
  • 92.5% had an adult to talk to.
  • 77.6% felt safe in their local area.

At the time of the survey analysis, the Office for National Statistics estimated that there were 17,376 secondary school age young people living in Hull (mid-year 2023 resident population estimates).

Using the above prevalence estimates and the estimated population, it was possible to estimate the total number of young people of secondary school age living in Hull on the basis of these mental health and emotional wellbeing measures:

  • Out of an estimated 17,376 residents of secondary school age:
    • 8,199 had good or very good mental health.
    • 4,704 had poor or very poor mental health.
    • 4,792 had been bullied in the last year.
    • 16,072 had an adult to talk to.
    • 13,484 felt safe in their local area.

Self-Reported Mental Health Status

Overall, males reported better mental health compared to females with a much higher percentage reporting very good or good health among males. Whilst more females reported their mental health was OK, higher percentages of females reported poor or very poor mental health.

Percentage of young people reporting very poor, poor, OK, good or very good mental health by school year for males and females, Hull's Young People Health and Wellbeing Survey 2024
Percentage of young people reporting very poor, poor, OK, good or very good mental health by school year for males and females, Hull’s Young People Health and Wellbeing Survey 2024

The percentage with very good or good mental health were not drastically different across the five year groups for either males or females which ranged between 54% and 62% across the school years for males and between 35% and 42% for females.

Percentage of young people reporting very good or good mental health by school year for males and females, Hull's Young People Health and Wellbeing Survey 2024
Percentage of young people reporting very good or good mental health by school year for males and females, Hull’s Young People Health and Wellbeing Survey 2024

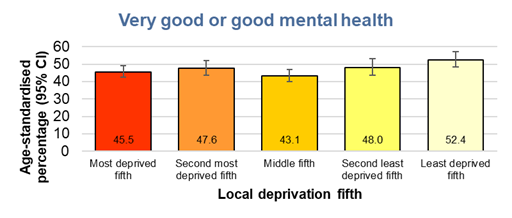
A lower percentage of young people report very good or good mental health among those living in the most deprived fifth of areas of Hull (46%) compared to those who lived in the least deprived fifth of areas of Hull (52%) based on the Index of Multiple Deprivation 2019. However, the differences were not statistically significant.

Age-standardised percentage of young people reporting very good or good mental health by local deprivation fifth (based on Index of Multiple Deprivation 2019), Hull's Young People Health and Wellbeing Survey 2024
Age-standardised percentage of young people reporting very good or good mental health by local deprivation fifth (based on Index of Multiple Deprivation 2019), Hull’s Young People Health and Wellbeing Survey 2024

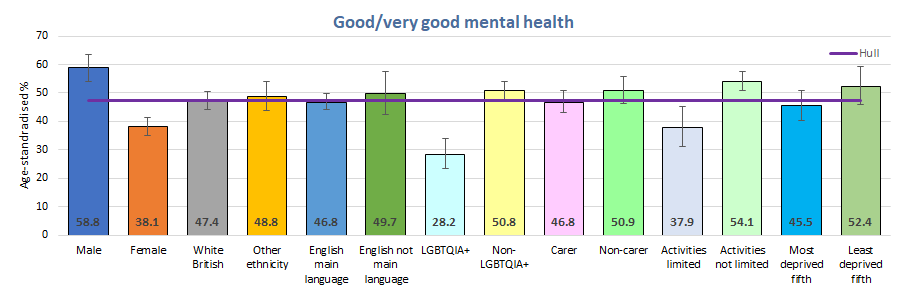
There were significant differences among different groups of young people in terms of the percentage who reported very good or good mental health. Males were much more likely to report very good or good mental health compared to females (59% versus 38%) and young people who were not LGBTQ+ compared to young people who were LGBTQ+ (51% versus 28%), and young people whose daily activities were not limited by long-term illness or disability compared to those whose activities were limited (54% versus 38%).

Percentage of young people reporting very good or good mental health for different groups of young people, Hull's Young People Health and Wellbeing Survey 2024
Percentage of young people reporting very good or good mental health for different groups of young people, Hull’s Young People Health and Wellbeing Survey 2024

Around one in five males reported poor or very poor mental health with a slightly smaller percentage at 16% for Year 9s. The percentages were higher among Year 11 males at 29% although this is not known if it is a real factor or a consequence of the relatively small number of Year 11 males that participated the in the survey (the 95% confidence intervals are wide denoting uncertainty around the percentage). For females, the percentages reporting poor or very poor mental health were much higher at just under one-third of females overall. The percentages were lowest among Year 7 females at 27% before increasing for the older school years.

Percentage of young people reporting poor or very poor mental health by school year for males and females, Hull's Young People Health and Wellbeing Survey 2024
Percentage of young people reporting poor or very poor mental health by school year for males and females, Hull’s Young People Health and Wellbeing Survey 2024

Not surprisingly, the reverse associations were present when examining the percentages who reported poor or very poor mental health where there has been differences between groups in relation to very good or good mental health.

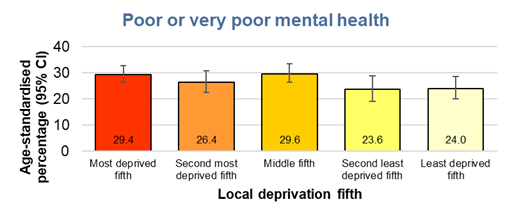
Just under three in ten (29%) stated their mental health was poor or very poor among young people living in the most deprived fifth of areas of Hull compared to under one-quarter (24%) among young people living in the least deprived fifth of areas of Hull. However, the differences were not statistically significant.

Age-standardised percentage of young people reporting poor or very poor mental health by local deprivation fifth (based on Index of Multiple Deprivation 2019), Hull's Young People Health and Wellbeing Survey 2024
Age-standardised percentage of young people reporting poor or very poor mental health by local deprivation fifth (based on Index of Multiple Deprivation 2019), Hull’s Young People Health and Wellbeing Survey 2024

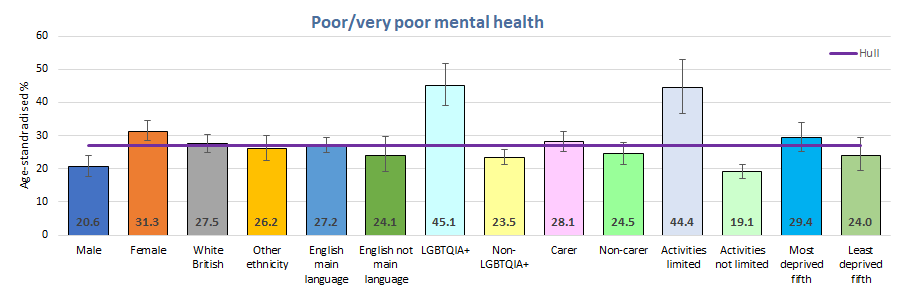
Almost one-third of females and around 45% of young people who were LGBTQ+ or whose daily activities were limited by long-term illness or disability reported poor or very poor mental health.

Percentage of young people reporting poor or very poor mental health for different groups of young people, Hull's Young People Health and Wellbeing Survey 2024
Percentage of young people reporting poor or very poor mental health for different groups of young people, Hull’s Young People Health and Wellbeing Survey 2024

Worries

Young people most frequently worried about how they looked with 27% worrying about this a lot and 17% worrying about this quite a lot. They also worried about relationships and friends, family, school tests and exams, money, their weight, someone else’s health, getting a job, feeling lonely, their health, and their identity.

Fewer than 20% worried a lot or quite a lot about homework, pressure to do something they didn’t want to do, bullying, violence, gangs, staying safe online and climate change.

Age standardised percentage of young people worrying a lot or quite a lot about various aspects of life, Hull's Young People Health and Wellbeing Survey 2024
Age standardised percentage of young people worrying a lot or quite a lot about various aspects of life, Hull’s Young People Health and Wellbeing Survey 2024

The table below illustrates the percentages of young people who worried a lot or quite a lot about these various aspects of life (ordered with the worries with the highest percentages at the top of the table) by school year for males and females separately.

The younger pupils were much more likely to worry about all these factors compared to the older pupils with the exception of money, school tests and exams, and getting a job. Females were more likely to worry a lot or quite a lot about most of these life issues compared to males although for some year groups males worried more than females in relation to money, getting a job and climate change. Year 11 males were more likely to worry a lot or quite a lot compared to Year 11 females. However, there were a small number of Year 11 boys surveyed so the results should be treated cautiously for this group.

Young people who had long-term illness or disabilities that limited their daily activities were more likely to worry a lot or quite a lot compared to all young people surveyed (see Physical Health Among Children and Young People).

WorryMale Y7Male Y8Male Y9Male Y10Male Y11Female Y7Female Y8Female Y9Female Y10Female Y11
How I look33.628.527.830.324.255.162.656.165.144.2
Relationships and friends38.933.333.730.037.353.956.048.748.044.9
Family43.339.337.838.745.349.751.044.345.135.5
School tests and exams33.627.627.130.357.140.941.941.154.167.0
Money31.431.936.337.939.628.836.635.540.833.7
My weight26.323.620.418.927.640.451.542.344.137.0
Someone else’s health32.825.025.321.537.638.132.834.929.526.3
Getting a job27.423.926.027.448.422.527.628.435.732.7
Feeling lonely20.117.114.717.227.333.337.728.130.924.7
My health23.321.216.918.025.227.431.525.927.522.2
My identity18.616.314.615.314.524.627.819.720.317.1
Homework22.619.015.314.215.727.720.115.523.311.1
Pressure to do something I don’t want to20.113.510.39.219.227.628.618.615.812.0
Bullying18.315.813.212.616.626.125.717.117.36.0
Violence18.013.810.911.014.219.925.014.313.16.3
Gangs17.110.310.18.47.319.319.911.510.68.5
Staying safe online15.711.08.57.111.516.813.99.97.12.6
Climate change14.58.08.77.95.111.710.38.59.78.1
Percentage of young people who worry a lot or quite a lot by school year for males and females, Hull’s Young People Health and Wellbeing Survey, 2024

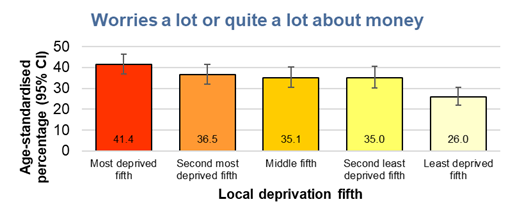
Young people living in the most deprived fifth of areas of Hull were more likely to worry a lot or quite a lot about money (41%) compared to young people living in the least deprived fifth of areas of Hull (26%) based on the Index of Multiple Deprivation 2019.

Age-standardised percentage of young people reporting they worry a lot or quite a lot about money by local deprivation fifth (based on Index of Multiple Deprivation 2019), Hull's Young People Health and Wellbeing Survey 2024
Age-standardised percentage of young people reporting they worry a lot or quite a lot about money by local deprivation fifth (based on Index of Multiple Deprivation 2019), Hull’s Young People Health and Wellbeing Survey 2024

There were no differences in the percentages overall who worried a lot or quite a lot about money between the males (35.4%) and females (35.1%), although females living in the most deprived two-fifths of areas of Hull were more likely to worry a lot or quite a lot about money (44.2% in most deprived fifth and 40.1% in second most deprived fifth) compared to males (41.6% and 29.9% respectively), but males living in the least deprived three-fifths of areas of Hull were more likely to worry a lot or quite a lot about money (28.9% in least deprived fifth, 38.1% in second least deprived fifth and 38.1% in middle fifth) compared to females (23.8%, 32.7% and 31.9% respectively).

Bullying

Overall, 27.6% had been bullied in the last year with the highest percentages among the younger school years with higher percentages among females (31.2%) compared to males (23.6%).

Younger pupils were much more likely to have experience bullying in the last year compared to older pupils. One-third of males in Year 7 had experienced bullying which decreased to 17% among males in Year 10, and the percentage was slightly higher among males in Year 11 at 22%. Among females, 35% in Year 7 and 38% in Year 8 had experienced bullying in the last year which fell to 21% among females in Year 11.

Percentage of young people who had been bullied in the last year by school year for males and females, Hull's Young People Health and Wellbeing Survey 2024
Percentage of young people who had been bullied in the last year by school year for males and females, Hull’s Young People Health and Wellbeing Survey 2024

Young people who were living in the most deprived fifth of areas of Hull based on the Index of Multiple Deprivation 2019 reported slightly higher percentages of bullying, although the differences were percentages for the most and least deprived fifths were not statistically significantly different compared to the Hull average.

Age-standardised percentage of young people who had been bullied in the last year by local deprivation fifth (based on Index of Multiple Deprivation 2019), Hull's Young People Health and Wellbeing Survey 2024
Age-standardised percentage of young people who had been bullied in the last year by local deprivation fifth (based on Index of Multiple Deprivation 2019), Hull’s Young People Health and Wellbeing Survey 2024

The majority of the bullying occurred at school with eight in ten cases of bullying occurring at school. A further quarter of young people had not been bullied at school but has been bullied by a pupil from school, and just over one in five had been bullied on their way to or from school. One-third has been bullied on social media, and one in ten had been bullied at home.

Compared to young people who were not LGBTQ+, young people who were LGBTQ+ were more likely to have been bullied at home (7% versus 17%), not at school but by a school pupil (22% versus 36%), and one the way to or from school (22% versus 36%).

Age-standardised percentage of where the bullying took place among young people who had been bullied in the last year, Hull's Young People Health and Wellbeing Survey 2024
Age-standardised percentage of where the bullying took place among young people who had been bullied in the last year, Hull’s Young People Health and Wellbeing Survey 2024

Over three-quarters of the bullying was name-calling or teasing with six in ten subject to having lies or rumours spread about them, and over half were bullied about their appearance.

Males were statistically significantly more likely to have been pushed, hit, kicked or slapped compared to females (60% versus 35%) and have personal items damaged, taken or stolen (43% versus 20%).

Whilst young people who were white British were more likely to have been bullied in the last year compared to young people from minority ethnic groups (29% versus 23%), not surprisingly young people who were from minority ethnic groups were more likely to experience bullying related to racism (43% versus 8%) as did young people whose first language was not English compared to those whose first language was English (48% versus 11%). Young people whose first language was not English were more likely to be bullied “online, filmed and shared” compared to those whose first language was English (29% versus 11%).

Compared to young people who were not LGBTQ+, young people who were LGBTQ+ were more likely to have been bullied about their identity (21% versus 37%) or sexism (8% versus 24%) and also experience other forms of bullying (21% versus 37%).

Age-standardised percentage of type of bullying experienced by young people who had been bullied in the last year, Hull's Young People Health and Wellbeing Survey 2024
Age-standardised percentage of type of bullying experienced by young people who had been bullied in the last year, Hull’s Young People Health and Wellbeing Survey 2024

There were relatively large differences in the percentages of young people who had been bullied in the last year among some specific groups. There was a statistically significant difference among males and females with 24% of males and 31% of females having been bullied in the last year. Young people whose daily activities were limited due to disabilities or long-term illness were more likely to have been bullied in the last year (44% versus 20%). As were young people who stated they were carers compared to non-carers (31% versus 22%), however, there were substantial differences in the percentage of young people who said they were carers with seven in ten young people in total saying they cared for others. It is unlikely that the percentages are as high as this, and the question is likely to have been misinterpreted. Younger pupils were more likely to state they were carers, and younger pupils were more likely to be bullied so it is likely that that age is a confounder, and that there might not be any difference in bullying between carers or non-carers. The percentage of young people who were LGBTQ+ was high at 46% and twice as high as young people who stated they were not LGBTQ+. This difference was statistically significant.

Age-standardised percentage of young people who had been bullied in the last year for different groups of young people, Hull's Young People Health and Wellbeing Survey 2024
Age-standardised percentage of young people who had been bullied in the last year for different groups of young people, Hull’s Young People Health and Wellbeing Survey 2024

Overall, the majority would tell someone if they were bullied, although 8% stated they would tell no-one and a further 7% stated they didn’t know if they would tell anyone.

Males were statistically significantly more likely to say they would tell no-one compared to females (10% versus 4%) and also state that they didn’t know if they would tell anyone (11% versus 6%).

Young people from minority ethnic groups compared to young people who were white British were less likely to tell a parent or carer if they were bullied (64% versus 74%), as were young people whose first language was not English compared to those whose first language was English (57% versus 73%), and these young people were also less likely to tell another family member (24% versus 31%).

Age-standardised percentage of who they would tell if they were bullied, Hull's Young People Health and Wellbeing Survey 2024
Age-standardised percentage of who they would tell if they were bullied, Hull’s Young People Health and Wellbeing Survey 2024

If they saw someone being bullied, just over half would tell someone from school, around four in ten would tell a parent or carer, and 37% would tell a friend.

Young people from minority ethnic groups compared to young people who were white British were less likely to tell a parent or carer if they had witnessed bullying (33% versus 42%), as were young people whose first language was not English compared to those whose first language was English (29% versus 41%).

Age-standardised percentage of who they would tell if they saw someone being bullied, Hull's Young People Health and Wellbeing Survey 2024
Age-standardised percentage of who they would tell if they saw someone being bullied, Hull’s Young People Health and Wellbeing Survey 2024

Overall, 17% had worried a lot or quite a lot about bullying in the last month, but this was much higher among young people who were LGBTQ+ with almost twice as many of them worrying about bullying (32%). Young people who whose activities were limited due to long-term illness or disability were also more likely to worry about bullying (26%) as were those who reported that they were carers (20%) although this is likely confounded with age as mentioned above as younger pupils were much more likely to worry a lot or quite a lot in relation to older pupils about virtually all of the life factors that the survey asked about.

Percentage of young people who have worried a lot of quite a lot about bullying in the last month, Hull's Young People Health and Wellbeing Survey 2024
Percentage of young people who have worried a lot of quite a lot about bullying in the last month, Hull’s Young People Health and Wellbeing Survey 2024

Having an Adult to Talk to

Young people were asked if they had an adult to talk to if things were bothering them, and had the option of responding with yes, no, don’t know or rather not say.

In data analysis, it is common to exclude responses that are missing or uncertain, so if the percentages of stating they had someone to talk to is given out of the total number who answered yes or no, then over nine in ten young people had an adult to talk to if things were bothering them although the percentages were marginally lower for Year 11 males at 86%.

Percentage of young people reporting that they had an adult to talk to about things that are bothering them by school year for males and females, Hull's Young People Health and Wellbeing Survey 2024
Percentage of young people reporting that they had an adult to talk to about things that are bothering them by school year for males and females, Hull’s Young People Health and Wellbeing Survey 2024

There were some slight differences between different groups of young people, but none of the differences were statistically significant.

Percentage of young people reporting that they had an adult to talk to about things that are bothering them for different groups of young people, Hull's Young People Health and Wellbeing Survey 2024
Percentage of young people reporting that they had an adult to talk to about things that are bothering them for different groups of young people, Hull’s Young People Health and Wellbeing Survey 2024

If the percentage who stated they did not have an adult to talk to or didn’t know was calculated the number who stated yes, no or don’t know, then around one in ten males in Years 7 to 10 and 29% of males in Year 11 did not have an adult to talk to or didn’t know. The percentages were higher among females around 15% for Years 7, 9 and 11, and around 20% for Years 8 and 10.

Percentage of young people reporting that they did not have an adult to talk to about things that are bothering them or they didn't know if they did by school year for males and females, Hull's Young People Health and Wellbeing Survey 2024
Percentage of young people reporting that they did not have an adult to talk to about things that are bothering them or they didn’t know if they did by school year for males and females, Hull’s Young People Health and Wellbeing Survey 2024

Feelings of Safety

Young people were asked how safe they felt at home, in their local area, at school, in the local park, in Hull city centre and online with responses very safe, fairly safe, a bit unsafe and very unsafe.

Over 95% of young people felt very safe or safe at home. Males tended to have higher percentages reporting feeling very safe at the different locations but as females tended to have the higher percentages reporting safe, and as a result, the percentages of young people who felt very safe or safe for males and females was relatively similar. Young people were the least likely to feel safe in the local park and in Hull city centre, although around three in ten did not feel safe at school.

Feelings of safety among young people at different locations for males and females, Hull's Young People Health and Wellbeing Survey 2024
Feelings of safety among young people at different locations for males and females, Hull’s Young People Health and Wellbeing Survey 2024

Feelings of safety were consistently for both males and females for all school years with more than nine in ten feelings very safe or safe. Between 77% and 86% felt very safe at home.

Percentage of young people reporting that they feel very safe or fairly safe at home by school year for males and females, Hull's Young People Health and Wellbeing Survey 2024
Percentage of young people reporting that they feel very safe or fairly safe at home by school year for males and females, Hull’s Young People Health and Wellbeing Survey 2024

One in eleven young people who were LGBTQ+ felt very unsafe or a bit unsafe at home, and one in 16 young people who had daily activities limited due to long-term illness and disability.

Feelings of safety were also lower among people living in the most deprived fifth of areas of Hull compared to those living in the last deprived fifth of areas of Hull, although the differences were not statistically significant.

Percentage of young people reporting that they feel very unsafe or a bit unsafe at home for different groups of young people, Hull's Young People Health and Wellbeing Survey 2024
Percentage of young people reporting that they feel very unsafe or a bit unsafe at home for different groups of young people, Hull’s Young People Health and Wellbeing Survey 2024

Around three-quarters of young people felt very safe or fairly safe in their local area. There were some variation across the school years and differences among males and females but they were not substantial. Males were more likely to feel very safe whereas females were more likely to report feeling fairly safe.

Percentage of young people reporting that they feel very safe or fairly safe in their local area by school year for males and females, Hull's Young People Health and Wellbeing Survey 2024
Percentage of young people reporting that they feel very safe or fairly safe in their local area by school year for males and females, Hull’s Young People Health and Wellbeing Survey 2024

Young people who were LGBTQ+ and young people whose daily activities limited due to long-term illness and disability were also more likely to feel very unsafe or a bit unsafe in their local area. Just over one-third of young people who were LGBTQ+ felt unsafe. Feelings safety were also lower among people living in the most deprived fifth of areas of Hull compared to those living in the last deprived fifth of areas of Hull with 25% feeling unsafe in the more deprived areas of Hull compared to 16% in the less deprived areas of Hull.

Percentage of young people reporting that they feel very unsafe or a bit unsafe in their local area for different groups of young people, Hull's Young People Health and Wellbeing Survey 2024
Percentage of young people reporting that they feel very unsafe or a bit unsafe in their local area for different groups of young people, Hull’s Young People Health and Wellbeing Survey 2024

Seven in ten males (69%) and two-thirds (67%) of females felt very safe or fairly safe at school, although there were some differences across the school year groups. The percentages were lower among males in Year 11, and females in Year 8.

Percentage of young people reporting that they feel very safe or fairly safe at school by school year for males and females, Hull's Young People Health and Wellbeing Survey 2024
Percentage of young people reporting that they feel very safe or fairly safe at school by school year for males and females, Hull’s Young People Health and Wellbeing Survey 2024

Four in ten young people who were LGBTQ+ and young people whose daily activities limited due to long-term illness and disability felt very unsafe or a bit unsafe at school.

Percentage of young people reporting that they feel very unsafe or a bit unsafe at school for different groups of young people, Hull's Young People Health and Wellbeing Survey 2024
Percentage of young people reporting that they feel very unsafe or a bit unsafe at school for different groups of young people, Hull’s Young People Health and Wellbeing Survey 2024

Feelings of safety in the local park were lower among females compared to males, and among Year 11 males. Almost six in ten males in Years 7 to 10 felt safe in their local park falling to 47% for Year 11 males (although as mentioned above the numbers surveyed were low for Year 11 males so the results need to be considered carefully).

Between 45% and 51% of females – depending on the school year – felt safe in the local park.

Percentage of young people reporting that they feel very safe or fairly safe in the local park by school year for males and females, Hull's Young People Health and Wellbeing Survey 2024
Percentage of young people reporting that they feel very safe or fairly safe in the local park by school year for males and females, Hull’s Young People Health and Wellbeing Survey 2024

Females were more likely to feel unsafe in the local park (45%) compared to males (39%). There were slight differences between other groups of young people but none of these differences were statistically significant.

Percentage of young people reporting that they feel very unsafe or a bit unsafe in the local park for different groups of young people, Hull's Young People Health and Wellbeing Survey 2024
Percentage of young people reporting that they feel very unsafe or a bit unsafe in the local park for different groups of young people, Hull’s Young People Health and Wellbeing Survey 2024

Around six in ten males in Years 7 to 10 felt safe in Hull city centre, and the percentage was lower at 42% among Year 11 males (although as previously mentioned there is more uncertainty associated with the percentages among Year 11 males).

Around half of females felt safe in Hull city centre, although the percentage was slightly lower among Year 8 females (46%) and higher among Year 11 females (65%).

It is likely that there will be differences in the frequency of going into Hull city centre for some of these different school years for males and females, and the ages at which they go alone or with friends into Hull city centre, rather than with adults, parents or carers.

Percentage of young people reporting that they feel very safe or fairly safe in Hull city centre by school year for males and females, Hull's Young People Health and Wellbeing Survey 2024
Percentage of young people reporting that they feel very safe or fairly safe in Hull city centre by school year for males and females, Hull’s Young People Health and Wellbeing Survey 2024

Young people who were LGBTQ+ were more likely to feel unsafe in Hull city centre (41%) as were young people whose daily activities limited due to long-term illness and disability (43%) and young people living in the least deprived fifth of areas of Hull (43%).

Percentage of young people reporting that they feel very unsafe or a bit unsafe in Hull city centre for different groups of young people, Hull's Young People Health and Wellbeing Survey 2024
Percentage of young people reporting that they feel very unsafe or a bit unsafe in Hull city centre for different groups of young people, Hull’s Young People Health and Wellbeing Survey 2024

Over eight in ten males felt safe online, but feelings of safety whilst online were lower among females and lowest among younger females. The percentages increased from 71% among Year 7 females to 85% among Year 11 females.

Percentage of young people reporting that they feel very safe or fairly safe online by school year for males and females, Hull's Young People Health and Wellbeing Survey 2024
Percentage of young people reporting that they feel very safe or fairly safe online by school year for males and females, Hull’s Young People Health and Wellbeing Survey 2024

As mentioned above, feelings of safety were lower among females whilst being online. The difference in the percentages feeling unsafe whilst online was statistically significantly different among males (12%) and females (18%).

Percentage of young people reporting that they feel very unsafe or a bit unsafe online for different groups of young people, Hull's Young People Health and Wellbeing Survey 2024
Percentage of young people reporting that they feel very unsafe or a bit unsafe online for different groups of young people, Hull’s Young People Health and Wellbeing Survey 2024

Mental Health of Children and Young People in England Survey 2023

Prevalence of Probable Mental Health Disorders and Trends Over Time

The State of the Nation 2021 and 2022 Children and Young People’s Wellbeing Research reports, as well as NHS Digital’s Mental Health of Children and Young People in England survey in 2017 and four subsequent waves of follow-up surveys in 2020, 2021, 2022 and 2023, estimated the prevalence of probable mental disorders among children in England.

The Strengths and Difficulties Questionnaire was used and includes 25 questions on different aspects of behaviour related to emotional problems, conduct problems, hyperactivity/inattention (restlessness), peer relationship problems and positive prosocial behaviour. The responses to the four problem scales can be viewed together to assess a person’s total difficulties, or separately to look at particular problems. The scores for these scales can then also be combined with answers to questions about the impact that the difficulties have on the child’s life to create a score which indicates likelihood of that child having a mental disorder from unlikely to probable.

Across England, one in nine (11.2%) of those aged 8 to 10 years had a probable mental health disorder in 2017, but this had increased to a 16.0% in 2020 and 17.7% in 2021 which could be partially due to the pandemic.. The percentages have since fallen slightly among 8-10 year olds to 15.7% in 2023.

However, the percentages estimated to have a probable mental health disorder has increased dramatically between 2017 and 2023 for England for both those aged 11-16 years and aged 17-19 years, as well as increasing sharply among those aged 20-25 years between 2021 and 2023.

Trends over time in the prevalence of probable mental disorders among children and young people in England by age (with 95% confidence intervals)

In England for 2023, compared to girls, boys were more likely to have a probable disorder (19.8% versus 20.8%) and possible disorder (10.8% versus 13.1%) among those aged 8-16 years, although the reverse was true for older ages with a much higher prevalence among females which was double that of males. Almost one-third (31.6%) of females aged 17-19 years were estimated to have a probable mental health disorder compared to 15.4% of males, and females were slightly more likely to have a possible mental health disorder (16.0% versus 14.7%). The percentages had increased substantially since 2017 when 13.4% of females and 7.0% of males were estimated to have a probable mental health disorder and 14.9% of females and 9.9% of males were estimated to have a possible mental health disorder.

The percentages among young adults did decrease slightly compared to young people aged 17-19 years. In 2023, it was estimated that 29.0% of females and 14.5% of males were estimated to have a probable mental health disorder and 13.0% of females and 15.8% of males were estimated to have a possible mental health disorder among those aged 20-23 years. This is also an increase since 2021 (data not available for 2017 for those aged 20-23 years) when 22.6% of females and 10.9% of males were estimated to have a probable mental health disorder and 13.3% of females and 12.1% of males were estimated to have a possible mental health disorder.

Trends over time in the prevalence of probable mental disorders among children and young people in England by age and gender (with 95% confidence intervals)

Applying Prevalence Estimates to Hull to Obtain Estimated Numbers in Hull

Based on the Office for National Statistics resident population estimates for 2024, there are 5,473 males and 5,136 females aged 8-10 years, 11,026 males and 20,697 females aged 11-16 years, 5,805 males and 5,121 females aged 17-19 years, and 10,664 males and 9,783 females aged 20-25 years. If the prevalence estimates above for England are applied to Hull’s population, it is possible to obtain the estimated number of children and young people in Hull with a probable or possible mental health disorder.

As mentioned below, in the Centre for Young Lives’ 2025 State of Childhood Vulnerability report, behind every number is a child who needs support – often facing multiple, overlapping challenges that can be rooted in poverty, instability, and inequality.

Children who are at most of need and who are most vulnerable are more likely to live in relative poverty, and due to the much higher levels of deprivation within Hull compared to England, the estimated numbers of children and young people impacted by mental health disorders is likely to be higher than stated.

SexMental health disorderAged 8-10Aged 11-16Aged 8-16Aged 17-19Aged 20-25
AllUnlikely7,65814,21121,8976,74212,893
Possible1,2882,5983,8801,6723,150
Probable1,6634,9146,5552,5154,405
MaleUnlikely3,5967,31210,9084,0607,472
Possible9101,2532,1678511,761
Probable9672,4613,4248941,431
FemaleUnlikely4,0626,89910,9892,6825,421
Possible3781,3451,7138211,389
Probable6962,4533,1311,6182,974
Number of children and young people in Hull unlikely to have a mental health disorder, a possible mental health disorder or probable mental health disorder estimated from age-specific prevalence estimates from England in 2023 applied to Hull’s resident population estimates for mid-year 2024

Self-Harm and Ability to Feel They Can Be Themselves and Safe at School

Rates of self-harm and talk of self-harming was much higher among young people who had a probable mental health disorder, and school absence was substantially greater. Young people who had a probable mental health disorder were more likely to feel that they could not be themselves at school, less likely to feel safe at school and less likely to enjoy learning. They were also less likely to have at least one friend they could turn to for support.

Knowledge and Trust of Services and Access to Support

Over half had accessed mental health and wellbeing support at school. The majority did know they could get help for worries and mental health concerns (just over 80%), agreed that they felt comfortable talking to adults at their school about mental health (around six in ten), agreed that they could get mental health support at school without others finding out (two-thirds), agreed that support from school was helpful (just under two-thirds), and agreed they could access support from school when they needed it (three-quarters).

Among 8-16 year olds, 85% had sought help and advice for a mental health concern among those who had a probably mental health disorder (74% for those with a possible disorder and 64% of those who were unlikely to have a disorder). Among 8-16 year olds with a probable mental health disorder, almost three-quarters (74%) accessed support through education, 49% through health, 42% obtained support from family or friends and 35% accessed online support. Among 17-24 year olds, 63% had sought help and advice for a mental health concern among those who had a probably mental health disorder (60% for those with a possible disorder and 43% of those who were unlikely to have a disorder). Among 17-24 year olds with a probable mental health disorder, two-thirds (66%) obtained support from family or friends, 45% through health, 43% accessed online support, and 21% through education.

Impact or Consequence of Life Factors on Mental Wellbeing

Among 8-16 year olds, compared to children and young people unlikely to have a mental health disorder, children with a probable mental health disorder were more likely to have had a parent or partner who lost their job or business (2.9% versus 6.6%), have had a reduction in household income (12.6% versus 22.3%), fallen behind will bills, rent or mortgage (6.8% versus 18.7%), could not afford to buy enough food or had to use a food bank (3.5% versus 15.3%), could not afford to keep their home warm enough (7.6% versus 19.9%), have lost their home or became homeless (0.2% versus 0.9%) and had a parent or somebody close to them is or was seriously ill (10.6% versus 13.7%). Children and young people aged 8-16 years with a probable mental health disorder were more likely to have had at least one of these factors present (41.7%) compared to children and young people unlikely to have a mental health disorder (29.5%), and as a consequently less likely to have none of the above (58.3% versus 70.5%).

Among young people aged 17-24 years, compared to those unlikely to have a mental health disorder, those with a probable mental health disorder were more likely have moved in with a partner (5.8% versus 10.7%), moved out of their parents or carer’s home (9.9% versus 14.8%), lost their job or business (3.6% versus 11.2%), had a baby (1.0% versus 1.3%), lost their home or become homeless (0.8% versus 6.5%), had a reduction in household income (8.1% versus 15.4%), fallen behind will bills, rent or mortgage (5.4% versus 20.6%), could not afford to buy enough food or had to use a food bank (4.2% versus 13.6%), could not afford to keep their home warm enough (8.8% versus 18.8%), being ill or had somebody close to them is or was seriously ill (10.4% versus 19.9%). Young people with a probable mental health disorder were less likely to have started a new job or course of study compared to those unlikely to have a disorder (30.2% versus 39.2%). Young people aged 17-24 years with a probable mental health disorder were more likely to have had at least one of these factors present (67.1%) compared to young people unlikely to have a mental health disorder (55.5%), and as a consequently less likely to have none of the above (32.9% versus 44.5%).

Among children and young people aged 8-16 years, parents were much more likely to agree that they feel worried about money among parents of those with a probable mental health disorder compared to those unlikely to have a disorder (57.2% versus 39.0%), and they were less likely to agree that they could afford to give their child a healthy diet (80.4% versus 90.2%), afford the right clothes, shoes and equipment for school or college (73.1% versus 89.0%), afford their child to take part in activities outside school such as family days out, swimming or other hobbies (61.1% versus 79.8%) and afford or have access to transport to take their child where they needed to go (75.3% versus 91.1%).

The financial impact was also felt by the child. Among those aged 11-16 years, one fifth (21.0%) agreed that their family struggle more than other families to afford the things that they need among young people with a probable mental health disorder compared to one fifth (10.3%) of those unlikely to have a disorder. There was also fewer young people with a probable mental health disorder compared to those unlikely to have a disorder agreeing that their family could afford to keep their home warm enough (79.4% versus 89.2%), have enough food for them to eat, eat a healthy diet including fruit and vegetables (89.5% versus 96.1%), afford to do activities and fun things together as a family (72.7% versus 84.5%), and afford to buy them the right clothes and shoes for school (83.4% versus 96.3%). Among young people aged 17-25 years, there was also an increased level of concern around their financial situation among young people with a probable mental health disorder compared to those unlikely to have a disorder with higher percentages agreeing that they worry about money (69.4% versus 40.2%), and lower percentages agreeing that they could afford healthy food (60.9% versus 88.7%), afford for me to have the clothes, shoes or equipment needed for daily life (69.4% versus 91.1%), afford to take part in activities such as sport, days out or socialising with friends (51.9% versus 84.0%), and afford to access transport to do the things needed in daily life (70.0% versus 92.4%).

Young people with a probable mental health disorder compared to those unlikely to have a disorder were more likely to have been bullied online (19.3% versus 5.9% among 11-16 year olds and 26.1% versus 7.6% among 17-24 year olds) and less likely to feel safe online (55.8% versus 64.6% among 11-16 year olds and 42.8% versus 65.4% among 17-24 year olds). Young people aged 11-16 years with probable mental health disorder compared to those unlikely to have a disorder were more likely to have been bullied i the last year in person (36.9% versus 7.6%) and online (10.8% versus 2.6%).

Among young people aged 17-23 years, those with probable mental health disorder compared to those unlikely to have a disorder were less likely to feel very or quite optimistic about their future in terms of job prospects (30.9% versus 70.2%), having enough money (21.5% versus 61.1%), having somewhere secure to live (42.2% versus 76.9%), their health including mental health and wellbeing (24.2% versus 78.0%), their family’s health (42.3% versus 75.9%), the environment (13.4% versus 34.7%), Brexit (5.0% versus 11.2%), COVID-19 (27.0% versus 48.9%), relationships with friends (53.5% versus 87.7%), and relationships with family (70.0% versus 92.0%).

Eating Disorders

Within the Mental Health of Children and Young People in England 2023, screening was also undertaken for possible eating problems. The prevalence estimates were 9.8% for males and 14.9% for females among 11-16 year olds, 42.3% for males and 77.5% for females among 17-19 year olds, and 43.0% for males and 72.3% for females among 20-25 year olds. They report that the prevalence estimates have increased substantially since 2017 although some of the increase could be due to better awareness and recording.

Among those aged 11-16 years, it was estimated that 0.0% of males and 0.4% of females had anorexia nervosa, 0.2% of males and 0.8% of females had bulimia nervosa, and 0.6% of males and 2.9% of females had other eating disorders, and overall that 1.0% of males and 4.3% of females had any eating disorder.

Among those aged 17-19 years, it was estimated that 0.6% of males and 6.4% of females had anorexia nervosa, 0.0% of males and 3.6% of females had bulimia nervosa, and 4.5% of males and 11.5% of females had other eating disorders, and overall that 5.1% of males and 20.8% of females had any eating disorder.

Among those aged 20-25 years, it was estimated that 0.0% of males and 0.6% of females had anorexia nervosa, 1.9% of males and 1.6% of females had bulimia nervosa, and 1.6% of males and 6.9% of females had other eating disorders, and overall that 3.6% of males and 8.5% of females had any eating disorder.

Based on the Office for National Statistics resident population estimates for 2024, there are 11,026 males and 20,697 females aged 11-16 years, 5,805 males and 5,121 females aged 17-19 years, and 10,664 males and 9,783 females aged 20-25 years. If the prevalence estimates above for England are applied to Hull’s population, it is possible to obtain the estimated number of children and young people in Hull with an eating disorder. It is possible figures are higher in Hull as it is likely that increased mental health needs, poverty, vulnerability and levels of child obesity increase the risk.

SexEating disorderAged 11-16Aged 17-19Aged 20-25
AllAnorexia nervosa4436264
Bulimia nervosa111185365
Other eating disorder394850851
Any eating disorder5641,3641,215
MaleAnorexia nervosa0330
Bulimia nervosa240207
Other eating disorder81263175
Any eating disorder105267382
FemaleAnorexia nervosa4432964
Bulimia nervosa87185158
Other eating disorder313587676
Any eating disorder4591,067833
Number of children and young people in Hull unlikely to have an eating disorder estimated from age-specific prevalence estimates from England in 2023 applied to Hull’s resident population estimates for mid-year 2024

National Estimates of Poor Mental Health Applied to Hull

Nationally, the numbers of young people aged 15 year with mental health issues has been estimated for a classroom of 30 pupils.

Numbers experiencing different mental health issues in a classroom of 30 pupils of 15 year olds

The most common disorder in early years and primary school are behavioural disorders and the most common in secondary school and post 16 establishments are emotional disorders. Early intervention is key to reducing this prevalence.

Prevalence is increasing both nationally and locally. There are also marked gender differences, for instance, older girls are more likely to experience emotional disorders.

The prevalence of mental ill health is higher amongst vulnerable groups of children and young people:

  • LGBT+ young people are more likely to have a diagnosable mental health problem (34.9% compared to 13.2%).
  • Mental health problems are more common in children living in lower income households (9.0% compared to 4.1%).
  • Children living with a parent with poor mental health are the most at risk group.
  • Over a third of 5 to 19 year olds with a mental health problem (35.6%) were also recognised as having special educational needs.
  • School exclusions are more common in children with a mental health difficulty (6.8%) than those without (0.5%).
  • Other risk factors include poor housing, being in or leaving care, being a young carer or experiencing bereavement.

Looked After Children

Just under half of looked after children in Hull had levels of emotional wellbeing which was a cause for concern in 2023/24 which was higher than England and the region.

This relates to children aged 5-16 years at the date of their latest assessment who have been in care for at least 12 months on the 31 March of the year whose strengths and difficulties questionnaire (SDQ) score is 17 or more.

Compared with benchmark
Better
Similar
Worse

Not Compared

Lower
Similar
Higher
Indicator Period
England
Yorkshire and the Humber region (statistical)
Kingston upon Hull
East Riding of Yorkshire
North East Lincolnshire
North Lincolnshire
York
North Yorkshire UA
Barnsley
Doncaster
Rotherham
Sheffield
Bradford
Calderdale
Kirklees
Leeds
Wakefield
Percentage of looked after children whose emotional wellbeing is a cause for concern
(Persons 5-16 yrs)
2024/25 42.0 45.0 53.0 50.0 45.0 47.0 45.0 50.0 56.0 43.0 44.0 52.0 31.0 46.0 46.0 42.0 49.0
Indicator Period
England
Yorkshire and the Humber region (statistical)
Kingston upon Hull
East Riding of Yorkshire
North East Lincolnshire
North Lincolnshire
York
North Yorkshire UA
Barnsley
Doncaster
Rotherham
Sheffield
Bradford
Calderdale
Kirklees
Leeds
Wakefield
Percentage of looked after children whose emotional wellbeing is a cause for concern
(Persons 5-16 yrs)
2024/25 42.0 45.0 53.0 50.0 45.0 47.0 45.0 50.0 56.0 43.0 44.0 52.0 31.0 46.0 46.0 42.0 49.0

Office for Health Improvement & Disparities. Public Health Profiles. 2026 https://fingertips.phe.org.uk © Crown copyright 2026

There has been some year-on-year variation in the percentage of looked after children whose emotional wellbeing is a cause for concern, but for most years there has been no statistically significant difference in the percentage between Hull and England (except for 2018/19 when the percentage in Hull was significantly lower than England). However, in the last year the percentage has increased in Hull and for 2023/24, the percentage is statistically significantly higher than England.

Compared with benchmark
Better
Similar
Worse

Not Compared

Lower
Similar
Higher
Percentage of looked after children whose emotional wellbeing is a cause for concern (Persons 5-16 yrs)
Period
Kingston upon Hull
Yorkshire and the Humber region (statistical)
England
Count
Value
95%
Lower CI
95%
Upper CI
2015/16 • 39 39.0% 30.0% 48.8% 39.1% 37.8%
2016/17 • 40 41.7% 32.3% 51.7% 42.8% 38.1%
2017/18 • 41 46.1% 36.1% 56.4% 42.7% 38.6%
2018/19 • 74 28.0% 22.5% 33.1% 41.0% 39.0%
2019/20 • 134 38.0% 33.2% 43.2% 40.0% 38.0%
2020/21 • 135 34.0% 29.1% 38.3% 39.0% 37.0%
2021/22 • 140 34.0% 29.6% 38.7% 39.0% 37.0%
2022/23 • 139 42.0% 36.7% 47.2% 43.0% 40.0%
2023/24 • 188 48.0% 43.2% 53.0% 42.0% 41.0%
2024/25 • 196 53.0% 47.6% 57.7% 45.0% 42.0%

Source: Department for Education

Office for Health Improvement & Disparities. Public Health Profiles. 2026 https://fingertips.phe.org.uk © Crown copyright 2026

Presenting Issues for Local Young People

The main presenting issues for young people accessing Hull’s Targeted Early Help / Getting Help programme were as follows:

Figure showing the main presenting issues for young people

The main presenting issues for parents were as follows:

Figure showing the main presenting issues for parents

Worsening Levels of Vulnerability Among Young People in England Following the Pandemic

The Centre for Young Lives’ 2025 State of Childhood Vulnerability report, which was published in July 2025, warns that the COVID-19 pandemic is still casting a long shadow over millions of children in England five years on.

They state that many measures of vulnerability such as poverty, children’s mental health, Special Educational Needs, school attendance, and the number of children going into social care have worsened and continued to hold children back since the pandemic. The report shows how since the pandemic more children are living in poverty and temporary accommodation, how school absence, exclusion0s and home education have rocketed, and how the number of children with Special Educational Needs continues to soar, how many more children are being taking into care, and how many more children and young people are struggling with a diagnosable mental health problem.

They summarise some of the statistics for England (some of the changes could be due – at least in part – to increased awareness, recognition and recording of information):

  • One-third of children in the UK are living in relative poverty in the UK for 2023/24 (the figure is higher in Hull).
  • There has been an increase of one-third in the number of children living in temporary accommodation between 2018/19 and 2023/24.
  • The percentage of children who are persistently absent from school has almost doubled from 2018/19 to 2023/24.
  • Almost 50,000 children were in alternative provision in 2024/25 which is an increase of 82% since 2018/19.
  • At least 153,3000 children were electively home educated in 2023/24 an increase of almost one-third since 2021/22.
  • Almost one million young people aged 16-24 years were not in education, employment or training in the UK between January and March 2025 which is an increase of 19% since January and March 2019.
  • The number of children who were looked after has increased between 2018 and 2024 by 11% with a doubling among young people aged 16+ years entering the care system between 2013 and 2023.
  • Almost one-third of adults where domestic abuse is reported had children aged under 16 years present in the household in 2023 which is an increase of 30% since 2017/18.
  • There has been an increase of one-third in the number of children with Special Educational Needs between 2017/18 and 2023/24.
  • There has been a 90% increase in the children who have an Education, Health and Care Plan between 2017/18 and 2023/24.
  • The number of children identified as autistic has more than doubled between 2017/18 and 2024/25.
  • One in five children and young people aged 8-16 years had a diagnosable mental health condition in 2023 which has increased from one in ten in 2017.
  • Child criminal exploitation was identified in 15,600 children in need assessments in 2024 which is an increase of over 50% since 2022.
  • One in five 13-17 year olds have been a victim of violence in 2024 which has increased from 14% in 2022.

The report argues that taken together, these indicators reveal a generation of post-COVID children facing vulnerabilities that threaten to shape their futures long into adulthood. Behind every number is a child who needs support – often facing multiple, overlapping challenges that can be rooted in poverty, instability, and inequality. The report also notes that there are many children that the data does not capture. Some of the most vulnerable children are continuing to slip under the radar entirely. Not only do they not appear in the data, but often they are not receiving any support at all.

From the Health Foundation’s report into children and young people’s mental health and ‘COVID-19 and the road ahead’, they state that mental health conditions have become more common since the start of the pandemic. They estimate that between 2017 and 2021, the percentage of 6 to 16 year olds with a probable mental health conditi0n increased from one in nine (11.6%) to one in six (17.4%). They recognise that increased awareness and recognition of mental health conditions in children and young people may have contributed to the increase, but they indicate that the prevalence of mental heath conditions is likely increasing. Girls aged 17-19 years had the highest increases in prevalence almost doubling from one in seven (13.4%) in 2017 to one in four (24.8%) in 2021, but boys of the same age showed no statistically significant change over time. In 2021, children and adolescents with a probable mental health condition were twice as likely to live in households newly falling behind on bills (12.8%, compared with 6.7% of 6 to 16-year-olds without a mental health condition).

Societal changes in the last few years in relation to social media is considered to adversely affect children and young people’s mental health and emotional wellbeing.

Their report also details the referrals into Children and Young People Mental Health Services (CYPMHS) for England. They state that the rate of new referrals to CYPMHS initially slowed after March 2020, when schools closed due to COVID-19 restrictions and families had to navigate changes in access to primary care. In April 2020, a month after the first lockdown started in England, new referrals were 35% lower than a year before and they did not recover to previous levels until July 2020. After this point, they rapidly accelerated and subsequently reached a record high of 100,000 new referrals per month in May 2021. They state that the data show encouraging signs that CYPMHS capacity has also expanded to treat an increasing number of children and young people, as shown by the number of first-time appointments for those younger than 18. In 2020, during the first COVID-19 wave, the number of first contacts initially slowed but later recovered to previous levels. In 2021, based on data from January to September, there were on average over 55,000 first contacts per month, an increase of 17% compared with the same period in 2020. According to NHS Digital monthly mental health statistics, over 340,000 children and young people were in contact with CYPMHS in July 2021, meaning they were waiting to commence treatment or currently receiving treatment – the highest number ever recorded. Comparing the period between January and September, the number of people in contact with CYPMHS was 24% higher in 2021 than in 2020, and 44% higher than in 2019. This increase is partly related to changes in reporting, with the number of providers submitting data increasing over time. They state that changes in reporting methodology have created additional challenges in determining the extent to which the CYPMHS caseload has increased.

Self-Harm

Information relating to self-harm among young people aged 10-24 years is presented under Suicide and Self-Harm within Adults.

Strategic Need and Service Provision

In order to improve mental health and wellbeing, WHO state that it is necessary to have an environment that supports mental health. National mental health policies should be concerned both with mental disorders and, with broader issues that promote mental health. Mental health promotion should be mainstreamed into governmental and nongovernmental policies and programmes. In addition to the health sector, it is essential to involve the education, labour, justice, transport, environment, housing, and welfare sectors.

Both adults and children with general mental health issues need to be identified early and encouraged to seek help early so that the consequences in terms of the effects on family, education and employment are minimised, and issues are not escalated so to reduce the need for crisis and/or medical interventions. It should be recognised that specific groups of people may be more likely to have mental health issues due to their circumstances, such as poverty, asylum seekers, social isolation. There is a need to improve and expand early help and targeted interventions to improve young people’s emotional health and wellbeing and build resilience to enable them to cope with challenging life events.

In 2018 NHS England set out its ten year long term plan for the priorities to be delivered for children and young people.

  • Additional investment in community based mental health services.
  • The creation of mental health support teams in schools and colleges.
  • Safe places and crisis cafés open 24/7 to support young people.
  • Home Intensive Treatment teams to support young people in their own home and the community to reduce the need for in patient beds.
  • Additional investment into community eating disorder services and prevention and promotion offers.

Prevention and early intervention relating to children and young people in terms of the Thriving, Getting Advice and some aspects of Getting Help, encompass only part of the whole mental health system for Hull. More information on mental health and emotional wellbeing and early intervention is also available under Early Help and Prevention under Child Development within Children and Young People.

Hull has adopted the THRIVE Framework to describe and organise system efforts in relation to children and young people’s emotional and mental health. For more information on the Thrive Framework and an up-to-date list of services available to support children and young people’s emotional and mental health, mapped against the THRIVE model in Hull, please visit: https://www.howareyoufeeling.org.uk

THRIVE model
THRIVE model

It is recognised the mental and emotional wellbeing has been detrimentally affected for many children and young people due to COVID-19 and lockdowns. Furthermore, the effect has not been felt evenly across society and the most vulnerable have generally been affected the worst, increasing the inequalities gap. Recognition is not sufficient and increased resources need to be made available to improve mental health and emotional wellbeing in children and young people.

A Mentally Healthy Hull strategy has been produced which looks at how, as a city, we can collectively boost good mental health and prevent and reduce the impact of mental health problems.

MentallyHealthyHull

Resources

National Institute for Health and Care Excellence, Social and emotional wellbeing for children and young people: Local government briefing.  www.nice.org.uk. 2013, National Institute for Health and Care Excellence: London.

World Health Organization. Mental health: strengthening our response: https://www.who.int/news-room/fact-sheets/detail/mental-health-strengthening-our-response

WHO Special Initiative for Mental Health (2019-2023): Universal Health Coverage for Mental Health. World Health Organisation, 2019. https://apps.who.int/iris/handle/10665/310981

Hull’s Young People Health and Wellbeing Survey

Mental Health of Children and Young People in England, 2017. Official statistics, survey. NHS Digital, November 2018.

Mental Health of Children and Young People in England, 2017 [PAS] – NDRS (digital.nhs.uk)

Mental Health of Children and Young People in England, 2023 – wave 4 follow up to the 2017 survey. https://digital.nhs.uk/data-and-information/publications/statistical/mental-health-of-children-and-young-people-in-england/2023-wave-4-follow-up

State of the Nation 2021: Children and Young People’s Wellbeing. Research report. Department for Education, February 2022. https://www.gov.uk/government/publications/state-of-the-nation-2021-children-and-young-peoples-wellbeing

State of the Nation 2022: Children and Young People’s Wellbeing. Research report. Department for Education, February 2023. https://www.gov.uk/government/publications/state-of-the-nation-2022-children-and-young-peoples-wellbeing

Strengths and Difficulties Questionnaire. https://www.sdqinfo.org/

The Health Foundation. Children and young people’s mental health. COVID-19 and the road ahead. https://www.health.org.uk/news-and-comment/charts-and-infographics/children-and-young-people-s-mental-health

NHS Digital. Mental Health Services Monthly Statistics. https://digital.nhs.uk/data-and-information/publications/statistical/mental-health-services-monthly-statistics

THRIVE Framework. https://www.annafreud.org/mental-health-professionals/thrive-framework/

How are you feeling today? THRIVE Hull. https://www.howareyoufeeling.org.uk/

Centre for Young Lives. Centre for Young Lives’ 2025 State of Childhood Vulnerability report warns the Covid pandemic is still casting a long shadow over millions of children in England five years on | Centre for Young Lives | Press Release, July 2025.

Updates

This page was last updated / checked on 21 April 2026.

This page is due to be updated / checked in September 2026.
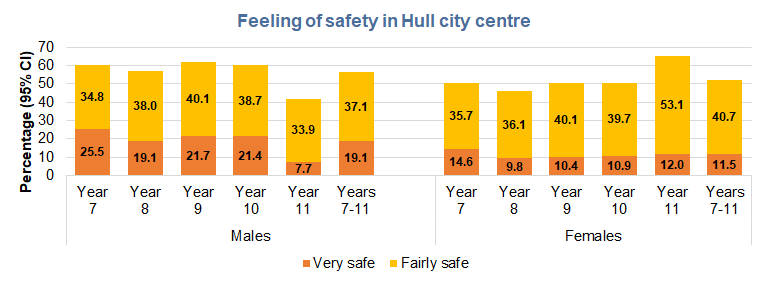
Health and Wellbeing Influences

This section covers statistics information relating to external factors which affect health such as Air Pollution, Climate Change, Crime, Deprivation and Poverty, Domestic Abuse, Employment, Economy and Healthy Workplaces, Financial Resilience, Housing and Households, Schools, Education and Qualifications, and Young People Not in Education, Employment or Training.

Lifestyle and behavioural factors are examined under Lifestyle Factors within Adults and under Lifestyle Factors within Children and Young People. Further information on external factors and lifestyle and behavioural factors from quantitative surveys and qualitative research undertaken can be found within Surveys Conducted in Hull under Tools and Resources.

Further information on Hull is given within Geographical Area and within the Ward Profiles under Place.

Everything affects our health and wellbeing. There are factors that cannot be changed such as age, gender and hereditary factors. However, lifestyle and behaviour, the local community, economy, and environment all influence health and wellbeing. Whilst these other factors are less ‘fixed’, they are often very difficult to change.

From the A Matter of Life and Death report, the impact of these wider determinants of health are discussed in relation to life expectancy. They state that “Some people are dying years younger than they should. Poverty, poor-quality housing, low-paid and unstable jobs all impact people’s physical and mental health. When people don’t have things they need for good health – like warm homes and nutritious food – and are constantly worrying about making ends meet, it puts a strain on their bodies, resulting in increased stress, high blood pressure, and a weaker immune system.”

Barton and Grant (2006) illustrate the determinants of health and wellbeing which is an extension of Dahlgren and Whitehead’s 1991 model.

Image showing relationship between health and other factors such as lifestyle, community and economy

This section examines some of these external and environmental influences and factors which impact on people’s health and wellbeing.

Air Pollution

Climate Change

Crime

Deprivation and Poverty

Domestic Abuse

Employment, Economy and Healthy Workplaces

Financial Resilience

Housing and Households

Schools, Education and Qualifications

Young People Not in Education, Employment or Training

Other lifestyle and behavioural factors such as alcohol consumption, diet and nutrition, drug use, healthy weight, physical activity, and smoking are examined in Lifestyle Factors under the Adults and Children sections (plus gambling for adults).

Adult Lifestyle Factors

Children and Young People Lifestyle Factors

Further information on health, emotional wellbeing, and lifestyle and behavioural factors which influence health are found in our Health and Wellbeing Survey reports under the Tools and Resources menu. Numerous local surveys have been completed in Hull since 2002 among adults (16+ years) and secondary school pupils, and some of the reports examine associations between health and behaviours in relation of specific characteristics of individuals such as deprivation levels of where they live, their employment status, as well as in relation to their age and gender. Some qualitative research has also been undertaken in Hull several years ago which examines resident’s perceptions of their health and their lifestyle and behaviour which influence health.

Local Surveys Involving Adults

Local Surveys Involving Young People

Other Local Surveys and Qualitative Research

Information about the Hull and the wards in Hull can be found under the Place menu.

Geographical Area

Ward Profiles

Resources

L’Hôte E, Castellina M, Volmert A, Conklin L, and O’Shea P. A Matter of Life and Death: Explaining the Wider Determinants of Health in the UK. FrameWorks, 2022. Commissioned by The Health Foundation. https://www.health.org.uk/publications/a-matter-of-life-or-death

Updates

This page was last updated / checked on 12 March 2026.
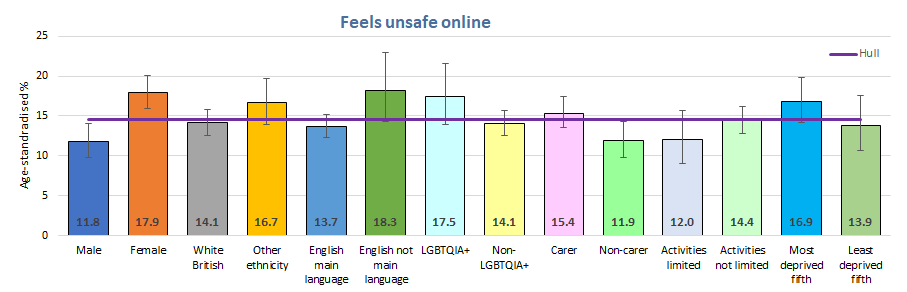
This page is due to be updated / checked in March 2027.
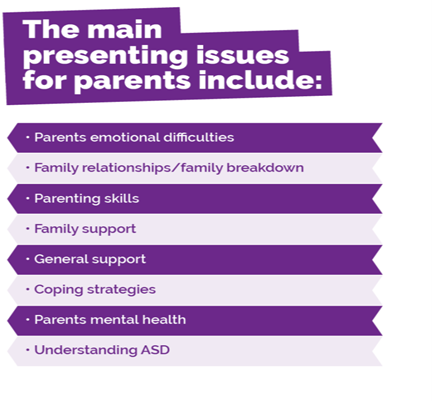
  • « Previous Page
  • Page 1
  • Page 2
  • Home
  • Glossary
  • Accessibility
  • Contact Us

© Copyright Hull Joint Strategic Needs Assessment 2026

  • HOME
    • Hull’s JSNA
    • Key Facts for Hull
  • POPULATION
    • Population Estimates
    • Race and Ethnicity
    • Population Projections
    • Life Expectancy and Healthy Life Expectancy
    • Causes of Death
  • VULNERABLE GROUPS
    • Carers
    • Children with Special Educational Needs
    • Gender Identity and LGBTQ+
    • Gypsy and Travellers
    • Homelessness
    • Inclusion Health
    • Learning Disabilities
    • Looked After Children and Care Leavers
    • Mental Ill Health
    • Migrant Health
    • Multiple Unmet Needs
    • Sensory Impairment
    • Veterans
  • ADULTS
    • HEALTH FACTORS
      • Physical Health
      • Mental Health and Emotional Wellbeing
      • Cancer
      • Cardiovascular Disease
      • Coronavirus (COVID-19)
      • Dementia
      • Diabetes
      • Epilepsy
      • Falls and Frailty
      • Infectious Diseases
      • Kidney Disease
      • Liver Disease
      • Musculoskeletal Disorders
      • Oral Health
      • Palliative Care and End of Life
      • Respiratory Disease
      • Sexual and Reproductive Health
      • Sexually Transmitted Infections
      • Suicide and Self-Harm
    • LIFESTYLE FACTORS
      • Alcohol
      • Diet and Nutrition
      • Drugs
      • Gambling
      • Healthy Weight
      • Physical Activity
      • Smoking and Vaping
    • PREVENTION
      • Screening and the NHS Health Check
      • Vaccinations
  • CHILDREN AND YOUNG PEOPLE
    • HEALTH FACTORS
      • Physical Health
      • Mental Health and Emotional Wellbeing
      • A&E Attendances and Hospital Admissions
      • Accidents and Injuries
      • Neurodiversity
      • Oral Health
      • Screening and Vaccinations
      • Under 18 Conceptions
    • LIFESTYLE FACTORS
      • Alcohol
      • Diet and Nutrition
      • Drugs
      • Gambling
      • Healthy Weight
      • Physical Activity
      • Smoking and Vaping
    • PREGNANCY AND INFANTS
      • Pregnancy and Maternal Health
      • Births and Infant Health
      • Breastfeeding
      • Smoking in Pregnancy
      • Stillbirths and Infant Mortality
    • CHILD DEVELOPMENT
      • Early Years and Good Child Development
      • Early Help and Prevention Programme
  • PLACE
    • Geographical Area
    • Ward Profiles
    • Primary Care Profiles
  • HEALTH AND WELLBEING INFLUENCES
    • Air Pollution
    • Climate Change
    • Crime
    • Deprivation and Poverty
    • Domestic Abuse
    • Employment and the Labour Market
    • Financial Resilience
    • Housing and Households
    • Schools, Education and Qualifications
    • Young People Not in Education, Employment or Training
  • TOOLS AND RESOURCES
    • Contact Us
    • HELP – GLOSSARY AND SITE MAP
      • Glossary
      • Where Do I Find The Information I Want?
      • Contents Page / Site Map
    • SURVEYS CONDUCTED IN HULL
      • Local Surveys Involving Adults
      • Local Surveys Involving Young People
      • Other Local Surveys and Research
    • Local Quality and Outcomes Framework Data
    • Director of Public Health Annual Reports
    • Health and Wellbeing Strategy
    • Pharmaceutical Needs Assessment
    • Reporting An Outbreak or Other Issue