Index
This topic area covers statistics and information relating to homelessness in Hull including local strategic need and service provision. Information on the impact of Housing on health and data on housing type and household composition is covered within the Health and Wellbeing Influences section. A needs assessment was completed in Hull during 2023 for people with multiple unmet needs which included people who were homeless. The report – which was finalised in 2024 – is available within Multiple Unmet Needs under Vulnerable Groups.
This page contains information from the Office for Health Improvement & Disparities’ Fingertips. Information is taken ‘live’ from the site so uses the latest available data from Fingertips and displays it on this page. As a result, some comments on this page may relate to an earlier period of time until this page is next updated (see review dates at the end of this page).
Headlines
- Homelessness describes a variety of circumstances: people who are roofless (rough sleeping), those living informally with friends or acquaintances (for instance, “sofa surfing”) as well as those threatened with the loss of, or are unable to continue with, their current accommodation. The term also covers those who are living in temporary accommodation, for instance, hostels or living in bed and breakfast accommodation.
- A household is considered statutorily homeless if a local authority decides that they do not have a legal right to occupy accommodation that is accessible, physically available and which would be reasonable for the household to continue to live in.
- Homelessness is more likely to occur in populations who already experience wider inequalities, for instance, those experiencing financial hardship. Furthermore, people living in more deprived areas may be less likely to be able to have the resources to move to new accommodation if they are at risk of homelessness, and are therefore probably more likely to seek help and be recorded in statutory homeless figures.
- The physical and mental health needs of people that are at risk of homelessness is likely to be worse than the general population. The prevalence of behavioural and lifestyle risk factors such as smoking, poor diet, drugs and alcohol are also higher. Those who are homeless repeatedly are also significantly more likely to use acute health services more frequently than the general population.
- Homelessness severely affects life expectancy. In England and Wales the average age of death of a homeless person is 45 for men and 43 for women, compared to 76 and 81 years amongst the general population.
- The rate of households owed a duty under the Homeless Reduction Act is more than twice as high as England for 2024/25 (30.4 versus 13.6 households owed a duty under the Act per 1,000 households) as is the rate of such households with dependent children (28.6 versus 16.2 households per 1,000 households) and the rate of such households where the main applicants is aged 16-24 years (6.5 versus 2.4 households per 1,000 households). The rate of such households where the main applicants is aged 55+ years is also higher in Hull but is less than twice as high as England (5.6 versus 3.8 households per 1,000 households).
- Whilst the number of households in temporary accommodation much lower in Hull compared to England, the number has increased substantially from 0.4 to 1.7 households in temporary accommodation per 1,000 households between 2019/20 (pre-pandemic) to 2024/25. This equates to an increase of 325% (latest rate is more than four times the original rate) in Hull over the last five years compared to an increase of 200% across the region (a tripling of rates) and a 37% increase for England.
- The waiting lists for accommodation are currently high in Hull with demand significantly outstripping supply.
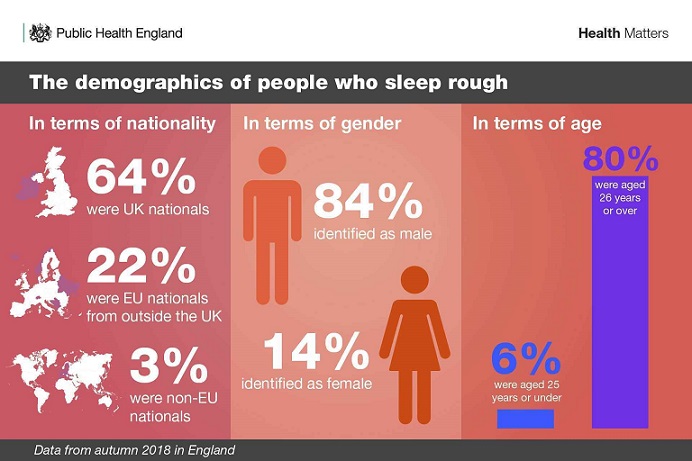
- It was estimated that there were 36 rough sleepers in Hull during the Autumn rough sleeping (snapshot) undertaken in October 2025. This represents an increase since pre-pandemic levels (18 rough sleepers in 2019), and an increase in the last year from 31, although the number was 39 in 2023 so the latest number for 2025 represents a decrease since 2023. It is estimated that there are 8.2 rough sleepers in Hull per 100,000 population which is higher than the region (5.8), and whilst it is lower than England (13.1) it is higher than the rest of England excluding London which has a particularly high rate (7.1). These figures do not include the ‘hidden homeless’ (for instance, those who were “sofa surfing” with friends and family) so is likely to be an underestimate of the true picture of need. In 2025, almost all of the people who were rough sleepers were male (31), almost all were aged 26+ years (32) and most were from the UK (28).
- In 2021, based on local information, there are 40-60 people with multiple unmet needs who are at risk of being homeless but who are reluctant to engage with services and are not eligible for re-housing due to past tenancy history or other barriers.
- It is likely due to changes in employment circumstances throughout the COVID-19 pandemic, that many households have fallen into arrears with rent and mortgage payments, and that the impact of the pandemic on homelessness is likely to be felt for a considerable time. Furthermore, immediately following the pandemic, the increased cost of living crisis is having a significant negative impact on people’s ability to maintain their accommodation.
- Hull’s Preventing Homeless Strategy and action plan has two key priorities improving access to housing and preventing homelessness, and relieving homelessness and preventing rough sleeping.
- The quarterly Preventing Homelessness Focus Group meetings provides a multi-agency forum for partners to work jointly on preventing homelessness and developing appropriate services and support for people who are homeless.
The Population Affected – Why Is It Important?
People described as homeless is anyone sleeping rough (or with ‘no fixed abode’) or under imminent threat of losing, or unable to continue with, their current accommodation.
The Homelessness Reduction Act introduced new duties which means that significantly more households are being provided with a statutory service by local housing authorities than before the Act came into force in April 2018. The Homeless Reduction Act introduced new prevention and relief duties, that are owed to all eligible households who are homeless or threatened with becoming homeless, including those single adult households who do not have ‘priority need’ under the legislation.
Poor health can both contribute to, and result from, homelessness and homelessness in early years can damage a child’s life chances. The physical and mental health needs of people are homeless is much worse than the general population, and they attend A&E much more frequently and use four times as many acute hospital services than the general population, with a high cost to the NHS and public services. The prevalence of behavioural and lifestyle risk factors such as smoking, poor diet, drugs and alcohol are also higher than in the general population. From the Office for National Statistics, the average age at death of a homeless person was 45 years for males and 43 years for females in 2018; compared to 76 years for men and 81 years for women amongst the general population.
Homelessness is more likely in populations who already experience wider inequalities, for example, those with mental health or substance treatment needs, experiencing domestic abuse, involved with criminal justice system and those with multiple and complex needs, Gypsies and Travellers, sex workers, and migrant workers, refugees and asylum seekers.
Homelessness is bad for all our health, and wealth. Homelessness is a measure of our collective success, or otherwise, in reducing inequalities.
The Hull Picture
Homeless
The Office for Health Improvement & Disparities’ Fingertips includes information on the numbers of homeless households.
The number of households owed a prevention or relief duty under the Homelessness Reduction Act, during the financial year. Prevention duties include any activities aimed at preventing a household threatened with homelessness within 56 days from becoming homeless. Relief duties are owed to households that are already homeless and require help to secure settled accommodation. The figures all relate to the crude rate per 1,000 estimated households.
The rate of homeless households owed a duty under the Homeless Reduction Act in Hull for 2024/25 was more than twice as high as England and the Yorkshire and Humber region with 30.4 homeless households per 1,000 households compared to 13.6 homeless households per 1,000 households for England.
Compared with benchmark
| Indicator | Period | England | Yorkshire and the Humber region (statistical) | Kingston upon Hull | East Riding of Yorkshire | North East Lincolnshire | North Lincolnshire | York | North Yorkshire UA | Barnsley | Doncaster | Rotherham | Sheffield | Bradford | Calderdale | Kirklees | Leeds | Wakefield |
|---|---|---|---|---|---|---|---|---|---|---|---|---|---|---|---|---|---|---|
Homelessness: households owed a duty under the Homelessness Reduction Act (Not applicable Not applicable) | 2024/25 | 13.6 | 13.1 | 30.4 | 7.7 | 19.0 | 12.6 | 9.1 | 8.9 | 8.1 | 17.3 | 13.8 | 13.5 | 11.7 | 12.8 | 10.2 | 16.9 | 9.0 |
The rate in Hull is much higher than all other local authorities in the region. It is speculated that rates are higher in Hull because of the increased deprivation and poverty. It is likely that people in Hull are more likely to seek help for homelessness whereas people in more affluent area may have the resources to deal with the risk of homelessness themselves.
Compared with benchmark
Homelessness: households owed a duty under the Homelessness Reduction Act (Not applicable Not applicable) 2024/25
| Area |
Recent
Trend |
Count
|
Value
|
95%
Lower CI |
95%
Upper CI |
|
|---|---|---|---|---|---|---|
| England | 330410 | 13.6 | 13.5 | 13.6 | ||
| Yorkshire and the Humber region (statistical) | 31280 | 13.1 | 12.9 | 13.2 | ||
| Kingston upon Hull | 3462 | 30.4 | 29.4 | 31.4 | ||
| East Riding of Yorkshire | 1185 | 7.7 | 7.3 | 8.1 | ||
| North East Lincolnshire | 1361 | 19.0 | 18.0 | 20.0 | ||
| North Lincolnshire | 956 | 12.6 | 11.8 | 13.5 | ||
| York | 807 | 9.1 | 8.5 | 9.8 | ||
| North Yorkshire UA | 2500 | 8.9 | 8.5 | 9.2 | ||
| Barnsley | 924 | 8.1 | 7.6 | 8.6 | ||
| Doncaster | 2364 | 17.3 | 16.6 | 18.0 | ||
| Rotherham | 1605 | 13.8 | 13.2 | 14.5 | ||
| Sheffield | 3402 | 13.5 | 13.1 | 14.0 | ||
| Bradford | 2446 | 11.7 | 11.2 | 12.1 | ||
| Calderdale | 1227 | 12.8 | 12.1 | 13.5 | ||
| Kirklees | 1902 | 10.2 | 9.8 | 10.7 | ||
| Leeds | 5703 | 16.9 | 16.5 | 17.4 | ||
| Wakefield | 1435 | 9.0 | 8.5 | 9.4 |
Source: OHID, based on Ministry of Housing, Communities and Local Government and Office for National Statistics data
Between 2019/20 and 2020/21, the number of households owed a duty under the Homeless Reduction Act reduced in Hull likely associated with the COVID-19 pandemic. The Coronavirus Act 2020 provided protection to social and private tenants by delaying when landlords could evict tenants in certain situations. The provisions in the Act increased the notice periods landlords were required to provide to tenants when seeking possession of a residential property between 26 March 2020 and 30 September 2021. Between 1 June 2021 and 30 September 2021, notice periods were required to be at least four months except in the most serious cases such as egregious rent arrears or anti-social behaviour. From 1 October 2021, all notice periods returned to the pre-pandemic position. As well as the impact of the pandemic, the cost of living crisis has impacted greatly on household finances, with increasing numbers of households falling behind on rent and mortgages in Hull which impacts on homelessness.
The number of households owed a duty under the Homeless Reduction Act has increased in Hull sharply between 2020/21 and 2021/22 with a small increase in the rate between 2021/22 and 2024/25 (no data was available for Hull for 2022/23).
There were 3,462 households in Hull who owed a duty under the Homeless Reduction Act during 2024/25.
Compared with benchmark
Homelessness: households owed a duty under the Homelessness Reduction Act (Not applicable Not applicable)
|
Period
|
Kingston upon Hull |
Yorkshire and the Humber region (statistical)
|
England
|
||||
|---|---|---|---|---|---|---|---|
|
Count
|
Value
|
95%
Lower CI |
95%
Upper CI |
||||
| 2019/20 | • | 2969 | 26.2 | 25.2 | 27.1 | 12.8 | 12.3 |
| 2020/21 | • | 2530 | 22.3 | 21.4 | 23.2 | 11.4 | 11.3 |
| 2021/22 | • | 3299 | 29.0 | 28.1 | 30.0 | 12.0 | 11.7 |
| 2023/24 | • | 3331 | 29.3 | 28.3 | 30.3 | 13.2 | 13.4 |
| 2024/25 | • | 3462 | 30.4 | 29.4 | 31.4 | 13.1 | 13.6 |
Source: OHID, based on Ministry of Housing, Communities and Local Government and Office for National Statistics data
Information is also given for homeless households with dependent children. The rates in Hull are much higher than England with 28.6 homeless households with dependent children per 1,000 households compared to 16.2 households for England.
Dependent children are those who are aged under 18 years and living at home, but an 18 year old can also count as dependent if they’re in full time education or can’t support themselves for other reasons, and they live at home.
Compared with benchmark
| Indicator | Period | England | Yorkshire and the Humber region (statistical) | Kingston upon Hull | East Riding of Yorkshire | North East Lincolnshire | North Lincolnshire | York | North Yorkshire UA | Barnsley | Doncaster | Rotherham | Sheffield | Bradford | Calderdale | Kirklees | Leeds | Wakefield |
|---|---|---|---|---|---|---|---|---|---|---|---|---|---|---|---|---|---|---|
Homelessness - households with dependent children owed a duty under the Homelessness Reduction Act (Not applicable Not applicable) | 2024/25 | 16.2 | 14.3 | 28.6 | 13.1 | 21.5 | 17.0 | 10.7 | 11.3 | 9.8 | 18.9 | 13.3 | 8.6 | 12.6 | 13.9 | 9.8 | 19.8 | 11.2 |
The pattern is similar for households with dependent children, with the numbers decreasing between 2019/20 and 2020/21 due to increased protection during the pandemic, and have increased sharply between 2020/21 and 2021/22 before remaining relatively unchanged to 2024/25.
There were 948 households owed a duty under the Homeless Reduction Act among households with dependent children in Hull for 2024/25.
Compared with benchmark
Homelessness - households with dependent children owed a duty under the Homelessness Reduction Act (Not applicable Not applicable)
|
Period
|
Kingston upon Hull |
Yorkshire and the Humber region (statistical)
|
England
|
||||
|---|---|---|---|---|---|---|---|
|
Count
|
Value
|
95%
Lower CI |
95%
Upper CI |
||||
| 2019/20 | • | 803 | 26.4 | 24.7 | 28.3 | 13.8 | 14.9 |
| 2020/21 | • | 640 | 21.1 | 19.5 | 22.8 | 12.4 | 11.6 |
| 2021/22 | • | 871 | 28.7 | 26.9 | 30.6 | 14.2 | 14.4 |
| 2023/24 | • | 955 | 28.8 | 27.0 | 30.7 | 14.5 | 16.5 |
| 2024/25 | • | 948 | 28.6 | 26.8 | 30.4 | 14.3 | 16.2 |
Source: Department for Levelling Up, Housing and Communities
The rates of homelessness for households where the main applicant was aged 16-24 years was almost three times higher in Hull compared to England, and much higher in Hull compared to England for households where the main applicant was aged 55+ years for 2024/25.
Compared with benchmark
| Indicator | Period | England | Yorkshire and the Humber region (statistical) | Kingston upon Hull | East Riding of Yorkshire | North East Lincolnshire | North Lincolnshire | York | North Yorkshire UA | Barnsley | Doncaster | Rotherham | Sheffield | Bradford | Calderdale | Kirklees | Leeds | Wakefield |
|---|---|---|---|---|---|---|---|---|---|---|---|---|---|---|---|---|---|---|
Homelessness - households owed a duty under the Homelessness Reduction Act (main applicant aged 16 to 24) (Persons 16-24 yrs) | 2024/25 | 2.4 | 2.7 | 6.5 | 1.3 | 4.3 | 2.1 | 1.9 | 1.3 | 1.4 | 3.9 | 2.9 | 3.4 | 2.4 | 3.0 | 2.6 | 3.1 | 1.5 |
Homelessness - households owed a duty under the Homelessness Reduction Act (main applicant aged 55 and over) (Persons 55+ yrs) | 2024/25 | 3.8 | 2.8 | 5.6 | 2.5 | 3.9 | 3.5 | 2.7 | 2.9 | 1.7 | 3.1 | 2.7 | 2.4 | 1.9 | 3.3 | 2.1 | 3.5 | 1.8 |
There were 760 households owed a duty under the Homeless Reduction Act among households where the main applicant was aged 16-24 years in Hull for 2024/25.
Compared with benchmark
Homelessness - households owed a duty under the Homelessness Reduction Act (main applicant aged 16 to 24) (Persons 16-24 yrs)
|
Period
|
Kingston upon Hull |
Yorkshire and the Humber region (statistical)
|
England
|
||||
|---|---|---|---|---|---|---|---|
|
Count
|
Value
|
95%
Lower CI |
95%
Upper CI |
||||
| 2019/20 | • | 768 | 6.8 | 6.3 | 7.3 | 3.1 | 2.6 |
| 2020/21 | • | 624 | 5.5 | 5.1 | 5.9 | 2.8 | 2.6 |
| 2021/22 | • | 777 | 6.8 | 6.4 | 7.3 | 2.6 | 2.4 |
| 2023/24 | • | 763 | 6.6 | 6.1 | 7.0 | 2.7 | 2.5 |
| 2024/25 | • | 760 | 6.5 | 6.0 | 7.0 | 2.7 | 2.4 |
Source: Ministry of Housing, Communities and Local Government
There were 278 households owed a duty under the Homeless Reduction Act among households where the main applicant was aged 55+ years in Hull for 2024/25.
Compared with benchmark
Homelessness - households owed a duty under the Homelessness Reduction Act (main applicant aged 55 and over) (Persons 55+ yrs)
|
Period
|
Kingston upon Hull |
Yorkshire and the Humber region (statistical)
|
England
|
||||
|---|---|---|---|---|---|---|---|
|
Count
|
Value
|
95%
Lower CI |
95%
Upper CI |
||||
| 2019/20 | • | 174 | 3.9 | 3.3 | 4.5 | 2.3 | 2.9 |
| 2020/21 | • | 163 | 3.6 | 3.1 | 4.2 | 1.8 | 2.3 |
| 2021/22 | • | 232 | 5.2 | 4.5 | 5.9 | 2.3 | 2.8 |
| 2023/24 | • | 259 | 5.2 | 4.6 | 5.9 | 2.7 | 3.5 |
| 2024/25 | • | 278 | 5.6 | 5.0 | 6.3 | 2.8 | 3.8 |
Source: Ministry of Housing, Communities and Local Government
The number of homeless households in temporary accommodation is three times higher in England compared to Hull, but the rate in Hull is higher than the regional average.
The rate is given as the number of households in temporary accommodation per 1,000 households.
Compared with benchmark
| Indicator | Period | England | Yorkshire and the Humber region (statistical) | Kingston upon Hull | East Riding of Yorkshire | North East Lincolnshire | North Lincolnshire | York | North Yorkshire UA | Barnsley | Doncaster | Rotherham | Sheffield | Bradford | Calderdale | Kirklees | Leeds | Wakefield |
|---|---|---|---|---|---|---|---|---|---|---|---|---|---|---|---|---|---|---|
Homelessness: households in temporary accommodation (Not applicable Not applicable) | 2024/25 | 5.2 | 1.5 | 1.7 | 1.5 | 1.4 | 0.9 | 0.7 | 0.9 | 0.4 | - | - | 2.9 | 1.9 | 1.0 | 2.2 | 1.4 | 1.7 |
There are 4.25 times as many households in temporary accommodation in Hull in 2024/25 as there was prior to the pandemic in 2019/20 – an increase of 325%. Whilst there has been an increase across the region and England over the same time period, the increases have been much smaller than the increase in Hull (200% increase for the region and 37% increase for England).
Compared with benchmark
Homelessness: households in temporary accommodation (Not applicable Not applicable)
|
Period
|
Kingston upon Hull |
Yorkshire and the Humber region (statistical)
|
England
|
||||
|---|---|---|---|---|---|---|---|
|
Count
|
Value
|
95%
Lower CI |
95%
Upper CI |
||||
| 2019/20 | • | 49 | 0.4 | 0.3 | 0.6 | 0.5 | 3.8 |
| 2020/21 | • | 89 | 0.8 | 0.6 | 1.0 | 0.8 | 4.0 |
| 2021/22 | • | 100 | 0.9 | 0.7 | 1.1 | 0.9 | 4.0 |
| 2022/23 | • | 115 | 1.0 | 0.8 | 1.2 | 1.0 | 4.2 |
| 2023/24 | • | 154 | 1.4 | 1.2 | 1.6 | 1.2 | 4.6 |
| 2024/25 | • | 197 | 1.7 | 1.5 | 2.0 | 1.5 | 5.2 |
Source: OHID, based on Ministry of Housing, Communities and Local Government and Office for National Statistics data
People Sleeping Rough
An annual survey is undertaken in autumn to count the number of people sleeping rough in each local authority. The survey takes place on a single date chosen by the local authority between 1 October and 30 November. The snapshot takes place in the autumn, rather than the summer where numbers are likely to be higher due to the warmer temperatures, or winter, where numbers may be lower as there are more temporary night shelters set up to ensure people do not sleep on the streets in very cold weather. It includes people sleeping or about to bed down in open air locations and other places including tents and make shift shelters, or people in recreational or organised protest, squatter or traveller campsites. It does not include people in hostels or shelters.
The rates are also given and this is the number of rough sleepers per 100,000 population. The rate in England is between 0.2 and 1.2 percentage points lower when London is excluded from the rate.
For 2025, the rate in Hull at 13.1 rough sleepers per 100,000 population is 60% higher than England. The rate in Hull is almost as high as the rate in London which is always very high (14.0 rough sleepers per 100,000 population) and 85% higher than the rest of England excluding London (where the rate is 7.1 rough sleepers per 100,000 population).
| Year | Hull N | Y&H N | England N | Hull rate | Y&H rate | England rate |
| 2010 | 7 | 115 | 1,768 | 2.7 | 2.2 | 3.4 |
| 2011 | 15 | 150 | 2,181 | 5.9 | 2.8 | 4.1 |
| 2012 | 10 | 157 | 2,309 | 3.9 | 3.0 | 4.3 |
| 2013 | 13 | 129 | 2,414 | 5.0 | 2.4 | 4.5 |
| 2014 | 10 | 126 | 2,744 | 3.8 | 2.4 | 5.0 |
| 2015 | 23 | 160 | 3,569 | 8.8 | 3.0 | 6.5 |
| 2016 | 15 | 172 | 4,134 | 5.7 | 3.2 | 7.5 |
| 2017 | 28 | 207 | 4,751 | 10.5 | 3.8 | 8.5 |
| 2018 | 26 | 246 | 4,677 | 9.7 | 4.5 | 8.4 |
| 2019 | 18 | 242 | 4,266 | 6.7 | 4.4 | 7.6 |
| 2020 | 19 | 181 | 2,688 | 7.1 | 3.3 | 4.8 |
| 2021 | 11 | 166 | 2,443 | 4.1 | 3.0 | 4.3 |
| 2022 | 10 | 170 | 3,069 | 3.7 | 3.1 | 5.4 |
| 2023 | 39 | 270 | 3,898 | 14.3 | 4.8 | 6.7 |
| 2024 | 31 | 385 | 4,667 | 11.3 | 6.8 | 8.0 |
| 2025 | 36 | 329 | 4,793 | 13.1 | 5.8 | 8.2 |
In 2025, 31 of the rough sleepers surveyed in Hull were male and five were female, 28 were from the UK, five were from European Union countries, and three were from non European Union countries. None were aged under 18 years, two were aged 18-25 years of age, and 32 were aged 26+ years with the age of two people unknown.
Between 2018 and 2025 in Hull, the estimated the number of rough sleepers on the chosen night was based on an evidence-based estimate meeting including a spotlight count in specific areas. In Hull, there was consultation with the voluntary sector, police, faith groups, mental health agencies, outreach workers, and drugs and alcohol treatment teams in relation to ascertaining the number of people who were sleeping rough in Hull.
During the COVID-19 pandemic moves were made to reduce the number of people sleeping rough. Nationally, in 2019, the annual survey identified 4,266 rough sleepers. This decreased to 2,688 in 2020, decreasing further to 2,443 in 2021, but has subsequently increased sharply to increase to 4,793 which is higher than it was in 2019. A similar pattern has occurred across the Yorkshire and Humber region, although the number of rough sleepers from 2023 onwards (270 for 2023, 385 for 2024 and 329 for 2025), far exceeds previous levels with the highest number previously recorded for 2018 when it was 246. A similar pattern has also occurred in Hull although the reduction occurred in 2021 with a low figure also in 2022, before increasing sharply in 2023. The numbers in Hull fell in 2024, but has increased in the last year. In Hull, the William Booth House accommodation has closed which could have an influence.
Unsurprisingly London has the highest proportion of rough sleepers, with 27% of all rough sleepers in England being recorded there. Westminster is the local authority with the highest number of rough sleepers – 360 were recorded during the most recent survey.
Across the Yorkshire and Humber region, the number of rough sleepers in 2025 was higher than Hull in Leeds (65) and Sheffield (38), although in 2024, Leeds, Sheffield, Bradford, North Yorkshire, Doncaster and Kirklees all had higher numbers compared to Hull. So the numbers in Hull have increased relative to some other local authorities in the region in the last year. For 2025, one in nine (10.9%) of all the rough sleepers across the Yorkshire and Humber region are in Hull.
The Department for Levelling Up, Housing and Communities produced a Rough Sleeping Snapshot Survey Dashboard displaying information from the autumn 2022 rough sleeping snapshot survey. The dashboard incudes data from earlier years, but it has not been updated so the latest data is for autumn 2022.
Hidden Homeless
Official figures do not show the ‘hidden homeless’ – people staying temporarily with family or friends, living in squats or other insecure accommodation. The charity Crisis estimate about 62% of single homeless are potentially hidden from ‘official’ numbers.
Impact of COVID-19 Pandemic and Cost of Living Crisis on Homelessness
The local authority has been involved in relocating many homeless people from hostels into other temporary accommodation where they were able to self-isolate from other residents where necessary.
Due to the Coronavirus Act 2020 and the increased notice required to provide to tenants when seeking possession of residential property between March 2020 and September 2021, the number of homeless households in Hull decreased between 2019/20 and 2020/21.
However, it is likely due to changes in employment circumstances, that many households have fallen into arrears with rent and mortgage payments or have fallen even more into arrears than they had been prior to the pandemic. Thus the impact of the pandemic on homelessness is likely to be felt for a considerable time.
Following on from the pandemic, the increased cost of energy, food and other products are having a significant negative impact on people’s ability to maintain their accommodation.
Strategic Need and Service Provision
The Homelessness Reduction Act 2017 (in place since April 2018) requires local authorities to undertake a more preventative approach to homelessness and also places a duty on other public agencies to make homelessness referrals. It extends the period within which people are defined as ‘threatened with homelessness’ so that help is provided earlier, and gives a duty to local authorities to assess every eligible applicant’s case and agree a personalised housing plan. The Act also extends the duty to provide an advisory service; to ‘help to secure’ accommodation and extends the ‘prevention duty’.
The launch in 2018 of the Government’s Rough Sleeping Strategy released funding streams, eg. Rough Sleeping Initiative, Rapid Rehousing Pathway, Care Leavers at Risk of Rough Sleeping and a consultation on the use of ‘Homelessness Reduction Boards’.
Hull’s Homelessness Prevention Strategy 2017 and action plan has two key priorities: (i) improving access to housing and preventing homelessness, and (ii) relieving homelessness and preventing rough sleeping. The strategy is due to be updated in Autumn 2022.
Hull City Council runs quarterly Preventing Homelessness Focus Group meetings which provide opportunities for multi-agency discussions on how partners can work together with the Council to prevent homelessness and develop appropriate services and support for people who are homeless.
The key to preventing rough sleeping is making best use of Housing Related Support and expanding/enhancing the outreach offer to include support with specialists in mental health and substance use. The Improving Outcomes Group brings together enforcement activity to tackle antisocial behaviour, begging and crime often associated with rough sleeping.
To respond specifically to the health needs of homeless people, Hull has a homelessness health service (provided by Modality) which focuses on people who are homeless and rough sleepers. It provides a combined a primary care inclusion service and hospital discharge service the latter of which seeks to resolve housing issues on admission to hospital/earlier in the person’s hospital treatment instead of at discharge, so that ongoing healthcare needs can be better met by ensuring appropriate onward housing is in place.
Resources
Live tables on homelessness. https://www.gov.uk/government/statistical-data-sets/live-tables-on-homelessness
The Impact on Health of Homelessness – A Guide for Local Authorities (LGA 2017)
Deaths of homeless people in England and Wales: ONS 2018
PHE Health Matters: Rough Sleeping (Updated Feb 2020)
Updates
This page was last updated / checked on 30 March 2026.
This page is due to be updated / checked in October 2026.