Index
This page gives a summary of the key facts for Hull relating to the health and wellbeing of Hull’s population.
A link to the Health of the Region Data Explorer (previously described as the Picture of Health Intelligence Pack) is also included which has been produced by the local teams at the Office for Health Improvement & Disparities. This summarises the health situation very well, but there is additional sections below this which includes information on Hull’s population and demographics, as well as other factors which influence health and wellbeing such as lifestyle and behavioural factors, and wider determinants of health such as deprivation and poverty, housing, the environment, crime, education and employment.
More detail on these and other individual topic areas can be found throughout our JSNA website (see Where Do I Find The Information I Want? for a list of topic areas).
This page contains information from the Office for Health Improvement & Disparities’ Fingertips. Information is taken ‘live’ from the site so uses the latest available data from Fingertips and displays it on this page. As a result, some comments on this page may relate to an earlier period of time until this page is next updated (see review dates at the end of this page).
Summary Infographic
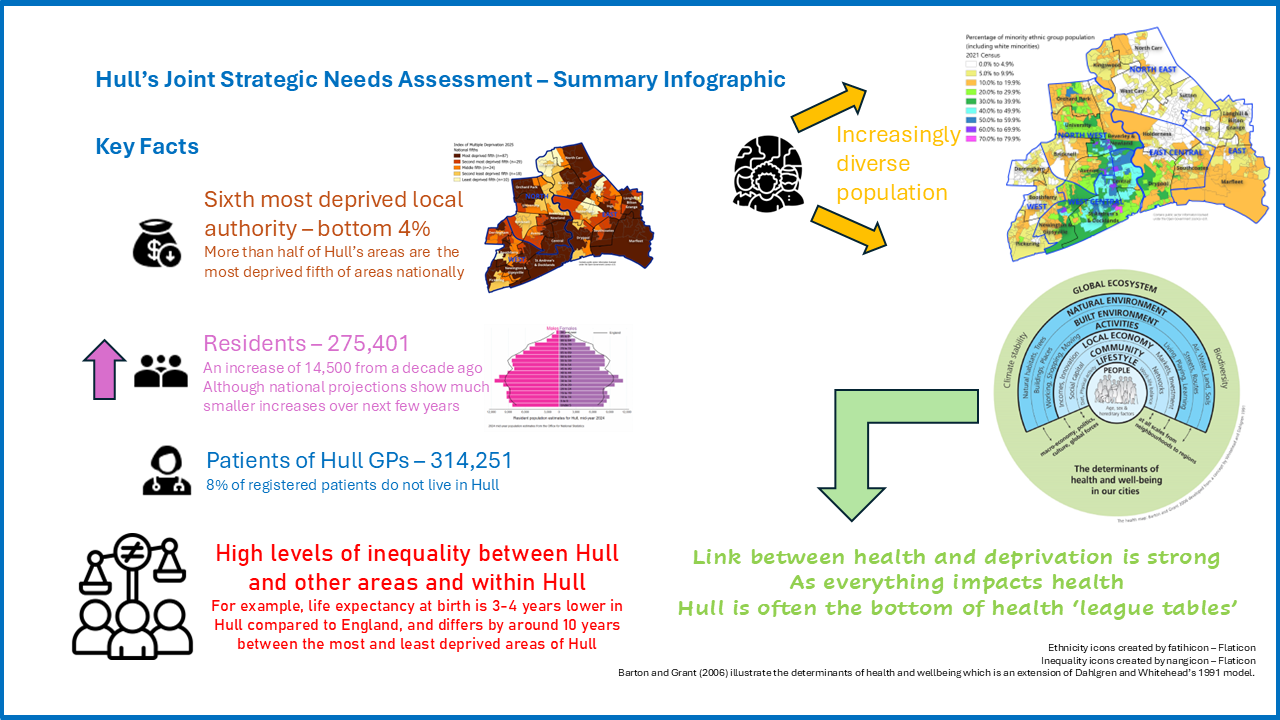
Headlines
- Hull is the sixth most deprived upper-tier local authority in England (out of 153).
- Hull’s resident population is estimated to be 275,401 from the Office for National Statistics population estimates for mid-year 2024. Hull’s population is relatively young compared to the England average.
- In July 2025, there were 314,251 patients are registered with Hull GPs (with a sizeable number – around 7.5% registered patients – living in East Riding of Yorkshire).
- People in Hull are dying earlier than they should and there are wide inequalities / differences in life expectancy both between Hull and England, and within Hull.
- From the A Matter of Life and Death report, “Social and economic conditions such as poverty, poor-quality housing, low-paid or unstable jobs all impact people’s physical and mental health. These ‘wider determinants of health’ are harming health and cutting lives short.”
Health of the Region Data Explorer
The Office for Health Improvement & Disparities’ North East and Yorkshire Local Knowledge and Information team have produced a Heath of the Region Data Explorer (previously described as the Picture of Health intelligence pack) which summaries the health and wellbeing of residents of each of the local authorities across the North East and Yorkshire. The link is as follows, but they have given us permission to display their dashboard on our JSNA website.
Health of the Region Data Explorer
You will need to select “Yorkshire and the Humber” from the second drop down box and then “Kingston upon Hull” from the third drop down box.
Deprivation and Poverty
As with most cities, there are high levels of deprivation in certain areas within the city. Most other cities include some of the ‘leafy suburbs’ within their boundary, but this is less of the case with Hull’s tight geographical boundaries. This means that Hull is among the most deprived places in England.
Index of Multiple Deprivation 2025
Based on the Index of Multiple Deprivation 2025, Hull is the sixth most deprived upper-tier local authority in England (out of 153). Hull was ranked as the fourth most deprived upper-tier local authority in England (out of 151) based on the previous Index of Multiple Deprivation which was released in 2019. So the relative position of Hull in relation to overall deprivation has marginally improved in the last six years. This does not necessarily mean there has been an improvement in Hull as it is relative. It could simply denote that Hull has not deteriorated as badly as some of other local authorities.
Blackpool, Middlesbrough, Manchester, Birmingham and Hartlepool are the five upper-tier local authorities that are more deprived compared to Hull based on the Index of Multiple Deprivation 2025.
Overall, 87 (51.8%) of Hull’s lower super output areas (geographical areas on which the Index of Multiple Deprivation is based) are in the most deprived fifth of areas of England with 10 (6.0%) of Hull’s lower super output areas within the least deprived fifth of areas of England.
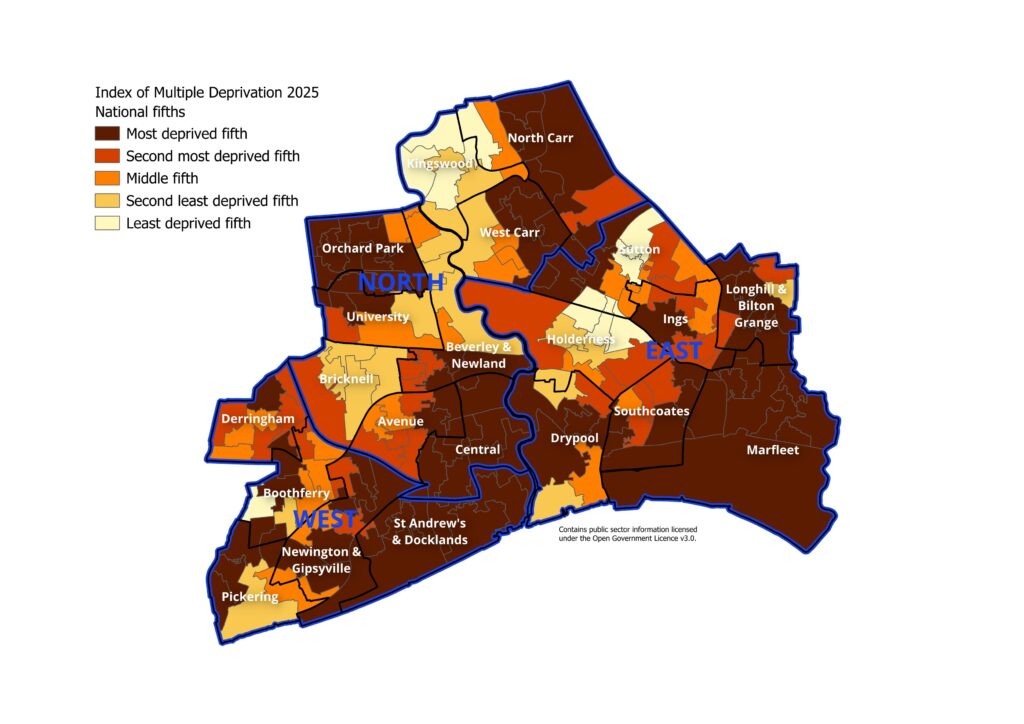
Examining the national tenths does not discriminate in deprivation levels within Hull, so the local deprivation fifths are presented which better illustrate the levels of deprivation within Hull.
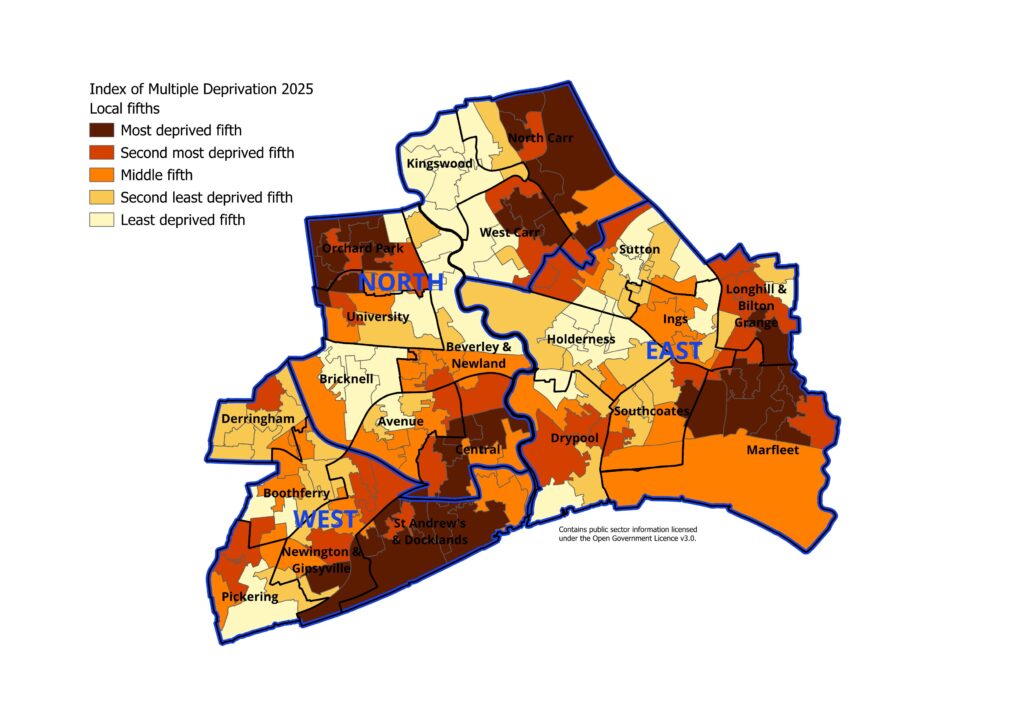
Marfleet ward is the most deprived ward in Hull followed by St Andrew’s & Docklands, Orchard Park, Central, and Longhill & Bilton Grange wards. At the other end of the scale, Kingswood is the least deprived ward, followed by Holderness, Bricknell, Boothferry and Derringham wards.
Marfleet and St Andrew’s & Docklands are among the most 1% of wards in England, and these two wards with Orchard Park, Central, Longhill & Bilton Grange and North Carr are among the most deprived 5% of wards in England. Nine of Hull’s wards fall within the most deprived 10% of wards in England, and 17 of Hull’s 21 wards are in the bottom quarter of the most deprived wards of England. All wards except Kingswood are in the most deprived 60% of wards in England, and Kingswood falls within the least deprived 10% of wards in England.
| Area Committee Area | Ward | IMD 2025 score | Hull ward rank | National rank (out of 6,793) | National percentile |
| East | Marfleet | 62.2 | 1 | 29 | 0.4 |
| West | St Andrew’s & Docklands | 59.5 | 2 | 51 | 0.8 |
| North | Orchard Park | 55.7 | 3 | 84 | 1.2 |
| North | Central | 54.7 | 4 | 99 | 1.5 |
| East | Longhill & Bilton Grange | 46.3 | 5 | 268 | 3.9 |
| North | North Carr | 44.7 | 6 | 321 | 4.7 |
| West | Newington & Gipsyville | 41.8 | 7 | 417 | 6.1 |
| North | West Carr | 39.2 | 8 | 524 | 7.7 |
| East | Drypool | 37.6 | 9 | 595 | 8.8 |
| East | Southcoates | 36.0 | 10 | 696 | 10.2 |
| North | Avenue | 35.6 | 11 | 734 | 10.8 |
| West | Pickering | 35.3 | 12 | 754 | 11.1 |
| North | University | 29.4 | 13 | 1,248 | 18.4 |
| East | Sutton | 28.3 | 14 | 1,363 | 20.1 |
| North | Beverley & Newland | 26.2 | 15 | 1,592 | 23.4 |
| East | Ings | 26.1 | 16 | 1,609 | 23.7 |
| West | Derringham | 25.8 | 17 | 1,646 | 24.2 |
| West | Boothferry | 21.4 | 18 | 2,389 | 35.2 |
| North | Bricknell | 15.8 | 19 | 3,696 | 54.4 |
| East | Holderness | 15.6 | 20 | 3,765 | 55.4 |
| North | Kingswood | 7.2 | 21 | 6,218 | 91.5 |
Not surprisingly, the majority of the individual seven components of the Index of Multiple Deprivation score are also high in Hull (income, employment, health and disability, education, skills and training, barriers to housing and services, living environment, and crime) with the exception of barriers to housing and services which are generally lower in a city as services are more concentrated and closer to people’s homes. The supplementary indices of Income Deprivation Affecting Children Index and the Income Deprivation Affecting Older People Index are also high which measure the percentage of people with income deprivation. Further information can be found within Deprivation and Poverty.
Fuel Poverty and Children Living in Poverty
Fuel poverty, children living in absolute and relatively low income households and the percentage of children eligible for free school meals in Hull are all high relative to England, and are among the highest in the region.
Compared with benchmark
| Indicator | Period | England | Yorkshire and the Humber region (statistical) | Kingston upon Hull | East Riding of Yorkshire | North East Lincolnshire | North Lincolnshire | York | North Yorkshire UA | Barnsley | Doncaster | Rotherham | Sheffield | Bradford | Calderdale | Kirklees | Leeds | Wakefield |
|---|---|---|---|---|---|---|---|---|---|---|---|---|---|---|---|---|---|---|
Fuel poverty (low income, low energy efficiency methodology) (Not applicable Not applicable) | 2023 | 11.4 | 14.7 | 17.9 | 13.0 | 16.2 | 14.3 | 12.3 | 14.2 | 15.8 | 16.1 | 14.5 | 14.3 | 15.9 | 15.2 | 15.0 | 13.8 | 13.7 |
Children in relative low income families (under 16s) (Persons <16 yrs) | 2024/25 | 19.8 | 27.0 | 33.2 | 18.0 | 30.8 | 25.5 | 13.9 | 14.7 | 28.2 | 31.0 | 27.3 | 28.5 | 39.3 | 27.1 | 30.3 | 25.0 | 23.0 |
Children in absolute low income families (under 16s) (Persons <16 yrs) | 2024/25 | 19.8 | 27.0 | 33.2 | 18.0 | 30.8 | 25.5 | 13.9 | 14.7 | 28.2 | 31.0 | 27.3 | 28.5 | 39.3 | 27.1 | 30.3 | 25.0 | 23.0 |
Children eligible for free school meals (Persons School age) | 2024/25 | 25.7 | 27.8 | 34.7 | 20.7 | 33.8 | 30.8 | 17.6 | 18.6 | 29.4 | 29.6 | 29.1 | 34.1 | 30.4 | 27.1 | 27.5 | 27.1 | 26.3 |
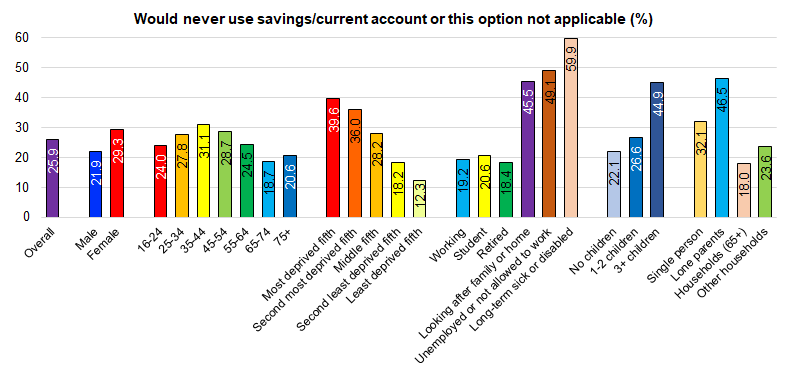
From Hull’s adult Health and Wellbeing Survey conducted in 2019 involving over 4,000 residents aged 16+ years, just over one-quarter of all adults would never use their savings or current account to fund a £200 household emergency or said this option was not applicable to them. This was considerably higher among people living in the most deprived areas of Hull, who were unemployed or not working due to long-term illness or disability, lone parents, and among households containing three or more children. Overall, this equates to around 54,100 adults in Hull who would never use their savings or current account to fund a £200 household emergency or said that this option was not applicable to them.
However, this survey was undertaken prior to the COVID-19 pandemic and the cost of living crisis, and the situation with regard to household finances and financial resilience has considerably worsened in Hull since 2019.
Population and Demographics
Population Estimates
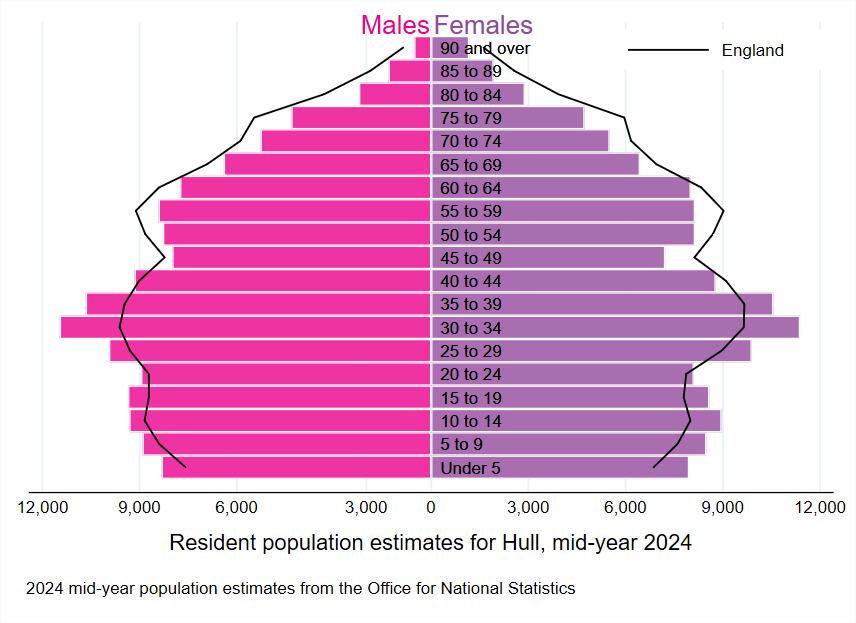
From the Office for National Statistics mid-year population figures, it is estimated that there are 275,401 residents of Hull in 2024. This is an increase of 2,322 from the revised 2023 mid-year estimate and an increase of 14,505 from a decade ago (mid-year 2014 population). There was quite an even split in Hull between men (138,530) and women (136,871).
The population pyramid shows the age and gender structure of Hull’s population compared to England using the mid-year 2024 population estimates.
Change in Population and Population Density
Between mid-year 2023 and mid-year 2024, there were 3,119 births and 2,590 deaths in Hull giving an natural increase of 529 in Hull’s population. In terms of internal migration, the Office for National Statistics estimated that there were there was an estimate inflow of 11,713 people coming into Hull over the year and an estimated 15,373 people leaving Hull in the year, a reduction of 3,660 people overall. For international migration, there were an estimated 7,640 people coming into Hull and 2,100 people leaving Hull giving a net gain of 5,540 people due to international migration. There were a a further decrease of 77 people due to special circumstances such as changes in the armed forces and/or the prison population.
Hull is 71.6 kilometres square and thus – from the mid-year 2024 population estimates – it is estimated that there are 3,846 residents per square kilometre which is relatively high in relation to other local authorities (most densely populated fifth).
Patients Registered with GPs in Hull
Based on the general practice registration file for July 2025, the estimated resident population is noticeably higher than the Office for National Statistics’ estimate for Hull at 294,613 residents with 289,361 of these residents registered with general practices in Hull. A total of 319,503 people are either registered with a Hull GP as a patient or live in Hull based on the GP registration file for July 2025.
Of the 314,251 patients registered with Hull GPs, 23,706 (7.5%) live in East Riding of Yorkshire and a further 1,181 live elsewhere. This is an important consideration if services are provided via primary care.
Of the 294,613 people estimated to live in Hull based on information in GP records, 289,361 (98.2%) live in Hull, 3,740 (1.3%) live in East Riding of Yorkshire and 1,512 (0.5%) live beyond East Riding of Yorkshire.
| Resident | Hull GP | ERoY GP | Other GP | Totals |
| Resident of Hull | 289,316 | 3,740 | 1,512 | 294,613 |
| Resident of ERoY | 23,706 | 23,706 | ||
| Resident elsewhere | 624 | 624 | ||
| Unknown | 560 | 560 | ||
| Totals | 314,251 | 3,740 | 1,512 | 319,503 |
Minority Ethnic Groups
In the 2021 Census, it was estimated that the 91.8% of Hull’s residents were white with 83.9% being white British, 0.2% white Irish, 0.2% white Gypsy or Irish Traveller and 0.1% Roma. A further 7.4% were from other white backgrounds (mainly Eastern Europeans). Overall, 1.7% of residents had two or more ethnicities (often denoted as ‘mixed or multiple ethnic groups’), 2.8% were Asian or Asian British (including 0.5% Chinese), 1.9% were black, black British, black Caribbean or black African, 0.5% were Arabs and 1.3% were from other ethnic groups.
The percentage of people from minority ethnic backgrounds in Hull differ dramatically across Hull’s wards and, has increased greatly over the last two decades. It was estimated that 97.7% of Hull residents were white and 96.4% were white British in 2001, falling to 94.1% and 89.7% respectively in 2011, and further decreasing to 91.8% and 83.9% in 2021.
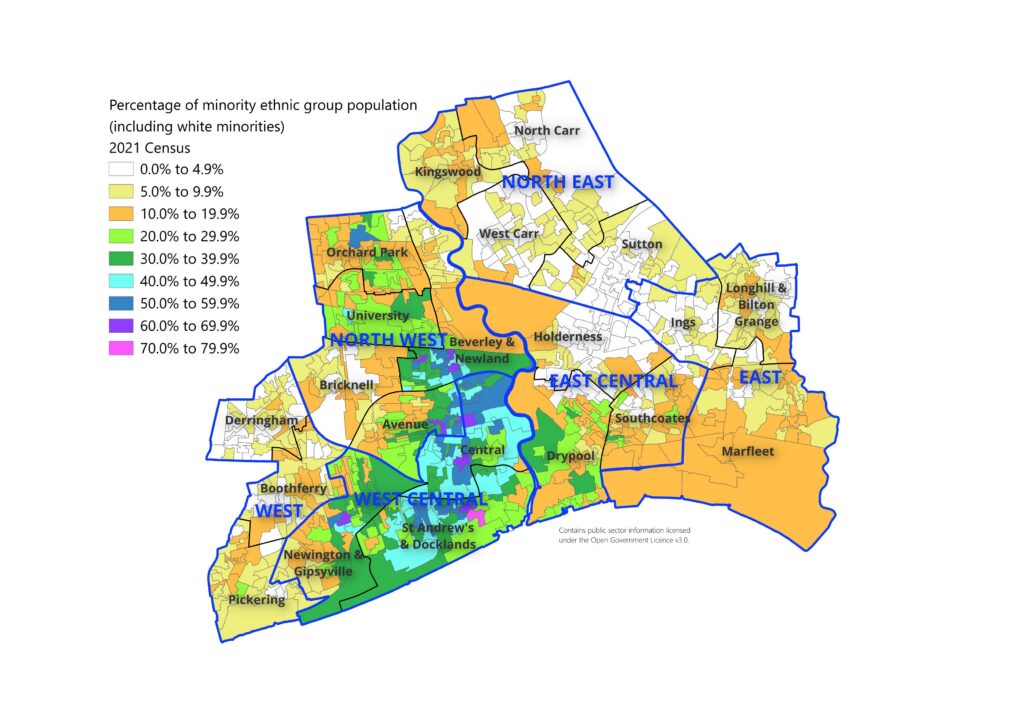
The map shows the percentage of Hull’s resident population who were from ethnic minority backgrounds for each of the 881 Output Areas in Hull (see Glossary for more information on these geographical areas).
There is a huge difference in the percentages for these small geographical areas which range from zero to three-quarters. The highest percentages are within St Andrew’s & Docklands and Central wards with high percentages also in parts of Newington & Gipsyville, Avenue, Drypool, Beverley & Newland, University and Orchard Park wards. The percentages are low to the east of the city particularly the north east in North Carr, West Carr, Sutton, Ings and parts of Longhill & Bilton Grange and Holderness wards as well as a couple of wards in the west such as Derringham and Bricknell.
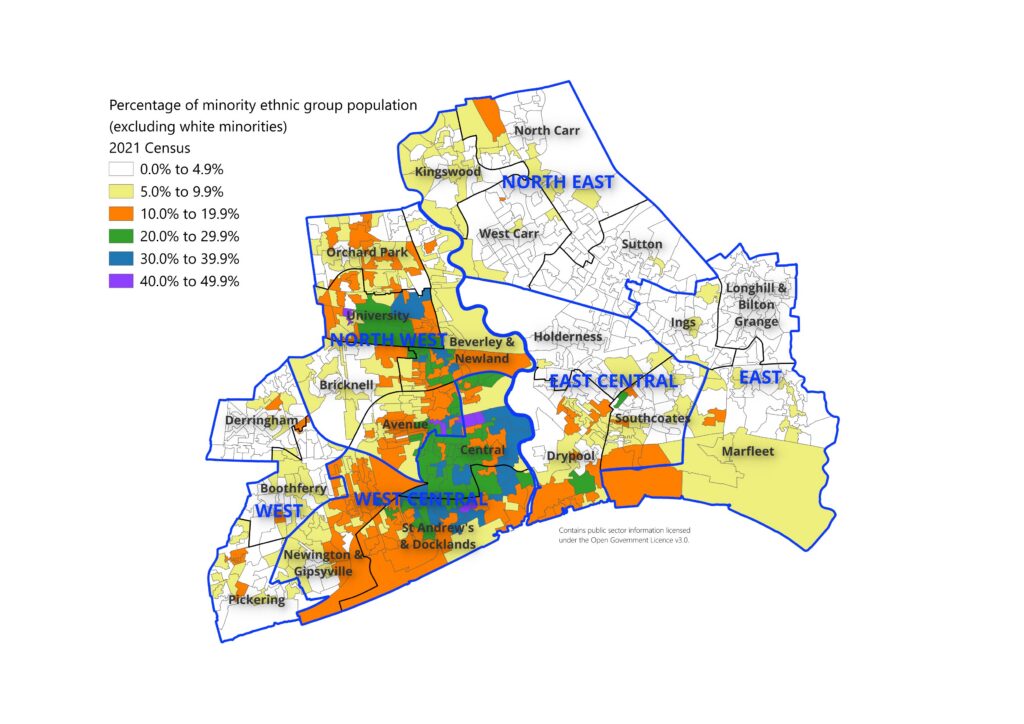
A similar pattern occurs when examining the percentage of people who are from ethnic minorities (excluding white minorities) with highest concentrations of people living in Central and St Andrew’s & Docklands, to the east of those wards and around the University.
The percentage of children from ethnic minorities attending Hull schools has increased from 9.1% in 2010 to 21.9% in 2021. From the January 2021 school census, 78.1% of pupils were white British, 9.8% from other white backgrounds, 4.0% from mixed or multiple ethnic groups, 1.7% were Asian or Asian British, 2.0% were black, black British, black Caribbean or black African, 0.1% were Chinese, 3.0% were other ethnic groups, and 1.4% did not have their ethnicity classified. A total of 9,246 (21.9%) pupils were from ethnic minorities which was considerably lower than England (35.1%).
Household Composition
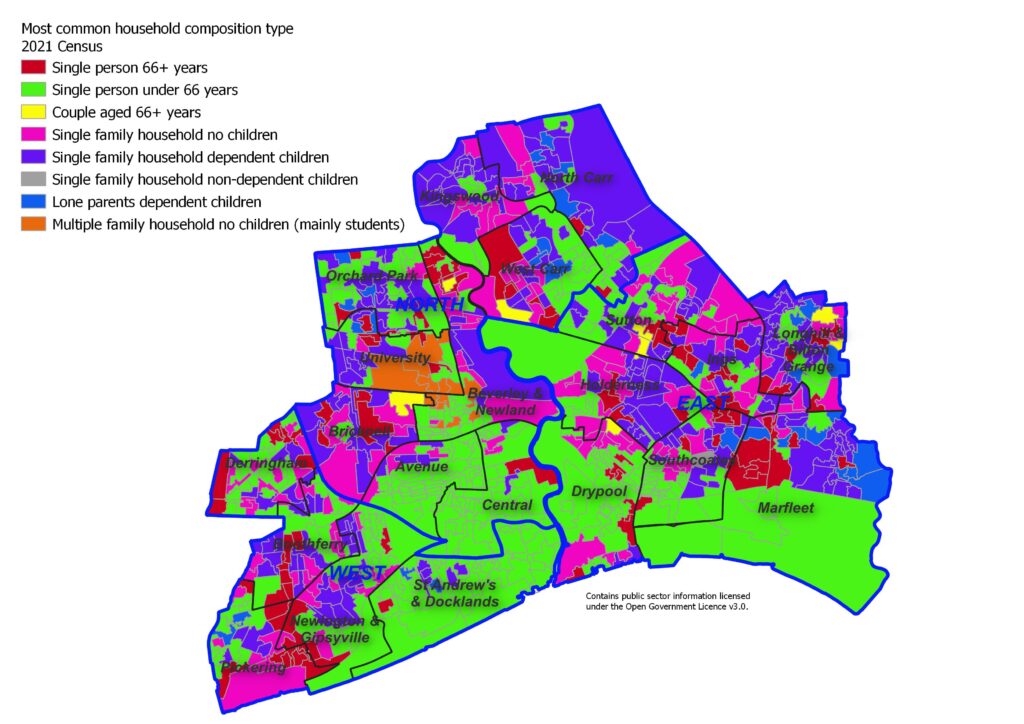
The household composition also varied across Hull. The most common household type for areas around the city centre were single persons aged under 66 years. Multiple family households were the most common household type around the University, and other types were more scattered throughout the city although there were high levels of families living in the north of the city in Kingswood and North Carr.
Population Projections
The Office for National Statistics (ONS) produce population projections every two years, with the latest based on the mid-year population estimates for 2022, released on 25 June 2025.
From the 2022-based population projections, ONS estimated that there were 268,700 residents in Hull, and they projected that this would increase to 272,500 by 2027 (an increase of 1.4%), before then decreasing slightly in subsequent years to reach 271,100 by 2047 (an increase of 0.9% on 2022, but a decrease of 0.5% from 2027). From the 2022-based population projections for Hull, it was projected that the population in 2023 would be 271,200. However, the mid-year 2023 population estimates are 271,942 for Hull, which is 0.3% higher than the population projections.
Up until 2032, ONS project a decrease of 16.4% among the 0-9 year age group and a 13.8% decrease among the 50-59 year age group. Small decreases were also projected for the 10-19 and 30-39 age groups of 1.3% and 2.3% respectively. Increases are projected for all other age groups, with the largest increases seen in the 80-89 year age group (30.8%), the 40-49 year age group (17.5%) and the 70-79 year age group (13.7%). Increases of 6.7%, 5.6% and 3.2% were seen respectively for the 60-69, 20-29 and 90+ years age groups. These mask relatively large individual changes within five year age groups such as an increases of 35.4%, 23.7%, 21.2%, 21.9%, 16.7% and 14.3% among those aged 80-84, 85-89, 40-44, 20-24, 65-69 and 70-74 years respectively, and decreases of 18.4%, 17.4%, 14.2%, and 12.3% among those aged 5-9, 55-59, 0-4 and 10-14 years respectively.
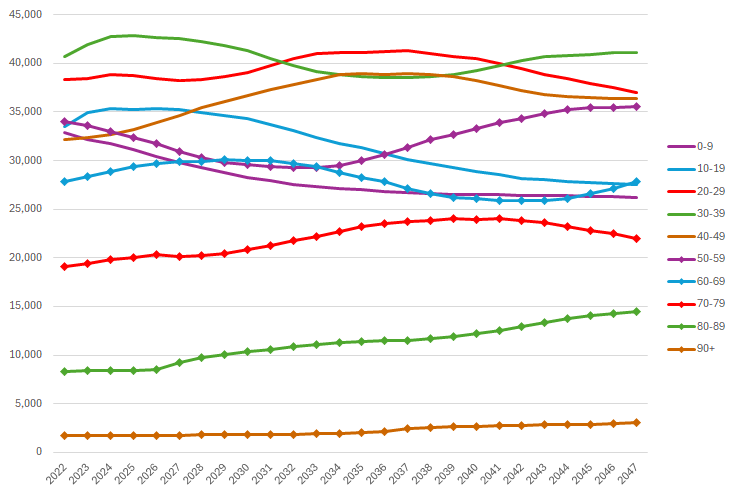
Over the longer term to 2047, ONS project decreases of 20.3%, 17.9% and 3.4% among those aged 0-9, 10-19 and 20-39 years respectively, and increases of 14.7%, 74.8% and 75.0% among those aged 70-79, 80-89 and 90+ years respectively.
Among those aged 65+ years, it is projected that Hull’s population will increase by 17.6% by 2032 (from 41,700 in 2022 to 49,100 in 2032) and by 25.1% by 2047 (to 52,200). Among those aged 85+ years, it is projected that the population will increase by 16.5% from 5,000 in 2022 to 5,800 in 2032, but by 72.6% to 8,600 in 2047.
Life Expectancy
Life Expectancy at Birth
Life expectancy at birth does not give the expected duration of life for a newborn; it gives a measure of expected life expectancy if the current age-specific mortality rates applied throughout an entire lifetime, but of course, these are subject to changes over time. As it is based on current mortality rates, it is a good measure of the current health status of a population.
Life expectancy at birth is lower in Hull compared to England, and the lowest in the region for 2022-24. Life expectancy at birth is 4.0 years lower for men and 2.9 years lower for women in Hull compared to England for 2022-24.
Compared with benchmark
| Indicator | Period | England | Yorkshire and the Humber region (statistical) | Kingston upon Hull | East Riding of Yorkshire | North East Lincolnshire | North Lincolnshire | York | North Yorkshire UA | Barnsley | Doncaster | Rotherham | Sheffield | Bradford | Calderdale | Kirklees | Leeds | Wakefield |
|---|---|---|---|---|---|---|---|---|---|---|---|---|---|---|---|---|---|---|
Life expectancy at birth (Male All ages) | 2023 - 25 | 79.7 | 78.5 | 75.5 | 80.1 | 76.0 | 77.5 | 80.1 | 80.7 | 77.6 | 77.2 | 78.2 | 78.9 | 77.4 | 78.4 | 78.4 | 78.9 | 77.8 |
Life expectancy at birth (Female All ages) | 2023 - 25 | 83.5 | 82.5 | 80.7 | 83.7 | 81.7 | 82.0 | 84.0 | 84.4 | 81.5 | 81.6 | 81.8 | 82.4 | 81.9 | 82.6 | 82.3 | 82.7 | 81.8 |
Among men, whilst life expectancy increased in Hull between 2001-03 and 2010-12, increases stalled subsequently and even decreased slightly until 2017-19. In contrast, male life expectancy increases between 2001-03 and 2017-19 across England and the region. The sharp decrease in life expectancy between 2017-19 and 2020-22 is mainly attributable to the COVID-19 pandemic (further information on the number of COVID-19 deaths can be found within Causes of Death in Hull under Population). The largest number of deaths where COVID-19 was the underlying cause of the death were registered between April and June 2020 and between November 2020 and February 2021 (further information is given within Coronavirus (COVID-19) within Health Factors under Adults).
Male life expectancy in Hull has increased in the last two years as the years 2020 and 2021 (with the highest number of excess deaths and deaths from COVID-19) are no longer within the latest time period.
Male life expectancy in Hull for 2022-24 is similar to what it was in 2008-10. Furthermore, the inequalities gap between Hull and England has increased over the last two decades.
Compared with benchmark
Life expectancy at birth (Male All ages)
|
Period
|
Kingston upon Hull |
Yorkshire and the Humber region (statistical)
|
England
|
||||
|---|---|---|---|---|---|---|---|
|
Count
|
Value
|
95%
Lower CI |
95%
Upper CI |
||||
| 2001 - 03 | • | - | 73.7 | 73.3 | 74.2 | 75.5 | 76.2 |
| 2002 - 04 | • | - | 74.2 | 73.8 | 74.7 | 75.8 | 76.5 |
| 2003 - 05 | • | - | 74.3 | 73.9 | 74.7 | 76.1 | 76.8 |
| 2004 - 06 | • | - | 74.6 | 74.1 | 75.0 | 76.5 | 77.2 |
| 2005 - 07 | • | - | 74.6 | 74.2 | 75.1 | 76.8 | 77.5 |
| 2006 - 08 | • | - | 74.8 | 74.3 | 75.2 | 77.0 | 77.8 |
| 2007 - 09 | • | - | 74.9 | 74.5 | 75.4 | 77.3 | 78.1 |
| 2008 - 10 | • | - | 75.4 | 75.0 | 75.9 | 77.6 | 78.4 |
| 2009 - 11 | • | - | 75.9 | 75.4 | 76.3 | 78.0 | 78.8 |
| 2010 - 12 | • | - | 76.6 | 76.1 | 77.0 | 78.2 | 79.1 |
| 2011 - 13 | • | - | 76.6 | 76.1 | 77.0 | 78.4 | 79.3 |
| 2012 - 14 | • | - | 76.7 | 76.3 | 77.1 | 78.6 | 79.4 |
| 2013 - 15 | • | - | 76.6 | 76.2 | 77.1 | 78.6 | 79.4 |
| 2014 - 16 | • | - | 76.5 | 76.0 | 76.9 | 78.7 | 79.5 |
| 2015 - 17 | • | - | 76.2 | 75.7 | 76.6 | 78.6 | 79.5 |
| 2016 - 18 | • | - | 76.3 | 75.8 | 76.7 | 78.7 | 79.6 |
| 2017 - 19 | • | - | 76.2 | 75.8 | 76.6 | 78.7 | 79.7 |
| 2018 - 20 | • | - | 75.9 | 75.5 | 76.4 | 78.3 | 79.3 |
| 2019 - 21 | • | - | 75.2 | 74.8 | 75.6 | 78.1 | 79.0 |
| 2020 - 22 | • | - | 75.0 | 74.6 | 75.5 | 77.9 | 78.9 |
| 2021 - 23 | • | - | 75.3 | 74.9 | 75.7 | 78.1 | 79.1 |
| 2022 - 24 | • | - | 75.5 | 75.0 | 75.9 | 78.3 | 79.5 |
| 2023 - 25 | • | - | 75.5 | 75.1 | 76.0 | 78.5 | 79.7 |
Source: Office for National Statistics
Life expectancy at birth among Hull women show a reasonably similar pattern compared to men although the increase overall were smaller, and the impact of the COVID-19 pandemic was smaller. Life expectancy increased between 2001-03 and 2011-12, before falling slightly and then remaining relatively unchanged prior to the pandemic. Female life expectancy at birth has increased in Hull in the last two years, and is now at the same level it was prior to the pandemic.
The inequalities gap between Hull and England has also increased over the last two decades for women.
Compared with benchmark
Life expectancy at birth (Female All ages)
|
Period
|
Kingston upon Hull |
Yorkshire and the Humber region (statistical)
|
England
|
||||
|---|---|---|---|---|---|---|---|
|
Count
|
Value
|
95%
Lower CI |
95%
Upper CI |
||||
| 2001 - 03 | • | - | 79.4 | 79.0 | 79.8 | 80.3 | 80.7 |
| 2002 - 04 | • | - | 79.1 | 78.7 | 79.5 | 80.4 | 80.9 |
| 2003 - 05 | • | - | 79.0 | 78.5 | 79.4 | 80.6 | 81.1 |
| 2004 - 06 | • | - | 79.0 | 78.5 | 79.4 | 80.9 | 81.5 |
| 2005 - 07 | • | - | 79.0 | 78.6 | 79.5 | 81.0 | 81.7 |
| 2006 - 08 | • | - | 79.4 | 79.0 | 79.8 | 81.2 | 81.9 |
| 2007 - 09 | • | - | 79.9 | 79.4 | 80.3 | 81.3 | 82.1 |
| 2008 - 10 | • | - | 80.1 | 79.7 | 80.5 | 81.6 | 82.3 |
| 2009 - 11 | • | - | 80.2 | 79.8 | 80.7 | 81.9 | 82.7 |
| 2010 - 12 | • | - | 80.4 | 80.0 | 80.8 | 82.1 | 82.9 |
| 2011 - 13 | • | - | 80.7 | 80.3 | 81.1 | 82.2 | 83.0 |
| 2012 - 14 | • | - | 80.5 | 80.1 | 80.9 | 82.3 | 83.1 |
| 2013 - 15 | • | - | 80.3 | 79.9 | 80.7 | 82.3 | 83.1 |
| 2014 - 16 | • | - | 80.3 | 79.8 | 80.7 | 82.4 | 83.1 |
| 2015 - 17 | • | - | 80.1 | 79.7 | 80.5 | 82.3 | 83.1 |
| 2016 - 18 | • | - | 80.4 | 80.0 | 80.8 | 82.4 | 83.2 |
| 2017 - 19 | • | - | 80.4 | 80.0 | 80.8 | 82.4 | 83.3 |
| 2018 - 20 | • | - | 80.4 | 80.0 | 80.8 | 82.1 | 83.1 |
| 2019 - 21 | • | - | 80.1 | 79.7 | 80.5 | 82.0 | 82.9 |
| 2020 - 22 | • | - | 79.9 | 79.5 | 80.3 | 81.9 | 82.8 |
| 2021 - 23 | • | - | 80.2 | 79.8 | 80.6 | 82.1 | 83.1 |
| 2022 - 24 | • | - | 80.4 | 80.0 | 80.8 | 82.3 | 83.3 |
| 2023 - 25 | • | - | 80.7 | 80.3 | 81.2 | 82.5 | 83.5 |
Source: Office for National Statistics
Life Expectancy Across Hull’s Wards and By Deprivation
Locally calculated life expectancy estimates varied dramatically across Hull’s 21 electoral wards and by local deprivation fifth.
Life expectancy at birth for 2022-24 differs by 11.0 years for men and by 9.5 years for women between residents living in the most deprived tenth of areas of Hull and residents living in the least deprived tenth of areas of Hull based on the Index of Multiple Deprivation 2025.
Male life expectancy at birth for 2022-24 varied from 69.6 years for men living in Central ward to 80.0 years for men living in Ings ward. Life expectancy at birth was lowest for men living in Central, St Andrew’s & Docklands, Newington & Gipsyville, Orchard Park and Marfleet.
Female life expectancy at birth for 2022-24 varied between 75.2 years in Central to 83.8 years in Holderness. Life expectancy at birth was lowest for women living in Central, St Andrew’s & Docklands, Marfleet, North Carr, and Newington & Gipsyville.
More detailed information provided within Life Expectancy and Healthy Life Expectancy under Population.
Healthy Life Expectancy at Birth
Healthy life expectancy is a measure of the average number of years a person would expect to live in good health based on contemporary mortality rates and prevalence of self-reported good health. Healthy life expectancy is lower in Hull compared to England, and furthermore, when comparing life expectancy and healthy life expectancy, people in Hull live a shorter time in good health.
For 2021-23, male healthy life expectancy is 54.3 years and life expectancy at birth is 75.3 years, so it is estimated that men in Hull spend 21.0 years of their life not in ‘good’ health which represents 27.9% of their lives (17.6 years for England representing 22.2%). For women, healthy life expectancy was 54.6 years and life expectancy at birth was 80.2 years, so it is estimated that women in Hull spend 25.6 years of their life not in ‘good’ health representing 31.9% of their lives (21.2 years for England representing 25.5%).
Estimates for healthy life expectancy at birth have been updated for 2022-24, and are 53.1 years for Hull men compared to 60.9 years for men in England, and are 53.3 years for Hull women compared to 61.3 years for women in England.
Compared with benchmark
| Indicator | Period | England | Yorkshire and the Humber region (statistical) | Kingston upon Hull | East Riding of Yorkshire | North East Lincolnshire | North Lincolnshire | York | North Yorkshire UA | Barnsley | Doncaster | Rotherham | Sheffield | Bradford | Calderdale | Kirklees | Leeds | Wakefield |
|---|---|---|---|---|---|---|---|---|---|---|---|---|---|---|---|---|---|---|
Healthy life expectancy at birth (Male All ages) | 2022 - 24 | 60.9 | 58.2 | 53.1 | 59.5 | 54.7 | 58.7 | 60.8 | 64.5 | 55.2 | 55.1 | 55.6 | 57.4 | 57.4 | 60.2 | 57.8 | 60.4 | 54.0 |
Healthy life expectancy at birth (Female All ages) | 2022 - 24 | 61.3 | 58.6 | 53.3 | 59.5 | 54.9 | 59.6 | 61.4 | 65.4 | 55.3 | 55.4 | 55.1 | 57.4 | 58.2 | 60.9 | 58.0 | 60.9 | 53.8 |
Healthy life expectancy at birth for men in Hull remained reasonably static between 2011-13 and 2017-19 with only a slight increase over time from 56.3 years to 57.8 years. There was a relatively large decrease between 2017-19 and 2020-22 associated with the pandemic falling by 4.0 years to 53.8 years.
Whilst there was an increase between 2020-22 and 2021-23, healthy life expectancy has fallen by 1.2 years to 53.1 years for Hull men between 2021-23 and 2022-24 (compared to a fall of 0.6 years for men in England).
Male healthy life expectancy at birth for 2022-24 is the lowest in Hull in the last decade.
Compared with benchmark
Healthy life expectancy at birth (Male All ages)
|
Period
|
Kingston upon Hull |
Yorkshire and the Humber region (statistical)
|
England
|
||||
|---|---|---|---|---|---|---|---|
|
Count
|
Value
|
95%
Lower CI |
95%
Upper CI |
||||
| 2011 - 13 | • | - | 56.3 | 54.0 | 58.7 | 60.9 | 63.0 |
| 2012 - 14 | • | - | 56.3 | 53.8 | 58.8 | 61.0 | 63.2 |
| 2013 - 15 | • | - | 56.4 | 53.9 | 58.9 | 61.3 | 63.2 |
| 2014 - 16 | • | - | 56.2 | 53.6 | 58.7 | 61.0 | 63.3 |
| 2015 - 17 | • | - | 57.3 | 54.9 | 59.6 | 61.5 | 63.3 |
| 2016 - 18 | • | - | 56.9 | 54.5 | 59.4 | 61.2 | 63.3 |
| 2017 - 19 | • | - | 57.8 | 55.2 | 60.3 | 61.2 | 63.2 |
| 2018 - 20 | • | - | 56.1 | 53.0 | 59.1 | 61.2 | 63.1 |
| 2019 - 21 | • | - | 55.6 | 51.9 | 59.4 | 60.5 | 62.7 |
| 2020 - 22 | • | - | 53.8 | 50.3 | 57.4 | 60.1 | 62.3 |
| 2021 - 23 | • | - | 54.3 | 50.2 | 58.4 | 58.8 | 61.5 |
| 2022 - 24 | • | - | 53.1 | 48.5 | 57.7 | 58.2 | 60.9 |
Source: Office for National Statistics
Healthy life expectancy at birth for women in Hull increased gradually between 2011-13 and 2017-19 from 57.0 years to 58.5 years. There was a relatively large decrease between 2017-19 and 2020-22 associated with the pandemic falling by 5.3 years to 53.2 years in 2020-22.
Whilst there was an increase between 2020-22 and 2021-23, healthy life expectancy has fallen by 1.3 years to 53.3 years for Hull women between 2021-23 and 2022-24 (compared to a fall of 1.0 years for women in England).
Female healthy life expectancy at birth for 2022-24 is the lowest in Hull in the last decade.
Compared with benchmark
Healthy life expectancy at birth (Female All ages)
|
Period
|
Kingston upon Hull |
Yorkshire and the Humber region (statistical)
|
England
|
||||
|---|---|---|---|---|---|---|---|
|
Count
|
Value
|
95%
Lower CI |
95%
Upper CI |
||||
| 2011 - 13 | • | - | 57.0 | 54.6 | 59.3 | 61.7 | 63.9 |
| 2012 - 14 | • | - | 56.7 | 54.3 | 59.1 | 61.7 | 63.9 |
| 2013 - 15 | • | - | 56.6 | 54.1 | 59.0 | 61.9 | 64.2 |
| 2014 - 16 | • | - | 56.5 | 53.9 | 59.1 | 61.7 | 64.0 |
| 2015 - 17 | • | - | 57.2 | 54.4 | 59.9 | 61.7 | 64.0 |
| 2016 - 18 | • | - | 57.7 | 54.7 | 60.7 | 62.1 | 64.1 |
| 2017 - 19 | • | - | 58.5 | 55.4 | 61.6 | 61.9 | 63.7 |
| 2018 - 20 | • | - | 56.5 | 53.0 | 60.0 | 62.0 | 64.0 |
| 2019 - 21 | • | - | 56.0 | 52.3 | 59.6 | 61.0 | 63.7 |
| 2020 - 22 | • | - | 53.2 | 49.4 | 57.1 | 60.1 | 62.8 |
| 2021 - 23 | • | - | 54.6 | 50.5 | 58.7 | 59.3 | 61.9 |
| 2022 - 24 | • | - | 53.3 | 49.2 | 57.5 | 58.6 | 61.3 |
Source: Office for National Statistics
Life Expectancy and Healthy Life Expectancy at Age 65
Life expectancy and healthy life expectancy at age 65 years is also low in Hull compared to England and other local authorities across the region. Men and women in Hull aged 65 years are anticipated to have a shorter life expectancy and to spend more of it not in good health.
Compared with benchmark
| Indicator | Period | England | Yorkshire and the Humber region (statistical) | Kingston upon Hull | East Riding of Yorkshire | North East Lincolnshire | North Lincolnshire | York | North Yorkshire UA | Barnsley | Doncaster | Rotherham | Sheffield | Bradford | Calderdale | Kirklees | Leeds | Wakefield |
|---|---|---|---|---|---|---|---|---|---|---|---|---|---|---|---|---|---|---|
Life expectancy at 65 (Male 65) | 2023 - 25 | 19.1 | 18.6 | 16.8 | 19.4 | 17.5 | 18.1 | 19.4 | 19.9 | 18.2 | 17.9 | 18.3 | 18.5 | 18.0 | 18.7 | 18.6 | 18.5 | 18.0 |
Life expectancy at 65 (Female 65) | 2023 - 25 | 21.5 | 20.9 | 19.7 | 21.6 | 20.6 | 20.9 | 21.7 | 22.2 | 20.2 | 20.2 | 20.2 | 20.7 | 20.6 | 20.7 | 20.8 | 21.1 | 20.2 |
Healthy life expectancy at 65 (Male 65) | 2022 - 24 | 10.1 | 9.5 | 7.7 | 9.8 | 8.2 | 9.6 | 10.4 | 11.8 | 8.3 | 8.4 | 8.6 | 9.0 | 9.2 | 10.1 | 9.2 | 10.0 | 8.3 |
Healthy life expectancy at 65 (Female 65) | 2022 - 24 | 11.1 | 10.4 | 8.3 | 10.6 | 9.1 | 10.6 | 11.2 | 12.8 | 9.1 | 9.2 | 9.0 | 9.8 | 10.1 | 11.0 | 10.1 | 11.1 | 8.6 |
The trends over time in life expectancy at age 65 years for men and women, life expectancy at age 65 across Hull’s electoral wards and the differences by deprivation, and trends over time in healthy life expectancy at age 65 are given within Life Expectancy and Healthy Life Expectancy under Population.
Causes of Death with Excess Deaths in Hull Contributing to the Gap in Life Expectancy
The Office for Health Improvement & Disparities have produced a Life Expectancy Segment Tool, which examines the gap or difference in life expectancy and assesses the excess deaths that contributed to the difference in relation to different causes of death.
Population estimates from the 2021 Census and mid-year 2023 population estimates have been used to calculate life expectancy at birth. The latest version uses mortality data for the two years 2022-23 and is based on the Index of Multiple Deprivation 2019. The Index of Multiple Deprivation 2025 was published at the end of October 2025 so the Segment Tool has not yet been updated for the new Index of Multiple Deprivation.
Gap in Life Expectancy Between Hull and England
For women, circulatory disease, cancer and respiratory disease were the three causes of death which had the highest excess deaths in Hull contributing to the gap in life expectancy between Hull and England for 2022-23. If the age-specific mortality rates from these three diseases were the same in Hull as they were for England, then female life expectancy would be 0.79 years higher due to circulatory disease, 0.77 years higher due to cancer and 0.64 years due to respiratory disease.
For men, circulatory disease, external causes and cancer were the three causes of death which had the highest excess deaths in Hull contributing to the gap in life expectancy between Hull and England for 2022-23. If the age-specific mortality rates from these three diseases were the same in Hull as they were for England, then male life expectancy would be 1.10 years higher due to circulatory disease, 0.83 higher due to external causes, and 0.68 years higher due to cancer.
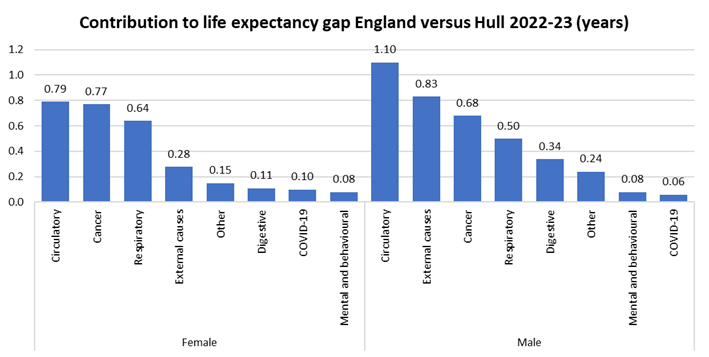
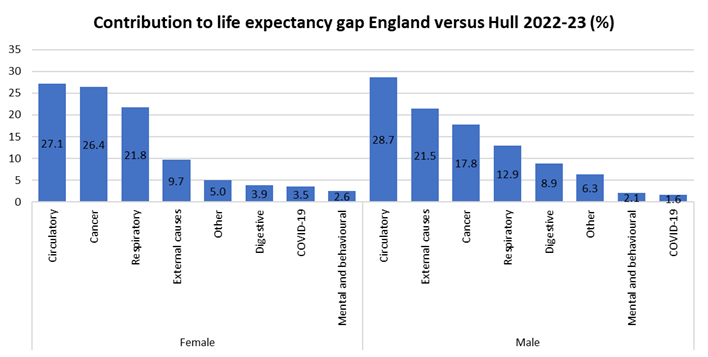
The gap in life expectancy between Hull and England for 2022-23 was 2.9 years for women (life expectancy 80.5 years in Hull compared to 83.2 years in England) and 3.8 years for men (life expectancy 75.5 years in Hull compared to 79.3 years in England). Thus circulatory disease accounts for 27% of the life expectancy gap for women and 29% of the gap for men, and cancer accounts for 26% of the gap for women and 18% of the gap for men. For women, respiratory disease accounts for 22% of the life expectancy gap between Hull and England for women. For men, external causes account for 22% of the life expectancy gap between Hull and England for men.
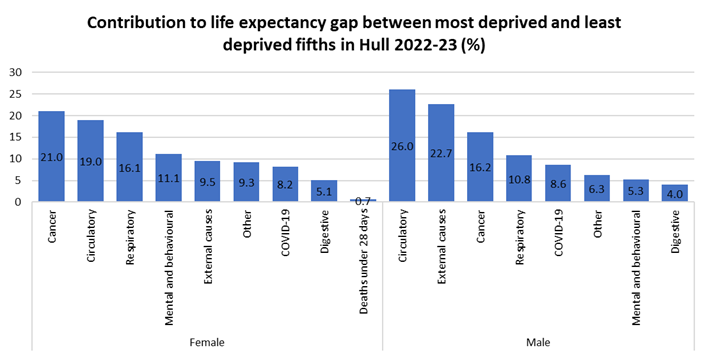
Gap in Life Expectancy Between Most and Least Deprived Areas of Hull
The Segment Tool also examines the gap in life expectancy between the most deprived fifth of areas and the least deprived fifth of areas within each local authority. It is based on the Index of Multiple Deprivation 2019.
In Hull for 2022-23, they estimate that life expectancy at birth is 76.4 years for women living in the most deprived fifth of areas of Hull compared to 84.5 years for women living in the least deprived fifth of areas of Hull giving a gap of 8.1 years. For men, their life expectancy at birth estimates are 71.3 and 80.8 years for the most and least deprived fifth of areas respectively giving a gap of 9.6 years.
Among women, circulatory disease contributes 1.56 years to this life expectancy gap, circulatory disease 1.41 years and respiratory disease 1.20 years. Among men, the causes with the greatest excess deaths contributing to the local life expectancy gap are for circulatory disease (2.42 years), external causes (2.12 years) and cancer (1.51 years).
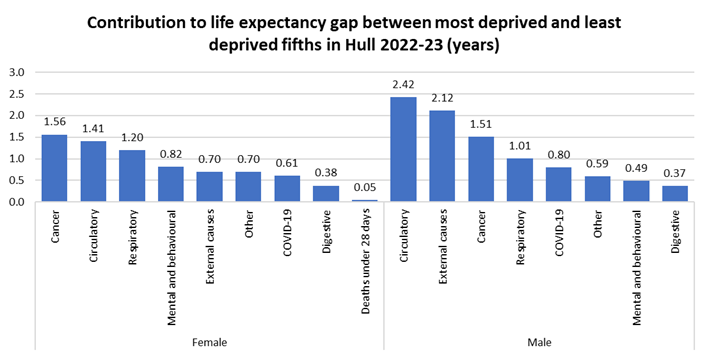
Among women, excess deaths due to cancer contributes to 21% of the gap in life expectancy between people living in the most deprived fifth of areas of Hull compared to the least deprived fifth of areas of Hull, circulatory disease contributes 19% and respiratory disease contributes 16%.
Among men, excess deaths due to circulatory disease contributes to 26% of the gap in life expectancy between people living in the most deprived fifth of areas of Hull compared to the least deprived fifth of areas of Hull, external causes contributes 23% and cancer disease contributes 16%.
Wider Determinants of Health
High levels of deprivation in Hull result in detrimental levels for a number of wider determinants of health, particularly for under 18 conceptions and the number of looked after children.
The percentage of school children who have special educational needs (either have an Education, Health and Care (EHC) Plan or require Special Education Needs Support), the rate of first time entrants into the youth justice system, and the percentage of 16-17 year olds who are not in education, employment or training (out of those whose activity is known) are all higher in Hull compared to England, and the percentage of children who achieve a good level of development at the end of reception year is lower.
The under 18 conception rate is given as the number of conceptions among under 18s per 1,000 female population aged 15-17 years, and whilst the rate has significantly decreased in Hull over the last decade or so, the rate is still more than twice as high as England and statistically significantly higher than England. Children in care is given as the number of children looked after as at 31 March at the end of the financial year per 10,000 population aged under 18 years, and the rate in Hull is among the highest in the England, and almost double the rate of England.
Compared with benchmark
| Indicator | Period | England | Yorkshire and the Humber region (statistical) | Kingston upon Hull | East Riding of Yorkshire | North East Lincolnshire | North Lincolnshire | York | North Yorkshire UA | Barnsley | Doncaster | Rotherham | Sheffield | Bradford | Calderdale | Kirklees | Leeds | Wakefield |
|---|---|---|---|---|---|---|---|---|---|---|---|---|---|---|---|---|---|---|
School readiness: percentage of children achieving a good level of development at the end of Reception (Persons 5 yrs) | 2024/25 | 68.3 | 66.2 | 65.3 | 68.5 | 66.7 | 66.7 | 71.4 | 70.6 | 67.9 | 67.5 | 64.9 | 65.5 | 61.9 | 65.3 | 66.4 | 63.9 | 69.6 |
Pupils with special educational needs (SEN) (Persons School age) | 2024/25 | 19.6 | 19.6 | 21.1 | 18.2 | 19.5 | 19.9 | 16.1 | 18.5 | 18.6 | 18.2 | 23.5 | 20.4 | 19.4 | 19.7 | 19.2 | 19.8 | 20.2 |
First time entrants to the youth justice system (Persons 10-17 yrs) | 2024 | 137.7 | 151.5 | 224.9 | 106.9 | 129.6 | 137.4 | 86.7 | 140.0 | 215.0 | 166.2 | 140.5 | 239.2 | 129.8 | 186.1 | 99.2 | 154.4 | 101.7 |
16 to 17 year olds not in education, employment or training (NEET) or whose activity is not known (Persons 16-17 yrs) | 2024/25 | 5.6 | 5.7 | 7.4 | 4.3 | 7.2 | 11.5 | 2.5 | 3.4 | 6.2 | 5.4 | 4.7 | 7.7 | 4.1 | 4.5 | 3.8 | 8.8 | 4.2 |
Under 18s conception rate (Female <18 yrs) | 2022 | 13.9 | 17.7 | 29.9 | 12.1 | 24.7 | 19.0 | 13.6 | 11.6 | 20.4 | 22.0 | 19.3 | 17.0 | 16.0 | 15.2 | 12.5 | 20.9 | 20.7 |
Children in care (Persons <18 yrs) | 2024/25 | 67 | 77 | 119 | 58 | 131 | 62 | 69 | 48 | 71 | 74 | 80 | 54 | 96 | 79 | 64 | 85 | 89 |
The percentage of the working-age people in employment and median weekly gross earnings (“weekly average earnings”) are lower in Hull compared to England, and the rates of economic inactivity and crime rates are higher. Statutory homeless rates in Hull are double that of England, although it is likely that people in Hull are more likely to seek help for homelessness whereas people in more affluent area may have the resources to deal with the risk of homelessness themselves. The affordability of home ownership is better in Hull, but given the increased deprivation in Hull and the cost of living crisis, home ownership is currently out of the question for many people in Hull. With the increasing cost of renting and the increasing lack of availability of social housing in Hull, there is currently a housing crisis in Hull.
The percentage of people in employment, who are unemployed and who are economically inactive are all expressed as percentages of the working-age population. The weekly average earnings is the median weekly earnings before tax, National Insurance or other deductions (not the arithmetic mean or average as stated in the description). The number of households owed a prevention or relief duty under the Homelessness Reduction Act, during the financial year. Prevention duties include any activities aimed at preventing a household threatened with homelessness within 56 days from becoming homeless. Relief duties are owed to households that are already homeless and require help to secure settled accommodation. The figures all relate to the crude rate per 1,000 estimated households. The number of first time offenders is given as a rate per 100,000 population, and the number of domestic abuse related incidents and crimes, and violent crimes are both given as a rate per 1,000 population. For domestic abuse-related incidents and crimes, the same rate is given for domestic abuse throughout the Humberside Police Force Area, and it is likely the rate in Hull is higher than rates throughout most of the other areas within the Humberside Police Force Area.
Compared with benchmark
| Indicator | Period | England | Yorkshire and the Humber region (statistical) | Kingston upon Hull | East Riding of Yorkshire | North East Lincolnshire | North Lincolnshire | York | North Yorkshire UA | Barnsley | Doncaster | Rotherham | Sheffield | Bradford | Calderdale | Kirklees | Leeds | Wakefield |
|---|---|---|---|---|---|---|---|---|---|---|---|---|---|---|---|---|---|---|
Percentage of people in employment (Persons 16-64 yrs) | 2024/25 | 75.7 | 73.5 | 72.9 | 79.3 | 73.5 | 66.6 | 77.9 | 78.9 | 75.6 | 72.8 | 71.2 | 74.1 | 69.1 | 72.8 | 77.1 | 69.3 | 72.9 |
Unemployment: people claiming out of work benefit (aged 16 to 64) (Persons 16-64 yrs) | 2024/25 | 4.1 | 4.4 | 6.0 | 2.5 | 4.5 | 3.6 | 1.8 | 2.1 | 3.4 | 4.6 | 4.4 | 4.7 | 7.7 | 4.5 | 5.0 | 4.6 | 3.6 |
Economic inactivity rate (Persons 16-64 yrs) | 2024/25 | 21.2 | 24.0 | 22.4 | 17.5 | 23.4 | 29.1 | 20.0 | 20.0 | 22.8 | 24.4 | 25.6 | 24.1 | 28.6 | 25.1 | 19.4 | 28.0 | 25.2 |
Average weekly earnings (Persons 16+ yrs) | 2025 | 632.5 | 584.9 | 553.6 | 602.0 | 557.0 | 585.4 | 611.1 | 597.0 | 590.0 | 572.7 | 565.5 | 594.8 | 549.6 | 597.9 | 586.3 | 603.3 | 584.0 |
Homelessness: households owed a duty under the Homelessness Reduction Act (Not applicable Not applicable) | 2024/25 | 13.6 | 13.1 | 30.4 | 7.7 | 19.0 | 12.6 | 9.1 | 8.9 | 8.1 | 17.3 | 13.8 | 13.5 | 11.7 | 12.8 | 10.2 | 16.9 | 9.0 |
Affordability of home ownership (Persons All ages) | 2024 | 7.7 | 5.8 | 4.4 | 6.0 | 4.5 | 4.9 | 8.5 | 7.3 | 4.6 | 4.7 | 5.3 | 5.6 | 5.2 | 4.6 | 5.6 | 6.5 | 5.9 |
First time offenders (Persons 10+ yrs) | 2022 | 166 | 185 | 269 | 105 | 207 | 193 | 115 | 140 | 156 | 217 | 178 | 173 | 241 | 248 | 186 | 190 | 186 |
Domestic abuse related incidents and crimes (Persons 16+ yrs) | 2024/25 | 26.8 | 34.4 | 39.9 | 39.9 | 39.9 | 39.9 | 15.7 | 15.7 | 32.7 | 32.7 | 32.7 | 32.7 | 40.1 | 40.1 | 40.1 | 40.1 | 40.1 |
Violent crime - violence offences per 1,000 population (Persons All ages) | 2024/25 | 31.4 | 40.0 | 50.2 | 22.5 | 46.9 | 32.5 | 25.1 | 20.2 | 36.7 | 43.7 | 36.0 | 33.6 | 54.2 | 48.1 | 41.0 | 46.4 | 49.0 |
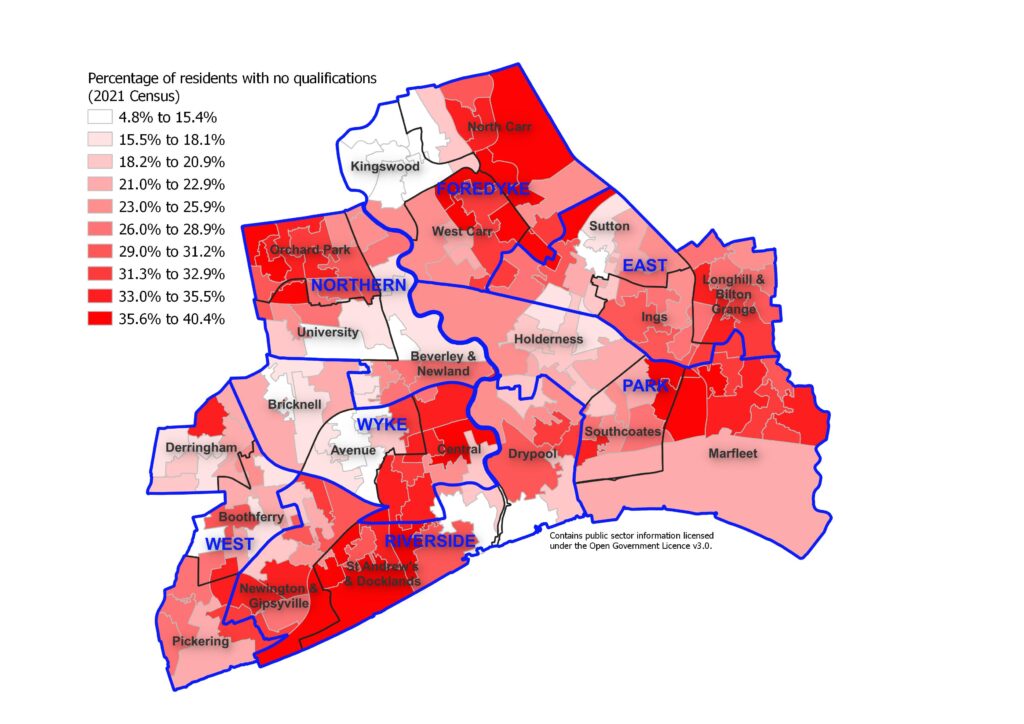
From the Annual Population Survey 2023, the educational attainment was lower among Hull residents compared to the region and Great Britain although similar percentages had no qualifications (6.0% for Hull versus 6.5% for Great Britain). Around one-third (33.0%) had National Vocational Qualification (NVQ) 4 or above (degree, full technical certificates and Higher National Certificates) compared to 41.2% across the region and 47.3% for Great Britain.
From the 2021 Census, the percentage of residents aged 16+ years who had no qualifications was much higher at 25.3% although this did include all individuals aged 16+ years so would have included people who were retired and above the working age. However, this percentage varied considerably across Hull’s wards with people living in Central (33.3%), Orchard Park (32.7%), Marfleet (32.5%), St Andrew’s & Docklands (30.7%) and Longhill & Bilton Grange (30.2%) the most likely to have no qualifications with this being the case for more than three out of every ten residents.
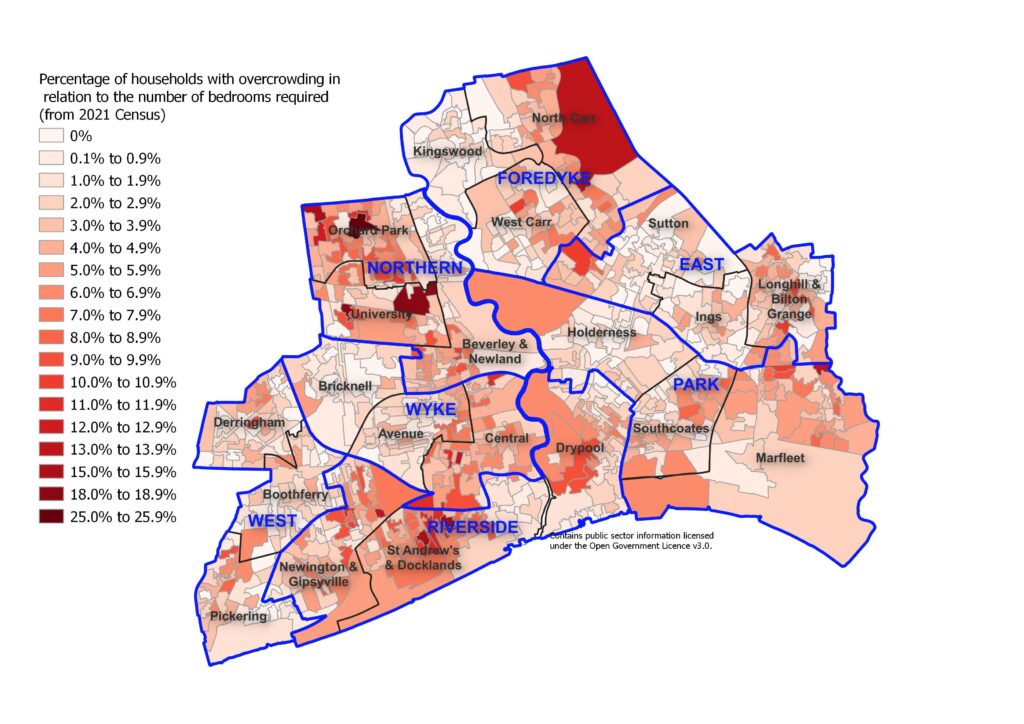
From the 2021 Census, 3,625 (3.1%) of households in Hull needed one more bedroom based on the relationship, age and gender of the occupants, and 521 (0.5%) required two or more bedrooms. However, this varied across Hull’s wards with households in Orchard Park (6.5%), Central (5.8%) and St Andrew’s & Docklands (5.7%) much more likely to be overcrowded in relation to the number of bedrooms required.
General Physical Health
Health tends to be poorer and tends to occur at an earlier age in Hull compared to most other places in England due to the high levels of deprivation and poverty in Hull as well as the higher levels of poor housing, lower educational attainment, higher unemployment and poorer quality employment, crime, domestic abuse and other detrimental factors in relation to the wider determinants of health. People in Hull have a higher prevalence of lifestyle and behavioural risk factors such as smoking, poor diet, physical inactivity, alcohol and drug use, and obesity which all further impact on health. These factors impact on both physical health and emotional wellbeing.
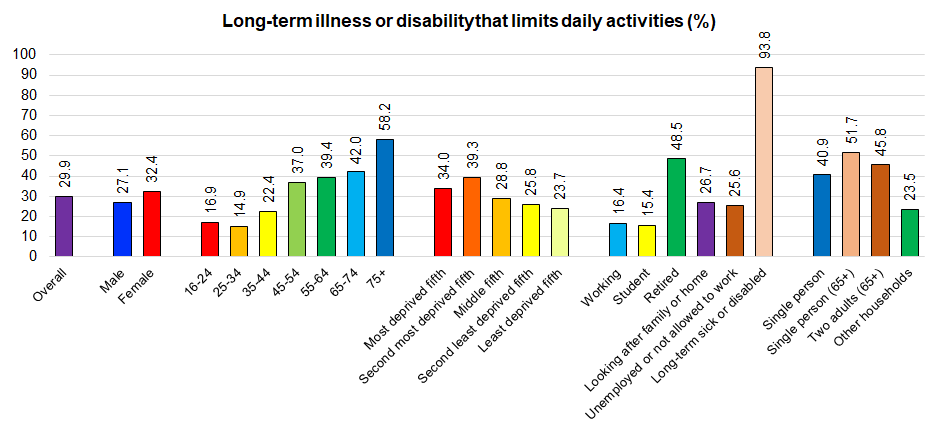
In Hull’s Heath and Wellbeing Survey 2019, 8.4% reported their health as ‘excellent’, 27.3% as ‘very good’, 34.0% as ‘good’, 20.6% as ‘fair’ and 9.6% as ‘poor’. Unsurprisingly, there was a strong association with poor health and older age and higher levels of deprivation.
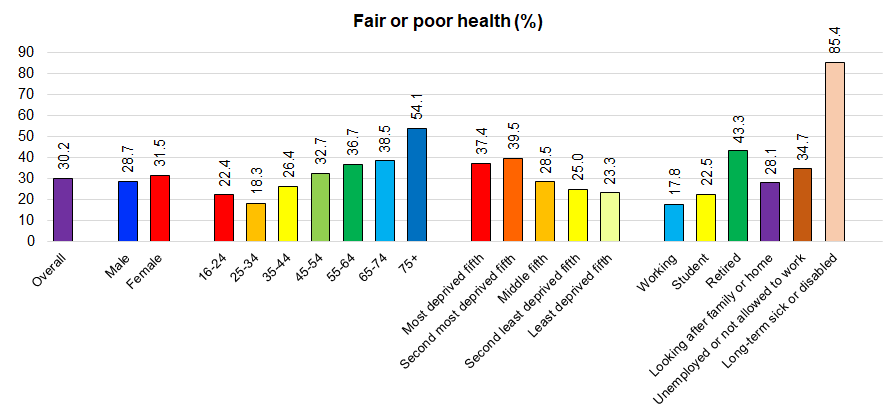
Three in ten also reported a long-term illness or disability that limited their daily activities.
Emotional Wellbeing
In general, levels of wellbeing are lower in Hull compared to England with a higher percentage of residents reporting low levels of wellbeing and/or high levels of anxiety. This is particularly the case for happiness and anxiety, although the difference in the percentage is only statistically significantly higher in Hull compared to England for anxiety for 2022/23.
People were asked, overall, how satisfied they were with their life nowadays, to what extent they felt the things they do in their life are worthwhile, how happy they felt yesterday and how anxious they felt yesterday. They were asked to rate their emotional wellbeing on a scale of 0 to 10 with 0 equating to not at all satisfied / worthwhile / happy / anxious and 10 equating to completely satisfied / worthwhile / happy / anxious. People who scored 0-4 were deemed to have poor satisfaction, feelings of being worthwhile and happiness, and people who scored 6-10 were deemed to have high levels of anxiety.
Compared with benchmark
| Indicator | Period | England | Yorkshire and the Humber region (statistical) | Kingston upon Hull | East Riding of Yorkshire | North East Lincolnshire | North Lincolnshire | York | North Yorkshire UA | Barnsley | Doncaster | Rotherham | Sheffield | Bradford | Calderdale | Kirklees | Leeds | Wakefield |
|---|---|---|---|---|---|---|---|---|---|---|---|---|---|---|---|---|---|---|
Self reported wellbeing: people with a low satisfaction score (Persons 16+ yrs) | 2022/23 | 5.6 | 6.4 | 6.3 | 7.3 | 5.9 | 4.9 | 3.7 | - | 6.8 | 7.2 | 4.5 | 6.9 | 10.2 | 9.4 | 6.2 | 3.8 | 8.5 |
Self reported wellbeing: people with a low worthwhile score (Persons 16+ yrs) | 2022/23 | 4.4 | 5.3 | 4.4 | 6.7 | 3.1 | 4.8 | 2.7 | - | 6.4 | 2.6 | 6.3 | 6.5 | 6.8 | 6.7 | 5.2 | 3.7 | 7.8 |
Self reported wellbeing: people with a low happiness score (Persons 16+ yrs) | 2022/23 | 8.9 | 9.6 | 12.1 | 11.1 | 6.2 | 10.1 | 6.2 | 7.9 | 11.3 | 7.5 | 10.4 | 7.9 | 9.8 | 13.2 | 10.7 | 9.2 | 12.1 |
Self reported wellbeing: people with a high anxiety score (Persons 16+ yrs) | 2022/23 | 23.3 | 24.2 | 29.0 | 23.7 | 20.1 | 22.9 | 26.2 | 23.4 | 22.3 | 27.4 | 24.3 | 20.8 | 26.1 | 27.1 | 25.9 | 20.1 | 30.3 |
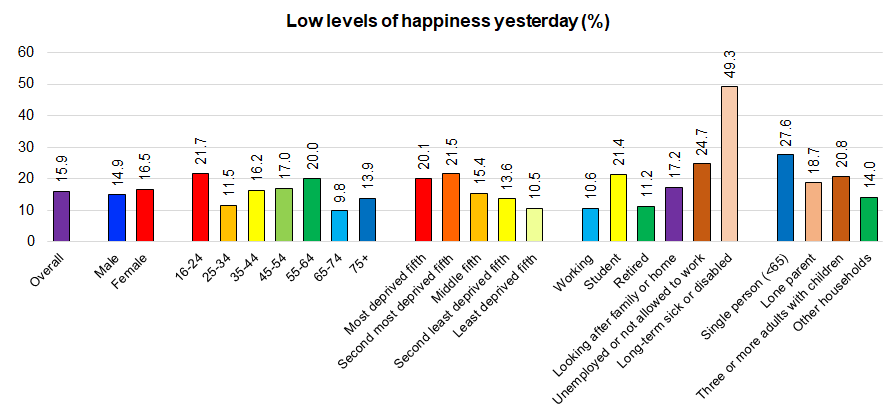
The percentages with low levels of satisfaction with life, feeling life was worthwhile, and happiness are higher in Hull compared to England. However, the percentages from Hull’s adult Health and Wellbeing Survey 2019 were substantially higher than those estimated nationally for Hull at 14%, 12%, 16% and 31% respectively. The local survey includes many more Hull people than the national survey and due to its methodology is likely to be more representative of Hull’s population. The local survey also found these levels were substantially worse among people living in the most deprived areas and were very high among people who were not working due to long-term illness or disability where around half had low levels low levels of satisfaction with life, feeling life was worthwhile, and happiness.
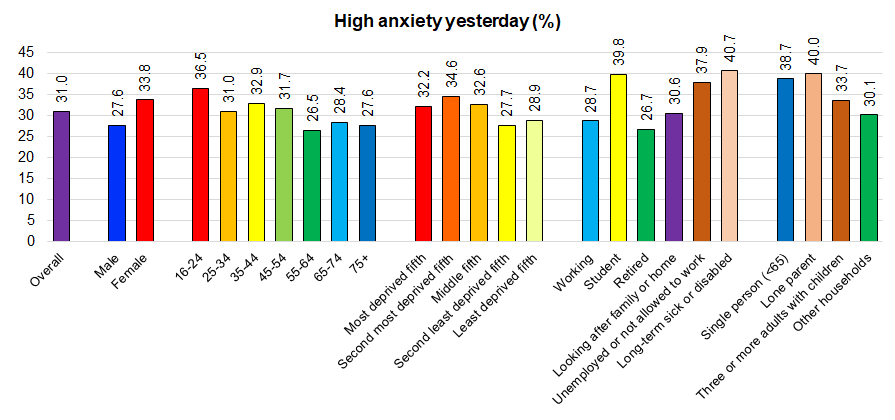
Relatively high percentages had a high level of anxiety, but it was higher among women, young people, people living in the most deprived area, students, people who were unemployed or not working due to long-term illness or disability, and lone parents.
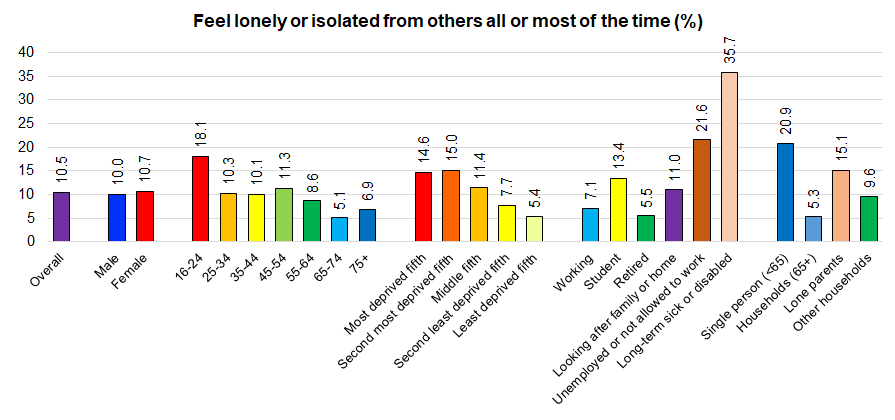
Young people, people living in the most deprived areas of Hull, students, people who were not working due to unemployment or long-term illness or disability, and lone parents had the highest levels of feeling lonely or isolated from others all or most of the time.
Lifestyle and Behavioural Factors
The prevalence of lifestyle and behavioural risk factors for poor health are higher in Hull as illustrated from The Office for Health Improvement & Disparities’ Fingertips (from different national surveys), although again there were some differences between the national data for Hull and findings from Hull’s adult Health and Wellbeing Survey 2019 with a tendency for a higher prevalence of lifestyle and behavioural risk factors in the local survey compared to national estimates. In some cases, there was a large difference between the national data for Hull and the findings from the local survey and this was the case for physical activity in particular.
Compared with benchmark
| Indicator | Period | England | Yorkshire and the Humber region (statistical) | Kingston upon Hull | East Riding of Yorkshire | North East Lincolnshire | North Lincolnshire | York | North Yorkshire UA | Barnsley | Doncaster | Rotherham | Sheffield | Bradford | Calderdale | Kirklees | Leeds | Wakefield |
|---|---|---|---|---|---|---|---|---|---|---|---|---|---|---|---|---|---|---|
Smoking Prevalence in adults (aged 18 and over) - current smokers (APS) (Persons 18+ yrs) | 2024 | 10.4 | 12.2 | 18.4 | 9.9 | 17.3 | 13.7 | 6.7 | - | 12.5 | 14.1 | 13.5 | 11.5 | 12.6 | 13.2 | 12.6 | 12.8 | 11.5 |
Percentage of adults meeting the '5-a-day' fruit and vegetable consumption recommendations (new method) (Persons 16+ yrs) | 2024/25 | 31.4 | 29.3 | 24.1 | 30.3 | 26.3 | 27.1 | 34.6 | 36.5 | 23.4 | 26.4 | 25.7 | 34.3 | 25.5 | 32.8 | 28.0 | 29.3 | 24.0 |
Percentage of physically active adults (Persons 19+ yrs) | 2024/25 | 68.0 | 67.0 | 60.0 | 70.1 | 62.5 | 61.0 | 76.2 | 71.8 | 67.4 | 60.8 | 64.5 | 69.8 | 62.1 | 68.1 | 62.4 | 70.4 | 65.7 |
Percentage of physically inactive adults (Persons 19+ yrs) | 2024/25 | 21.8 | 23.5 | 29.7 | 21.0 | 26.8 | 26.3 | 15.1 | 19.0 | 24.5 | 30.0 | 25.2 | 20.2 | 28.0 | 22.1 | 29.0 | 20.3 | 24.7 |
Overweight (including obesity) prevalence in adults, (using adjusted self-reported height and weight) (Persons 18+ yrs) | 2024/25 | 64.6 | 68.2 | 69.6 | 68.3 | 70.2 | 74.2 | 60.7 | 66.2 | 74.4 | 71.5 | 72.5 | 67.4 | 64.5 | 70.4 | 68.1 | 65.0 | 73.2 |
There are no prevalence estimates for alcohol consumption on Fingertips, but there are modelled estimates of the number of alcohol-related admissions to hospital which give an indication of prevalence and service need.
Each hospital admission has a primary diagnosis code relating to the main cause for the admission and reason why the person has been admitted. Most admissions will also have one or more secondary diagnosis codes which can give additional information relating to the primary diagnosis (in some cases information relating to an external factor) or can give additional medical conditions that needs to be considered in relation to the person’s care within hospital (see International Coding of Diseases for more information). Each diagnosis code for a hospital admission has been assigned an ‘alcohol attributable fraction‘ (AAF) for each gender and age group based on extensive research. Conditions that are wholly attributable to alcohol such as alcohol poisoning or alcoholic liver disease are given a value of 1 whereas other conditions such as those related to external causes such as car accidents might have a value of 0.2 (denoting that 20% of the admissions are alcohol-related) and other conditions will have an AAF of zero as there is no evidence that the condition is related to alcohol. The rate of alcohol-related admissions using the ‘narrow’ definition includes all AAFs for primary diagnoses and all secondary diagnoses that are related to external causes (such as car accidents, falls, suicides, etc), and the number is given as the total admissions (sum over the AAFs) per 100,000 population.
The number of alcohol-related hospital episodes is considerably higher in Hull than England.
Compared with benchmark
| Indicator | Period | England | Yorkshire and the Humber region (statistical) | Kingston upon Hull | East Riding of Yorkshire | North East Lincolnshire | North Lincolnshire | York | Barnsley | Doncaster | Rotherham | Sheffield | Bradford | Calderdale | Kirklees | Leeds | Wakefield | North Yorkshire Cty |
|---|---|---|---|---|---|---|---|---|---|---|---|---|---|---|---|---|---|---|
Admission episodes for alcohol-related conditions (Narrow) (Persons All ages) | 2023/24 | 504 | 548 | 694 | 504 | 624 | 525 | 518 | 684 | 651 | 655 | 630 | 511 | 494 | 499 | 444 | 524 | - |
The estimated prevalence of people who use opiate and/or crack cocaine are also calculated in a different way. The estimated prevalence uses a capture-recapture method to estimate the number of people who used opiate and/or crack cocaine. The capture-recapture method is often used to estimate the population size of an animal species with animals trapped, marked in a harmless way and released, and then new traps are set a few days later, and the number of marked and unmarked animals caught being recorded. The population size is then estimated to be the number in the first sample multiplied by the number in the second sample divided by the number in the second sample previously marked. In the case of opiate and/or crack use, the number of people who use opiate and/or crack cocaine were identified from drug treatment, probation, police and prison data was used, and then the overlap between the data sources was used together with modelling techniques to examine this overlap and to produce prevalence estimates for those aged 15-64 years based on this capture-recapture methodology.
For 2019/20, it was estimated that there are more than twice as many residents aged 15-64 years who use opiates and/or crack cocaine compared to England (22.2 versus 9.5 per 1,000 population). The rate in Hull is the fourth highest among the 148 upper-tier local authorities with data with City of London (56.8 per 1,000 population), Middlesbrough (31.3 per 1,000 population) and Blackpool (28.6 per 1,000 population) having higher rates compared to Hull.
Compared with benchmark
| Indicator | Period | England | Yorkshire and the Humber region (statistical) | Kingston upon Hull | East Riding of Yorkshire | North East Lincolnshire | North Lincolnshire | York | North Yorkshire UA | Barnsley | Doncaster | Rotherham | Sheffield | Bradford | Calderdale | Kirklees | Leeds | Wakefield |
|---|---|---|---|---|---|---|---|---|---|---|---|---|---|---|---|---|---|---|
Estimated prevalence of opiate and/or crack cocaine use (Persons 15-64 yrs) | 2022/23 | 8.5 | 11.6 | 20.4 | 6.1 | 17.0 | 14.4 | 9.3 | 5.5 | 13.9 | 15.6 | 13.2 | 12.5 | 14.4 | 11.5 | 9.6 | 9.8 | 12.0 |
From Hull’s Health and Wellbeing Survey 2019 conducted among those aged 16+ years:
- 25% smoked (including 4.5% who smoked 20+ cigarettes per day) and 29% were former smokers;
- 13% used e-cigarettes;
- 21% stated they ate 5-A-DAY portions of fruit and vegetables daily, but 7% usually ate no portions of fruit and vegetables;
- 27% stated they did not have a healthy diet (and a further 10% did not know what a healthy diet was or if they if they had a healthy diet);
- 41% of adults were physically active undertaking 150+ minutes of moderate or vigorous physical activity per week and 44% were inactive undertaking fewer than 30 minutes of moderate or vigorous physical activity per week;
- 70% were overweight including 31% who were obese;
- 22% never drank alcohol, but 30% displayed harmful alcohol drinking behaviours (exceeding 14 units the previous week, usually binge drink weekly and/or a Fast Alcohol Screening Test of three or more);
- 8.3% stated they had used drugs other than those required for medical reasons in the last year, including 3.7% who stated they used them everyday or weekly; and
- 4% had lied to people important to them about their gambling and/or felt the need to bet more and more money in the last year.
There were substantial differences by gender, age, deprivation, employment status and household composition with the highest percentages with lifestyle and behavioural risk factors for poor health generally found among young people, people living in the most deprived areas, people who were unemployed or not working due to long-term illness or disability, and lone parents. Further information on each lifestyle and behavioural risk factor can be found in Lifestyle Factors within Adults, and further information is also available in the full survey report available in Local Surveys Involving Adults under Tools and Resources.
Prevalence of Medical Conditions and Diseases
A number of specific diseases and medical conditions are measured within the Quality and Outcomes Framework (QOF) within primary care. These disease registers can be used to measure diagnosed prevalence at a practice level as well as at sub Integrated Care Board level.
As mentioned above, the number of people living in Hull based on GP registration information is higher than the estimated resident population from the Office for National Statistics, and a sizeable proportion of patients registered with Hull GPs live in East Riding of Yorkshire (over 8%). Thus the QOF data comprises around 92% of Hull residents and around 8% of East Riding of Yorkshire residents.
Fingertips presents the percentage of patients on these disease registers at sub ICB level. With higher levels of deprivation, one might expect that the prevalence of some conditions to be higher in Hull. However, this is not necessarily the case. There are many factors that can influence the prevalence in Hull such as the lower age structure of Hull’s population, lower numbers of people from minority ethnic backgrounds, higher mortality rates and slightly lower life expectancy, and the rate of diagnosis. It is possible that there are more people living in Hull who have a specific disease or medical condition but it is not diagnosed, and therefore they are not included on their GP disease registers. There tends to be higher rates of undiagnosed disease among areas with higher deprivation levels.
A local analysis of the information has been undertaken for Hull for 2024/25 and is presented in the following file. Further details can be found on Local Analysis of Quality and Outcomes Framework Data under Tools and Resources.
The sub Integrated Care Board areas which include Hull are within the Humber and North Yorkshire Integrated Care Board. In Fingertips, the sub-ICB area referenced by 03F relates to Hull (see Integrated Care Board for the codes relating to the other local sub-ICB areas).
For 2024/25, the diagnosed prevalence of coronary heart disease, hypertension (high blood pressure) and peripheral arterial disease are higher or comparable for patients registered with Hull GPs compared to England, but the prevalence of stroke and transient ischaemic attack, heart failure, and atrial fibrillation are all lower.
Further information including trends over time can be found under Cardiovascular Disease under Health Factors under Adults.
Compared with benchmark
| Indicator | Period | England | NHS Humber and North Yorkshire Integrated Care Board - QOQ | Humber and North Yorkshire ICB - 02Y | Humber and North Yorkshire ICB - 03F | Humber and North Yorkshire ICB - 03H | Humber and North Yorkshire ICB - 03K | Humber and North Yorkshire ICB - 03Q | Humber and North Yorkshire ICB - 42D |
|---|---|---|---|---|---|---|---|---|---|
CHD: QOF prevalence (Persons All ages) | 2024/25 | 3.0 | 3.8 | 4.6 | 3.2 | 3.6 | 4.0 | 2.9 | 4.0 |
Stroke: QOF prevalence (Persons All ages) | 2024/25 | 1.9 | 2.4 | 2.6 | 1.6 | 2.6 | 2.3 | 2.3 | 2.7 |
Heart Failure: QOF prevalence (Persons All ages) | 2024/25 | 1.1 | 1.2 | 1.5 | 0.8 | 1.0 | 1.0 | 1.3 | 1.5 |
Atrial fibrillation: QOF prevalence (Persons All ages) | 2024/25 | 2.2 | 2.9 | 3.4 | 1.8 | 2.8 | 2.6 | 2.6 | 3.3 |
Hypertension: QOF prevalence (Persons All ages) | 2024/25 | 15.2 | 17.8 | 20.9 | 15.5 | 17.2 | 18.1 | 14.5 | 19.0 |
PAD: QOF prevalence (Persons All ages) | 2024/25 | 0.6 | 0.8 | 0.9 | 0.7 | 1.0 | 0.6 | 0.6 | 0.8 |
The prevalence of epilepsy and diabetes are both higher in Hull (03F) than England, but the prevalence of chronic kidney disease is lower for 2024/25.
Further information including trends over time can be found under Epilepsy, Diabetes and Kidney Disease under Health Factors under Adults.
Compared with benchmark
| Indicator | Period | England | NHS Humber and North Yorkshire Integrated Care Board - QOQ | Humber and North Yorkshire ICB - 02Y | Humber and North Yorkshire ICB - 03F | Humber and North Yorkshire ICB - 03H | Humber and North Yorkshire ICB - 03K | Humber and North Yorkshire ICB - 03Q | Humber and North Yorkshire ICB - 42D |
|---|---|---|---|---|---|---|---|---|---|
Epilepsy: QOF prevalence (Persons 18+ yrs) | 2024/25 | 0.8 | 0.9 | 1.0 | 1.0 | 1.1 | 1.0 | 0.7 | 0.9 |
Diabetes: QOF prevalence (Persons 17+ yrs) | 2024/25 | 7.9 | 8.2 | 9.3 | 9.1 | 8.8 | 9.0 | 5.8 | 7.8 |
CKD: QOF prevalence (Persons 18+ yrs) | 2024/25 | 4.6 | 5.4 | 6.3 | 3.4 | 6.9 | 4.8 | 4.1 | 6.2 |
For 2024/25, the diagnosed prevalence of asthma is marginally lower among Hull (03F) patients compared to England, but the diagnosed prevalence of chronic obstructive pulmonary disease is considerably higher in Hull compared to England.
Further information including trends over time can be found under Respiratory Disease under Health Factors under Adults.
Compared with benchmark
| Indicator | Period | England | NHS Humber and North Yorkshire Integrated Care Board - QOQ | Humber and North Yorkshire ICB - 02Y | Humber and North Yorkshire ICB - 03F | Humber and North Yorkshire ICB - 03H | Humber and North Yorkshire ICB - 03K | Humber and North Yorkshire ICB - 03Q | Humber and North Yorkshire ICB - 42D |
|---|---|---|---|---|---|---|---|---|---|
Asthma: QOF prevalence (Persons 6+ yrs) | 2024/25 | 6.6 | 7.2 | 7.6 | 6.3 | 7.3 | 7.0 | 6.8 | 7.7 |
COPD: QOF prevalence (Persons All ages) | 2024/25 | 1.9 | 2.5 | 2.8 | 3.2 | 3.2 | 2.7 | 1.6 | 2.1 |
The diagnosed incidence of depression and severe mental health illness for Hull (03F) are the same as England for 2024/25, the prevalence learning disabilities is marginally higher, and prevalence of dementia is lower.
Further information including trends over time can be found under Mental Health and Emotional Wellbeing Among Adults and Dementia under Health Factors under Adults, and under Learning Disabilities and Mental Ill Health under Vulnerable Groups.
Compared with benchmark
| Indicator | Period | England | NHS Humber and North Yorkshire Integrated Care Board - QOQ | Humber and North Yorkshire ICB - 02Y | Humber and North Yorkshire ICB - 03F | Humber and North Yorkshire ICB - 03H | Humber and North Yorkshire ICB - 03K | Humber and North Yorkshire ICB - 03Q | Humber and North Yorkshire ICB - 42D |
|---|---|---|---|---|---|---|---|---|---|
Depression: QOF incidence - new diagnosis (Persons 18+ yrs) | 2024/25 | 1.4 | 1.1 | 1.2 | 1.4 | 1.6 | 1.2 | 0.8 | 0.8 |
Mental Health: QOF prevalence (Persons All ages) | 2024/25 | 1.0 | 0.9 | 0.8 | 1.0 | 1.0 | 0.9 | 0.9 | 0.9 |
Learning disability: QOF prevalence (Persons All ages) | 2024/25 | 0.6 | 0.6 | 0.6 | 0.7 | 0.7 | 0.7 | 0.4 | 0.6 |
Dementia: QOF prevalence (Persons All ages) | 2024/25 | 0.8 | 0.9 | 1.1 | 0.6 | 1.0 | 0.9 | 0.7 | 1.0 |
The prevalence of diagnosed osteoporosis is considerably lower in Hull than England being less than half the levels of England, but the prevalence of diagnosed rheumatoid arthritis is the same as England.
Further information including trends over time can be found under Musculoskeletal Disorders and Falls and Frailty under Health Factors under Adults.
Compared with benchmark
| Indicator | Period | England | NHS Humber and North Yorkshire Integrated Care Board - QOQ | Humber and North Yorkshire ICB - 02Y | Humber and North Yorkshire ICB - 03F | Humber and North Yorkshire ICB - 03H | Humber and North Yorkshire ICB - 03K | Humber and North Yorkshire ICB - 03Q | Humber and North Yorkshire ICB - 42D |
|---|---|---|---|---|---|---|---|---|---|
Osteoporosis: QOF prevalence (Persons 50+ yrs) | 2024/25 | 1.2 | 1.2 | 1.6 | 0.5 | 1.2 | 0.5 | 1.6 | 1.4 |
Rheumatoid Arthritis: QOF prevalence (Persons 16+ yrs) | 2024/25 | 0.8 | 0.9 | 1.0 | 0.8 | 0.9 | 0.9 | 0.7 | 1.0 |
Impact of Physical and Mental Health Conditions on Quality of Life
Whilst severe mental health can shorten life dramatically (see Mental Ill Health under Vulnerable Groups), many mental health conditions and other medical conditions that are non-fatal can have a significant impact on daily life and quality of life.
Years of life lost can be calculated for specific diseases and medical conditions that cause death, and healthy life expectancy gives a measure of the life expectancy in ‘good’ health. However, in order to provide estimates of disability-adjusted or quality-adjusted life years or life expectancy or years of healthy life lost due to a disability, it is necessary to have some measure of quality of life and the impact of various fatal and non-fatal conditions have on quality of life. The World Health Organisation have produced estimates for different fatal and non-fatal conditions, and within the Global Burden of Disease tool, the years of healthy life lost due to a disability (YLD) and the disability-adjusted life years (DALYs) are calculated for different diseases and medical conditions. Both present the information as the percentage for a specific disease or medical condition out of the total YLD or total DALY. Data is modelled for Hull for males and females separately as well as for persons, and for five age groups (<5, 5-14, 15-49, 50-69 and 70+ years) as well as for all ages. As well as YLDs and DALYs, the tools also gives information the same information for deaths.
The Global Burden of Disease tool can be accessed as follows:
The years of healthy life lost to disability (YLDs) as a percentage of the total year of healthy life lost of disability are given below for the conditions and diseases where the percentage is 5% or greater. Additional disease groupings have been made so that the numbers will sum to more than 100% despite not including all conditions considered. For instance, for children under 5 years, the percentage is given for communicable disease, maternal factors, neonatal conditions and nutritional diseases combined, and dietary iron deficiency appears to be a subset of nutritional deficiencies.
The list of medical conditions and diseases are given for each age group separately, and ranked by the percentage for males and females combined.
Skin conditions, respiratory conditions, birth defects, dietary iron deficiencies among females, mental disorders and prematurity are the conditions that account for the highest percentages of healthy life lost among children under five years in Hull.
| Condition | Males <5 (% YLD) | Females <5 (% YLD) | Persons <5 (% YLD) |
| Non-communicable diseases | 73 | 63 | 67 |
| Communicable, maternal, neonatal and nutritional diseases | 23 | 35 | 30 |
| Skin and subcutaneous diseases | 24 | 25 | 24 |
| Dermatitis | 16 | 17 | 17 |
| Atopic dermatitis | 16 | 17 | 16 |
| Other non-communicable diseases | 14 | 13 | 13 |
| Chronic respiratory diseases | 14 | 10 | 12 |
| Asthma | 14 | 10 | 12 |
| Congenital birth defects | 12 | 10 | 11 |
| Respiratory infections and tuberculosis | 10 | 9 | 10 |
| Neonatal disorders | 9 | 8 | 9 |
| Maternal and neonatal disorders | 9 | 8 | 9 |
| Mental disorders | 12 | 5 | 9 |
| Nutritional deficiencies | 1 | 13 | 7 |
| Dietary iron deficiency | 1 | 13 | 7 |
| Autism spectrum disorders | 10 | 3 | 7 |
| Upper respiratory infections | 7 | 6 | 7 |
| Neonatal preterm birth | 5 | 5 | 5 |
Mental disorders, skin conditions, respiratory conditions, headaches and migraines account for the highest percentages of healthy life lost among children aged 5-14 years in Hull.
| Condition | Males 5-14 (% YLD) | Females 5-14 (% YLD) | Persons 5-14 (% YLD) |
| Non-communicable diseases | 85 | 85 | 85 |
| Mental disorders | 33 | 31 | 32 |
| Skin and subcutaneous diseases | 15 | 16 | 16 |
| Anxiety disorders | 11 | 15 | 13 |
| Chronic respiratory diseases | 12 | 10 | 11 |
| Asthma | 12 | 10 | 11 |
| Communicable, maternal, neonatal and nutritional diseases | 11 | 11 | 11 |
| Neurological disorders | 9 | 11 | 10 |
| Dermatitis | 7 | 8 | 8 |
| Conduct disorder | 10 | 5 | 7 |
| Atopic dermatitis | 7 | 8 | 7 |
| Headache disorders | 5 | 8 | 7 |
| Musculoskeletal disorders | 5 | 7 | 6 |
| Migraine | 5 | 7 | 6 |
| Other non-communicable diseases | 5 | 7 | 6 |
| Depressive disorders | 5 | 6 | 5 |
| Major depressive disorders | 4 | 6 | 5 |
| Autism spectrum disorders | 5 | 2 | 3 |
Mental disorders, musculoskeletal disorders, substance use disorders, neurological disorders, headaches and migraines, gynaecological diseases (for females) and injuries account for the highest percentages of healthy life lost among young adults and adults aged 15-49 years in Hull.
| Condition | Males 15-49 (% YLD) | Females 15-49 (% YLD) | Persons 15-49 (% YLD) |
| Non-communicable diseases | 89 | 92 | 90 |
| Mental disorders | 26 | 25 | 25 |
| Musculoskeletal disorders | 17 | 17 | 17 |
| Depressive disorders | 11 | 11 | 11 |
| Substance use disorders | 16 | 5 | 10 |
| Neurological disorders | 8 | 11 | 10 |
| Major depressive disorders | 9 | 10 | 10 |
| Low back pain | 9 | 9 | 9 |
| Other non-communicable diseases | 3 | 14 | 9 |
| Headache disorders | 6 | 10 | 8 |
| Migraine | 6 | 9 | 7 |
| Anxiety disorders | 6 | 7 | 6 |
| Gynaecological disorders | 0 | 10 | 6 |
| Drug use disorders | 8 | 4 | 6 |
| Injuries | 7 | 4 | 5 |
| Chronic respiratory diseases | 4 | 6 | 5 |
| Asthma | 4 | 5 | 5 |
| Unintentional injuries | 6 | 3 | 5 |
| Alcohol use disorders | 8 | 2 | 4 |
| Opioid use disorders | 5 | 3 | 4 |
| Other gynaecological diseases | 0 | 6 | 3 |
Musculoskeletal disorders, mental disorders, diabetes and kidney disease, injuries, sense organ diseases, neurological disorders, osteoarthritis and headaches account for the highest percentages of healthy life lost among adults aged 50-69 years in Hull.
| Condition | Males 50-69 (% YLD) | Females 50-69 (% YLD) | Persons 50-69 (% YLD) |
| Non-communicable diseases | 89 | 91 | 90 |
| Musculoskeletal disorders | 24 | 29 | 27 |
| Mental disorders | 15 | 15 | 15 |
| Low back pain | 11 | 13 | 12 |
| Diabetes and kidney diseases | 10 | 7 | 8 |
| Injuries | 9 | 7 | 8 |
| Other non-communicable diseases | 5 | 9 | 8 |
| Diabetes mellitus | 9 | 6 | 7 |
| Sense organ diseases | 8 | 6 | 7 |
| Diabetes mellitus type 2 | 8 | 5 | 7 |
| Depressive disorders | 6 | 7 | 7 |
| Unintentional injuries | 7 | 6 | 7 |
| Neurological disorders | 5 | 7 | 6 |
| Major depressive disorders | 5 | 6 | 6 |
| Osteoarthritis | 5 | 6 | 5 |
| Headache disorders | 3 | 5 | 4 |
| Age-related and other hearing loss | 5 | 3 | 4 |
Musculoskeletal disorders, sense organ diseases, neurological disorders, injuries, diabetes and kidney disease, injuries, cardiovascular diseases, mental disorders, Alzheimer’s disease and other dementias, chronic respiratory disease and neoplasms account for the highest percentages of healthy life lost among adults aged 70+ years in Hull.
| Condition | Males 70+ (% YLD) | Females 70+ (% YLD) | Persons 70+ (% YLD) |
| Non-communicable diseases | 91 | 88 | 89 |
| Musculoskeletal disorders | 18 | 22 | 21 |
| Sense organ diseases | 13 | 13 | 13 |
| Low back pain | 8 | 11 | 10 |
| Neurological disorders | 8 | 11 | 9 |
| Injuries | 8 | 10 | 9 |
| Diabetes and kidney diseases | 11 | 8 | 9 |
| Age-related and other hearing loss | 10 | 8 | 9 |
| Unintentional injuries | 7 | 10 | 9 |
| Cardiovascular diseases | 9 | 7 | 8 |
| Mental disorders | 7 | 8 | 8 |
| Falls | 5 | 8 | 7 |
| Other non-communicable diseases | 6 | 7 | 7 |
| Alzheimer’s disease and other dementias | 5 | 7 | 6 |
| Diabetes mellitus | 8 | 5 | 6 |
| Diabetes mellitus type 2 | 7 | 5 | 6 |
| Chronic respiratory diseases | 6 | 5 | 6 |
| Osteoarthritis | 5 | 6 | 6 |
| Chronic obstructive pulmonary disease | 5 | 4 | 4 |
| Neoplasms | 5 | 3 | 4 |
Across all age groups, musculoskeletal disorders, mental disorders, neurological disorders, injuries, diabetes and kidney disease, sense organ diseases, headache, chronic respiratory diseases, substance use disorders and gynaecological diseases (for females) account for the highest percentages of healthy life lost among adults aged 50-69 years in Hull.
| Condition | Males all ages (% YLD) | Females all ages (% YLD) | Persons all ages (% YLD) |
| Non-communicable diseases | 89 | 90 | 90 |
| Musculoskeletal disorders | 18 | 21 | 20 |
| Mental disorders | 19 | 19 | 19 |
| Low back pain | 9 | 10 | 10 |
| Neurological disorders | 7 | 10 | 9 |
| Other non-communicable diseases | 4 | 11 | 8 |
| Depressive disorders | 7 | 8 | 8 |
| Injuries | 8 | 6 | 7 |
| Major depressive disorders | 6 | 7 | 7 |
| Diabetes and kidney diseases | 7 | 5 | 6 |
| Sense organ diseases | 6 | 6 | 6 |
| Unintentional injuries | 7 | 5 | 6 |
| Headache disorders | 4 | 6 | 5 |
| Chronic respiratory diseases | 5 | 6 | 3 |
| Substance use disorders | 8 | 3 | 5 |
| Anxiety disorders | 4 | 6 | 5 |
| Migraine | 4 | 6 | 5 |
| Diabetes mellitus | 6 | 4 | 5 |
| Diabetes mellitus type 2 | 6 | 4 | 5 |
| Gynaecological diseases | 0 | 6 | 3 |
Mortality
Adult mortality rates are generally presented as direct standardised mortality rates per 100,000 population (standardised to the European Standard Population). Most of these mortality rates related to premature mortality or deaths that occurred prior to the age of 75 years. All the deaths are a count of the number of deaths there were registered in the specified calendar year(s) rather than a count of the number of deaths that occurred in the specified year or period. There is a legal requirement to register a death within a few days so most death registrations will occur quickly after the death, but there will be delays (in some cases considerable delays) for deaths that require a post-mortem or deaths which require an inquest where a doctor has not seen the deceased recently or where the cause cannot be determined or is suspicious. For a particularly year or period of time, the number of deaths based on occurrence or registration may differ considerably for some causes of death such as drug-related deaths or where suicide is suspected where an inquest is required.
Trends in the Total Number of Deaths
As the majority of analyses use the number of deaths registered in the year rather than the number which occurred in that year, the number of deaths registered in each year is presented below.
Immediately prior to the COVID-19 pandemic, there were around 2,500 deaths registered among Hull residents each year, but this increased to a high of 2,866 deaths for 2020. Whilst this has steadily decreased to 2,633 in 2024, the number is still higher than the numbers observed in 2018 and 2019. It is likely that the numbers will increase over time due to the ageing population.
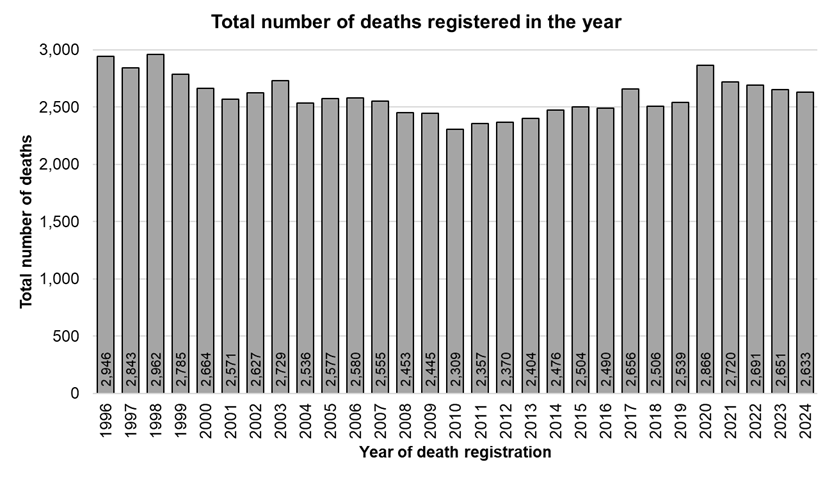
Prior to 2016, for most years, there were more deaths among Hull women than there were among Hull men. The number of men and women in Hull’s population has been around 50% but there has generally been a slightly more older women in Hull which will influence the total number of deaths. However, between 2016 and 2024, the total number of deaths among men has been higher, and this was particularly the case for deaths occurring in 2020 as men had a higher mortality rate from COVID-19.
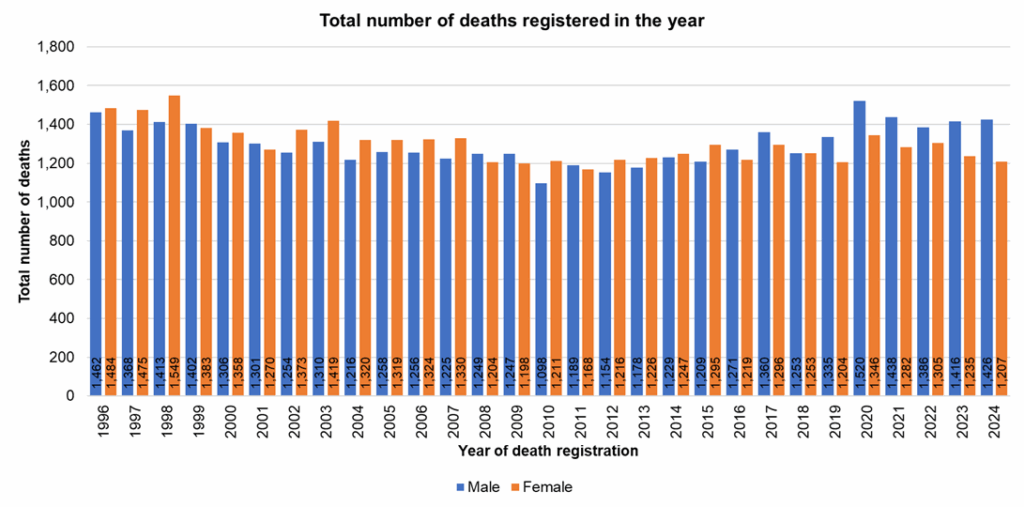
By Cause of Death
Detailed information on the percentage of deaths from different causes are compared within Causes of Death under Population. This topic page also presents information on all causes combined such as trends in the total number of deaths, the percentage of deaths by age, mortality rates by age, the total number of deaths and trends by cause of death as well as presenting overall mortality rates across Hull’s 21 electoral wards and by local deprivation fifth (based on the Index of Multiple Deprivation). Mortality rates are given within the Causes of Death page for all ages, for premature deaths (under 75 years) and for premature deaths from causes considered to be preventable.
The total number of deaths increased substantially during the COVID-19 pandemic with a relatively high number of deaths from COVID-19. However, in some cases, the mortality from other medical conditions and diseases decreased during this period of time due to ‘competing causes of death’. For instance, the total number of deaths involving cancer, diabetes, obesity and dementia or Alzheimer’s disease were all higher during 2020 and 2021 compared to 2018 and 2019 with more deaths with that cause listed as a contributory or secondary cause due to some dying from COVID-19. Further information on this is also given within the Causes of Death topic page.
Information on people killed and seriously injured on the roads can be found within Accidents and Injuries Among Children and Young People under Children and Young People under Health Factors. Information on stillbirths, neonatal and infant deaths can be found within Stillbirths and Infant Mortality under Children and Young People and Pregnancy and Infants. Information on the percentage of deaths occurring at different locations can be found within Palliative Care and End of Life under Adults and Health Factors.
The more detailed information relating to specific causes of death includes trends mortality rates and can include information by sex (if information is available) and mortality rates for more specific causes of death such as lung cancer, colorectal cancer, coronary heart disease, stroke, chronic obstructive pulmonary disease (depending on the topic page). Mortality rates might also be presented for all ages and under 75s, or in relation to premature deaths (under 75s) from causes considered to be preventable (depending on the specific cause and if information is available).
This more detailed information can be found on the following topic JSNA pages:
- Cancer
- Cardiovascular Disease
- Coronavirus (COVID-19)
- Dementia
- Diabetes
- Falls and Frailty
- Infectious Diseases
- Liver Disease
- Mental Ill Health
- Respiratory Disease
- Suicide and Self-Harm
- Alcohol Consumption
- Drug Use
- Smoking and Vaping
Top Five Causes of Death
Clearly, the top five causes of death depend on which causes are combined. Many different causes can be combined such as combining coronary heart disease, stroke, heart failure and other forms of cardiovascular disease into a single category of ‘all cardiovascular disease’, or combining ‘all cancers’ into a single category. For transparency here, the same causes of death have been used to classify the top causes as those used above in the table on Causes of Death (excluding the ‘other’ categories such as ‘other cancer’ or ‘other circulatory disease’), including drug poisoning, suicide and undetermined injury and alcohol-specific (even though these three causes overlap with some of the other causes).
Using these causes of death, the top five causes of death among males aged under 75 years are as follows (average number of deaths registered each year between 2022-24):
- Coronary heart disease (130)
- Lung cancer (47)
- Chronic obstructive pulmonary disease (37)
- Drug poisoning (36)
- Alcohol-specific deaths (32)
The top five causes of death among males aged 75+ years are as follows (average number of deaths registered each year between 2022-24):
- Coronary heart disease (99)
- Dementia (64)
- Chronic obstructive pulmonary disease (50)
- Lung cancer (47)
- Stroke (41)
The top five causes of death among females aged under 75 years are as follows (average number of deaths registered each year between 2022-24):
- Lung cancer (40)
- Coronary heart disease (36)
- Chronic obstructive pulmonary disease (33)
- Breast cancer (24)
- Non-alcoholic digestive diseases (23)
The top five causes of death among females aged 75+ years are as follows (average number of deaths registered each year between 2022-24):
- Dementia (112)
- Coronary heart disease (67)
- Chronic obstructive pulmonary disease (65)
- Stroke (49)
- Lung cancer (48)
For all males, the top five causes of death registered in 2022-24 were coronary heart disease, lung cancer, chronic obstructive pulmonary disease, dementia and stroke. For all females, the top five causes of death were dementia, coronary heart disease, chronic obstructive pulmonary disease, lung cancer and stroke.
Among men and women aged under 75 years, the top causes of death registered in 2022-24 were coronary heart disease, lung cancer, chronic obstructive pulmonary disease, non-alcoholic digestive diseases and drug poisoning, and among those aged 75+ years, the top five causes were dementia, coronary heart disease, chronic obstructive pulmonary disease, lung cancer and stroke.
Overall, across both men and women, the top five causes of death were coronary heart disease, dementia, chronic obstructive pulmonary disease, lung cancer and stroke.
Prior to the COVID-19 pandemic for deaths registered over the three year period 2017 to 2019 (excluding ‘other cancers’), the top causes were the same albeit in a different order with stroke instead of COVID-19 as a top five cause of men (both ages) and influenza and pneumonia as a top five cause for women aged 75+ years instead of COVID-19. Further analysis of the mortality data in relation to the COVID-19 pandemic is given within Causes of Death under Population.
Comparison with England and the Region
The infant mortality rate (deaths under one year of age) and the child mortality rate in Hull are both comparable to England. The numbers are not presented for all local authorities for child mortality as the number of deaths is too small.
Compared with benchmark
| Indicator | Period | England | Yorkshire and the Humber region (statistical) | Kingston upon Hull | East Riding of Yorkshire | North East Lincolnshire | North Lincolnshire | York | North Yorkshire UA | Barnsley | Doncaster | Rotherham | Sheffield | Bradford | Calderdale | Kirklees | Leeds | Wakefield |
|---|---|---|---|---|---|---|---|---|---|---|---|---|---|---|---|---|---|---|
Infant mortality rate (Persons <1 yr) | 2022 - 24 | 4.2 | 5.1 | 4.0 | 3.1 | 2.7 | 6.6 | 3.7 | 3.7 | 3.7 | 5.0 | 3.9 | 5.7 | 7.2 | 3.3 | 6.6 | 5.2 | 5.5 |
Child mortality rate (1 to 17 years) (Persons 1-17 yrs) | 2022 - 24 | 11.6 | 14.3 | 11.5 | 11.5 | 15.0 | 13.9 | - | 8.4 | 13.7 | 13.1 | 15.1 | 11.9 | 22.4 | 15.6 | 18.0 | 15.0 | 12.5 |
For deaths registered during the three year period 2022-24, the direct standardised mortality rates for all ages, premature deaths (under 75 years) and premature deaths from causes considered preventable are all considerably higher than and statistically significantly higher in Hull compared to England. Mortality rates are generally higher among men compared to women (further information is available within Causes of Death under Population).
Compared with benchmark
| Indicator | Period | England | Yorkshire and the Humber region (statistical) | Kingston upon Hull | East Riding of Yorkshire | North East Lincolnshire | North Lincolnshire | York | North Yorkshire UA | Barnsley | Doncaster | Rotherham | Sheffield | Bradford | Calderdale | Kirklees | Leeds | Wakefield |
|---|---|---|---|---|---|---|---|---|---|---|---|---|---|---|---|---|---|---|
Mortality rate from all causes, all ages (Persons All ages) | 2023 - 25 | 933 | 1009 | 1216 | 915 | 1126 | 1053 | 899 | 858 | 1093 | 1115 | 1071 | 1017 | 1060 | 1015 | 1019 | 993 | 1081 |
Under 75 mortality rate from all causes (Persons <75 yrs) | 2023 - 25 | 330.5 | 370.5 | 497.1 | 307.7 | 462.4 | 401.3 | 307.1 | 282.2 | 403.4 | 422.5 | 397.2 | 368.2 | 412.4 | 375.7 | 371.0 | 365.1 | 395.8 |
Under 75 mortality rate from causes considered preventable (Persons <75 yrs) | 2022 - 24 | 151.2 | 174.2 | 244.4 | 134.7 | 212.3 | 185.9 | 142.7 | 133.3 | 195.6 | 210.1 | 186.5 | 167.4 | 200.1 | 183.3 | 176.2 | 166.0 | 187.9 |
Trends Over Time
In general, the infant mortality rate in Hull has been slightly higher than England for the majority of the three-year periods in the last 20 years, although the has been no statistically significant difference between Hull and England over the entire last 20 years.
The child mortality rate has generally also not been statistically significantly different in Hull compared to England for most years although there has been considerable year-on-year variability due to the small numbers (see Small Numbers within the Glossary).
Compared with benchmark
Infant mortality rate (Persons <1 yr)
|
Period
|
Kingston upon Hull |
Yorkshire and the Humber region (statistical)
|
England
|
||||
|---|---|---|---|---|---|---|---|
|
Count
|
Value
|
95%
Lower CI |
95%
Upper CI |
||||
| 2001 - 03 | • | 43 | 5.0 | 3.6 | 6.7 | 5.9 | 5.4 |
| 2002 - 04 | • | 43 | 4.8 | 3.5 | 6.5 | 5.9 | 5.2 |
| 2003 - 05 | • | 46 | 4.9 | 3.6 | 6.5 | 5.8 | 5.1 |
| 2004 - 06 | • | 53 | 5.3 | 4.0 | 7.0 | 5.8 | 5.0 |
| 2005 - 07 | • | 50 | 4.9 | 3.6 | 6.5 | 5.8 | 4.9 |
| 2006 - 08 | • | 54 | 5.1 | 3.8 | 6.6 | 5.6 | 4.8 |
| 2007 - 09 | • | 53 | 4.9 | 3.7 | 6.5 | 5.5 | 4.7 |
| 2008 - 10 | • | 61 | 5.5 | 4.2 | 7.1 | 5.4 | 4.6 |
| 2009 - 11 | • | 56 | 5.0 | 3.8 | 6.5 | 5.2 | 4.4 |
| 2010 - 12 | • | 47 | 4.1 | 3.0 | 5.5 | 4.8 | 4.3 |
| 2011 - 13 | • | 42 | 3.7 | 2.7 | 5.0 | 4.5 | 4.1 |
| 2012 - 14 | • | 43 | 3.9 | 2.8 | 5.2 | 4.2 | 4.0 |
| 2013 - 15 | • | 44 | 4.1 | 3.0 | 5.5 | 4.3 | 3.9 |
| 2014 - 16 | • | 40 | 3.8 | 2.7 | 5.1 | 4.1 | 3.9 |
| 2015 - 17 | • | 50 | 4.7 | 3.5 | 6.2 | 4.1 | 3.9 |
| 2016 - 18 | • | 47 | 4.6 | 3.4 | 6.1 | 4.0 | 3.9 |
| 2017 - 19 | • | 50 | 5.0 | 3.7 | 6.7 | 4.2 | 3.9 |
| 2018 - 20 | • | 40 | 4.2 | 3.0 | 5.7 | 4.2 | 3.9 |
| 2019 - 21 | • | 45 | 4.8 | 3.5 | 6.4 | 4.4 | 3.9 |
| 2020 - 22 | • | 39 | 4.2 | 3.0 | 5.7 | 4.6 | 3.9 |
| 2021 - 23 | • | 39 | 4.2 | 3.0 | 5.7 | 5.0 | 4.1 |
| 2022 - 24 | • | 37 | 4.0 | 2.8 | 5.5 | 5.1 | 4.2 |
Source: OHID, based on Office for National Statistics data
Child mortality rate (1 to 17 years) (Persons 1-17 yrs)
|
Period
|
Kingston upon Hull |
Yorkshire and the Humber region (statistical)
|
England
|
||||
|---|---|---|---|---|---|---|---|
|
Count
|
Value
|
95%
Lower CI |
95%
Upper CI |
||||
| 2001 - 03 | • | 43 | 26.0 | 18.8 | 35.0 | 21.1 | 18.0 |
| 2002 - 04 | • | 33 | 20.2 | 13.9 | 28.4 | 20.6 | 17.4 |
| 2003 - 05 | • | 30 | 18.4 | 12.4 | 26.3 | 20.2 | 16.9 |
| 2004 - 06 | • | 30 | 18.4 | 12.4 | 26.3 | 19.2 | 16.6 |
| 2005 - 07 | • | 38 | 23.2 | 16.4 | 31.9 | 19.1 | 16.4 |
| 2006 - 08 | • | 40 | 24.1 | 17.2 | 32.8 | 18.7 | 15.9 |
| 2007 - 09 | • | 35 | 20.8 | 14.5 | 28.9 | 17.6 | 15.1 |
| 2008 - 10 | • | 34 | 20.8 | 14.4 | 29.1 | 16.7 | 14.2 |
| 2009 - 11 | • | 22 | 14.0 | 8.8 | 21.3 | 14.7 | 13.3 |
| 2010 - 12 | • | 15 | 9.7 | 5.4 | 16.0 | 14.1 | 12.5 |
| 2011 - 13 | • | 12 | 7.9 | 4.1 | 13.9 | 13.3 | 12.0 |
| 2012 - 14 | • | 18 | 11.5 | 6.8 | 18.3 | 13.3 | 12.0 |
| 2013 - 15 | • | 26 | 16.3 | 10.6 | 24.0 | 13.8 | 12.0 |
| 2014 - 16 | • | 29 | 18.0 | 12.0 | 25.9 | 13.2 | 11.7 |
| 2015 - 17 | • | 21 | 13.1 | 8.0 | 20.1 | 12.5 | 11.3 |
| 2016 - 18 | • | 14 | 8.3 | 4.5 | 14.0 | 12.0 | 11.1 |
| 2017 - 19 | • | 12 | 7.1 | 3.7 | 12.5 | 12.2 | 10.9 |
| 2018 - 20 | • | 16 | 9.7 | 5.5 | 15.7 | 12.5 | 10.4 |
| 2019 - 21 | • | 18 | 11.1 | 6.6 | 17.6 | 11.5 | 10.0 |
| 2020 - 22 | • | 18 | 11.0 | 6.5 | 17.3 | 12.1 | 10.4 |
| 2021 - 23 | • | 19 | 11.2 | 6.8 | 17.6 | 13.0 | 11.2 |
| 2022 - 24 | • | 20 | 11.5 | 7.0 | 17.7 | 14.3 | 11.6 |
Source: OHID, based on Office for National Statistics data
The mortality rate in Hull decreased between 2001-03 to 2010-12, but marginally increased until 2017-19 prior to the COVID-19 pandemic. The mortality rate increased more sharply in the subsequent three years, but has decreased for the latest two years to 2022-24.
The impact of the pandemic on the mortality rate was greater for premature deaths and for premature deaths from causes considered to be preventable (COVID-19 is considered to be a cause considered to be preventable among under 75s).
Compared with benchmark
Mortality rate from all causes, all ages (Persons All ages)
|
Period
|
Kingston upon Hull |
Yorkshire and the Humber region (statistical)
|
England
|
||||
|---|---|---|---|---|---|---|---|
|
Count
|
Value
|
95%
Lower CI |
95%
Upper CI |
||||
| 2001 - 03 | • | 7928 | 1408 | 1377 | 1440 | 1269 | 1226 |
| 2002 - 04 | • | 7894 | 1404 | 1373 | 1436 | 1251 | 1202 |
| 2003 - 05 | • | 7843 | 1392 | 1361 | 1423 | 1222 | 1173 |
| 2004 - 06 | • | 7695 | 1359 | 1329 | 1391 | 1183 | 1131 |
| 2005 - 07 | • | 7714 | 1359 | 1329 | 1391 | 1164 | 1107 |
| 2006 - 08 | • | 7590 | 1334 | 1303 | 1364 | 1152 | 1090 |
| 2007 - 09 | • | 7453 | 1305 | 1275 | 1336 | 1132 | 1066 |
| 2008 - 10 | • | 7208 | 1251 | 1222 | 1281 | 1103 | 1041 |
| 2009 - 11 | • | 7113 | 1229 | 1200 | 1258 | 1069 | 1004 |
| 2010 - 12 | • | 7038 | 1205 | 1177 | 1234 | 1058 | 989 |
| 2011 - 13 | • | 7132 | 1212 | 1184 | 1241 | 1053 | 979 |
| 2012 - 14 | • | 7250 | 1222 | 1193 | 1250 | 1041 | 971 |
| 2013 - 15 | • | 7385 | 1242 | 1213 | 1271 | 1041 | 974 |
| 2014 - 16 | • | 7468 | 1250 | 1221 | 1279 | 1034 | 970 |
| 2015 - 17 | • | 7648 | 1276 | 1247 | 1305 | 1041 | 975 |
| 2016 - 18 | • | 7649 | 1265 | 1236 | 1294 | 1036 | 967 |
| 2017 - 19 | • | 7701 | 1262 | 1233 | 1290 | 1027 | 955 |
| 2018 - 20 | • | 7911 | 1284 | 1256 | 1313 | 1065 | 986 |
| 2019 - 21 | • | 8125 | 1302 | 1274 | 1331 | 1070 | 999 |
| 2020 - 22 | • | 8278 | 1313 | 1285 | 1342 | 1085 | 1012 |
| 2021 - 23 | • | 8063 | 1265 | 1237 | 1293 | 1047 | 981 |
| 2022 - 24 | • | 7976 | 1241 | 1213 | 1268 | 1031 | 952 |
| 2023 - 25 | • | 7885 | 1216 | 1189 | 1243 | 1009 | 933 |
Source: OHID, based on Office for National Statistics data
Under 75 mortality rate from all causes (Persons <75 yrs)
|
Period
|
Kingston upon Hull |
Yorkshire and the Humber region (statistical)
|
England
|
||||
|---|---|---|---|---|---|---|---|
|
Count
|
Value
|
95%
Lower CI |
95%
Upper CI |
||||
| 2001 - 03 | • | 3080 | 562.4 | 542.6 | 582.8 | 475.9 | 452.2 |
| 2002 - 04 | • | 3066 | 559.2 | 539.4 | 579.5 | 462.5 | 439.2 |
| 2003 - 05 | • | 3074 | 557.4 | 537.6 | 577.6 | 448.7 | 425.8 |
| 2004 - 06 | • | 3050 | 551.4 | 531.8 | 571.5 | 436.1 | 411.6 |
| 2005 - 07 | • | 3002 | 541.7 | 522.2 | 561.6 | 427.3 | 400.6 |
| 2006 - 08 | • | 2986 | 541.2 | 521.8 | 561.2 | 420.4 | 391.3 |
| 2007 - 09 | • | 2943 | 533.1 | 513.7 | 552.9 | 410.2 | 380.3 |
| 2008 - 10 | • | 2875 | 518.4 | 499.4 | 538.0 | 400.1 | 370.5 |
| 2009 - 11 | • | 2792 | 501.6 | 482.9 | 520.8 | 389.7 | 358.9 |
| 2010 - 12 | • | 2660 | 475.5 | 457.4 | 494.2 | 381.2 | 350.0 |
| 2011 - 13 | • | 2625 | 464.2 | 446.4 | 482.6 | 373.3 | 342.5 |
| 2012 - 14 | • | 2647 | 463.1 | 445.3 | 481.3 | 365.8 | 337.2 |
| 2013 - 15 | • | 2731 | 472.3 | 454.4 | 490.6 | 363.0 | 335.2 |
| 2014 - 16 | • | 2804 | 476.6 | 458.8 | 494.9 | 362.5 | 334.3 |
| 2015 - 17 | • | 2888 | 477.8 | 460.3 | 495.8 | 362.8 | 332.6 |
| 2016 - 18 | • | 2861 | 462.3 | 445.4 | 479.7 | 363.9 | 331.3 |
| 2017 - 19 | • | 2932 | 465.6 | 448.8 | 482.9 | 362.0 | 327.0 |
| 2018 - 20 | • | 3010 | 471.3 | 454.6 | 488.6 | 373.7 | 337.7 |
| 2019 - 21 | • | 3252 | 501.6 | 484.4 | 519.2 | 383.3 | 348.6 |
| 2020 - 22 | • | 3359 | 515.6 | 498.2 | 533.4 | 392.1 | 355.3 |
| 2021 - 23 | • | 3314 | 507.2 | 490.0 | 524.8 | 385.9 | 348.9 |
| 2022 - 24 | • | 3302 | 504.9 | 487.8 | 522.5 | 377.5 | 337.6 |
| 2023 - 25 | • | 3269 | 497.1 | 480.1 | 514.6 | 370.5 | 330.5 |
Source: OHID, based on Office for National Statistics data
Under 75 mortality rate from causes considered preventable (Persons <75 yrs)
|
Period
|
Kingston upon Hull |
Yorkshire and the Humber region (statistical)
|
England
|
||||
|---|---|---|---|---|---|---|---|
|
Count
|
Value
|
95%
Lower CI |
95%
Upper CI |
||||
| 2001 - 03 | • | 1445 | 262.8 | 249.3 | 276.8 | 209.9 | 192.3 |
| 2002 - 04 | • | 1434 | 259.9 | 246.5 | 273.9 | 202.5 | 186.1 |
| 2003 - 05 | • | 1456 | 261.6 | 248.2 | 275.6 | 196.4 | 180.5 |
| 2004 - 06 | • | 1444 | 258.6 | 245.3 | 272.5 | 190.9 | 174.4 |
| 2005 - 07 | • | 1407 | 251.7 | 238.6 | 265.4 | 187.7 | 170.3 |
| 2006 - 08 | • | 1373 | 248.1 | 235.0 | 261.8 | 183.9 | 167.0 |
| 2007 - 09 | • | 1372 | 247.8 | 234.7 | 261.4 | 179.3 | 162.8 |
| 2008 - 10 | • | 1371 | 246.6 | 233.6 | 260.2 | 174.7 | 158.8 |
| 2009 - 11 | • | 1351 | 242.2 | 229.3 | 255.7 | 171.8 | 154.8 |
| 2010 - 12 | • | 1277 | 228.6 | 216.1 | 241.7 | 169.6 | 151.6 |
| 2011 - 13 | • | 1266 | 224.5 | 212.2 | 237.4 | 168.5 | 149.7 |
| 2012 - 14 | • | 1285 | 225.4 | 213.1 | 238.2 | 165.1 | 148.0 |
| 2013 - 15 | • | 1327 | 230.1 | 217.7 | 243.0 | 164.2 | 147.6 |
| 2014 - 16 | • | 1377 | 233.7 | 221.3 | 246.6 | 162.5 | 146.8 |
| 2015 - 17 | • | 1422 | 235.3 | 223.1 | 248.0 | 162.3 | 145.2 |
| 2016 - 18 | • | 1408 | 227.4 | 215.6 | 239.7 | 162.3 | 144.2 |
| 2017 - 19 | • | 1440 | 228.8 | 217.1 | 241.0 | 163.6 | 142.6 |
| 2018 - 20 | • | 1497 | 234.3 | 222.5 | 246.5 | 176.2 | 153.7 |
| 2019 - 21 | • | 1700 | 262.1 | 249.8 | 274.9 | 188.5 | 166.8 |
| 2020 - 22 | • | 1768 | 270.8 | 258.3 | 283.8 | 193.4 | 171.4 |
| 2021 - 23 | • | 1721 | 262.9 | 250.6 | 275.7 | 185.5 | 163.6 |
| 2022 - 24 | • | 1603 | 244.4 | 232.5 | 256.7 | 174.2 | 151.2 |
Source: OHID, based on Office for National Statistics data
Resources
L’Hôte E, Castellina M, Volmert A, Conklin L, and O’Shea P. A Matter of Life and Death: Explaining the Wider Determinants of Health in the UK. FrameWorks, 2022. Commissioned by The Health Foundation. https://www.health.org.uk/publications/a-matter-of-life-or-death
The Office for Health Improvement & Disparities’ North East and Yorkshire Local Knowledge and Information teams. Picture of Health Intelligence Pack.
Official Labour Market Statistics (nomis). Annual Population Survey – Households by combined economic activity status. https://www.nomisweb.co.uk/
ONS population estimates: www.ons.gov.uk
Office for National Statistics. Census 2021. https://census.gov.uk/
NHS Digital for patients registered at each GP practice: https://digital.nhs.uk/data-and-information/publications/statistical/patients-registered-at-a-gp-practice
ONS population projections: www.ons.gov.uk
Office for Health Improvement & Disparities’ Fingertips: https://fingertips.phe.org.uk/
The Office for Health Improvement & Disparities’ Segment Tool. https://analytics.phe.gov.uk/apps/segment-tool/
Hull’s Adult Health and Wellbeing Survey 2019.
Global Burden of Disease, 2021. https://vizhub.healthdata.org/gbd-compare/
Updates
This page was last updated / checked on 16 April 2026.
This page is due to be updated / checked in July 2026.