Index
This topic area covers statistics and information relating to respiratory disease including asthma and chronic obstructive pulmonary disease in Hull including local strategic need and service provision.
This page contains information from the Office for Health Improvement & Disparities’ Fingertips. Information is taken ‘live’ from the site so uses the latest available data from Fingertips and displays it on this page. As a result, some comments on this page may relate to an earlier period of time until this page is next updated (see review dates at the end of this page).
Local mortality data is available before national data is published. Because of this, the local analysis of mortality comparing areas within Hull may be for a more recent period than the nationally produced comparisons of mortality.
Headlines
- The main respiratory diseases and conditions are respiratory infections, asthma, influenza and pneumonia, pneumonitis (inflammation of the lung tissue which is not a specific disease but a sign of an underlying condition), bronchitis and emphysema, and other chronic obstructive pulmonary diseases (COPD).
- Around 80% of lung cancer and COPD cases are directly attributable to smoking, and other lung conditions such as the common cold, asthma and influenza are made worse by smoking. Due to the high prevalence of current and former smoking in Hull, the rates of respiratory disease particularly COPD are very high in Hull.
- In 2024/25, 18,620 (6.3%) patients aged 6+ years registered with Hull GPs were diagnosed with asthma which was slightly lower than England (6.6%), and 9,920 (3.2%) patients were diagnosed with COPD which was much higher than England (1.9%). Practices serving the oldest patients had a statistically significantly higher prevalence of diagnosed asthma and COPD than those practices serving younger patients.
- There were 5,570 emergency hospital admissions for respiratory disease in Hull during 2019/20 and this was 30% higher than England (2,063 versus 1,592 per 100,000 population). Prior to this, the rate in Hull had also been increasing at a faster rate than the increase in England thus increasing the inequalities gap. However, the number emergency hospital admissions substantially reduced considerably due to the COVID-19 pandemic to a low of 942 admissions per 100,000 population in 2020/21, before increasing in each subsequent year, to 2,175 admissions per 100,000 population for 2024/25 which is 5.4% higher than before the pandemic. There were 6,135 emergency hospital admissions for respiratory disease in Hull during 2024/25.
- There had been between 170 and 225 emergency hospital admissions for asthma among those aged 19+ years each year between 2013/14 and 2023/24 with 215 admissions in the latest year. There was a sharp decrease between between 2019/20 and 2020/21 due to the COVID-19 pandemic, but the latest rate is similar to the pre-pandemic rate. The emergency hospital admissions for asthma among those aged 19+ years had been similar to England before the pandemic, The latest rate is 13% higher in Hull compared to England (89.9 versus 79.5 admissions per 100,000 population).
- The rate of emergency hospital admission rate for COPD in Hull has been consistently around twice as high as England since at least 2013/14. The admission rate decreased sharply by 43% between 2019/20 and 2020/21 in Hull although this was similar to the 45% decrease for England. The admission rate has subsequently increased in Hull since the low of 259 admissions per 100,000 population for 2020/21 with 443 admissions per 100,000 population for 2024/25 which is more than double the rate for England (201 admissions per 100,000 population). During 2024/25, there were 1,165 emergency hospital admissions for COPD in Hull.
- There were 1,585 emergency hospital admissions for pneumonia during 2024/25. The admission rate had almost doubled between 2013/14 and 2019/20 from 332 to 625 admissions per 100,000 population with 1,515 admissions in 2019/20. However, the rate decreased sharply in 2020/21 due to the COVID-19 pandemic. Whilst the rate has increased in Hull in each subsequent year, the rate at 610 admissions per 100,000 population in 2024/25 remains 2.4% lower than it was in 2019/20 prior to the pandemic.
- There were 373 respiratory disease deaths that occurred under the age of 75 years registered during the 2023 to 2025 (222 men and 151 women).
- There were 230 respiratory disease deaths from causes considered to be preventable during 2022-24 (123 men and 107 women) equating to 62% of all premature respiratory deaths i9 in that three-year period (58% for men and 67% for women).
- Prior to the COVID-19 pandemic, the premature mortality rates from respiratory disease and the premature mortality rates from respiratory disease from causes considered to be preventable had been increasing particularly for women, and the mortality rate for men was among the highest it had been in the last 15-20 years and for women the rate was the highest it had been over this period. However, there was a sharp reduction in the premature mortality rates for deaths registered from 2017-19 to both 2018-20, 2019-21 and 2020-22 due to the COVID-19 pandemic. People with pre-existing respiratory disease were still dying but some died from COVID-19. In the last two years, the mortality rates from respiratory disease in Hull have increased, although are lower than the mortality rates prior to the pandemic.
- The number of deaths from asthma is small with a total of 16 registered during the three year period 2022-24.
- Prior to the pandemic, there were 695 deaths in 2017-19 among Hull residents where the underlying cause was COPD but this fell to a low of 481 in 2020-22 due to the pandemic, although the numbers are gradually increasing once again and were 556 for 2022-24.
- The mortality rates from COPD have been consistently higher than England. Furthermore, prior to the pandemic, the mortality rates in Hull were increasing sharply compared to a reduction across the region and England (particularly among women). The mortality rates from COPD in Hull are 72% higher than England for men, and more than double England’s rate for women. The mortality rate is fifth highest out of all upper-tier local authorities in England with 87 deaths per 100,000 population in Hull compared to 46 deaths per 100,000 population in England.
The Population Affected – Why Is It Important?
All Respiratory Disease
The main respiratory diseases and conditions are respiratory infections, asthma, influenza and pneumonia, pneumonitis (inflammation of the lung tissue which is not a specific disease but a sign of an underlying condition), bronchitis and emphysema, and other chronic obstructive pulmonary diseases.
The diagnosed prevalence of asthma and chronic obstructive pulmonary disease can be examined from data collected as part of the Quality and Outcomes Framework within primary care. Quality of care indicators are also included, and it means that high percentage of the patients diagnosed with asthma and chronic obstructive pulmonary disease have annual reviews which gives medical staff the opportunity to provide information and encourage their patients to improve their lifestyle behaviours to improve their health, and lower their risk of morbidity and mortality from their condition. Local analysis of the QOF data has been completed with prevalence calculated for each GP practice and Primary Care Network group.
The Office for Health Improvement & Disparities’ Fingertips also provides information on respiratory disease with some of the information at Clinical Commissioning Group (CCG) level and some at local authority level. Whilst there will be differences in the actual figures the pattern and trends will be very similar as the CCG and local authority geographical boundaries are the same. The only difference is the population, there are around 269,000 residents in Hull (local authority), but there are around 310,000 patients registered with Hull GPs (representing Hull’s patient population). Just over 25,000 residents of East Riding of Yorkshire local authority are registered with Hull GPs.
Asthma
Asthma is a common long-term condition that can cause coughing, wheezing, chest tightness and breathlessness. The severity of these symptoms varies from person to person. Whilst there is no cure, asthma can be controlled well in most people most of the time to lead a normal active life, although some people may have more persistent problems. Control can be achieved through the tailored use of medication (usually inhalers) and to some extent by avoiding things that the individual knows will make their symptoms worse (triggers). One potential trigger is cigarette smoke. Occasionally, asthma symptoms can get gradually or suddenly worse (“asthma attack” or “exacerbation”). Severe attacks may require hospital treatment and can be life threatening, although this is unusual. In the UK, 5.4 million people have asthma (1 in 12 adults and 1 in 11 children). The majority of asthma deaths are considered to be preventable. There are wide variations in outcomes for people living with asthma. Nationally a five-fold difference has been demonstrated between some areas in hospital admissions for adults with acute exacerbation of their asthma and as much as a six-fold difference for children.
Chronic Obstructive Pulmonary Disease
Chronic obstructive pulmonary disease (COPD) is the name for a collection of lung diseases including chronic bronchitis, emphysema and chronic obstructive airways disease. People with COPD have difficulties breathing, and often have a persistent cough with phlegm and frequent chest infections.
Some cases of COPD are caused by fumes, dust, air pollution and genetic disorders, but these are rarer. The most common cause is smoking, and it is estimated that 78% of all COPD deaths are directly attributable to smoking.
COPD is one of the most common respiratory diseases in the UK. It usually only starts to affect people over the age of 35, although most people are not diagnosed until they are in their 50s. It is thought there are more than 3 million people living with the disease in the UK, of which only about 900,000 have been diagnosed. There are around 25,000 deaths each year in the UK from COPD. Nationally, COPD has the fourth highest disability adjusted life years and thus has a substantial impact on the quality of people’s lives.
Health benefits are immediate after quitting smoking. Within 12 hours, carbon monoxide levels in the blood drop to normal levels. Within 2-13 weeks, circulation improves and lung function increases. After 1-9 months, coughing and shortness of breath decreases, and people start to retain lung function.
The Hull Picture
All Respiratory Disease
Some information is available on respiratory disease as a whole, but information is also included below on asthma, chronic obstructive pulmonary disease and pneumonia.
Hospital Admissions
The Office for Health Improvement & Disparities’ Fingertips presents information on emergency hospital admissions for all respiratory diseases, and the rate in Hull (03F) was 51% higher than England in 2024/25, and the second highest in the Humber and North Yorkshire Integrated Care Board area.
Rates are presented as the number of admissions per 100,000 population standardised to the European Standard Population (directly age standardised admission rates).
Compared with benchmark
| Indicator | Period | England | NHS Humber and North Yorkshire Integrated Care Board - QOQ | Humber and North Yorkshire ICB - 02Y | Humber and North Yorkshire ICB - 03F | Humber and North Yorkshire ICB - 03H | Humber and North Yorkshire ICB - 03K | Humber and North Yorkshire ICB - 03Q | Humber and North Yorkshire ICB - 42D |
|---|---|---|---|---|---|---|---|---|---|
Emergency hospital admissions for respiratory disease (Persons All ages) | 2024/25 | 1442 | 1750 | 1530 | 2175 | 2304 | 2134 | 1529 | 1520 |
Prior to the COVID-19 pandemic, the emergency admission rates for respiratory disease had been increasing quite sharply in Hull since 2013/14 although there was a slight decrease in the admission rate between 2018/19 and 2019/20. Over this time, the rate of increase in Hull has been marginally higher than that for England, increasing the inequalities gap over time.
The emergency admission rates for respiratory disease fell sharply between 2019/20 and 2020/21 to a new low (40% lower than the lowest rate previously in 2013/14). This decrease was associated with the COVID-19 pandemic. The decrease in Hull (-54%) was similar to the decrease for England (-55%).
There have been sharp annual increases since 2020/21, with the the latest admission rate in 2024/25 higher (by 5.4%) than it was prior to the pandemic in Hull.
There were 6,135 emergency hospital admissions for respiratory disease during 2024/25 in Hull.
Compared with benchmark
Emergency hospital admissions for respiratory disease (Persons All ages)
|
Period
|
Humber and North Yorkshire ICB - 03F |
NHS Humber and North Yorkshire Integrated Care Board - QOQ
|
England
|
||||
|---|---|---|---|---|---|---|---|
|
Count
|
Value
|
95%
Lower CI |
95%
Upper CI |
||||
| 2013/14 | • | 4260 | 1560 | 1499 | 1623 | 1235 | 1228 |
| 2014/15 | • | 4450 | 1661 | 1598 | 1725 | 1381 | 1371 |
| 2015/16 | • | 5055 | 1896 | 1823 | 1970 | 1418 | 1423 |
| 2016/17 | • | 5300 | 2027 | 1952 | 2104 | 1509 | 1497 |
| 2017/18 | • | 5500 | 2091 | 2014 | 2170 | 1564 | 1519 |
| 2018/19 | • | 5805 | 2159 | 2083 | 2237 | 1586 | 1558 |
| 2019/20 | • | 5570 | 2063 | 1990 | 2138 | 1644 | 1592 |
| 2020/21 | • | 2450 | 942 | 890 | 995 | 721 | 711 |
| 2021/22 | • | 3650 | 1339 | 1279 | 1400 | 1232 | 1134 |
| 2022/23 | • | 4685 | 1683 | 1621 | 1746 | 1523 | 1336 |
| 2023/24 | • | 5680 | 2041 | 1965 | 2117 | 1683 | 1428 |
| 2024/25 | • | 6135 | 2175 | 2095 | 2256 | 1750 | 1442 |
Source: OHID, based on NHS England data
Deaths
The directly age standardised mortality rate for respiratory disease per 100,000 population (standardised to the European Standard Population) among those aged under 75 years was around 80% higher in Hull compared to England for deaths registered during the three year period 2023-25, 86% higher among men and 69% higher among women.
Compared with benchmark
| Indicator | Period | England | Yorkshire and the Humber region (statistical) | Kingston upon Hull | East Riding of Yorkshire | North East Lincolnshire | North Lincolnshire | York | North Yorkshire UA | Barnsley | Doncaster | Rotherham | Sheffield | Bradford | Calderdale | Kirklees | Leeds | Wakefield |
|---|---|---|---|---|---|---|---|---|---|---|---|---|---|---|---|---|---|---|
Under 75 mortality rate from respiratory disease (Persons <75 yrs) | 2023 - 25 | 32.6 | 39.1 | 58.7 | 26.3 | 46.4 | 39.2 | 25.2 | 23.1 | 45.0 | 47.2 | 50.4 | 36.7 | 47.4 | 43.2 | 40.6 | 40.8 | 45.8 |
Under 75 mortality rate from respiratory disease (Male <75 yrs) | 2023 - 25 | 37.7 | 44.0 | 70.3 | 30.6 | 58.5 | 43.1 | 27.6 | 25.5 | 45.3 | 52.6 | 54.0 | 40.8 | 56.6 | 47.3 | 45.3 | 46.3 | 48.5 |
Under 75 mortality rate from respiratory disease (Female <75 yrs) | 2023 - 25 | 27.9 | 34.5 | 47.1 | 22.3 | 34.8 | 35.4 | 23.1 | 20.9 | 44.6 | 41.9 | 47.1 | 32.6 | 38.6 | 39.4 | 36.0 | 35.7 | 43.3 |
The premature mortality rate from respiratory disease decreased from 61 deaths per 100,000 population in 2001-03, then increased from a low of 51 deaths per 100,000 population in 2004-06 to 67 deaths per 100,000 population in 2017-19. The mortality rate then decreased sharply due to the COVID-19 pandemic as fewer people died from an underlying cause of respiratory disease; a high mortality rate was still observed but a significant number of people with pre-existing respiratory disease specifically chronic obstructive pulmonary disease died of COVID-19 instead. Further information is given within the Causes of Death in Hull under Population, and further information specifically in relation to impact on the chronic obstructive pulmonary disease mortality rate is given below. From the low mortality rate of 51 deaths per 100,000 population in 2020-22, the mortality rate has increased in the last three years to 59 deaths per 100,000 population.
The pattern of premature deaths from respiratory disease is considerably different to England and the region. For these areas, the mortality rate had been decreasing gradually between 2001-03 and 2017-19, although there had been a slight increase prior to this in the last 3-4 years for the region. The rates also decreased during the pandemic and have started to increase in the last couple of years, although the change in the mortality rate since 2017-19 have been considerably smaller than the changes in Hull.
The premature mortality rate from respiratory disease increased in Hull by 10% between 2001-03 and 2017-19 in contrast to a 10% reduction for the region and a 18% reduction for England. In Hull, the mortality rate then decreased by 24% between 2017-19 and 2020-22 compared to a 17% decrease across the region and a 14% decrease for England. Since 2020-22, the rate in Hull has increased by 16% compared to 15% for the region and 13% for England.
The premature mortality rate from respiratory disease in Hull for 2023-25 is 3% lower than it was in 2001-03 whereas for the region it is 13% lower and for England it is 18% lower.
There were 373 premature deaths with an underlying cause of respiratory disease that were registered during the three year period 2023 to 2025.
Compared with benchmark
Under 75 mortality rate from respiratory disease (Persons <75 yrs)
|
Period
|
Kingston upon Hull |
Yorkshire and the Humber region (statistical)
|
England
|
||||
|---|---|---|---|---|---|---|---|
|
Count
|
Value
|
95%
Lower CI |
95%
Upper CI |
||||
| 2001 - 03 | • | 317 | 60.5 | 54.0 | 67.6 | 44.9 | 39.9 |
| 2002 - 04 | • | 314 | 59.8 | 53.3 | 66.8 | 44.5 | 39.2 |
| 2003 - 05 | • | 300 | 57.4 | 51.1 | 64.3 | 43.8 | 38.8 |
| 2004 - 06 | • | 269 | 51.2 | 45.3 | 57.7 | 41.5 | 37.0 |
| 2005 - 07 | • | 273 | 52.1 | 46.0 | 58.6 | 41.4 | 36.5 |
| 2006 - 08 | • | 296 | 56.3 | 50.0 | 63.1 | 41.2 | 36.0 |
| 2007 - 09 | • | 324 | 61.7 | 55.1 | 68.8 | 41.9 | 35.4 |
| 2008 - 10 | • | 325 | 61.9 | 55.3 | 69.0 | 41.1 | 34.8 |
| 2009 - 11 | • | 328 | 62.8 | 56.2 | 70.1 | 40.2 | 33.7 |
| 2010 - 12 | • | 316 | 60.8 | 54.3 | 68.0 | 38.8 | 33.0 |
| 2011 - 13 | • | 317 | 60.0 | 53.5 | 67.0 | 38.7 | 32.7 |
| 2012 - 14 | • | 323 | 60.1 | 53.6 | 67.1 | 38.0 | 32.1 |
| 2013 - 15 | • | 338 | 61.2 | 54.8 | 68.2 | 37.9 | 32.6 |
| 2014 - 16 | • | 357 | 63.9 | 57.4 | 71.0 | 38.5 | 33.3 |
| 2015 - 17 | • | 362 | 63.2 | 56.8 | 70.1 | 39.2 | 33.8 |
| 2016 - 18 | • | 384 | 65.5 | 59.1 | 72.5 | 40.7 | 34.3 |
| 2017 - 19 | • | 401 | 66.5 | 60.1 | 73.3 | 40.7 | 33.8 |
| 2018 - 20 | • | 372 | 60.3 | 54.3 | 66.7 | 38.9 | 32.6 |
| 2019 - 21 | • | 338 | 53.6 | 48.1 | 59.7 | 35.5 | 29.8 |
| 2020 - 22 | • | 321 | 50.5 | 45.1 | 56.4 | 33.9 | 28.9 |
| 2021 - 23 | • | 342 | 53.9 | 48.3 | 59.9 | 35.9 | 30.3 |
| 2022 - 24 | • | 372 | 58.8 | 53.0 | 65.1 | 38.4 | 32.4 |
| 2023 - 25 | • | 373 | 58.7 | 52.9 | 65.0 | 39.1 | 32.6 |
Source: OHID, based on Office for National Statistics data
Among men, there has been some year-on-year variability in the mortality rate over time, but for 2017-19 the rate was among the highest since 2001-03 with a mortality rate of 71.6 deaths per 100,000 population in 2017-19. Since 2012-14 and 2013-15 when the mortality rate was at its lowest in both England and the Yorkshire and Humber region, the mortality rate has been increasing nationally and across the region. However, the increase in the premature mortality rate for Hull has been greater than the increase for England and across the region, and as a consequence between 2013-15 and 2017-19 the inequalities gap had been increasing.
A decrease in the premature mortality rate from respiratory disease occurred among men between 2017-19 and 2020-22 associated with the COVID-19 pandemic, but the premature rate in Hull for men has increased sharply in the last three years to 70.3 deaths per 100,000 population.
Among men, there were 222 deaths from respiratory disease that occurred under the age of 75 years among Hull residents.
Compared with benchmark
Under 75 mortality rate from respiratory disease (Male <75 yrs)
|
Period
|
Kingston upon Hull |
Yorkshire and the Humber region (statistical)
|
England
|
||||
|---|---|---|---|---|---|---|---|
|
Count
|
Value
|
95%
Lower CI |
95%
Upper CI |
||||
| 2001 - 03 | • | 169 | 68.1 | 58.2 | 79.2 | 52.3 | 47.1 |
| 2002 - 04 | • | 166 | 66.6 | 56.9 | 77.6 | 51.8 | 46.1 |
| 2003 - 05 | • | 163 | 64.2 | 54.7 | 74.9 | 50.6 | 45.7 |
| 2004 - 06 | • | 148 | 57.8 | 48.8 | 68.0 | 48.8 | 43.8 |
| 2005 - 07 | • | 146 | 56.9 | 47.9 | 67.0 | 47.7 | 43.1 |
| 2006 - 08 | • | 165 | 64.3 | 54.8 | 75.0 | 47.8 | 42.3 |
| 2007 - 09 | • | 185 | 72.5 | 62.3 | 83.8 | 48.0 | 41.5 |
| 2008 - 10 | • | 193 | 76.0 | 65.6 | 87.6 | 47.5 | 40.6 |
| 2009 - 11 | • | 190 | 75.4 | 64.9 | 87.0 | 45.6 | 39.3 |
| 2010 - 12 | • | 175 | 70.1 | 60.0 | 81.4 | 44.1 | 38.4 |
| 2011 - 13 | • | 173 | 67.4 | 57.6 | 78.4 | 43.6 | 38.0 |
| 2012 - 14 | • | 167 | 63.3 | 53.9 | 73.9 | 42.5 | 37.2 |
| 2013 - 15 | • | 172 | 63.0 | 53.8 | 73.3 | 41.4 | 37.5 |
| 2014 - 16 | • | 185 | 66.5 | 57.2 | 77.0 | 42.0 | 38.2 |
| 2015 - 17 | • | 192 | 66.9 | 57.7 | 77.2 | 43.5 | 38.9 |
| 2016 - 18 | • | 213 | 72.5 | 63.0 | 82.9 | 45.6 | 39.4 |
| 2017 - 19 | • | 216 | 71.6 | 62.4 | 81.9 | 45.8 | 38.8 |
| 2018 - 20 | • | 211 | 68.6 | 59.7 | 78.6 | 44.0 | 37.6 |
| 2019 - 21 | • | 191 | 61.3 | 52.9 | 70.6 | 40.6 | 34.6 |
| 2020 - 22 | • | 177 | 56.3 | 48.3 | 65.2 | 38.4 | 33.7 |
| 2021 - 23 | • | 186 | 59.1 | 50.9 | 68.3 | 40.2 | 35.0 |
| 2022 - 24 | • | 213 | 67.7 | 58.8 | 77.4 | 43.1 | 37.5 |
| 2023 - 25 | • | 222 | 70.3 | 61.3 | 80.2 | 44.0 | 37.7 |
Source: OHID, based on Office for National Statistics data
For women, since 2004-06 the premature mortality rate from respiratory disease has been gradually increasing and the mortality rate in Hull for 2017-19 was the highest it has been since 2001-03 with 61.2 deaths per 100,000 population. Between 2001-03 and 2017-19, the under 75 mortality rate for respiratory disease had been gradually decreasing for England and across the Yorkshire and Humber region, and with Hull’s increase over time, this means that the inequalities gap between Hull and England increased sharply over this time period. The premature mortality rate from respiratory disease among Hull women was 60% higher in Hull compared to England for deaths registered during 2001-03 (which is very high), but this had increased substantially by 2017-19 with the mortality rate in Hull more than double the rate in England (110% higher).
A decrease in the premature mortality rate from respiratory disease occurred among women between 2017-19 and 2020-22 associated with the COVID-19 pandemic, but there had been an increase in following two years, but a small decrease in 2023-25.
The premature mortality rate among women for respiratory disease for 2023-25 is 23% lower than its peak in 2017-19 (4% lower than in 2017-19 for both the region and England).
Among women, there were 151 deaths from respiratory disease that occurred under the age of 75 years among Hull residents during 2023-25.
Compared with benchmark
Under 75 mortality rate from respiratory disease (Female <75 yrs)
|
Period
|
Kingston upon Hull |
Yorkshire and the Humber region (statistical)
|
England
|
||||
|---|---|---|---|---|---|---|---|
|
Count
|
Value
|
95%
Lower CI |
95%
Upper CI |
||||
| 2001 - 03 | • | 148 | 53.6 | 45.3 | 62.9 | 38.4 | 33.4 |
| 2002 - 04 | • | 147 | 53.6 | 45.3 | 63.0 | 38.0 | 33.0 |
| 2003 - 05 | • | 137 | 50.9 | 42.7 | 60.1 | 37.8 | 32.5 |
| 2004 - 06 | • | 121 | 44.9 | 37.3 | 53.7 | 35.0 | 30.8 |
| 2005 - 07 | • | 127 | 47.4 | 39.5 | 56.4 | 35.7 | 30.4 |
| 2006 - 08 | • | 131 | 48.6 | 40.6 | 57.7 | 35.0 | 30.1 |
| 2007 - 09 | • | 138 | 51.3 | 43.1 | 60.7 | 36.3 | 29.8 |
| 2008 - 10 | • | 131 | 48.5 | 40.5 | 57.6 | 35.2 | 29.4 |
| 2009 - 11 | • | 138 | 51.1 | 42.9 | 60.5 | 35.2 | 28.4 |
| 2010 - 12 | • | 140 | 52.3 | 43.9 | 61.7 | 33.9 | 27.9 |
| 2011 - 13 | • | 144 | 53.0 | 44.7 | 62.5 | 34.2 | 27.7 |
| 2012 - 14 | • | 156 | 56.9 | 48.3 | 66.7 | 33.8 | 27.4 |
| 2013 - 15 | • | 166 | 59.4 | 50.6 | 69.2 | 34.6 | 28.0 |
| 2014 - 16 | • | 172 | 61.1 | 52.2 | 71.0 | 35.2 | 28.8 |
| 2015 - 17 | • | 170 | 59.4 | 50.8 | 69.1 | 35.0 | 29.1 |
| 2016 - 18 | • | 171 | 58.4 | 50.0 | 67.9 | 36.0 | 29.5 |
| 2017 - 19 | • | 185 | 61.2 | 52.7 | 70.7 | 35.8 | 29.1 |
| 2018 - 20 | • | 161 | 51.9 | 44.2 | 60.6 | 33.9 | 27.9 |
| 2019 - 21 | • | 147 | 46.2 | 39.0 | 54.3 | 30.7 | 25.3 |
| 2020 - 22 | • | 144 | 44.9 | 37.8 | 52.9 | 29.5 | 24.5 |
| 2021 - 23 | • | 156 | 48.7 | 41.3 | 57.0 | 31.8 | 25.8 |
| 2022 - 24 | • | 159 | 49.8 | 42.4 | 58.2 | 33.9 | 27.6 |
| 2023 - 25 | • | 151 | 47.1 | 39.9 | 55.3 | 34.5 | 27.9 |
Source: OHID, based on Office for National Statistics data
Fingertips also presents the directly age standardised mortality rate for respiratory disease that is considered preventable among those aged under 75 years (given as a rate per 100,000 population standardised to the European Standard Population).
The premature mortality rates for respiratory disease that is considered to be preventable in Hull is not quite twice as high as England for deaths registered during 2022-24. The rate in Hull is the highest in the Yorkshire and Humber region and considerably higher than any other local authority in the region. The rate in Hull is also the seventh highest among the upper-tier local authorities in England.
Compared with benchmark
| Indicator | Period | England | Yorkshire and the Humber region (statistical) | Kingston upon Hull | East Riding of Yorkshire | North East Lincolnshire | North Lincolnshire | York | North Yorkshire UA | Barnsley | Doncaster | Rotherham | Sheffield | Bradford | Calderdale | Kirklees | Leeds | Wakefield |
|---|---|---|---|---|---|---|---|---|---|---|---|---|---|---|---|---|---|---|
Under 75 mortality rate from respiratory disease considered preventable (Persons <75 yrs) | 2022 - 24 | 19.3 | 22.6 | 36.8 | 14.7 | 29.8 | 23.6 | 14.7 | 11.8 | 25.2 | 25.6 | 27.2 | 20.8 | 28.2 | 25.6 | 24.7 | 23.4 | 27.9 |
Under 75 mortality rate from respiratory disease considered preventable (Male <75 yrs) | 2022 - 24 | 21.4 | 23.9 | 39.9 | 16.5 | 32.2 | 23.2 | 12.3 | 13.0 | 25.6 | 27.7 | 26.5 | 24.8 | 31.0 | 25.3 | 25.9 | 23.3 | 29.7 |
Under 75 mortality rate from respiratory disease considered preventable (Female <75 yrs) | 2022 - 24 | 17.3 | 21.3 | 33.8 | 13.0 | 27.4 | 24.0 | 16.9 | 10.6 | 24.7 | 23.6 | 27.8 | 17.0 | 25.5 | 25.8 | 23.5 | 23.5 | 26.2 |
Between 2001-03 and 2017-19, in Hull, the under 75 mortality rate from respiratory disease considered to be preventable had increased by 40% from 31.7 to 44.3 deaths per 100,000 population. Over the same period, there had been a fall in England and across the region between 2001-03 and around 2008-09 / 2009-11 before the rate began increasing although for both England and the Yorkshire and Humber region the rate in 2017-19 was marginally lower than the rate in 2001-03.
Given that the overall mortality rate for respiratory disease has been increasing in Hull, and there is an even more marked difference between Hull and England in relation to preventable respiratory mortality, it is perhaps not surprising that the mortality rate for respiratory disease considered to be preventable among under 75s has been increasing over time in Hull.
However, between 2017-19 and 2020-22, the premature mortality rate from respiratory disease from causes considered to be preventable decreased sharply, although as mentioned above this is likely due to increased mortality due to COVID-19 rather than a reduction in the number of people with pre-existing respiratory disease dying. The mortality rate has then subsequently increased in the last couple of years in Hull as it has in the region and England.
Of the 372 premature deaths from respiratory disease that were registered during 2022-24 in Hull among people aged under the age of 75 years, 230 (62%) of them were considered to be preventable.
Compared with benchmark
Under 75 mortality rate from respiratory disease considered preventable (Persons <75 yrs)
|
Period
|
Kingston upon Hull |
Yorkshire and the Humber region (statistical)
|
England
|
||||
|---|---|---|---|---|---|---|---|
|
Count
|
Value
|
95%
Lower CI |
95%
Upper CI |
||||
| 2001 - 03 | • | 164 | 31.7 | 27.1 | 37.0 | 25.2 | 21.3 |
| 2002 - 04 | • | 157 | 30.3 | 25.8 | 35.4 | 23.9 | 20.7 |
| 2003 - 05 | • | 159 | 30.7 | 26.1 | 35.9 | 23.6 | 20.5 |
| 2004 - 06 | • | 148 | 28.4 | 24.0 | 33.4 | 22.1 | 19.4 |
| 2005 - 07 | • | 159 | 30.8 | 26.2 | 35.9 | 22.4 | 19.2 |
| 2006 - 08 | • | 177 | 34.3 | 29.4 | 39.8 | 22.1 | 19.0 |
| 2007 - 09 | • | 192 | 37.5 | 32.4 | 43.2 | 22.4 | 18.8 |
| 2008 - 10 | • | 197 | 38.1 | 32.9 | 43.8 | 22.2 | 18.7 |
| 2009 - 11 | • | 193 | 37.5 | 32.3 | 43.2 | 22.3 | 18.4 |
| 2010 - 12 | • | 192 | 37.4 | 32.3 | 43.2 | 22.6 | 18.7 |
| 2011 - 13 | • | 197 | 38.2 | 33.0 | 43.9 | 23.3 | 19.0 |
| 2012 - 14 | • | 221 | 42.1 | 36.7 | 48.1 | 23.1 | 18.9 |
| 2013 - 15 | • | 236 | 43.8 | 38.4 | 49.9 | 22.8 | 19.2 |
| 2014 - 16 | • | 238 | 43.6 | 38.2 | 49.6 | 22.9 | 19.6 |
| 2015 - 17 | • | 226 | 40.5 | 35.3 | 46.2 | 23.3 | 20.0 |
| 2016 - 18 | • | 239 | 41.7 | 36.5 | 47.3 | 24.5 | 20.4 |
| 2017 - 19 | • | 264 | 44.3 | 39.1 | 50.0 | 25.0 | 20.3 |
| 2018 - 20 | • | 249 | 40.6 | 35.7 | 45.9 | 23.8 | 19.5 |
| 2019 - 21 | • | 225 | 35.9 | 31.4 | 40.9 | 21.4 | 17.7 |
| 2020 - 22 | • | 212 | 33.6 | 29.2 | 38.4 | 20.1 | 17.0 |
| 2021 - 23 | • | 218 | 34.6 | 30.2 | 39.5 | 21.3 | 18.0 |
| 2022 - 24 | • | 230 | 36.8 | 32.2 | 41.9 | 22.6 | 19.3 |
Source: OHID, based on Office for National Statistics data
The mortality rate reduced for men between 2001-03 and 2004-06, but then increased particularly between 2004-06 and 2008-09. The rate remained relatively constant between 2008-09 and 2017-19 varying between 40 and 45 deaths per 100,000 population.
In contrast, the mortality rate fell for England and across the region between 2001-03 and 2012-14 / 2013-15, but since then has increased slightly although for both England and the Yorkshire and Humber region, the rates in 2017-19 were lower than they were in 2001-03.
The mortality rate among men decreased between 2017-19 and 2020-22 associated with the COVID-19 pandemic, but has increased in the last two years.
Among men, of the 213 deaths from respiratory disease that were registered during 2022-24 in Hull among people aged under the age of 75 years, 123 (58%) of them were considered to be preventable.
Compared with benchmark
Under 75 mortality rate from respiratory disease considered preventable (Male <75 yrs)
|
Period
|
Kingston upon Hull |
Yorkshire and the Humber region (statistical)
|
England
|
||||
|---|---|---|---|---|---|---|---|
|
Count
|
Value
|
95%
Lower CI |
95%
Upper CI |
||||
| 2001 - 03 | • | 85 | 35.2 | 28.1 | 43.5 | 28.3 | 24.5 |
| 2002 - 04 | • | 83 | 34.1 | 27.2 | 42.3 | 26.9 | 23.6 |
| 2003 - 05 | • | 76 | 31.0 | 24.4 | 38.7 | 26.0 | 23.3 |
| 2004 - 06 | • | 72 | 28.4 | 22.2 | 35.8 | 25.2 | 22.3 |
| 2005 - 07 | • | 75 | 29.6 | 23.2 | 37.1 | 24.7 | 21.9 |
| 2006 - 08 | • | 93 | 37.4 | 30.2 | 45.8 | 24.6 | 21.6 |
| 2007 - 09 | • | 101 | 40.5 | 33.0 | 49.3 | 23.6 | 21.0 |
| 2008 - 10 | • | 109 | 43.9 | 36.0 | 53.0 | 23.6 | 20.9 |
| 2009 - 11 | • | 105 | 42.4 | 34.6 | 51.4 | 23.2 | 20.5 |
| 2010 - 12 | • | 100 | 40.6 | 33.0 | 49.4 | 24.0 | 20.9 |
| 2011 - 13 | • | 101 | 40.4 | 32.8 | 49.2 | 24.1 | 21.0 |
| 2012 - 14 | • | 103 | 40.4 | 32.9 | 49.0 | 23.8 | 20.9 |
| 2013 - 15 | • | 115 | 43.6 | 35.9 | 52.5 | 23.3 | 21.2 |
| 2014 - 16 | • | 122 | 44.9 | 37.2 | 53.8 | 24.2 | 21.9 |
| 2015 - 17 | • | 113 | 40.7 | 33.5 | 49.0 | 25.1 | 22.4 |
| 2016 - 18 | • | 119 | 41.4 | 34.2 | 49.6 | 26.1 | 22.9 |
| 2017 - 19 | • | 127 | 42.6 | 35.5 | 50.7 | 26.6 | 22.6 |
| 2018 - 20 | • | 133 | 43.5 | 36.4 | 51.5 | 25.2 | 21.7 |
| 2019 - 21 | • | 124 | 39.9 | 33.2 | 47.6 | 23.2 | 19.7 |
| 2020 - 22 | • | 112 | 35.9 | 29.6 | 43.2 | 21.5 | 19.0 |
| 2021 - 23 | • | 114 | 36.8 | 30.3 | 44.2 | 22.6 | 19.9 |
| 2022 - 24 | • | 123 | 39.9 | 33.1 | 47.6 | 23.9 | 21.4 |
Source: OHID, based on Office for National Statistics data
For women, the premature mortality rate from respiratory disease considered to be preventable increased sharply between 2001-03 and 2007-09 before levelling off for 2-3 years with a further relatively sharp increase between 2010-12 and 2017-19. The mortality rate in 2017-19 was the highest it had been for Hull women at 46 deaths per 100,000 population. As the mortality rate across England and the region only increased slightly over the last two decades, the inequalities gap between Hull and England worsened and was considerable in 2017-19.
As with men, there was a decrease in the mortality rate among women during 2017-19 and 2020-22 associated the with COVID-19 pandemic, but the rate does appear to have started to increase again.
Among women, of the 159 deaths from respiratory disease that were registered during 2022-24 in Hull among people aged under the age of 75 years, 107 (67%) of them were considered to be preventable.
Compared with benchmark
Under 75 mortality rate from respiratory disease considered preventable (Female <75 yrs)
|
Period
|
Kingston upon Hull |
Yorkshire and the Humber region (statistical)
|
England
|
||||
|---|---|---|---|---|---|---|---|
|
Count
|
Value
|
95%
Lower CI |
95%
Upper CI |
||||
| 2001 - 03 | • | 79 | 28.7 | 22.7 | 35.8 | 22.5 | 18.4 |
| 2002 - 04 | • | 74 | 26.9 | 21.1 | 33.8 | 21.3 | 18.0 |
| 2003 - 05 | • | 82 | 30.5 | 24.3 | 37.9 | 21.5 | 17.9 |
| 2004 - 06 | • | 76 | 28.4 | 22.3 | 35.5 | 19.3 | 16.8 |
| 2005 - 07 | • | 84 | 31.8 | 25.4 | 39.4 | 20.4 | 16.7 |
| 2006 - 08 | • | 83 | 31.4 | 25.0 | 38.9 | 19.9 | 16.7 |
| 2007 - 09 | • | 91 | 34.6 | 27.9 | 42.5 | 21.3 | 16.7 |
| 2008 - 10 | • | 87 | 32.5 | 26.0 | 40.1 | 20.8 | 16.6 |
| 2009 - 11 | • | 88 | 32.9 | 26.3 | 40.5 | 21.4 | 16.5 |
| 2010 - 12 | • | 92 | 34.6 | 27.9 | 42.4 | 21.4 | 16.8 |
| 2011 - 13 | • | 96 | 36.2 | 29.3 | 44.2 | 22.7 | 17.1 |
| 2012 - 14 | • | 117 | 43.8 | 36.2 | 52.5 | 22.4 | 17.0 |
| 2013 - 15 | • | 120 | 44.0 | 36.4 | 52.7 | 22.3 | 17.2 |
| 2014 - 16 | • | 116 | 42.2 | 34.8 | 50.7 | 21.7 | 17.5 |
| 2015 - 17 | • | 113 | 40.2 | 33.1 | 48.4 | 21.5 | 17.8 |
| 2016 - 18 | • | 120 | 41.8 | 34.6 | 50.0 | 23.1 | 18.2 |
| 2017 - 19 | • | 137 | 45.9 | 38.5 | 54.2 | 23.4 | 18.2 |
| 2018 - 20 | • | 116 | 37.6 | 31.1 | 45.1 | 22.4 | 17.4 |
| 2019 - 21 | • | 101 | 32.0 | 26.1 | 38.9 | 19.6 | 15.8 |
| 2020 - 22 | • | 100 | 31.3 | 25.5 | 38.1 | 18.7 | 15.2 |
| 2021 - 23 | • | 104 | 32.6 | 26.6 | 39.5 | 20.1 | 16.2 |
| 2022 - 24 | • | 107 | 33.8 | 27.7 | 40.8 | 21.3 | 17.3 |
Source: OHID, based on Office for National Statistics data
Premature Respiratory Diseases Mortality Rates Across Wards and Area Committees in Hull
Under 75 respiratory disease mortality rates vary widely between wards in Hull.
For deaths registered during 2022-25, the directly standardised mortality rates per 100,000 persons (standardised to the European Standard Population) for deaths from respiratory diseases under the age of 75 years ranges between 29 and 99 deaths per 100,000 population across the wards. The under 75 age-standardised mortality rate for 2022-25 is 3.4 times higher in Central ward than in Holderness ward.
Age-standardised respiratory disease mortality rates are associated with deprivation, with rates highest in the most deprived wards and lowest in the least deprived wards. The mortality rates for Central, St Andrew’s & Docklands and Marfleet were each statistically higher than the Hull average of 58 per 100,000 population, while rates in Holderness, West Carr and Derringham were significantly lower than the Hull average.
There were fewer than 10 premature deaths from cardiovascular diseases in Bricknell and Kingswood wards, so it is not possible to produce statistically robust mortality rates for these wards.
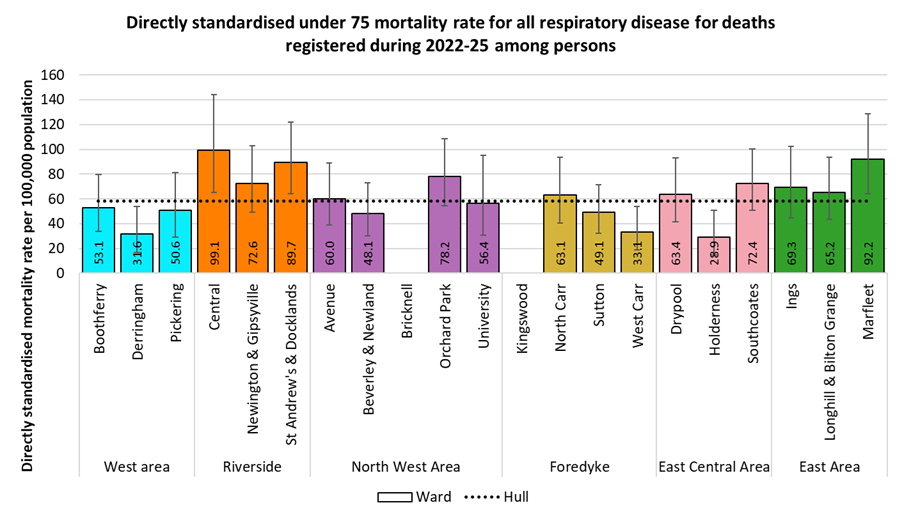
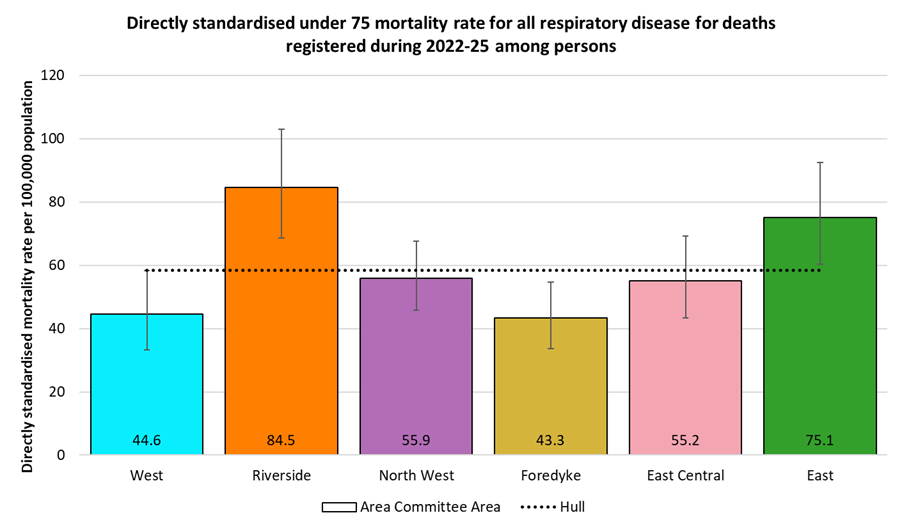
The differences between Area Committee Areas are smaller, with a two-fold difference between Riverside and Foredyke. The premature respiratory disease mortality rates in Riverside and East were statistically significantly higher than the Hull average, while the rate for Foredyke was statistically significantly lower than the Hull average.
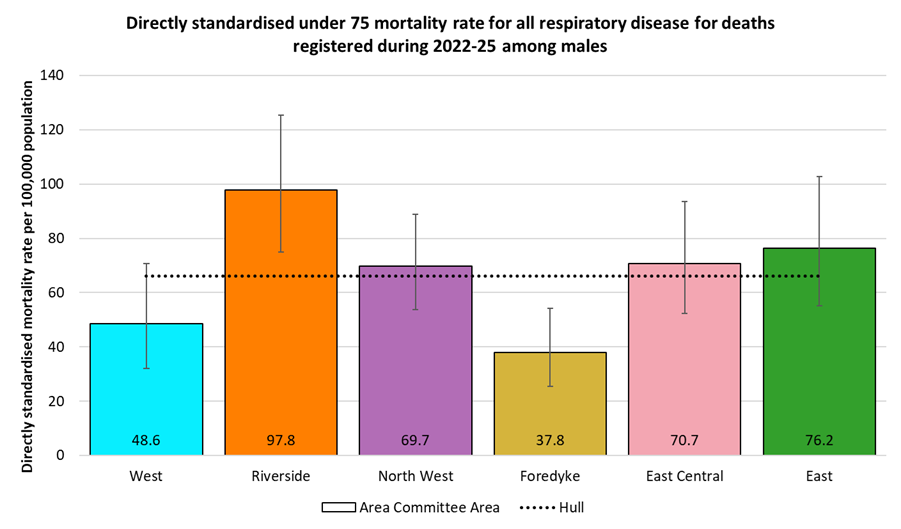
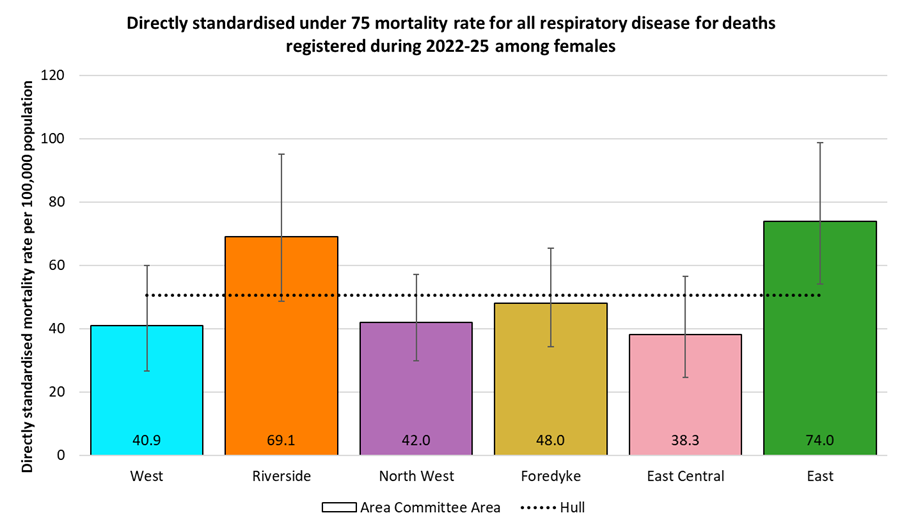
The counts of under 75 respiratory disease deaths by ward were under 10 for six wards among men and for nine wards among women, so only the Area Committee Areas are shown by gender.
There were large difference between Area Committee Areas, with the rate in Riverside 2.6 times higher than the rate in Foredyke. At 98 per 100,000 population, the premature respiratory disease mortality rate in Riverside was statistically significantly higher than the Hull average of 66 per 100,000 population, while in Foredyke the rate was statistically significantly lower.
Among females, both the highest and lowest premature respiratory disease mortality rates were found in the East of the city. There was an almost two fold difference in the rates between East and East Central Area Committee Areas, at 74 and 38 per 100,000 population respectively, with the rate in East statistically significantly higher than the Hull average of 51 per 100,000 population.
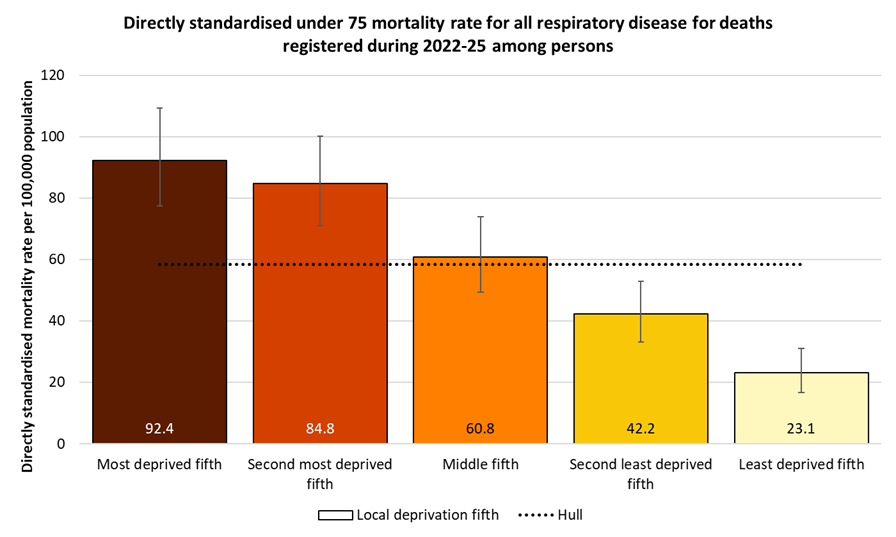
Premature Respiratory Disease Mortality Rates by Local Deprivation Fifths
As noted above, there is a strong association between premature mortality from respiratory disease and deprivation.
For deaths registered during 2022-25, the directly age-standardised under 75 cardiovascular disease mortality rates per 100,000 population (standardised to the European Standard Population) ranged from 23 deaths per 100,000 population living in the least deprived fifth of areas of Hull to 92 deaths per 100,000 population living in the most deprived fifth of areas of the city. The mortality rate in the most deprived fifth of areas was four times higher than in the least deprived fifth of areas.
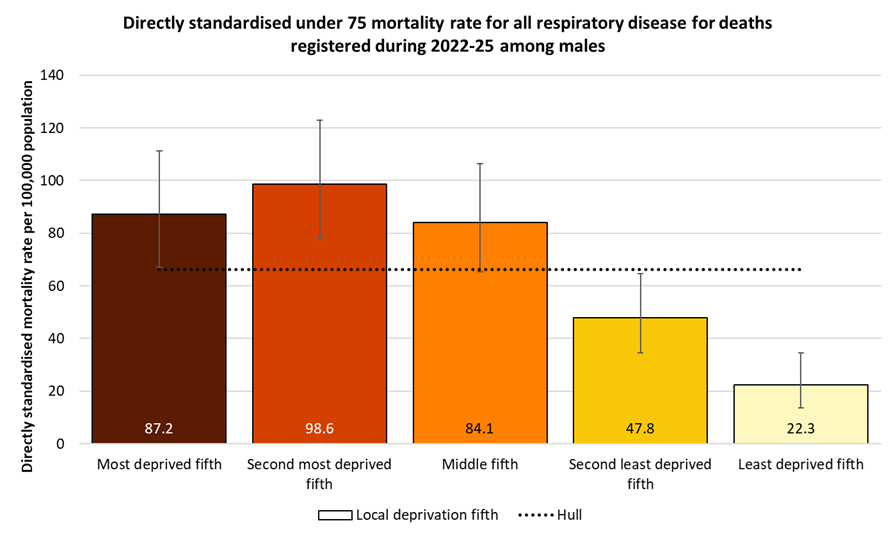
A similar pattern by deprivation fifths occurs among men, with a four-fold difference between the highest and lowest premature mortality rates. In this case, though, the rate among men in the second most deprived fifth of areas of Hull was higher than the rate for men in the most deprived fifth. The premature cardiovascular disease mortality rate ranged from 22 deaths per 100,000 men living in the least deprived fifth of areas of Hull to 99 deaths per 100,000 men living in the second most deprived fifth of areas of the city.
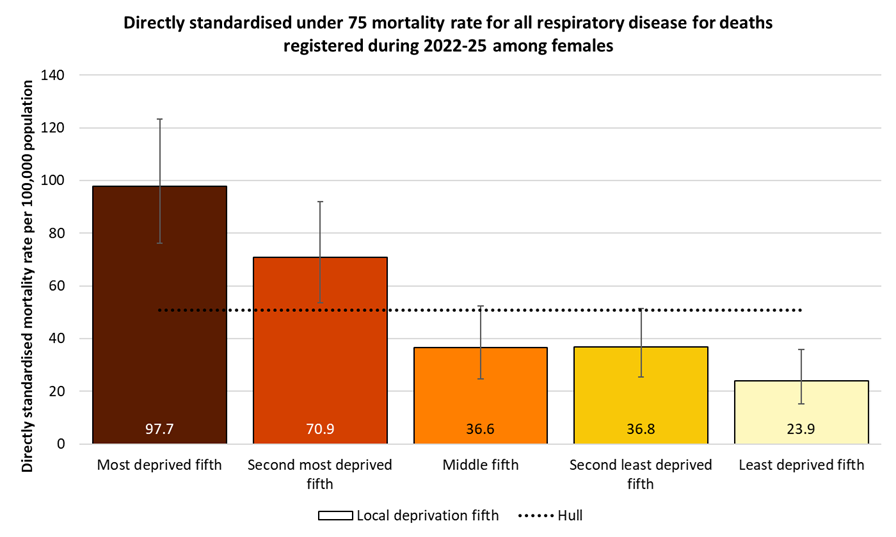
The pattern by deprivation among women is also similar. There is again a four-fold difference in premature respiratory disease mortality rates between women living in the most deprived fifth of areas of Hull and women living in the least deprived fifth of areas. The premature mortality rate ranged from 24 deaths per 100,000 women living in the least deprived fifth of areas of Hull to 98 deaths per 100,000 women living in the most deprived fifth of areas of the city.
Premature Respiratory Disease Mortality from Causes Considered Preventable
The Office for Health Improvement & Disparities’ Fingertips tool also gives the respiratory disease mortality rates for deaths under the age of 75 years that are considered to be preventable.
For 2022-24, the under 75 standardised mortality rate for respiratory diseases was 81% higher in Hull than England, but the under 75 mortality rate from causes considered preventable is 91% higher in Hull. Thus, a higher proportion of the premature respiratory disease deaths in Hull are considered to be preventable than for England.
The premature mortality rates from cardiovascular diseases considered preventable in Hull were the highest in the region for men and women for deaths registered during 2022-24.
Compared with benchmark
| Indicator | Period | England | Yorkshire and the Humber region (statistical) | Kingston upon Hull | East Riding of Yorkshire | North East Lincolnshire | North Lincolnshire | York | North Yorkshire UA | Barnsley | Doncaster | Rotherham | Sheffield | Bradford | Calderdale | Kirklees | Leeds | Wakefield |
|---|---|---|---|---|---|---|---|---|---|---|---|---|---|---|---|---|---|---|
Under 75 mortality rate from respiratory disease considered preventable (Persons <75 yrs) | 2022 - 24 | 19.3 | 22.6 | 36.8 | 14.7 | 29.8 | 23.6 | 14.7 | 11.8 | 25.2 | 25.6 | 27.2 | 20.8 | 28.2 | 25.6 | 24.7 | 23.4 | 27.9 |
Under 75 mortality rate from respiratory disease considered preventable (Male <75 yrs) | 2022 - 24 | 21.4 | 23.9 | 39.9 | 16.5 | 32.2 | 23.2 | 12.3 | 13.0 | 25.6 | 27.7 | 26.5 | 24.8 | 31.0 | 25.3 | 25.9 | 23.3 | 29.7 |
Under 75 mortality rate from respiratory disease considered preventable (Female <75 yrs) | 2022 - 24 | 17.3 | 21.3 | 33.8 | 13.0 | 27.4 | 24.0 | 16.9 | 10.6 | 24.7 | 23.6 | 27.8 | 17.0 | 25.5 | 25.8 | 23.5 | 23.5 | 26.2 |
Of the 372 respiratory disease deaths under the age of 75 years which were registered during 2022-24, 230 (62%) were considered to be preventable.
Compared with benchmark
Under 75 mortality rate from respiratory disease considered preventable (Persons <75 yrs) 2022 - 24
| Area |
Recent
Trend |
Count
|
Value
|
95%
Lower CI |
95%
Upper CI |
|
|---|---|---|---|---|---|---|
| England | 28353 | 19.3 | 19.1 | 19.5 | ||
| Yorkshire and the Humber region (statistical) | 3319 | 22.6 | 21.8 | 23.4 | ||
| Kingston upon Hull | 230 | 36.8 | 32.2 | 41.9 | ||
| East Riding of Yorkshire | 178 | 14.7 | 12.6 | 17.0 | ||
| North East Lincolnshire | 135 | 29.8 | 24.9 | 35.2 | ||
| North Lincolnshire | 123 | 23.6 | 19.6 | 28.2 | ||
| York | 75 | 14.7 | 11.5 | 18.4 | ||
| North Yorkshire UA | 248 | 11.8 | 10.4 | 13.4 | ||
| Barnsley | 175 | 25.2 | 21.6 | 29.2 | ||
| Doncaster | 220 | 25.6 | 22.3 | 29.2 | ||
| Rotherham | 199 | 27.2 | 23.5 | 31.2 | ||
| Sheffield | 270 | 20.8 | 18.4 | 23.5 | ||
| Bradford | 353 | 28.2 | 25.3 | 31.3 | ||
| Calderdale | 147 | 25.6 | 21.6 | 30.1 | ||
| Kirklees | 275 | 24.7 | 21.9 | 27.8 | ||
| Leeds | 421 | 23.4 | 21.2 | 25.8 | ||
| Wakefield | 270 | 27.9 | 24.7 | 31.5 |
Source: OHID, based on Office for National Statistics data
For men, of the 213 respiratory disease deaths under the age of 75 years which were registered during 2022-24, 123 (58%) were considered to be preventable.
Compared with benchmark
Under 75 mortality rate from respiratory disease considered preventable (Male <75 yrs) 2022 - 24
| Area |
Recent
Trend |
Count
|
Value
|
95%
Lower CI |
95%
Upper CI |
|
|---|---|---|---|---|---|---|
| England | 15189 | 21.4 | 21.1 | 21.8 | ||
| Yorkshire and the Humber region (statistical) | 1713 | 23.9 | 22.8 | 25.1 | ||
| Kingston upon Hull | 123 | 39.9 | 33.1 | 47.6 | ||
| East Riding of Yorkshire | 97 | 16.5 | 13.3 | 20.1 | ||
| North East Lincolnshire | 71 | 32.2 | 25.1 | 40.6 | ||
| North Lincolnshire | 59 | 23.2 | 17.7 | 29.9 | ||
| York | 30 | 12.3 | 8.3 | 17.6 | ||
| North Yorkshire UA | 133 | 13.0 | 10.9 | 15.4 | ||
| Barnsley | 87 | 25.6 | 20.5 | 31.6 | ||
| Doncaster | 115 | 27.7 | 22.8 | 33.2 | ||
| Rotherham | 94 | 26.5 | 21.4 | 32.4 | ||
| Sheffield | 157 | 24.8 | 21.1 | 29.0 | ||
| Bradford | 191 | 31.0 | 26.7 | 35.7 | ||
| Calderdale | 71 | 25.3 | 19.7 | 31.9 | ||
| Kirklees | 141 | 25.9 | 21.8 | 30.6 | ||
| Leeds | 204 | 23.3 | 20.2 | 26.7 | ||
| Wakefield | 140 | 29.7 | 25.0 | 35.0 |
Source: OHID, based on Office for National Statistics data
Among women, of the 159 respiratory disease deaths under the age of 75 years which were registered during 2022-24, 107 (67%) were considered to be preventable.
Compared with benchmark
Under 75 mortality rate from respiratory disease considered preventable (Female <75 yrs) 2022 - 24
| Area |
Recent
Trend |
Count
|
Value
|
95%
Lower CI |
95%
Upper CI |
|
|---|---|---|---|---|---|---|
| England | 13164 | 17.3 | 17.0 | 17.6 | ||
| Yorkshire and the Humber region (statistical) | 1606 | 21.3 | 20.3 | 22.4 | ||
| Kingston upon Hull | 107 | 33.8 | 27.7 | 40.8 | ||
| East Riding of Yorkshire | 81 | 13.0 | 10.3 | 16.1 | ||
| North East Lincolnshire | 64 | 27.4 | 21.1 | 35.0 | ||
| North Lincolnshire | 64 | 24.0 | 18.5 | 30.7 | ||
| York | 45 | 16.9 | 12.3 | 22.6 | ||
| North Yorkshire UA | 115 | 10.6 | 8.8 | 12.8 | ||
| Barnsley | 88 | 24.7 | 19.8 | 30.5 | ||
| Doncaster | 105 | 23.6 | 19.3 | 28.6 | ||
| Rotherham | 105 | 27.8 | 22.7 | 33.7 | ||
| Sheffield | 113 | 17.0 | 14.0 | 20.4 | ||
| Bradford | 162 | 25.5 | 21.8 | 29.8 | ||
| Calderdale | 76 | 25.8 | 20.3 | 32.3 | ||
| Kirklees | 134 | 23.5 | 19.7 | 27.9 | ||
| Leeds | 217 | 23.5 | 20.4 | 26.8 | ||
| Wakefield | 130 | 26.2 | 21.9 | 31.2 |
Source: OHID, based on Office for National Statistics data
The premature mortality rate from respiratory diseases considered to be preventable increased in Hull between 2004-06 and 2017-19, then decreased during the COVID pandemic, before increasing slightly for the last two periods, with the rate in Hull statistically significantly higher than the England rate for each three-year period. Throughout 2001-03 to 2024-24, the trend for England has been relatively flat. Consequently the inequalities gap between Hull and England has increased over this time period.
Compared with benchmark
Under 75 mortality rate from respiratory disease considered preventable (Persons <75 yrs)
|
Period
|
Kingston upon Hull |
Yorkshire and the Humber region (statistical)
|
England
|
||||
|---|---|---|---|---|---|---|---|
|
Count
|
Value
|
95%
Lower CI |
95%
Upper CI |
||||
| 2001 - 03 | • | 164 | 31.7 | 27.1 | 37.0 | 25.2 | 21.3 |
| 2002 - 04 | • | 157 | 30.3 | 25.8 | 35.4 | 23.9 | 20.7 |
| 2003 - 05 | • | 159 | 30.7 | 26.1 | 35.9 | 23.6 | 20.5 |
| 2004 - 06 | • | 148 | 28.4 | 24.0 | 33.4 | 22.1 | 19.4 |
| 2005 - 07 | • | 159 | 30.8 | 26.2 | 35.9 | 22.4 | 19.2 |
| 2006 - 08 | • | 177 | 34.3 | 29.4 | 39.8 | 22.1 | 19.0 |
| 2007 - 09 | • | 192 | 37.5 | 32.4 | 43.2 | 22.4 | 18.8 |
| 2008 - 10 | • | 197 | 38.1 | 32.9 | 43.8 | 22.2 | 18.7 |
| 2009 - 11 | • | 193 | 37.5 | 32.3 | 43.2 | 22.3 | 18.4 |
| 2010 - 12 | • | 192 | 37.4 | 32.3 | 43.2 | 22.6 | 18.7 |
| 2011 - 13 | • | 197 | 38.2 | 33.0 | 43.9 | 23.3 | 19.0 |
| 2012 - 14 | • | 221 | 42.1 | 36.7 | 48.1 | 23.1 | 18.9 |
| 2013 - 15 | • | 236 | 43.8 | 38.4 | 49.9 | 22.8 | 19.2 |
| 2014 - 16 | • | 238 | 43.6 | 38.2 | 49.6 | 22.9 | 19.6 |
| 2015 - 17 | • | 226 | 40.5 | 35.3 | 46.2 | 23.3 | 20.0 |
| 2016 - 18 | • | 239 | 41.7 | 36.5 | 47.3 | 24.5 | 20.4 |
| 2017 - 19 | • | 264 | 44.3 | 39.1 | 50.0 | 25.0 | 20.3 |
| 2018 - 20 | • | 249 | 40.6 | 35.7 | 45.9 | 23.8 | 19.5 |
| 2019 - 21 | • | 225 | 35.9 | 31.4 | 40.9 | 21.4 | 17.7 |
| 2020 - 22 | • | 212 | 33.6 | 29.2 | 38.4 | 20.1 | 17.0 |
| 2021 - 23 | • | 218 | 34.6 | 30.2 | 39.5 | 21.3 | 18.0 |
| 2022 - 24 | • | 230 | 36.8 | 32.2 | 41.9 | 22.6 | 19.3 |
Source: OHID, based on Office for National Statistics data
Among males, the premature mortality rate from respiratory diseases considered to be preventable increased in Hull between 2005-07 and 2008-10, then remained relatively flat, decreasing a bit during the COVID pandemic, before increasing a bit in the last two three-year periods. The rate in Hull has been statistically significantly higher than for England for each three-year period except 2004-06. Since 2001-03 the rate for England has been relatively flat, meaning the inequalities gap between Hull and England has increased since then.
Compared with benchmark
Under 75 mortality rate from respiratory disease considered preventable (Male <75 yrs)
|
Period
|
Kingston upon Hull |
Yorkshire and the Humber region (statistical)
|
England
|
||||
|---|---|---|---|---|---|---|---|
|
Count
|
Value
|
95%
Lower CI |
95%
Upper CI |
||||
| 2001 - 03 | • | 85 | 35.2 | 28.1 | 43.5 | 28.3 | 24.5 |
| 2002 - 04 | • | 83 | 34.1 | 27.2 | 42.3 | 26.9 | 23.6 |
| 2003 - 05 | • | 76 | 31.0 | 24.4 | 38.7 | 26.0 | 23.3 |
| 2004 - 06 | • | 72 | 28.4 | 22.2 | 35.8 | 25.2 | 22.3 |
| 2005 - 07 | • | 75 | 29.6 | 23.2 | 37.1 | 24.7 | 21.9 |
| 2006 - 08 | • | 93 | 37.4 | 30.2 | 45.8 | 24.6 | 21.6 |
| 2007 - 09 | • | 101 | 40.5 | 33.0 | 49.3 | 23.6 | 21.0 |
| 2008 - 10 | • | 109 | 43.9 | 36.0 | 53.0 | 23.6 | 20.9 |
| 2009 - 11 | • | 105 | 42.4 | 34.6 | 51.4 | 23.2 | 20.5 |
| 2010 - 12 | • | 100 | 40.6 | 33.0 | 49.4 | 24.0 | 20.9 |
| 2011 - 13 | • | 101 | 40.4 | 32.8 | 49.2 | 24.1 | 21.0 |
| 2012 - 14 | • | 103 | 40.4 | 32.9 | 49.0 | 23.8 | 20.9 |
| 2013 - 15 | • | 115 | 43.6 | 35.9 | 52.5 | 23.3 | 21.2 |
| 2014 - 16 | • | 122 | 44.9 | 37.2 | 53.8 | 24.2 | 21.9 |
| 2015 - 17 | • | 113 | 40.7 | 33.5 | 49.0 | 25.1 | 22.4 |
| 2016 - 18 | • | 119 | 41.4 | 34.2 | 49.6 | 26.1 | 22.9 |
| 2017 - 19 | • | 127 | 42.6 | 35.5 | 50.7 | 26.6 | 22.6 |
| 2018 - 20 | • | 133 | 43.5 | 36.4 | 51.5 | 25.2 | 21.7 |
| 2019 - 21 | • | 124 | 39.9 | 33.2 | 47.6 | 23.2 | 19.7 |
| 2020 - 22 | • | 112 | 35.9 | 29.6 | 43.2 | 21.5 | 19.0 |
| 2021 - 23 | • | 114 | 36.8 | 30.3 | 44.2 | 22.6 | 19.9 |
| 2022 - 24 | • | 123 | 39.9 | 33.1 | 47.6 | 23.9 | 21.4 |
Source: OHID, based on Office for National Statistics data
Among females, the premature mortality rate from respiratory diseases considered to be preventable increased in Hull until 2012-14, then remained relatively flat until 2017-19. Large decrease were seen during the COVID pandemic, with small increases in the past two three- year periods. The rate in Hull has been statistically significantly higher than for England for each three-year period. While the inequalities gap between Hull and England has reduced since 2017-19, it remains much larger than in 2001-03.
Compared with benchmark
Under 75 mortality rate from respiratory disease considered preventable (Female <75 yrs)
|
Period
|
Kingston upon Hull |
Yorkshire and the Humber region (statistical)
|
England
|
||||
|---|---|---|---|---|---|---|---|
|
Count
|
Value
|
95%
Lower CI |
95%
Upper CI |
||||
| 2001 - 03 | • | 79 | 28.7 | 22.7 | 35.8 | 22.5 | 18.4 |
| 2002 - 04 | • | 74 | 26.9 | 21.1 | 33.8 | 21.3 | 18.0 |
| 2003 - 05 | • | 82 | 30.5 | 24.3 | 37.9 | 21.5 | 17.9 |
| 2004 - 06 | • | 76 | 28.4 | 22.3 | 35.5 | 19.3 | 16.8 |
| 2005 - 07 | • | 84 | 31.8 | 25.4 | 39.4 | 20.4 | 16.7 |
| 2006 - 08 | • | 83 | 31.4 | 25.0 | 38.9 | 19.9 | 16.7 |
| 2007 - 09 | • | 91 | 34.6 | 27.9 | 42.5 | 21.3 | 16.7 |
| 2008 - 10 | • | 87 | 32.5 | 26.0 | 40.1 | 20.8 | 16.6 |
| 2009 - 11 | • | 88 | 32.9 | 26.3 | 40.5 | 21.4 | 16.5 |
| 2010 - 12 | • | 92 | 34.6 | 27.9 | 42.4 | 21.4 | 16.8 |
| 2011 - 13 | • | 96 | 36.2 | 29.3 | 44.2 | 22.7 | 17.1 |
| 2012 - 14 | • | 117 | 43.8 | 36.2 | 52.5 | 22.4 | 17.0 |
| 2013 - 15 | • | 120 | 44.0 | 36.4 | 52.7 | 22.3 | 17.2 |
| 2014 - 16 | • | 116 | 42.2 | 34.8 | 50.7 | 21.7 | 17.5 |
| 2015 - 17 | • | 113 | 40.2 | 33.1 | 48.4 | 21.5 | 17.8 |
| 2016 - 18 | • | 120 | 41.8 | 34.6 | 50.0 | 23.1 | 18.2 |
| 2017 - 19 | • | 137 | 45.9 | 38.5 | 54.2 | 23.4 | 18.2 |
| 2018 - 20 | • | 116 | 37.6 | 31.1 | 45.1 | 22.4 | 17.4 |
| 2019 - 21 | • | 101 | 32.0 | 26.1 | 38.9 | 19.6 | 15.8 |
| 2020 - 22 | • | 100 | 31.3 | 25.5 | 38.1 | 18.7 | 15.2 |
| 2021 - 23 | • | 104 | 32.6 | 26.6 | 39.5 | 20.1 | 16.2 |
| 2022 - 24 | • | 107 | 33.8 | 27.7 | 40.8 | 21.3 | 17.3 |
Source: OHID, based on Office for National Statistics data
Asthma
Diagnosed Prevalence
The prevalence of asthma among patients aged 6+ years registered with Hull GPs from the Quality and Outcomes Framework was 6.3% for 2024/25 for Hull (03F) and is similar to England, but the lowest across the Humber and North Yorkshire Integrated Care Board.
Compared with benchmark
| Indicator | Period | England | NHS Humber and North Yorkshire Integrated Care Board - QOQ | Humber and North Yorkshire ICB - 02Y | Humber and North Yorkshire ICB - 03F | Humber and North Yorkshire ICB - 03H | Humber and North Yorkshire ICB - 03K | Humber and North Yorkshire ICB - 03Q | Humber and North Yorkshire ICB - 42D |
|---|---|---|---|---|---|---|---|---|---|
Asthma: QOF prevalence (Persons 6+ yrs) | 2024/25 | 6.6 | 7.2 | 7.6 | 6.3 | 7.3 | 7.0 | 6.8 | 7.7 |
An indicator relating to asthma has been included in the Quality and Outcomes Framework since 2004/05, but related to all ages. In 2020/21, the indicator was changed to be the number of patients aged 6+ years who have asthma so the trends over time are not available over a long period of time as the indicator definition has changed.
For the three years 2020/21 to 2022/23, the prevalence of diagnosed asthma in Hull has remained relatively constant and has been reasonably comparable to England although has fallen slightly in Hull over the last two years. The recorded prevalence for Hull has been consistently below the average across the Humber and North Yorkshire Integrated Care Board.
Compared with benchmark
Asthma: QOF prevalence (Persons 6+ yrs)
|
Period
|
Humber and North Yorkshire ICB - 03F |
NHS Humber and North Yorkshire Integrated Care Board - QOQ
|
England
|
||||
|---|---|---|---|---|---|---|---|
|
Count
|
Value
|
95%
Lower CI |
95%
Upper CI |
||||
| 2020/21 | • | 18081 | 6.4% | 6.3% | 6.5% | 6.8% | 6.4% |
| 2021/22 | • | 18603 | 6.5% | 6.4% | 6.6% | 7.0% | 6.5% |
| 2022/23 | • | 18652 | 6.4% | 6.3% | 6.5% | 7.1% | 6.5% |
| 2023/24 | • | 18581 | 6.3% | 6.2% | 6.4% | 7.1% | 6.5% |
| 2024/25 | • | 18620 | 6.3% | 6.2% | 6.4% | 7.2% | 6.6% |
Source: NHS England
From the local analysis of the national Quality and Outcomes Framework datasets, there was a statistically significant association between average age of the practice patients and the prevalence of diagnosed asthma across the 25 practices in Hull for 2024/25. If the practices were divided into five approximately equal sized groups based on average age of patients (with each fifth having approximately one-fifth of the total registered patients in Hull) then the prevalence increased from 5.3% for the practices serving the youngest practice patients to 6.7% for the practices serving the oldest practice patients. For every increase in the average age of the patients of 10 years, the prevalence of asthma increased by 1.6 percentage points. Further analysis including the prevalence of asthma for each practice is available within the file within Local Analysis of Quality and Outcomes Framework Data.
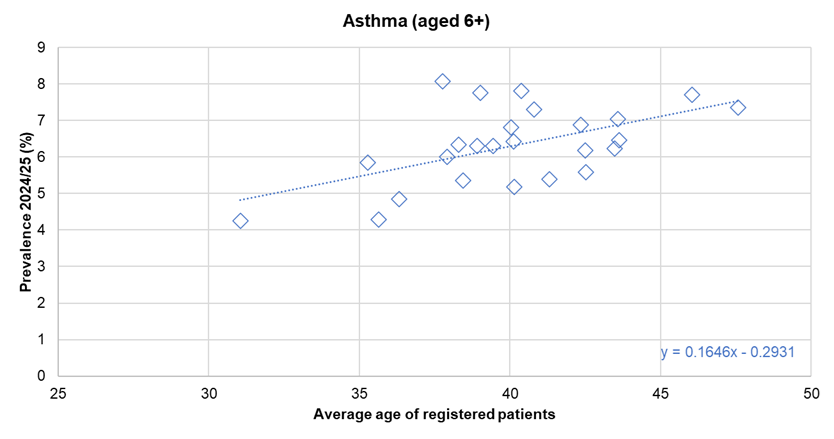
There was no statistically significant association between the prevalence of diagnosed asthma and the average deprivation score of registered patients (using the Index of Multiple Deprivation 2025) across the 25 practices.
Hospital Admissions
Among those aged 19+ years, the rate of emergency admissions for asthma in Hull (03F) was 13% higher than the rate for England for 2024/25 with 89.9 admissions per 100,000 population in Hull compared to 79.5 admissions per 100,000 population for England.
The rate is given as the directly age standardised admission rates per 100,000 population for those aged 19+ years (standardised to the European Standard Population).
Compared with benchmark
| Indicator | Period | England | NHS Humber and North Yorkshire Integrated Care Board - QOQ | Humber and North Yorkshire ICB - 02Y | Humber and North Yorkshire ICB - 03F | Humber and North Yorkshire ICB - 03H | Humber and North Yorkshire ICB - 03K | Humber and North Yorkshire ICB - 03Q | Humber and North Yorkshire ICB - 42D |
|---|---|---|---|---|---|---|---|---|---|
Emergency hospital admissions for asthma in adults (aged 19 years and over) (Persons 19+ yrs) | 2024/25 | 79.5 | 89.1 | 86.0 | 89.9 | 132.0 | 122.6 | 77.7 | 70.6 |
Among those aged 19+ years, the emergency admission rate for asthma in Hull had been quite variable between 2013/14 and 2019/20. There was a generally increasing trend between 2013/14 and 2016/17, with the rate remaining relatively constant between 2016/17 and 2018/19. Emergency admissions were lower in 2019/20, and then decreased sharply (by almost half) in 2020/21 which is likely associated with the COVID-19 pandemic. The rates then increased in each year until 2023/24 (which saw a particularly large increase of 50%) before decreasing a little in 2024/25, although still higher than they were in 2019/20 prior to the pandemic.
During 2024/25, there were 215 emergency hospital admissions for asthma among Hull residents.
Compared with benchmark
Emergency hospital admissions for asthma in adults (aged 19 years and over) (Persons 19+ yrs)
|
Period
|
Humber and North Yorkshire ICB - 03F |
NHS Humber and North Yorkshire Integrated Care Board - QOQ
|
England
|
||||
|---|---|---|---|---|---|---|---|
|
Count
|
Value
|
95%
Lower CI |
95%
Upper CI |
||||
| 2013/14 | • | 170 | 76.2 | 63.0 | 90.9 | 67.7 | 76.6 |
| 2014/15 | • | 190 | 86.8 | 72.9 | 102.4 | 81.5 | 88.8 |
| 2015/16 | • | 165 | 73.2 | 60.4 | 87.6 | 68.7 | 85.9 |
| 2016/17 | • | 215 | 96.6 | 78.8 | 116.2 | 80.0 | 89.8 |
| 2017/18 | • | 225 | 98.1 | 82.3 | 115.6 | 79.6 | 90.2 |
| 2018/19 | • | 215 | 94.3 | 78.5 | 111.7 | 82.3 | 95.2 |
| 2019/20 | • | 185 | 82.0 | 67.6 | 98.1 | 80.2 | 95.9 |
| 2020/21 | • | 105 | 45.3 | 35.7 | 56.4 | 42.9 | 44.4 |
| 2021/22 | • | 125 | 54.4 | 42.0 | 68.5 | 61.2 | 66.5 |
| 2022/23 | • | 140 | 60.8 | 50.0 | 73.0 | 66.8 | 72.1 |
| 2023/24 | • | 215 | 91.5 | 72.6 | 112.3 | 85.1 | 84.5 |
| 2024/25 | • | 215 | 89.9 | 75.9 | 105.3 | 89.1 | 79.5 |
Source: OHID, based on NHS England data
Deaths
The directly age standardised mortality rate for asthma per 100,000 population was 22% higher in Hull (03F) compared to England for 2022-24.
The figures are not available for all local authorities, particularly for males and females separately, due to the small number of deaths.
Compared with benchmark
| Indicator | Period | England | Yorkshire and the Humber region (statistical) | Kingston upon Hull | East Riding of Yorkshire | North East Lincolnshire | North Lincolnshire | York | North Yorkshire UA | Barnsley | Doncaster | Rotherham | Sheffield | Bradford | Calderdale | Kirklees | Leeds | Wakefield |
|---|---|---|---|---|---|---|---|---|---|---|---|---|---|---|---|---|---|---|
Mortality rate from asthma, all ages (Persons All ages) | 2022 - 24 | 2.07 | 2.31 | 2.52 | 3.06 | 2.84 | 3.25 | - | 1.41 | 1.59 | - | 2.00 | 1.72 | 2.95 | 4.35 | 3.39 | 1.97 | 3.39 |
Mortality rate from asthma, all ages (Male All ages) | 2022 - 24 | 1.57 | 1.70 | - | 2.83 | - | - | - | - | - | - | - | - | 2.99 | 5.76 | 1.73 | 1.33 | 2.32 |
Mortality rate from asthma, all ages (Female All ages) | 2022 - 24 | 2.44 | 2.74 | - | 3.28 | 4.80 | 4.37 | - | 1.83 | - | - | 2.67 | 2.09 | 2.93 | 3.35 | 4.44 | 2.35 | 4.21 |
However, the number of deaths are small with 16 deaths in the latest three year period 2022-24. As a result of the small numbers, there is considerable year-on-year variability. In the more recent period between 2017-19 and 2021-23, the rate has been around three deaths per 100,000 population, but has decreased to 2.5 for the most recent period 2022-24. The difference in the mortality rate between England and Hull is not statistically significant, and whilst the rate between 2017-19 and 2021-23 has been consistently higher in Hull compared to England the differences was not statistically significant.
Compared with benchmark
Mortality rate from asthma, all ages (Persons All ages)
|
Period
|
Kingston upon Hull |
Yorkshire and the Humber region (statistical)
|
England
|
||||
|---|---|---|---|---|---|---|---|
|
Count
|
Value
|
95%
Lower CI |
95%
Upper CI |
||||
| 2001 - 03 | • | 25 | 4.38 | 2.82 | 6.49 | 3.09 | 2.80 |
| 2002 - 04 | • | 24 | 4.26 | 2.71 | 6.37 | 3.29 | 2.76 |
| 2003 - 05 | • | 27 | 4.81 | 3.14 | 7.02 | 3.28 | 2.68 |
| 2004 - 06 | • | 24 | 4.31 | 2.73 | 6.45 | 2.78 | 2.52 |
| 2005 - 07 | • | 27 | 4.79 | 3.11 | 7.03 | 2.61 | 2.35 |
| 2006 - 08 | • | 25 | 4.41 | 2.80 | 6.58 | 2.58 | 2.25 |
| 2007 - 09 | • | 27 | 4.72 | 3.05 | 6.95 | 2.53 | 2.19 |
| 2008 - 10 | • | 21 | 3.56 | 2.17 | 5.49 | 2.43 | 2.15 |
| 2009 - 11 | • | 23 | 3.89 | 2.44 | 5.87 | 2.23 | 2.10 |
| 2010 - 12 | • | 22 | 3.72 | 2.31 | 5.66 | 2.22 | 2.12 |
| 2011 - 13 | • | 26 | 4.29 | 2.78 | 6.30 | 2.25 | 2.14 |
| 2012 - 14 | • | 29 | 4.94 | 3.29 | 7.12 | 2.30 | 2.14 |
| 2013 - 15 | • | 30 | 5.22 | 3.50 | 7.49 | 2.39 | 2.22 |
| 2014 - 16 | • | 24 | 4.24 | 2.68 | 6.35 | 2.25 | 2.27 |
| 2015 - 17 | • | 17 | 2.80 | 1.60 | 4.53 | 2.27 | 2.36 |
| 2016 - 18 | • | 14 | 2.13 | 1.15 | 3.59 | 2.21 | 2.40 |
| 2017 - 19 | • | 18 | 3.06 | 1.79 | 4.87 | 2.28 | 2.39 |
| 2018 - 20 | • | 17 | 2.96 | 1.70 | 4.77 | 2.27 | 2.37 |
| 2019 - 21 | • | 21 | 3.46 | 2.12 | 5.32 | 2.33 | 2.18 |
| 2020 - 22 | • | 18 | 2.83 | 1.66 | 4.49 | 2.30 | 2.12 |
| 2021 - 23 | • | 21 | 3.22 | 1.98 | 4.95 | 2.32 | 2.07 |
| 2022 - 24 | • | 16 | 2.52 | 1.43 | 4.12 | 2.31 | 2.07 |
Source: OHID, based on Office for National Statistics data
The trends over time are not available for males and females separately for all periods in Hull due to the small number of deaths. The majority of the deaths have been among women so the data is available for the majority of the years for Hull women.
Compared with benchmark
Mortality rate from asthma, all ages (Male All ages)
|
Period
|
Kingston upon Hull |
Yorkshire and the Humber region (statistical)
|
England
|
||||
|---|---|---|---|---|---|---|---|
|
Count
|
Value
|
95%
Lower CI |
95%
Upper CI |
||||
| 2001 - 03 | • | 10 | 4.21 | 1.92 | 7.88 | 2.70 | 2.33 |
| 2003 - 05 | • | 12 | 6.02 | 2.67 | 11.18 | 2.53 | 2.22 |
| 2005 - 07 | • | 10 | 4.96 | 1.98 | 9.76 | 2.00 | 1.78 |
| 2011 - 13 | • | 11 | 4.66 | 2.24 | 8.46 | 1.97 | 1.69 |
| 2012 - 14 | • | 13 | 5.87 | 2.98 | 10.26 | 2.01 | 1.65 |
| 2013 - 15 | • | 12 | 5.29 | 2.56 | 9.50 | 1.93 | 1.70 |
Source: OHID, based on Office for National Statistics data
Mortality rate from asthma, all ages (Female All ages)
|
Period
|
Kingston upon Hull |
Yorkshire and the Humber region (statistical)
|
England
|
||||
|---|---|---|---|---|---|---|---|
|
Count
|
Value
|
95%
Lower CI |
95%
Upper CI |
||||
| 2001 - 03 | • | 15 | 4.28 | 2.38 | 7.09 | 3.41 | 3.10 |
| 2002 - 04 | • | 16 | 4.76 | 2.71 | 7.75 | 3.72 | 3.03 |
| 2003 - 05 | • | 15 | 4.33 | 2.41 | 7.16 | 3.75 | 2.97 |
| 2004 - 06 | • | 15 | 4.36 | 2.43 | 7.21 | 3.26 | 2.84 |
| 2005 - 07 | • | 17 | 4.81 | 2.78 | 7.74 | 3.05 | 2.70 |
| 2006 - 08 | • | 17 | 4.97 | 2.87 | 8.00 | 2.97 | 2.60 |
| 2007 - 09 | • | 19 | 5.61 | 3.35 | 8.80 | 2.82 | 2.48 |
| 2008 - 10 | • | 16 | 4.69 | 2.66 | 7.65 | 2.84 | 2.51 |
| 2009 - 11 | • | 17 | 4.93 | 2.85 | 7.92 | 2.58 | 2.42 |
| 2010 - 12 | • | 16 | 4.67 | 2.65 | 7.62 | 2.56 | 2.50 |
| 2011 - 13 | • | 15 | 4.27 | 2.37 | 7.07 | 2.47 | 2.44 |
| 2012 - 14 | • | 16 | 4.60 | 2.62 | 7.49 | 2.53 | 2.47 |
| 2013 - 15 | • | 18 | 5.17 | 3.06 | 8.19 | 2.72 | 2.58 |
| 2014 - 16 | • | 15 | 4.31 | 2.40 | 7.13 | 2.57 | 2.67 |
| 2015 - 17 | • | 10 | 2.92 | 1.38 | 5.40 | 2.72 | 2.82 |
| 2018 - 20 | • | 10 | 3.12 | 1.49 | 5.75 | 2.74 | 2.81 |
| 2019 - 21 | • | 15 | 4.28 | 2.38 | 7.07 | 2.74 | 2.54 |
| 2020 - 22 | • | 13 | 3.65 | 1.94 | 6.26 | 2.70 | 2.47 |
| 2021 - 23 | • | 16 | 4.28 | 2.44 | 6.97 | 2.67 | 2.40 |
Source: OHID, based on Office for National Statistics data
Chronic Obstructive Pulmonary Disease
Diagnosed Prevalence
Given the high prevalence of smoking in Hull, both historically and currently, and the strong association between smoking and COPD, it is not surprising that Hull has a high percentage of patients registered with Hull GPs who have been diagnosed with COPD.
From Quality and Outcomes Framework, for 2024/25, 3.2% of all patients registered with Hull GPs (03F) had a diagnosis of chronic obstructive pulmonary disease (COPD) compared to 1.9% for England.
Compared with benchmark
| Indicator | Period | England | NHS Humber and North Yorkshire Integrated Care Board - QOQ | Humber and North Yorkshire ICB - 02Y | Humber and North Yorkshire ICB - 03F | Humber and North Yorkshire ICB - 03H | Humber and North Yorkshire ICB - 03K | Humber and North Yorkshire ICB - 03Q | Humber and North Yorkshire ICB - 42D |
|---|---|---|---|---|---|---|---|---|---|
COPD: QOF prevalence (Persons All ages) | 2024/25 | 1.9 | 2.5 | 2.8 | 3.2 | 3.2 | 2.7 | 1.6 | 2.1 |
The diagnosed prevalence of COPD at practice level has also been increasing in Hull, and at a higher rate of increase than the average for England.
There were 9,920 patients registered with Hull GPs diagnosed with COPD in 2024/25.
Compared with benchmark
COPD: QOF prevalence (Persons All ages)
|
Period
|
Humber and North Yorkshire ICB - 03F |
NHS Humber and North Yorkshire Integrated Care Board - QOQ
|
England
|
||||
|---|---|---|---|---|---|---|---|
|
Count
|
Value
|
95%
Lower CI |
95%
Upper CI |
||||
| 2009/10 | • | 5947 | 2.1% | 2.0% | 2.1% | - | 1.6% |
| 2010/11 | • | 6507 | 2.3% | 2.2% | 2.3% | - | 1.6% |
| 2011/12 | • | 6778 | 2.3% | 2.3% | 2.4% | - | 1.7% |
| 2012/13 | • | 7076 | 2.4% | 2.4% | 2.5% | - | 1.7% |
| 2013/14 | • | 7350 | 2.5% | 2.5% | 2.6% | - | 1.8% |
| 2014/15 | • | 7616 | 2.6% | 2.6% | 2.7% | - | 1.8% |
| 2015/16 | • | 7849 | 2.7% | 2.6% | 2.7% | - | 1.9% |
| 2016/17 | • | 7999 | 2.6% | 2.5% | 2.6% | - | 1.9% |
| 2017/18 | • | 8196 | 2.7% | 2.7% | 2.8% | - | 1.9% |
| 2018/19 | • | 8462 | 2.8% | 2.8% | 2.9% | - | 1.9% |
| 2019/20 | • | 8719 | 2.9% | 2.8% | 2.9% | 2.4% | 1.9% |
| 2020/21 | • | 8650 | 2.9% | 2.8% | 2.9% | 2.4% | 1.9% |
| 2021/22 | • | 9182 | 3.0% | 2.9% | 3.1% | 2.3% | 1.9% |
| 2022/23 | • | 9690 | 3.1% | 3.1% | 3.2% | 2.4% | 1.8% |
| 2023/24 | • | 9826 | 3.1% | 3.1% | 3.2% | 2.4% | 1.9% |
| 2024/25 | • | 9920 | 3.2% | 3.1% | 3.2% | 2.5% | 1.9% |
Source: NHS England
From the local analysis, there was a statistically significant association between average age of the practice patients and the prevalence of diagnosed COPD across the 25 practices in Hull for 2024/25. The prevalence was 2.1% among practices serving the youngest patients compared to 3.7% among practices serving the oldest patients. For every increase in the average age of the patients of 10 years, the prevalence of COPD increased by 1.3 percentage points. Further analysis of diagnosed disease by the average age of practice patients is within the file above and within Local Analysis of Quality and Outcomes Framework Data.
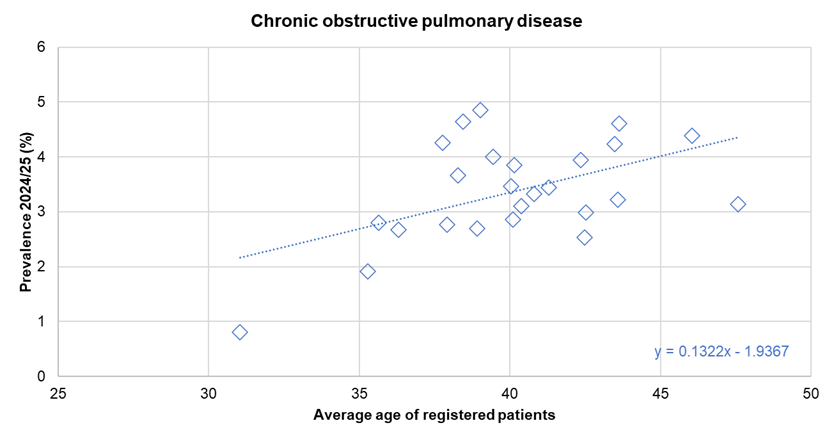
There was no statistically significant association between the prevalence of diagnosed COPD and the average deprivation score of registered patients (using the Index of Multiple Deprivation 2025) across the 25 practices.
Hospital Admissions
The age standardised emergency hospital admission rate for COPD per 100,000 population was more than twice as high in Hull (03F) compared to England (443 versus 201 emergency hospital admissions per 100,000 population) for 2024/25. Hull not only had the highest rate in the Humber and North Yorkshire Integrated Care Board area, but the highest rate among all ICB sub-locations in England.
The rate is given as a directly age-standardised admission rate per 100,000 population standardised to the European Standard Population.
Compared with benchmark
| Indicator | Period | England | NHS Humber and North Yorkshire Integrated Care Board - QOQ | Humber and North Yorkshire ICB - 02Y | Humber and North Yorkshire ICB - 03F | Humber and North Yorkshire ICB - 03H | Humber and North Yorkshire ICB - 03K | Humber and North Yorkshire ICB - 03Q | Humber and North Yorkshire ICB - 42D |
|---|---|---|---|---|---|---|---|---|---|
Emergency hospital admissions for COPD, all ages (Persons All ages) | 2024/25 | 201.1 | 233.1 | 189.8 | 442.8 | 362.2 | 356.8 | 142.6 | 141.7 |
The number of emergency hospital admissions for COPD in Hull steadily increased from 400 admissions per 100,000 population in 2013/14 to a high of 525 admissions per 100,000 population during 2017/18. Whilst the rate decreased between 2017/18 to 2019/20, the rate in Hull remained almost twice as high as England.
The rate fell sharply in 2020/21 with admissions almost halving due to the COVID-19 pandemic, although increased for 2021/22. The rate remained relatively unchanged for 2022/23, but increased significantly in 2023/24, rising by one third, before increasing again in 2024/25. Despite these increases, the latest rate remains below the pre-pandemic admission rates, with the 71% increase in the rate of admissions in Hull since 2020/21 very similar to the change in the Yorkshire and Humber region (68% increase), although much higher than for England (51% increase).
The inequalities gap between Hull and England decreased between 2019/20 and 2020/21 and then remained at that slightly lower difference in 2022/23, although has increased in both 2023/24 and 2024/25. This is reflected in the admission rate in Hull in 2024/25 being more than double that for England, having been 1.7 times higher than England in 2022/23.
Overall, in 2024/25 there were 1,165 emergency admissions for COPD which is much lower than the peak of 1,245 in 2017/18 and lower than the 1,125 in 2019/20 prior to the pandemic.
Compared with benchmark
Emergency hospital admissions for COPD, all ages (Persons All ages)
|
Period
|
Humber and North Yorkshire ICB - 03F |
NHS Humber and North Yorkshire Integrated Care Board - QOQ
|
England
|
||||
|---|---|---|---|---|---|---|---|
|
Count
|
Value
|
95%
Lower CI |
95%
Upper CI |
||||
| 2013/14 | • | 925 | 399.8 | 364.1 | 437.3 | 239.9 | 231.8 |
| 2014/15 | • | 940 | 407.4 | 371.9 | 444.6 | 249.5 | 247.4 |
| 2015/16 | • | 1075 | 464.1 | 422.9 | 507.1 | 254.6 | 244.7 |
| 2016/17 | • | 1150 | 491.2 | 452.0 | 532.2 | 255.4 | 248.6 |
| 2017/18 | • | 1245 | 525.0 | 480.9 | 571.0 | 252.4 | 247.2 |
| 2018/19 | • | 1225 | 504.3 | 464.0 | 546.3 | 248.4 | 248.6 |
| 2019/20 | • | 1125 | 458.4 | 420.0 | 498.5 | 239.5 | 246.7 |
| 2020/21 | • | 645 | 259.2 | 228.2 | 292.0 | 138.6 | 133.4 |
| 2021/22 | • | 800 | 317.5 | 282.1 | 354.8 | 190.3 | 183.6 |
| 2022/23 | • | 815 | 318.0 | 287.7 | 350.0 | 188.7 | 190.8 |
| 2023/24 | • | 1090 | 421.8 | 379.9 | 465.6 | 225.8 | 208.5 |
| 2024/25 | • | 1165 | 442.8 | 398.4 | 489.1 | 233.1 | 201.1 |
Source: OHID, based on NHS England data
Deaths
The directly age standardised mortality rate for COPD per 100,000 population was 90% higher in Hull compared to England for deaths registered during 2022-24 (72% higher for men and 108% higher for women).
Mortality from COPD in Hull was the highest in the region (by some margin), and the fifth highest amongst upper tier local authorities in England for deaths registered during 2022-2024 (Manchester with 99.5 deaths per 100,000 population had the highest rate).
Compared with benchmark
| Indicator | Period | England | Yorkshire and the Humber region (statistical) | Kingston upon Hull | East Riding of Yorkshire | North East Lincolnshire | North Lincolnshire | York | North Yorkshire UA | Barnsley | Doncaster | Rotherham | Sheffield | Bradford | Calderdale | Kirklees | Leeds | Wakefield |
|---|---|---|---|---|---|---|---|---|---|---|---|---|---|---|---|---|---|---|
Mortality rate from chronic obstructive pulmonary disease, all ages (Persons All ages) | 2022 - 24 | 45.5 | 51.6 | 86.6 | 36.4 | 65.3 | 55.8 | 32.6 | 30.8 | 66.2 | 56.8 | 54.4 | 49.0 | 63.7 | 59.8 | 53.9 | 50.6 | 69.1 |
Mortality rate from chronic obstructive pulmonary disease, all ages (Male All ages) | 2022 - 24 | 53.0 | 57.5 | 91.1 | 43.9 | 78.1 | 66.7 | 30.9 | 36.4 | 70.9 | 65.5 | 54.6 | 58.7 | 73.7 | 61.1 | 58.9 | 52.7 | 76.3 |
Mortality rate from chronic obstructive pulmonary disease, all ages (Female All ages) | 2022 - 24 | 40.1 | 47.7 | 83.6 | 30.8 | 55.3 | 47.8 | 34.9 | 26.9 | 64.1 | 50.8 | 55.3 | 41.5 | 56.3 | 60.0 | 50.5 | 49.5 | 64.9 |
There had been a steady increase over time in the mortality rate in Hull between 2001-03 and 2017-19 resulting in a substantial cumulative increase over this time period as well as a substantial increase in the inequalities gap between Hull and England. There were 80 deaths per 100,000 population among Hull residents registered during 2001-03 which was 38% higher than England, but by 2017-19 this had increased to 116 deaths per 100,000 population which was 117% higher than England (more than double England’s rate).
Among all deaths from COVID-19 during 2020 and 2021, 16.1% had an underlying cause of COPD. So whilst the total number of people who died directly from COPD during the COVID-19 pandemic was lower as shown by the sharp decrease between 2017-19 and 2020-22, it would appear that the mortality rate among Hull residents with COPD was high; it was just that they were dying of COVID-19 rather than COPD itself. Further information is given within the Causes of Death in Hull under Population.
Whilst the mortality rate did decrease between 2017-19 and 2020-22 in England, the reduction did not appear particularly marked. This suggests that people with COPD in Hull were more susceptible to COVID-19 than people in England. There are many reasons why people in Hull might be more likely to catch COVID-19 and die from COVID-19. These could be associated with the age profile of the people with COPD in Hull, their working status (employed or not working or retired), likelihood of going out and catching COVID-19 (living alone, less support to collect medicines and food, less ability to shop online, perception of risk, compliance with wearing masks, etc), differences in access to care and hospital treatment, and higher mortality rate (more at risk due to progression or severity of COPD or number, severity and complexity of other co-morbidities). It is not known which, if any, of these might be more or less likely among Hull residents, but these are simply examples of potential reasons for the differences in the COVID-19 mortality rate among people with COPD.
Since the low during the pandemic, the mortality rate from COPD in Hull has increased relatively sharply compared to a less marked increase across the region and for England.
The mortality rate in Hull for 2022-24 is 25% lower than it was at its peak in 2017-19.
There were 556 deaths to Hull residents from COPD that were registered during the three year period 2022 to 2024.
Compared with benchmark
Mortality rate from chronic obstructive pulmonary disease, all ages (Persons All ages)
|
Period
|
Kingston upon Hull |
Yorkshire and the Humber region (statistical)
|
England
|
||||
|---|---|---|---|---|---|---|---|
|
Count
|
Value
|
95%
Lower CI |
95%
Upper CI |
||||
| 2001 - 03 | • | 459 | 80.2 | 73.0 | 87.9 | 67.7 | 58.3 |
| 2002 - 04 | • | 439 | 77.0 | 69.9 | 84.6 | 66.7 | 57.5 |
| 2003 - 05 | • | 455 | 79.7 | 72.5 | 87.5 | 66.2 | 56.9 |
| 2004 - 06 | • | 443 | 77.4 | 70.3 | 85.0 | 63.0 | 54.5 |
| 2005 - 07 | • | 476 | 83.3 | 76.0 | 91.2 | 63.1 | 54.2 |
| 2006 - 08 | • | 486 | 85.0 | 77.6 | 93.0 | 62.8 | 54.0 |
| 2007 - 09 | • | 514 | 89.7 | 82.1 | 97.9 | 62.6 | 53.2 |
| 2008 - 10 | • | 512 | 89.4 | 81.8 | 97.6 | 61.1 | 52.5 |
| 2009 - 11 | • | 533 | 93.4 | 85.6 | 101.8 | 60.1 | 51.4 |
| 2010 - 12 | • | 525 | 91.8 | 84.1 | 100.1 | 61.2 | 52.4 |
| 2011 - 13 | • | 551 | 96.4 | 88.5 | 104.9 | 63.5 | 54.0 |
| 2012 - 14 | • | 573 | 98.9 | 90.9 | 107.4 | 63.9 | 54.3 |
| 2013 - 15 | • | 607 | 104.4 | 96.2 | 113.1 | 64.0 | 55.3 |
| 2014 - 16 | • | 620 | 105.4 | 97.2 | 114.1 | 63.5 | 55.0 |
| 2015 - 17 | • | 629 | 106.9 | 98.7 | 115.7 | 63.5 | 55.6 |
| 2016 - 18 | • | 685 | 115.4 | 106.8 | 124.4 | 63.4 | 54.6 |
| 2017 - 19 | • | 695 | 115.8 | 107.2 | 124.8 | 62.2 | 53.3 |
| 2018 - 20 | • | 645 | 105.6 | 97.5 | 114.1 | 58.0 | 49.7 |
| 2019 - 21 | • | 511 | 82.2 | 75.2 | 89.7 | 51.9 | 44.9 |
| 2020 - 22 | • | 481 | 76.2 | 69.5 | 83.3 | 48.7 | 42.8 |
| 2021 - 23 | • | 496 | 77.9 | 71.2 | 85.1 | 50.2 | 43.9 |
| 2022 - 24 | • | 556 | 86.6 | 79.5 | 94.1 | 51.6 | 45.5 |
Source: OHID, based on Office for National Statistics data
The COPD mortality rate had increased between 2001-03 and 2017-19 among men by 30% from 104 to 134 deaths per 100,000 population. This fell sharply between its peak in 2017-19 to a low of 84 deaths per 100,000 population in 2020-22. The rate has increased in the last two years, but the mortality rate from COPD among Hull men is 32% lower than it was for 2017-19.
The pattern of change in Hull is very different from that of the region and England for men, where the mortality rate has fallen between 2001-03 and 2020-22 with a small increase in the last two years.
Among men, there were 261 deaths to Hull residents from COPD that were registered during the three year period 2022 to 2024.
Compared with benchmark
Mortality rate from chronic obstructive pulmonary disease, all ages (Male All ages)
|
Period
|
Kingston upon Hull |
Yorkshire and the Humber region (statistical)
|
England
|
||||
|---|---|---|---|---|---|---|---|
|
Count
|
Value
|
95%
Lower CI |
95%
Upper CI |
||||
| 2001 - 03 | • | 226 | 103.5 | 89.5 | 118.9 | 95.8 | 84.5 |
| 2002 - 04 | • | 228 | 106.7 | 92.2 | 122.7 | 93.4 | 82.0 |
| 2003 - 05 | • | 231 | 108.9 | 94.2 | 125.2 | 91.9 | 79.7 |
| 2004 - 06 | • | 211 | 97.2 | 83.6 | 112.3 | 87.5 | 75.3 |
| 2005 - 07 | • | 216 | 96.7 | 83.5 | 111.3 | 83.5 | 73.6 |
| 2006 - 08 | • | 229 | 98.8 | 85.9 | 113.1 | 80.6 | 72.6 |
| 2007 - 09 | • | 255 | 109.7 | 96.1 | 124.6 | 78.0 | 71.2 |
| 2008 - 10 | • | 266 | 115.1 | 101.1 | 130.4 | 76.3 | 69.7 |
| 2009 - 11 | • | 261 | 112.1 | 98.5 | 127.1 | 74.2 | 67.3 |
| 2010 - 12 | • | 254 | 109.2 | 95.7 | 124.0 | 75.2 | 67.7 |
| 2011 - 13 | • | 260 | 113.2 | 99.4 | 128.4 | 77.0 | 68.9 |
| 2012 - 14 | • | 265 | 112.1 | 98.6 | 126.9 | 76.0 | 68.6 |
| 2013 - 15 | • | 293 | 121.7 | 107.6 | 137.0 | 74.8 | 69.0 |
| 2014 - 16 | • | 302 | 119.8 | 106.3 | 134.5 | 74.0 | 68.0 |
| 2015 - 17 | • | 307 | 123.3 | 109.4 | 138.4 | 74.2 | 68.2 |
| 2016 - 18 | • | 338 | 133.5 | 119.2 | 149.0 | 73.3 | 66.5 |
| 2017 - 19 | • | 343 | 134.4 | 120.0 | 149.9 | 71.0 | 64.4 |
| 2018 - 20 | • | 329 | 125.1 | 111.5 | 139.9 | 66.9 | 60.0 |
| 2019 - 21 | • | 257 | 94.3 | 82.7 | 107.0 | 60.0 | 54.0 |
| 2020 - 22 | • | 234 | 84.4 | 73.5 | 96.3 | 56.5 | 50.9 |
| 2021 - 23 | • | 240 | 85.8 | 74.9 | 97.7 | 56.8 | 51.4 |
| 2022 - 24 | • | 261 | 91.1 | 80.1 | 103.2 | 57.5 | 53.0 |
Source: OHID, based on Office for National Statistics data
In Hull, the increase in COPD mortality rate prior to the pandemic was greater for women compared to men. The mortality rate increased by 55% from 68 to 105 deaths per 100,000 population between 2001-03 and 2017-19 (although the increase from 2002-04 was greater). The decrease from 2017-19 to the low of 71 deaths per 100,000 population in 2020-22 was very substantial, although there has been a sharp increase in the last two years, the mortality rate in 2022-24 is 20% lower than it was in 2017-19.
The pattern of change in Hull is very different from that of the region and England for women, where the increase in the mortality rate has been much smaller between 2001-03 to 2017-19 followed by much smaller decreases due to the pandemic and much smaller increases in the last two years.
Among women, there were 295 deaths to Hull residents from COPD that were registered during the three year period 2022 to 2024.
Compared with benchmark
Mortality rate from chronic obstructive pulmonary disease, all ages (Female All ages)
|
Period
|
Kingston upon Hull |
Yorkshire and the Humber region (statistical)
|
England
|
||||
|---|---|---|---|---|---|---|---|
|
Count
|
Value
|
95%
Lower CI |
95%
Upper CI |
||||
| 2001 - 03 | • | 232 | 67.7 | 59.2 | 77.0 | 53.1 | 43.9 |
| 2002 - 04 | • | 211 | 61.5 | 53.4 | 70.4 | 52.6 | 43.9 |
| 2003 - 05 | • | 224 | 66.5 | 58.0 | 75.8 | 52.8 | 44.0 |
| 2004 - 06 | • | 231 | 68.3 | 59.7 | 77.8 | 49.6 | 42.6 |
| 2005 - 07 | • | 260 | 77.6 | 68.4 | 87.7 | 52.0 | 43.0 |
| 2006 - 08 | • | 256 | 76.5 | 67.4 | 86.6 | 52.9 | 43.2 |
| 2007 - 09 | • | 259 | 78.1 | 68.8 | 88.3 | 54.3 | 42.7 |
| 2008 - 10 | • | 246 | 73.8 | 64.7 | 83.7 | 52.7 | 42.3 |
| 2009 - 11 | • | 272 | 81.7 | 72.2 | 92.2 | 52.3 | 41.7 |
| 2010 - 12 | • | 271 | 82.1 | 72.5 | 92.6 | 53.1 | 43.0 |
| 2011 - 13 | • | 291 | 87.6 | 77.7 | 98.4 | 55.7 | 44.7 |
| 2012 - 14 | • | 307 | 93.1 | 82.8 | 104.2 | 57.0 | 45.3 |
| 2013 - 15 | • | 314 | 94.5 | 84.2 | 105.6 | 58.0 | 46.6 |
| 2014 - 16 | • | 317 | 95.2 | 84.9 | 106.4 | 57.2 | 46.5 |
| 2015 - 17 | • | 321 | 96.0 | 85.7 | 107.2 | 56.7 | 47.1 |
| 2016 - 18 | • | 347 | 103.2 | 92.6 | 114.8 | 57.0 | 46.4 |
| 2017 - 19 | • | 352 | 104.6 | 93.9 | 116.2 | 56.6 | 45.7 |
| 2018 - 20 | • | 315 | 92.6 | 82.6 | 103.4 | 52.3 | 42.5 |
| 2019 - 21 | • | 253 | 73.7 | 64.9 | 83.4 | 46.6 | 38.5 |
| 2020 - 22 | • | 247 | 70.7 | 62.1 | 80.1 | 43.5 | 37.0 |
| 2021 - 23 | • | 256 | 72.6 | 64.0 | 82.1 | 45.8 | 38.5 |
| 2022 - 24 | • | 295 | 83.6 | 74.3 | 93.8 | 47.7 | 40.1 |
Source: OHID, based on Office for National Statistics data
COPD Mortality Rates Across Wards and Area Committee Areas in Hull
All age COPD mortality rates vary widely between wards in Hull.
For deaths from COPD registered during 2022-25, the directly standardised mortality rates per 100,000 persons (standardised to the European Standard Population) ranged between 33 and 136 deaths per 100,000 population across the wards. The age-standardised mortality rate for 2022-25 was more than four times higher in North Carr ward than in Holderness ward.
Age-standardised COPD mortality rates are associated with deprivation, with rates highest in the most deprived wards and lowest in the least deprived wards. The mortality rates for North Carr, Marfleet, Orchard Park, St Andrew’s & Docklands and Longhill & Bilton Grange were each statistically higher than the Hull average of 86 per 100,000 population, while rates in Holderness, Boothferry and Beverley & Newland were significantly lower than the Hull average.
There were fewer than 10 premature deaths from cardiovascular diseases in Bricknell and Kingswood wards, so it is not possible to produce statistically robust mortality rates for these wards.
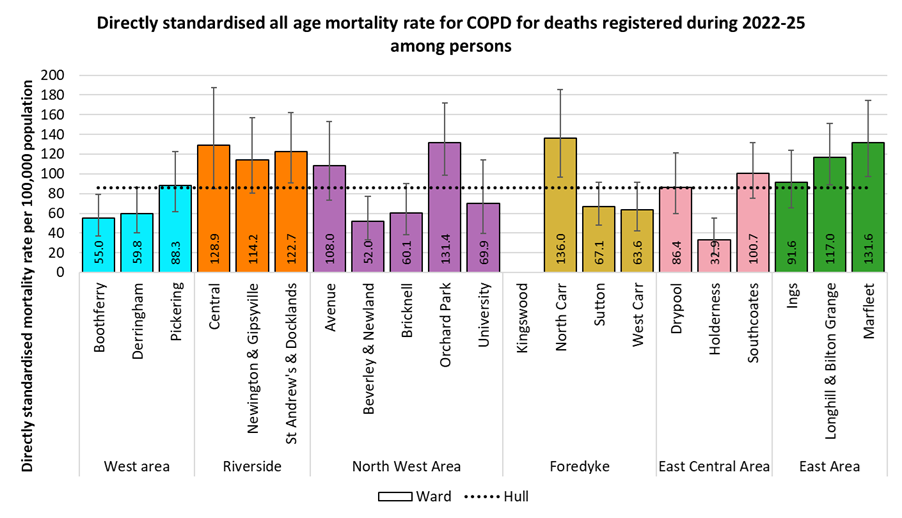
While differences between Area Committee Areas were smaller than by wards, rates in the Riverside were 1.8 times higher than rates in West. COPD mortality rates were statistically significantly higher in Riverside and East than the Hull average, and significantly lower in West.
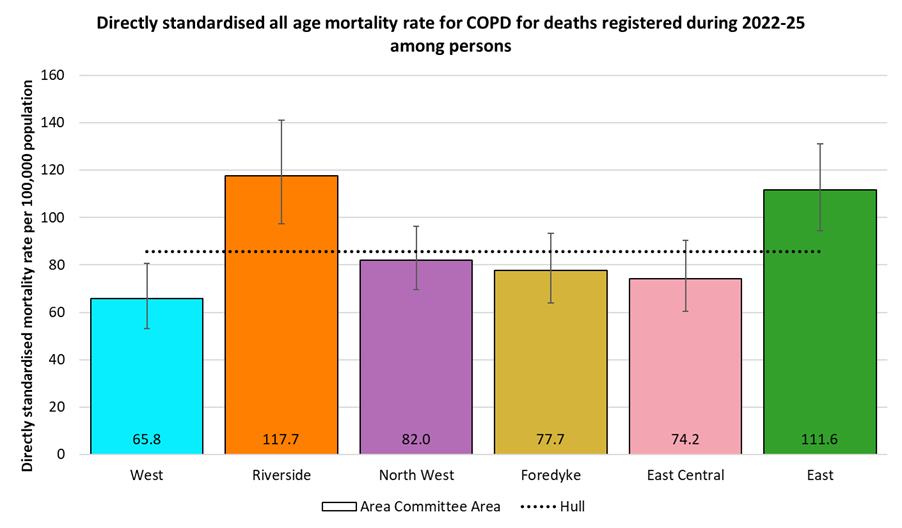
The differences in age-standardised COPD mortality rates between wards were slightly smaller among males, with rates 3.5 times higher for Newington & Gipsyville (174 per 100,000 population) than for West Carr (50 per 100,000 population). The rate for Newington & Gipsyville was statistically significantly higher than the Hull average of 90 per 100,000 population, while the rates for West Carr and Boothferry were significantly lower.
There were fewer than 10 deaths from COPD in Holderness and Kingswood wards, so mortality rates were not produced for these wards.
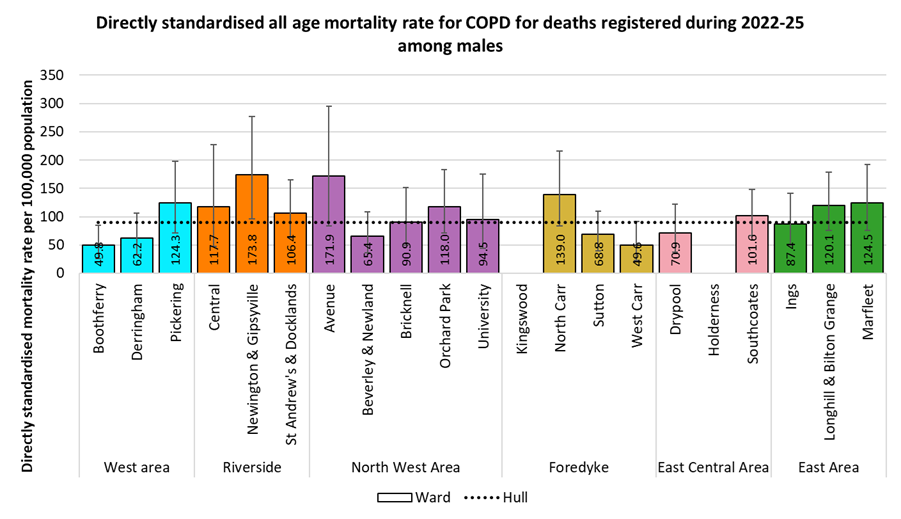
Among males, there were again smaller differences between Area Committee areas than between wards. COPD mortality rates ranged between 70 per 100,000 population in West to 120 per 100,000 population in Riverside, so 71% higher in Riverside than in West.
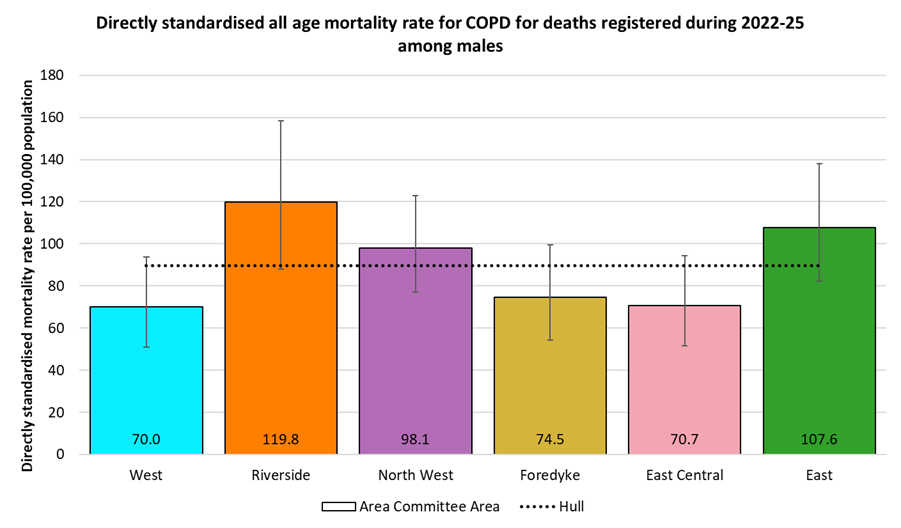
The differences in age-standardised COPD mortality rates between wards were larger among females than among among males, with rates 4.1 times higher for Central ward (155 per 100,000 population) than for Beverley & Newland ward (38 per 100,000 population). The rates for Central, St Andrew’s & Docklands, Orchard Park and Marfleet were each statistically significantly higher than the Hull average of 83 per 100,000 population, while the rate for Beverley & Newland was significantly lower.
There were fewer than 10 deaths from COPD in Bricknell, Holderness, Kingswood and University wards, so mortality rates were not produced for these wards.
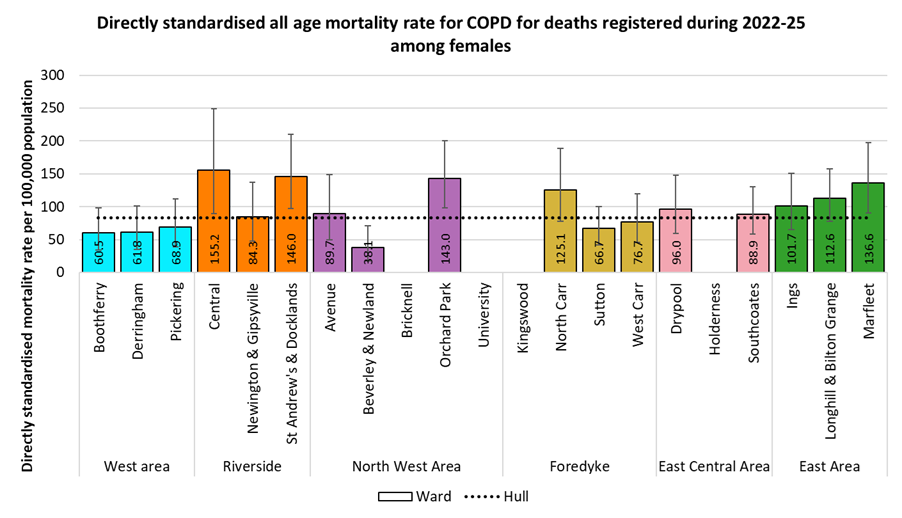
Despite differences in female COPD mortality rates being smaller between area Committee Areas than between wards, the rates for Riverside and East were both statistically significantly higher than the Hull average, 1.9 and 1.8 times higher respectively than the rate for West.
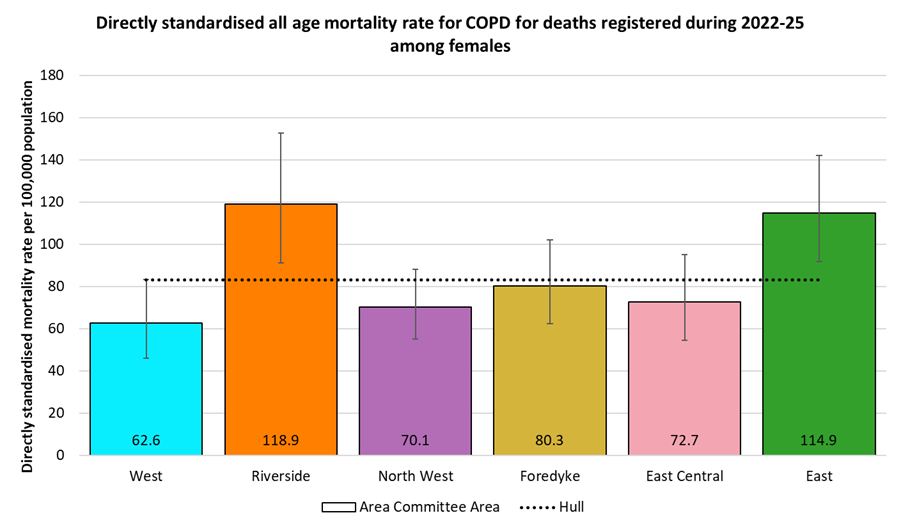
COPD Mortality Rates by Local Deprivation Fifths
As noted earlier, there is a strong association between COPD mortality and deprivation.
For deaths registered during 2022-25, the directly age-standardised COPD mortality rates per 100,000 population (standardised to the European Standard Population) ranged from 46 deaths per 100,000 population living in the least deprived fifth of areas of Hull to 139 deaths per 100,000 population living in the most deprived fifth of areas of the city. The mortality rate in the most deprived fifth of areas was three times higher than in the least deprived fifth of areas.
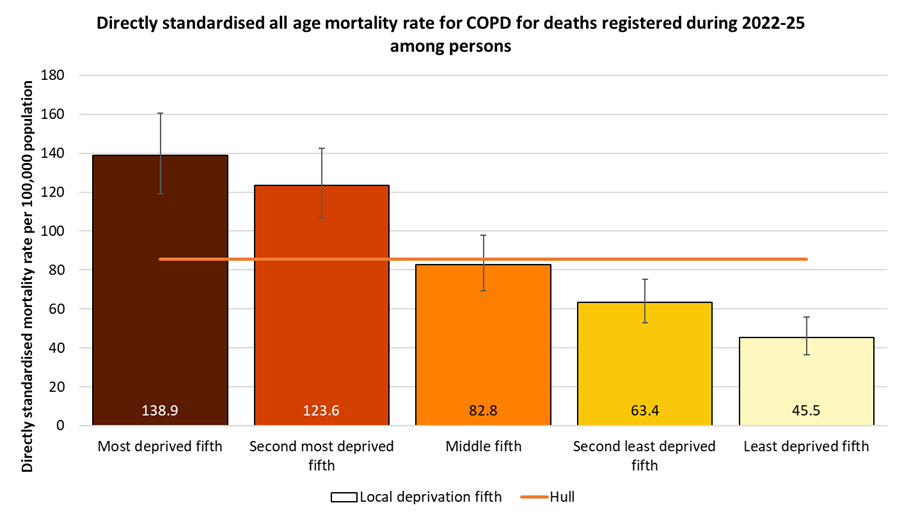
A similar pattern by deprivation fifths occurs among men, although a slightly higher rate among men living in the second deprived fifth of areas of Hull than in men living ion the most deprived fifth of areas. The COPD mortality rate ranges from 55 deaths per 100,000 men living in the least deprived fifth of areas of Hull to 129 and 132 deaths per 100,000 men living in the most deprived and second most deprived fifths of areas of the city, so around 2.4 times higher among men in the most deprived parts of the city compared to those in the least deprived parts.
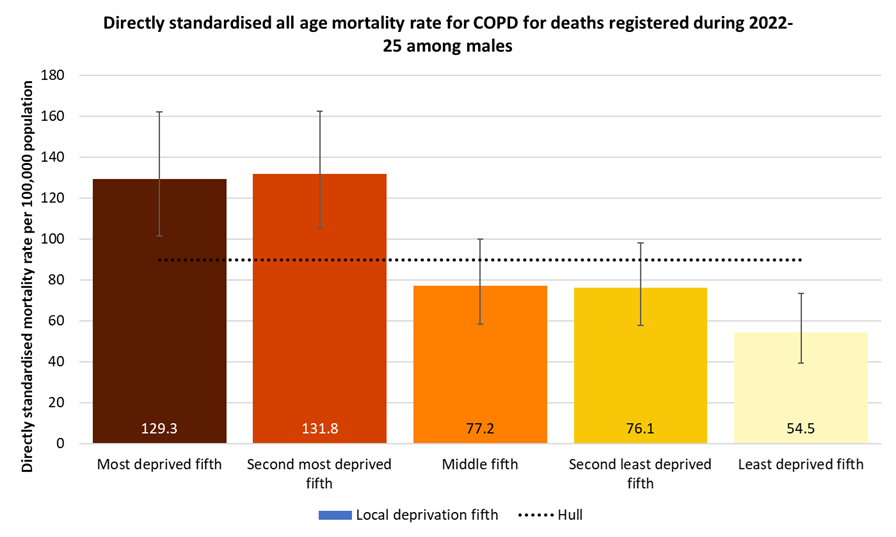
A similar pattern by deprivation is seen among women, although the differences in mortality rates between deprivation fifths were larger among women than among men. The COPD mortality rate ranges from 41 deaths per 100,000 women living in the least deprived fifth of areas of Hull to 148 deaths per 100,000 women living in the most deprived fifth of areas of the city, so 3.7 times higher among women in the most deprived fifth of the city compared to those in the least deprived fifths.
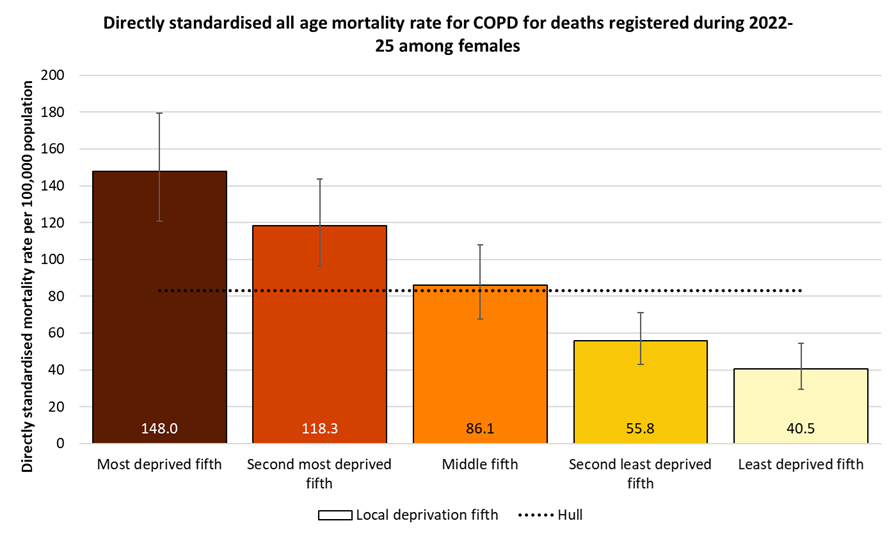
Location of Deaths from COPD
Over three year period 2022-24, the percentage of deaths from COPD that occurred in care homes, in hospital and at home in Hull (03F) was reasonably similar to England, although slightly fewer deaths occurred at home (26.1% versus 29.5%) and in care homes (10.8% versus 11.3%), and slightly more in hospital (59.5% versus 56.3%).
Compared with benchmark
| Indicator | Period | England | NHS Humber and North Yorkshire Integrated Care Board - QOQ | Humber and North Yorkshire ICB - 02Y | Humber and North Yorkshire ICB - 03F | Humber and North Yorkshire ICB - 03H | Humber and North Yorkshire ICB - 03K | Humber and North Yorkshire ICB - 03Q | Humber and North Yorkshire ICB - 42D |
|---|---|---|---|---|---|---|---|---|---|
Percentage of COPD deaths that occur in care homes (Persons All ages) | 2022 - 24 | 11.3 | 12.9 | 12.7 | 10.8 | 11.4 | 14.9 | 11.7 | 14.7 |
Percentage of COPD deaths that occur in hospital (Persons All ages) | 2022 - 24 | 56.3 | 56.3 | 54.9 | 59.5 | 55.7 | 53.7 | 55.8 | 55.0 |
Percentage of COPD deaths that occur at home (Persons All ages) | 2022 - 24 | 29.5 | 27.6 | 30.4 | 26.1 | 27.1 | 23.9 | 29.9 | 27.5 |
Pneumonia
Hospital Admissions
Compared to England, the directly age standardised emergency hospital admission rates for pneumonia were 42% higher in Hull (03F) for 2024/25 (rates given as admissions per 100,000 population standardised to the European Standard Population). This was the highest rate in the Humber and North Yorkshire Integrated Care Board area.
Compared with benchmark
| Indicator | Period | England | NHS Humber and North Yorkshire Integrated Care Board - QOQ | Humber and North Yorkshire ICB - 02Y | Humber and North Yorkshire ICB - 03F | Humber and North Yorkshire ICB - 03H | Humber and North Yorkshire ICB - 03K | Humber and North Yorkshire ICB - 03Q | Humber and North Yorkshire ICB - 42D |
|---|---|---|---|---|---|---|---|---|---|
Emergency hospital admissions for pneumonia (Persons All ages) | 2024/25 | 426.6 | 503.8 | 448.5 | 609.5 | 547.6 | 458.3 | 509.6 | 501.8 |
The emergency hospital admission rate for pneumonia increased sharply – almost doubling – in Hull between 2013/14 and 2019/20 from 332 to 625 admissions per 100,000 population. There was a large increase between 2013/14 and 2016/17 with a smaller increase from 2016/17 onwards. In 2013/14, the admission rate in Hull had been statistically significantly lower than England, but in the 2019/20, the rate in Hull was statistically significantly higher than England, and has remained so since.
However, there was a very sharp decrease – almost halving – in the emergency admissions to hospital for pneumonia between 2019/20 and 2020/21 in Hull due to the COVID-19 pandemic. A common cause of pneumonia is an infection from influenza, and due to increased social isolation (both enforced during period of lockdown and by personal choice particularly among those most at risk of morbidity and mortality from COVID-19), the influenza virus could not circulate as much as it could in a usual year. So one might anticipate fewer admissions from pneumonia, however, there were fewer admissions overall for many diseases and medical conditions during 2020/21. Whilst COVID-19 can cause pneumonia, it is possible that the primary diagnosis of the admission is COVID so these admissions are not included within 855 admissions in 2020/21. A relatively high percentage of people who died of COVID-19 had pneumonia mentioned on their death certificate (see Causes of Death under Population for more information) so it is possible that some people were admitted to hospital in 2020/21 who had pneumonia, but had COVID-19 as their primary cause of the admission.
The number of admissions increased in each of 2021/22, 2022/23, 2023/24 and 2024/25, but the admission rate in 2024/25 is still 2.4% lower than it was in 2019/20 prior to the pandemic.
There were 1,585 emergency admissions to hospital for pneumonia during 2024/25.
Compared with benchmark
Emergency hospital admissions for pneumonia (Persons All ages)
|
Period
|
Humber and North Yorkshire ICB - 03F |
NHS Humber and North Yorkshire Integrated Care Board - QOQ
|
England
|
||||
|---|---|---|---|---|---|---|---|
|
Count
|
Value
|
95%
Lower CI |
95%
Upper CI |
||||
| 2013/14 | • | 790 | 331.6 | 306.7 | 357.8 | 309.5 | 361.9 |
| 2014/15 | • | 970 | 409.3 | 381.7 | 438.2 | 404.4 | 427.7 |
| 2015/16 | • | 1215 | 516.4 | 483.9 | 550.3 | 433.1 | 447.5 |
| 2016/17 | • | 1385 | 584.8 | 549.7 | 621.4 | 465.3 | 491.0 |
| 2017/18 | • | 1430 | 596.6 | 561.1 | 633.5 | 467.3 | 462.0 |
| 2018/19 | • | 1490 | 617.6 | 582.0 | 654.5 | 457.9 | 468.9 |
| 2019/20 | • | 1515 | 624.6 | 588.7 | 661.9 | 495.7 | 489.7 |
| 2020/21 | • | 855 | 349.0 | 322.7 | 376.8 | 262.2 | 241.7 |
| 2021/22 | • | 955 | 387.7 | 360.7 | 416.1 | 334.1 | 319.5 |
| 2022/23 | • | 1135 | 446.8 | 417.8 | 477.1 | 396.1 | 369.5 |
| 2023/24 | • | 1485 | 577.0 | 543.8 | 611.5 | 481.7 | 430.2 |
| 2024/25 | • | 1585 | 609.5 | 574.0 | 646.3 | 503.8 | 426.6 |
Source: OHID, based on NHS England data
Projected Numbers With Bronchitis and Emphysema
The Projecting Older People Population Information System (POPPI) gives modelled estimates of the number of people in Hull aged 65+ years predicted to have bronchitis and emphysema.
They use estimates for the estimated prevalence from different surveys and research which have generally been derived at a national level (generally different prevalence estimates for different age groups for men and women separately). They then apply these prevalence figures to Hull’s population. For instance, if the prevalence among males in England in a specific age group is 5% and there are an estimated 500 men living in Hull in that age groups, they would estimate there were 25 men in that age group living in Hull with that condition. For many conditions, there is an increased prevalence in populations with higher levels of deprivation, and in most cases, deprivation is not taken into consideration. Thus in many cases, these estimates for Hull are likely to underestimate the numbers in Hull due to the high levels of deprivation in Hull. In this particular model other factors are also not considered such as the prevalence of smoking.
Further definitions are available from www.poppi.org.uk.
It is estimated that around 740 people in Hull have bronchitis and emphysema in 2025, but that this will increase by one fifth to around 880 by 2045. The increases are due to the population changes anticipated for Hull between 2025 and 2045 as the estimates are made by applying age-specific prevalence estimates to Hull’s population structure. Given that hospital admissions and mortality rates in Hull are around twice those of England, it is possible that the estimated number of people in Hull with bronchitis and emphysema should be around twice the figures below. Nevertheless, the estimates below will give some indication of the increase in numbers for Hull due to population changes alone.
| Gender | Age | 2025 | 2030 | 2035 | 2040 | 2045 |
| Males | 65-74 | 286 | 310 | 319 | 302 | 281 |
| Males | 75+ | 179 | 200 | 218 | 244 | 260 |
| Males | 65+ | 465 | 510 | 537 | 546 | 541 |
| Females | 65-74 | 122 | 136 | 140 | 132 | 122 |
| Females | 75+ | 153 | 164 | 181 | 204 | 217 |
| Females | 65+ | 275 | 300 | 321 | 336 | 339 |
| Persons | 65-74 | 408 | 446 | 459 | 434 | 403 |
| Persons | 75+ | 331 | 363 | 399 | 448 | 477 |
| Persons | 65+ | 739 | 809 | 858 | 882 | 880 |
Strategic Need and Service Provision
All Respiratory Disease
People should be aware that smoking can cause respiratory conditions such as COPD and make other respiratory conditions such as asthma worse. People should also be aware that stopping smoking has immediate health effects within lung function improving within a year. Not smoking should be seen as the norm, with the aim of creating a smoke free generation.
It is necessary to work together to ensure people understand the benefit of positive life choices and know how to access information and seek early support to change. In order to do this effectively, health care providers need to work together with different communities to use existing assets to realise the benefit of positive life changes, and treating people as individuals.
People should attend their annual reviews (generally within primary care) for asthma and COPD so that they get the best on-going treatment for their condition.
Asthma
Asthma prevalence can be reduced over the long-term by reducing air pollution and cigarette smoking, and by increasing breastfeeding rates. In order to treat effectively, diagnoses need to be made in primary care. Asthma symptoms can be better controlled by having an asthma review once a year. Self-management of symptoms can be improved by the use of asthma action plans and better education, which have been shown to reduce admissions by more than half. The 2012 National Paediatric Asthma Audit demonstrated that only 45% of children admitted were given an action plan at discharge and 43% of children didn’t have their inhaler technique checked before discharge. For the 2012 National Adult Asthma Audit, 20% of newly-diagnosed asthmatics and 30% of known asthmatics were not commenced on inhaled corticosteroid therapy at discharge. Nine percent of patients were non-adherent to their asthma treatment. Just under half (49%) had their inhaler technique reviewed, but 26% of patients were found to have poor technique. A clinic review appointment was scheduled in 67% of patients within four weeks of discharge, and 43% had a written record of advice to see their GP within a week of discharge.
Chronic Obstructive Pulmonary Disease
Although the damage that has already occurred to the lungs cannot be reversed, the progression of COPD can be slowed, and stopping smoking is particularly effective at doing this. Symptoms can be relieved with medication such as using an inhaler to make breathing easier, and pulmonary rehabilitation may also help. As COPD cannot be cured, prevention is very important. Not smoking should be seen as the norm, with the aim of creating a smoke free generation.
As mentioned above, knowledge, changing lifestyle behaviours and attending annual reviews once diagnosed are very important in preventing and reducing the impact of COPD.
Resources
The Office for Health Improvement & Disparities’ Fingertips: https://fingertips.phe.org.uk/
NHS Digital. Quality and Outcomes Framework. https://qof.digital.nhs.uk/
Asthma. www.nhs.uk. 2014, NHS: London.
NHS Right Care, The NHS Atlas of Variation in Healthcare for Respiratory Disease. https://www.england.nhs.uk/rightcare 2012, NHS Right Care: London.
Chronic obstructive pulmonary disease. www.nhs.uk. 2014, NHS: London.
Action on Smoking and Health, Factsheet 02: Smoking Statistics: Illness and death. www.ash.org.uk. 2015, Action on Smoking and Health: London.
Newton, J.N., et al., Changes in health in England, with analysis by English regions and areas of deprivation, 1990-2013: a systematic analysis for the Global Burden of Disease Study 2013. The Lancet, 2015. 386(10010): p. 2257-2274.
American Cancer Society, When smokers quit – what are the benefits over time? www.cancer.org. 2014, American Cancer Society: Atlanta.
Surgeon General of the US Public Health Service, The health consequences of smoking – nicotine addition: a report of the Surgeon General. US Department of Health and Human Services: Rockville, 1988.
Paton, J., British Thoracic Society Paediatric Asthma Audit 2012. www.brit-thoracic.org.uk. 2013, British Thoracic Society: London.
Lindsay, J. and L. Heaney, British Thoracic Society Adult Asthma Audit 2012. www.brit-thoracic.org.uk. 2013, British Thoracic Society: London.
Office for National Statistics. Excess winter mortality in England and Wales: 2017 to 2018 (provisional) and 2016 to 2017 (final). Office for National Statistics, 2018.
Updates
This page was last updated / checked on 1 June 2026.
This page is due to be updated / checked in December 2026.