Index
This topic area covers statistics and information relating to births and infant health in Hull including local strategic need and service provision. Further information is also available within Pregnancy and Maternal Health, Breastfeeding, Smoking in Pregnancy, and Stillbirths and Infant Mortality within Pregnancy and Births within Children and Young People. Information on Under 18 Conceptions is given under Health Factors within Children and Young People. Information on Sexual and Reproductive Health is given under Health Factors within Adults. Information is also available on A&E attendances and hospital admissions within A&E Attendances and Hospital Admissions under Health Factors under Children and Young People.
This page contains information from the Office for Health Improvement & Disparities’ Fingertips. Information is taken ‘live’ from the site so uses the latest available data from Fingertips and displays it on this page. As a result, some comments on this page may relate to an earlier period of time until this page is next updated (see review dates at the end of this page).
Summary Infographic
Headlines
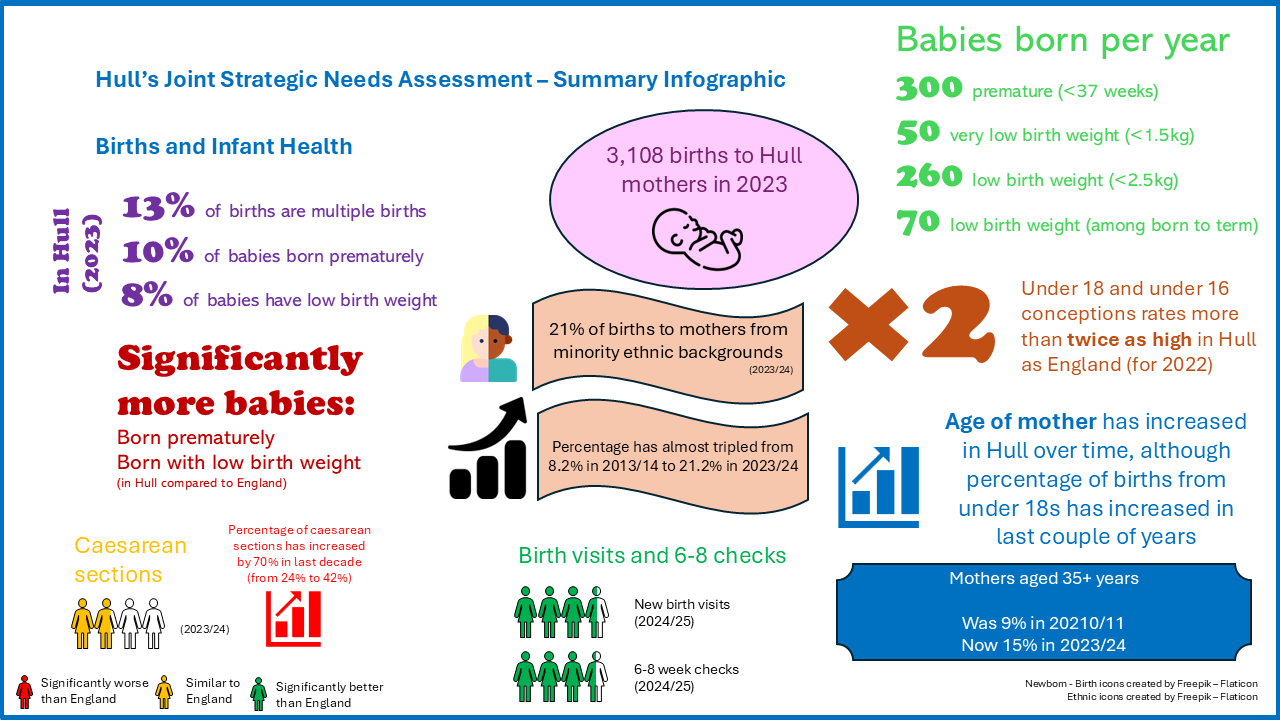
- There were 3,108 live births to Hull residents in 2023. The number of births in Hull has been decreasing over the last decade (from a peak of 3,871 in 2012).
- Over one in five deliveries in 2023/24 were to mothers from minority ethnic backgrounds in Hull (21.2%) which was considerably lower than England (27.9%), but a considerable increase in Hull since 2013/14 when it was 8.2%.
- The percentage of caesarean section births has increased over time in both Hull and England from around one in four births in 2014/15 to more than four in ten births in 2023/24. However, over most of the period, the percentage in Hull has been lower than that of England, although higher in Hull compared to the region and higher in Hull compared to England in the most recent year 2023/24.
- The age profile of women giving birth in Hull is younger than England with the under 18 conception rate more than twice as high in Hull as England (29.9 versus 13.9 per 1,000 women aged 15-17 years for 2022), and the percentage of deliveries to women aged 35+ years in Hull considerably lower than England (15.0% versus 24.7% in 2023/24). However, the age profile of mothers has changed significantly over the last 20-25 years both within Hull and across England with a higher percentage of births to older mothers.
- Overall, 13.6% of births were multiple births in Hull in 2023 which is lower than England (14.5%). The rate of premature births (less than 37 weeks gestation) in Hull has been gradually increasing since 2013-15 and for 2020-22 is statistically significantly higher than England (95.8 versus 77.0 per 1,000 live births and stillbirths with 24+ weeks gestation). The percentage of all babies (live births and stillbirths) born with a low birth weight (under 2,500 grams) or very low birth weight (under 1,500 grams) is higher in Hull compared to England, possibly because the rate of premature births was higher in Hull. However, among babies born to term (37+ weeks gestation), the percentage of low birth weight babies was slightly lower in Hull compared to England for the latest year 2024 (2.4% versus 3.0%).
- During 2024/25, virtually all babies in Hull had their newborn hearing test (99%). The percentage has been consistently higher than England. Overall, 27 infants (out of 2,992) in Hull did not have their hearing screening in 2023/24.
- In 2024/25, 88% of infants had a new birth visit within the first 14 days in Hull which is statistically significantly higher than England (85%). In total, around 366 new birth visits (out of 3,000) did not occur within the first 14 days. In 2024/25, 88% of infants received their 6-8 week review in Hull and this was also statistically significantly higher than England (85%). Approximately 381 infants (out of 3,047) did not receive their 6-8 week review. These reviews are a very good opportunity to pick up any problems with not just the infant, but the mother (and father) too.
The Population Affected – Why Is It Important?
Good antenatal care and support can identify potential problems early, and provide information to aid informed choice. Poor care during the birth can increase the risks to both mother and baby. Good maternity services should respond to the physical, psychological, emotional and social needs of women and their family in a structured and systematic way.
Infant mortality rates are higher among babies that are sole registered than for other registration types.
There is a higher risk of adverse events in pregnancy and during the birth for women who are teenagers, who are older, who smoke, who are overweight and who have other risk factors such as diabetes. The proportion of births to older women and women who are overweight has increased giving rise to an increase in the likelihood of adverse events. This, together with the higher number of births overall, has placed additional pressure on already stretched maternity services nationally.
There are a number of screening programmes in place in the UK relating to antenatal and newborn. Tests in pregnancy and in the newborn after birth are designed to help make the pregnancy safer, check and assess the development and wellbeing of the women and her baby, and screen for particular conditions. Digitalisation of these screening tests is improving access to the results for all people involved in the care process.
Uptake rates for screening of pregnant women is available for England and for each region and not available at local authority level. Uptake rates are also not available at local authority level for the physical examination of infants after birth or the infant ‘blood spot’ screening, although information is available for the infant hearing test.
The Hull Picture
Fertility Rate and Number of Births
Information relating to taking folic acid supplements and obesity and smoking in early pregnancy are given under Pregnancy and Maternal Health within Pregnancy and Infants within Children and Young People.
The general fertility rate is the number of live births occurring to females aged 11+ years per 1,000 female population aged 15-44 years. The fertility rate in Hull is higher than England for 2023 with 54.8 births for Hull compared to 49.4 births per 1,000 women aged 15-44 years for England.
Compared with benchmark
| Indicator | Period | England | Yorkshire and the Humber region (statistical) | Kingston upon Hull | East Riding of Yorkshire | North East Lincolnshire | North Lincolnshire | York | North Yorkshire UA | Barnsley | Doncaster | Rotherham | Sheffield | Bradford | Calderdale | Kirklees | Leeds | Wakefield |
|---|---|---|---|---|---|---|---|---|---|---|---|---|---|---|---|---|---|---|
General fertility rate (Female 15-44 yrs) | 2023 | 49.4 | 49.7 | 54.8 | 48.5 | 51.5 | 52.6 | 31.0 | 49.4 | 53.3 | 56.3 | 54.2 | 44.9 | 59.6 | 52.1 | 50.8 | 44.1 | 51.3 |
In Hull, there were almost 3,900 births in 2012, but this has been gradually reducing and there were 3,108 births in 2029. Reductions in the general fertility rate have also occurred in England and across the region over the same time period.
Compared with benchmark
General fertility rate (Female 15-44 yrs)
|
Period
|
Kingston upon Hull |
Yorkshire and the Humber region (statistical)
|
England
|
||||
|---|---|---|---|---|---|---|---|
|
Count
|
Value
|
95%
Lower CI |
95%
Upper CI |
||||
| 2010 | • | 3752 | 67.3 | 65.1 | 69.4 | 63.5 | 64.1 |
| 2011 | • | 3796 | 68.7 | 66.5 | 70.9 | 63.1 | 64.2 |
| 2012 | • | 3871 | 69.9 | 67.7 | 72.2 | 64.2 | 64.7 |
| 2013 | • | 3697 | 67.1 | 65.0 | 69.3 | 61.8 | 61.8 |
| 2014 | • | 3537 | 64.3 | 62.2 | 66.5 | 61.6 | 61.5 |
| 2015 | • | 3579 | 65.2 | 63.0 | 67.3 | 61.7 | 61.6 |
| 2016 | • | 3550 | 64.1 | 62.0 | 66.2 | 61.8 | 61.2 |
| 2017 | • | 3430 | 61.6 | 59.6 | 63.7 | 60.3 | 59.7 |
| 2018 | • | 3300 | 59.5 | 57.5 | 61.5 | 58.3 | 57.6 |
| 2019 | • | 3175 | 57.4 | 55.4 | 59.4 | 56.4 | 55.9 |
| 2020 | • | 3123 | 56.8 | 54.8 | 58.8 | 53.9 | 53.5 |
| 2021 | • | 3079 | 56.2 | 54.3 | 58.3 | 54.1 | 54.2 |
| 2022 | • | 3109 | 56.3 | 54.3 | 58.3 | 52.0 | 51.7 |
| 2023 | • | 3108 | 54.8 | 52.9 | 56.8 | 49.7 | 49.4 |
Source: OHID, based on Office for National Statistics data
Deliveries to Mothers From Minority Ethnic Backgrounds
For 2023/24, Hull has a relatively low percentage of deliveries to mothers from minority ethnic backgrounds compared to England, but the percentage in Hull is considerably higher than some local authorities within the Humber area (East Riding of Yorkshire, North Lincolnshire and North East Lincolnshire), but lower than Sheffield, Leeds and the local authorities to the west of Leeds namely Bradford, Calderdale and Kirklees.
Compared with benchmark
| Indicator | Period | England | Yorkshire and the Humber region (statistical) | Kingston upon Hull | East Riding of Yorkshire | North East Lincolnshire | North Lincolnshire | York | North Yorkshire UA | Barnsley | Doncaster | Rotherham | Sheffield | Bradford | Calderdale | Kirklees | Leeds | Wakefield |
|---|---|---|---|---|---|---|---|---|---|---|---|---|---|---|---|---|---|---|
Deliveries to women from ethnic minority groups (Female All ages) | 2024/25 | 31.1 | 29.4 | 24.9 | 5.9 | 9.1 | 11.6 | 13.5 | 7.3 | 9.1 | 16.1 | 17.9 | 41.3 | 61.1 | 27.7 | 45.4 | 36.1 | 17.3 |
The percentage of deliveries to mothers from minority ethnic backgrounds has been gradually increasing in Hull from 8.2% for 2013/14 to 11.5% for 2020/21, but the increase in the last three years has been greater increasing to 21.2% for 2023/24. The difference between the percentage in Hull compared to England has decreased over this time period.
Compared with benchmark
Deliveries to women from ethnic minority groups (Female All ages)
|
Period
|
Kingston upon Hull |
Yorkshire and the Humber region (statistical)
|
England
|
||||
|---|---|---|---|---|---|---|---|
|
Count
|
Value
|
95%
Lower CI |
95%
Upper CI |
||||
| 2013/14 | • | 280 | 8.2% | 7.3% | 9.1% | 18.4% | 20.7% |
| 2014/15 | • | 295 | 8.9% | 8.0% | 9.9% | 19.1% | 20.4% |
| 2015/16 | • | 295 | 8.6% | 7.7% | 9.6% | 18.9% | 20.0% |
| 2016/17 | • | 310 | 9.1% | 8.1% | 10.0% | 19.3% | 20.0% |
| 2017/18 | • | 335 | 10.2% | 9.2% | 11.2% | 18.2% | 20.0% |
| 2018/19 | • | 315 | 9.9% | 8.9% | 10.9% | 18.3% | 20.3% |
| 2019/20 | • | 370 | 11.9% | 10.9% | 13.1% | 18.8% | 20.5% |
| 2020/21 | • | 345 | 11.5% | 10.4% | 12.7% | 19.3% | 21.6% |
| 2021/22 | • | 425 | 13.8% | 12.7% | 15.2% | 21.6% | 22.9% |
| 2022/23 | • | 550 | 18.5% | 17.1% | 19.9% | 24.1% | 25.3% |
| 2023/24 | • | 650 | 21.2% | 19.8% | 22.7% | 27.2% | 27.9% |
| 2024/25 | • | 720 | 24.9% | 23.3% | 26.4% | 29.4% | 31.1% |
Source: NHS England
Caesarean Sections
The percentage of caesarean sections in Hull is slightly higher than England for 2023/24, although the absolute difference in the percentages is relatively small (41.7% versus 40.9%).
Compared with benchmark
| Indicator | Period | England | Yorkshire and the Humber region (statistical) | Kingston upon Hull | East Riding of Yorkshire | North East Lincolnshire | North Lincolnshire | York | North Yorkshire UA | Barnsley | Doncaster | Rotherham | Sheffield | Bradford | Calderdale | Kirklees | Leeds | Wakefield |
|---|---|---|---|---|---|---|---|---|---|---|---|---|---|---|---|---|---|---|
Deliveries by caesarean section (Female All ages) | 2024/25 | 43.4 | 41.1 | 47.2 | 42.7 | 35.8 | 39.6 | 31.4 | 37.2 | 45.8 | 49.0 | 42.9 | 45.6 | 37.1 | 37.6 | 42.2 | 37.6 | 45.4 |
The percentage of caesarean section births has increased over time in both Hull and England from around one in four births in 2014/15 to around four in ten births in 2023/24.
The percentage in Hull has generally been lower than England with Hull having a higher percentage compared to England for only 2018/19 and the most recent year 2023/24.
Compared with benchmark
Deliveries by caesarean section (Female All ages)
|
Period
|
Kingston upon Hull |
Yorkshire and the Humber region (statistical)
|
England
|
||||
|---|---|---|---|---|---|---|---|
|
Count
|
Value
|
95%
Lower CI |
95%
Upper CI |
||||
| 2013/14 | • | 825 | 24.0% | 22.7% | 25.5% | 23.0% | 25.4% |
| 2014/15 | • | 810 | 24.4% | 23.0% | 25.9% | 23.3% | 25.8% |
| 2015/16 | • | 895 | 26.1% | 24.7% | 27.6% | 24.0% | 26.3% |
| 2016/17 | • | 950 | 27.9% | 26.4% | 29.4% | 25.0% | 27.1% |
| 2017/18 | • | 865 | 26.3% | 24.8% | 27.8% | 25.4% | 27.9% |
| 2018/19 | • | 885 | 27.7% | 26.3% | 29.4% | 26.7% | 29.2% |
| 2019/20 | • | 910 | 29.3% | 27.7% | 30.9% | 27.6% | 30.1% |
| 2020/21 | • | 970 | 32.3% | 30.7% | 34.0% | 29.5% | 32.5% |
| 2021/22 | • | 995 | 32.4% | 30.7% | 34.0% | 31.7% | 34.7% |
| 2022/23 | • | 1065 | 35.9% | 34.2% | 37.7% | 34.9% | 37.8% |
| 2023/24 | • | 1280 | 41.7% | 40.0% | 43.4% | 38.1% | 40.9% |
| 2024/25 | • | 1365 | 47.2% | 45.3% | 48.9% | 41.1% | 43.4% |
Source: NHS England
Age of Mothers
The information below gives the rate of under 18 conceptions per 1,000 women aged 15-17 years, the rate of under 16 conceptions per 1,000 women aged 13-15 years, the percentage of teenage mothers out of all deliveries, and the percentage of mothers aged 35+ years out of all deliveries.
There are more births among under 18s in Hull and fewer among women aged 35+ years in Hull compared to England. The rates of under 18 conceptions and under 16 conceptions are both more than twice as high as England, but the percentage of births to mothers aged 35+ years in Hull in 2023/24 was 39% lower than for England.
The percentage of births to mothers aged 12-17 years in Hull was three times higher than England for 2023/24 (1.8% versus 0.6%).
Compared with benchmark
| Indicator | Period | England | Yorkshire and the Humber region (statistical) | Kingston upon Hull | East Riding of Yorkshire | North East Lincolnshire | North Lincolnshire | York | North Yorkshire UA | Barnsley | Doncaster | Rotherham | Sheffield | Bradford | Calderdale | Kirklees | Leeds | Wakefield |
|---|---|---|---|---|---|---|---|---|---|---|---|---|---|---|---|---|---|---|
Under 18s conception rate (Female <18 yrs) | 2022 | 13.9 | 17.7 | 29.9 | 12.1 | 24.7 | 19.0 | 13.6 | 11.6 | 20.4 | 22.0 | 19.3 | 17.0 | 16.0 | 15.2 | 12.5 | 20.9 | 20.7 |
Under 16s conception rate (Female <16 yrs) | 2022 | 2.2 | 3.1 | 4.7 | 1.1 | 3.7 | 4.0 | 2.0 | 1.5 | 3.6 | 4.4 | 2.7 | 3.2 | 4.0 | 2.8 | 2.2 | 3.0 | 3.9 |
Deliveries to young women and girls aged 12 to 17 (Female 12-17 yrs) | 2024/25 | 0.5 | 0.8 | 1.4 | 0.6 | 1.1 | 1.8 | 0.7 | 0.6 | 0.9 | 0.7 | 1.2 | 0.9 | 0.4 | 0.5 | 0.5 | 0.6 | 1.2 |
Deliveries to women aged 35 years and above (Female 35+ yrs) | 2024/25 | 25.2 | 20.5 | 15.9 | 20.1 | 16.4 | 17.1 | 27.4 | 23.0 | 16.6 | 16.8 | 17.1 | 23.3 | 20.3 | 19.8 | 20.5 | 24.2 | 17.9 |
There has been a decreasing trend in the under 18 conception rate since 2004 with the rate in Hull decreasing by 65% between 1998 and 2021 from 84.6 to 29.0 under 18 conceptions per 1,000 women aged 15-17 years. The rate in 2019 was at its lowest in Hull at 26.0 conceptions per 1,000 women aged 15-17 years, but the rate has increased over the last two years.
There were 128 conceptions among under 18s during 2021 which is around one-third the number that occurred each year between 1998 and 2008.
More detailed information on Under 18 Conceptions is given under Health Factors within Children and Young People.
Compared with benchmark
Under 18s conception rate (Female <18 yrs)
|
Period
|
Kingston upon Hull |
Yorkshire and the Humber region (statistical)
|
England
|
||||
|---|---|---|---|---|---|---|---|
|
Count
|
Value
|
95%
Lower CI |
95%
Upper CI |
||||
| 1998 | • | 381 | 84.6 | 76.3 | 93.5 | 53.1 | 46.6 |
| 1999 | • | 333 | 71.4 | 63.9 | 79.5 | 51.0 | 44.8 |
| 2000 | • | 350 | 73.2 | 65.7 | 81.3 | 47.9 | 43.6 |
| 2001 | • | 353 | 70.9 | 63.7 | 78.7 | 47.1 | 42.5 |
| 2002 | • | 339 | 66.6 | 59.7 | 74.1 | 47.2 | 42.8 |
| 2003 | • | 365 | 70.7 | 63.6 | 78.3 | 47.1 | 42.1 |
| 2004 | • | 412 | 82.3 | 74.5 | 90.6 | 48.1 | 41.6 |
| 2005 | • | 368 | 73.5 | 66.2 | 81.4 | 48.9 | 41.4 |
| 2006 | • | 359 | 69.3 | 62.3 | 76.9 | 48.0 | 40.6 |
| 2007 | • | 363 | 68.1 | 61.3 | 75.5 | 48.3 | 41.4 |
| 2008 | • | 348 | 66.8 | 60.0 | 74.2 | 47.1 | 39.7 |
| 2009 | • | 316 | 64.5 | 57.6 | 72.0 | 43.5 | 37.1 |
| 2010 | • | 261 | 56.2 | 49.6 | 63.5 | 39.9 | 34.2 |
| 2011 | • | 231 | 50.4 | 44.2 | 57.4 | 33.8 | 30.7 |
| 2012 | • | 176 | 39.4 | 33.8 | 45.6 | 31.7 | 27.8 |
| 2013 | • | 158 | 35.8 | 30.4 | 41.8 | 28.6 | 24.4 |
| 2014 | • | 164 | 39.2 | 33.4 | 45.6 | 26.4 | 22.9 |
| 2015 | • | 150 | 38.2 | 32.3 | 44.8 | 24.4 | 20.9 |
| 2016 | • | 114 | 30.4 | 25.1 | 36.5 | 22.0 | 19.0 |
| 2017 | • | 121 | 32.9 | 27.3 | 39.3 | 20.6 | 17.8 |
| 2018 | • | 111 | 29.7 | 24.4 | 35.7 | 19.5 | 16.6 |
| 2019 | • | 103 | 26.0 | 21.2 | 31.5 | 19.1 | 15.5 |
| 2020 | • | 111 | 26.6 | 21.9 | 32.0 | 16.3 | 12.8 |
| 2021 | • | 128 | 29.0 | 24.2 | 34.5 | 17.1 | 13.1 |
| 2022 | • | 136 | 29.9 | 25.1 | 35.3 | 17.7 | 13.9 |
Source: OHID, based on Office for National Statistics data
The percentage of births to mothers aged 35+ years has been increasing in Hull from 9.2% in 2010/11 to a high of 15.8% for 2022/23, although the percentage has decreased slightly in Hull 2023/24 to 15.0%.
The percentage has been consistently lower in Hull compared to England and the Yorkshire and Humber region.
Compared with benchmark
Deliveries to women aged 35 years and above (Female 35+ yrs)
|
Period
|
Kingston upon Hull |
Yorkshire and the Humber region (statistical)
|
England
|
||||
|---|---|---|---|---|---|---|---|
|
Count
|
Value
|
95%
Lower CI |
95%
Upper CI |
||||
| 2010/11 | • | 335 | 9.2% | 8.3% | 10.2% | 15.5% | 19.6% |
| 2011/12 | • | 365 | 9.8% | 8.9% | 10.8% | 15.4% | 19.4% |
| 2012/13 | • | 404 | 10.9% | 10.0% | 12.0% | 15.3% | 19.4% |
| 2013/14 | • | 387 | 11.3% | 10.3% | 12.4% | 15.2% | 19.7% |
| 2014/15 | • | 339 | 10.2% | 9.2% | 11.3% | 16.1% | 20.4% |
| 2015/16 | • | 379 | 11.0% | 10.0% | 12.1% | 16.7% | 21.1% |
| 2016/17 | • | 428 | 12.6% | 11.5% | 13.7% | 17.1% | 21.6% |
| 2017/18 | • | 429 | 13.0% | 11.9% | 14.2% | 17.7% | 22.1% |
| 2018/19 | • | 400 | 12.5% | 11.5% | 13.8% | 18.1% | 22.6% |
| 2019/20 | • | 385 | 12.4% | 11.3% | 13.6% | 18.4% | 22.8% |
| 2020/21 | • | 410 | 13.6% | 12.5% | 15.0% | 19.0% | 23.4% |
| 2021/22 | • | 440 | 14.3% | 13.2% | 15.7% | 19.6% | 24.2% |
| 2022/23 | • | 470 | 15.8% | 14.6% | 17.3% | 19.8% | 24.4% |
| 2023/24 | • | 460 | 15.0% | 13.8% | 16.3% | 20.5% | 24.7% |
| 2024/25 | • | 460 | 15.9% | 14.6% | 17.3% | 20.5% | 25.2% |
Source: NHS England
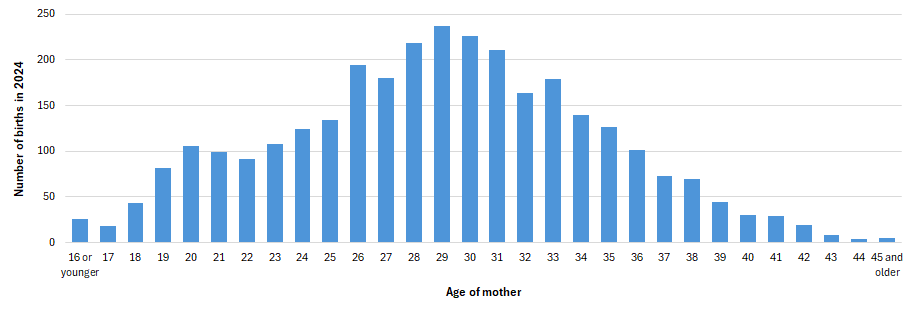
The age distribution of mothers in Hull calculated from the local births dataset is given below. According to this, in 2024 there were 3,097 births to Hull residents with 3,089 of these having age of mother recorded. The average age of the mother at time birth was 28.9 years old. The median (middle value when all ages are ranked in order) age at time of birth of all the mothers was 29 years old. Slightly more than one quarter of mothers were aged 25 years or younger (26.9%), just over one-quarter were aged 26-29 years (26.8%), one-quarter were aged 30-33 years (25.3%) and just over one-fifth were aged 34+ years.
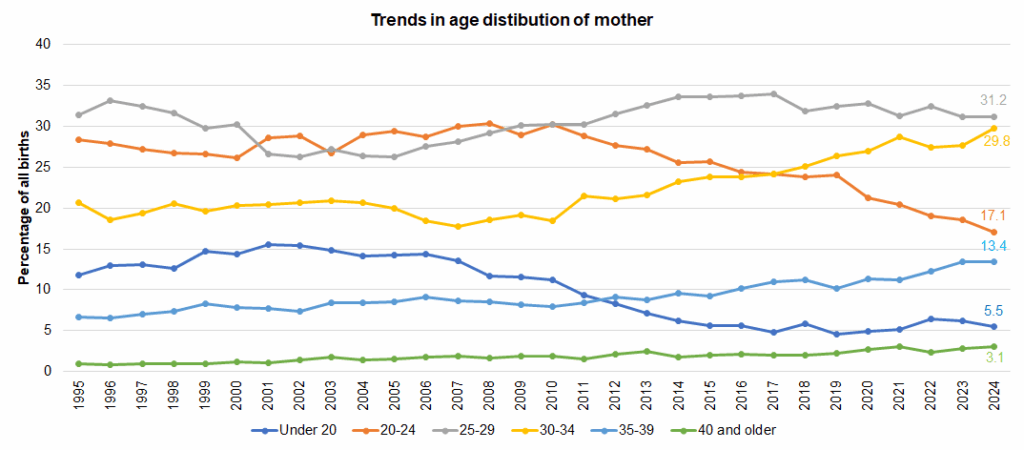
The age distribution of mother has changed quite drastically over the last 25 or so years. In 1995 compared to 2023 (latest):
- 11.8% were aged under 20 (latest 5.5%)
- 28.4% were aged 20-24 years (latest 17.1%)
- 31.5% were aged 25-29 years (latest 31.2%)
- 20.7% were aged 30-34 years (latest 29.8%)
- 6.7% were aged 35-39 years (latest 13.4%)
- 0.9% were aged 40+ years (latest 3.1%)
Whilst there has been year-on-year variability in the percentage of births to mothers aged 25-29 years, the percentage in 2024 is similar to what it was in 1995. However, the percentage of younger mothers aged under 20 and aged 20-24 years remained relatively unchanged between 1995 and 2007-10 before decreasing quite sharply. In contrast, the percentage of mothers aged 30-34 and 35-39 years has increased, again with the largest increases since 2010. The percentage changes between 1995 and 2024 have been greatest in the younger and old age groups. The percentages has deceased by 54% among those aged under 20 years, by 40% among those aged 20-24 years and by 1% among those aged 25-29 years, and have increased by 44% among those aged 30-34 years, by 101% among those aged 35-39 years (more than doubled), and by 231% among those aged 40+ years (more than tripled). Thus the greatest change from a relative point of view was among those aged 40+ years because of the very low starting base in 1995. The absolute differences were greatest among those aged 20-24 years (decreasing by 11.3 percentage points), those aged 30-34 years (increasing by 9.1 percentage points), those aged 35-39 years (increasing by 6.7 percentage points) and those aged under 20 years (decreasing by 6.3 percentage points).
Multiple Births, Prematurity and Low Birth Weight
The percentage of women with multiple births in Hull is lower than England possibly associated with the lower age of mothers in Hull for 2023.
As the rate of premature births (per 1,000 births) is higher in Hull compared to England (for 2020-22), it is perhaps not surprising that the percentage of babies born with a low birth weight is generally higher in Hull compared to England.
However, among babies born to term (after 37 complete weeks of pregnancy) the percentage with a low birth weight in Hull is lower than England for 2024.
The rate of multiple births figure is per 1,000 maternities. Premature births is the number of births with a gestational age between 24-36 weeks and all stillbirths (also 24+ weeks gestational age) given as a rate per 1,000 live births and stillbirths.
The figures relating to low birth weight are all given as percentages. The number of low birth weight (under 2,500 grams) and very low birth weight (under 1,500 grams) babies is also given for all live births and stillbirths (24+ weeks gestational age). Low birth weight of term babies is the number of live births of full-term babies (at least a gestational age of 37 complete weeks) born with a low birth weight (under 2,500 grams) out of all live full-term births.
Compared with benchmark
| Indicator | Period | England | Yorkshire and the Humber region (statistical) | Kingston upon Hull | East Riding of Yorkshire | North East Lincolnshire | North Lincolnshire | York | North Yorkshire UA | Barnsley | Doncaster | Rotherham | Sheffield | Bradford | Calderdale | Kirklees | Leeds | Wakefield |
|---|---|---|---|---|---|---|---|---|---|---|---|---|---|---|---|---|---|---|
Multiple births (Female 15-44 yrs) | 2023 | 14.5 | 13.6 | 13.6 | 14.1 | 17.0 | 10.7 | 13.8 | 17.2 | 12.9 | 17.5 | 13.6 | 14.1 | 10.0 | 10.2 | 11.8 | 14.5 | 12.7 |
Premature births (less than 37 weeks gestation) (Persons <37 weeks gestational age at birth) | 2022 - 24 | 79.6 | 78.4 | 89.4 | 75.7 | 97.7 | 86.3 | 76.6 | 74.8 | 84.7 | 91.1 | 88.0 | 78.4 | 72.0 | 71.6 | 77.0 | 70.9 | 77.7 |
Low birth weight of all babies (Persons 0 yrs) | 2023 | 7.4 | 7.5 | 8.4 | 6.3 | 7.9 | 7.8 | 6.3 | 6.8 | 6.7 | 9.6 | 8.6 | 7.9 | 8.0 | 6.1 | 7.6 | 6.9 | 7.0 |
Very low birth weight of all babies (Persons 0 yrs) | 2023 | 1.1 | 1.1 | 1.7 | 0.8 | 1.0 | 1.1 | 1.1 | 1.2 | 1.2 | 1.6 | 1.1 | 1.7 | 0.8 | 0.5 | 1.0 | 0.6 | 1.6 |
Low birth weight of term babies (Persons >=37 weeks gestational age at birth) | 2024 | 3.0 | 3.3 | 2.4 | 1.7 | 2.5 | 3.5 | 3.4 | 2.5 | 2.8 | 3.8 | 3.2 | 3.5 | 4.9 | 3.1 | 3.6 | 2.9 | 3.0 |
In Hull, there has been year-on-year variability in the percentage of multiple births. The percentage in Hull has generally been between 11% and 16%, and has been consistently lower in Hull. This is likely associated with the lower age profile of the mothers in Hull as multiple births are more likely with older mothers.
Compared with benchmark
Multiple births (Female 15-44 yrs)
|
Period
|
Kingston upon Hull |
Yorkshire and the Humber region (statistical)
|
England
|
||||
|---|---|---|---|---|---|---|---|
|
Count
|
Value
|
95%
Lower CI |
95%
Upper CI |
||||
| 2010 | • | 47 | 12.6 | 9.3 | 16.8 | 13.7 | 15.7 |
| 2011 | • | 43 | 11.4 | 8.3 | 15.4 | 14.2 | 16.2 |
| 2012 | • | 45 | 11.7 | 8.5 | 15.7 | 13.4 | 15.9 |
| 2013 | • | 57 | 15.6 | 11.8 | 20.2 | 13.9 | 15.6 |
| 2014 | • | 52 | 14.8 | 11.1 | 19.4 | 14.3 | 16.0 |
| 2015 | • | 49 | 13.8 | 10.2 | 18.2 | 13.8 | 16.0 |
| 2016 | • | 39 | 11.0 | 7.8 | 15.1 | 14.6 | 15.9 |
| 2017 | • | 41 | 12.0 | 9.1 | 16.1 | 13.8 | 15.9 |
| 2018 | • | 45 | 13.8 | 10.0 | 18.4 | 13.3 | 15.4 |
| 2019 | • | 40 | 12.7 | 9.1 | 17.3 | 14.0 | 15.3 |
| 2020 | • | 42 | 13.6 | 9.8 | 18.4 | 12.9 | 14.4 |
| 2021 | • | 35 | 11.5 | 8.0 | 15.9 | 11.8 | 13.7 |
| 2022 | • | 39 | 12.7 | 9.0 | 17.3 | 13.8 | 14.6 |
| 2023 | • | 42 | 13.6 | 9.8 | 18.4 | 13.6 | 14.5 |
Source: OHID, based on Office for National Statistics data
Over the period 2006-08 to 2013-15, the rate of premature births (after 24+ weeks of gestational age) per 1,000 live births and stillbirths has been consistently lower or comparable to England. However, the rate increased in 2014-16 becoming statistically significantly higher than England, and the rate has continued to increase in Hull increasing the inequalities gap further, although there has been a slight decrease in the last two years.
During the three year period 2020-22, there were 895 premature live births to Hull mothers equating to around 300 per year.
Local analysis has shown that women living in the most deprived fifth of areas of Hull are more likely to have babies born prematurely, and that there are also more births in total among these women, so that the total number of babies born prematurely born to women living in the most deprived fifth of areas of Hull is relatively high.
Compared with benchmark
Premature births (less than 37 weeks gestation) (Persons <37 weeks gestational age at birth)
|
Period
|
Kingston upon Hull |
Yorkshire and the Humber region (statistical)
|
England
|
||||
|---|---|---|---|---|---|---|---|
|
Count
|
Value
|
95%
Lower CI |
95%
Upper CI |
||||
| 2006 - 08 | • | 829 | 77.6 | 72.4 | 83.1 | 77.0 | 77.6 |
| 2007 - 09 | • | 830 | 77.2 | 72.0 | 82.6 | 76.0 | 76.7 |
| 2008 - 10 | • | 785 | 71.2 | 66.3 | 76.4 | 74.1 | 76.0 |
| 2009 - 11 | • | 778 | 70.0 | 65.1 | 75.1 | 74.5 | 75.9 |
| 2010 - 12 | • | 776 | 67.9 | 63.2 | 72.9 | 73.9 | 75.7 |
| 2011 - 13 | • | 797 | 69.9 | 65.1 | 74.9 | 75.3 | 76.7 |
| 2012 - 14 | • | 850 | 76.1 | 71.1 | 81.4 | 76.8 | 77.6 |
| 2013 - 15 | • | 867 | 79.7 | 74.4 | 85.1 | 77.9 | 78.4 |
| 2014 - 16 | • | 930 | 86.6 | 81.1 | 92.4 | 79.4 | 79.5 |
| 2015 - 17 | • | 947 | 89.2 | 83.6 | 95.1 | 80.4 | 80.6 |
| 2016 - 18 | • | 981 | 94.9 | 89.1 | 101.1 | 81.7 | 81.2 |
| 2017 - 19 | • | 945 | 94.9 | 89.0 | 101.2 | 81.5 | 81.0 |
| 2018 - 20 | • | 962 | 99.8 | 93.6 | 106.3 | 79.9 | 79.1 |
| 2019 - 21 | • | 924 | 98.2 | 91.9 | 104.7 | 79.5 | 77.9 |
| 2020 - 22 | • | 895 | 95.8 | 89.6 | 102.3 | 78.0 | 77.0 |
| 2021 - 23 | • | 846 | 90.7 | 84.7 | 97.0 | 79.4 | 78.9 |
| 2022 - 24 | • | 834 | 89.4 | 83.4 | 95.6 | 78.4 | 79.6 |
Source: OHID, based on Office for National Statistics data
The percentage of low birth weight babies in Hull was consistently lower than England between 2010 and 2013, but increased slightly between 2014 and 2017. In the 2018, the percentage of low birth weight babies increased considerably in Hull by almost two percentage points from 8.1% in 2017 to 9.7% in 2018, and whilst the percentage in Hull is lower in 2023 compared to the high in 2018, it is still considerably high relative to England.
Local analysis has shown that women living in the most deprived fifth of areas of Hull are more likely to have babies born with a low birth weight, and that there are also more births in total among these women, so that the total number of babies born with a low birth weight born to women living in the most deprived fifth of areas of Hull is relatively high.
Compared with benchmark
Low birth weight of all babies (Persons 0 yrs)
|
Period
|
Kingston upon Hull |
Yorkshire and the Humber region (statistical)
|
England
|
||||
|---|---|---|---|---|---|---|---|
|
Count
|
Value
|
95%
Lower CI |
95%
Upper CI |
||||
| 2010 | • | 260 | 6.9% | 6.1% | 7.8% | 7.7% | 7.3% |
| 2011 | • | 267 | 7.0% | 6.2% | 7.9% | 7.9% | 7.4% |
| 2012 | • | 271 | 7.0% | 6.2% | 7.8% | 7.4% | 7.3% |
| 2013 | • | 258 | 6.9% | 6.2% | 7.8% | 7.8% | 7.4% |
| 2014 | • | 273 | 7.7% | 6.8% | 8.6% | 7.9% | 7.4% |
| 2015 | • | 302 | 8.4% | 7.5% | 9.3% | 7.7% | 7.4% |
| 2016 | • | 298 | 8.3% | 7.5% | 9.3% | 8.0% | 7.3% |
| 2017 | • | 279 | 8.1% | 7.2% | 9.1% | 7.9% | 7.4% |
| 2018 | • | 320 | 9.7% | 8.7% | 10.7% | 7.9% | 7.4% |
| 2019 | • | 271 | 8.5% | 7.6% | 9.5% | 7.5% | 7.2% |
| 2020 | • | 279 | 8.9% | 8.0% | 10.0% | 7.1% | 6.9% |
| 2021 | • | 249 | 8.1% | 7.2% | 9.1% | 7.1% | 6.8% |
| 2022 | • | 277 | 8.9% | 8.0% | 10.0% | 7.6% | 7.2% |
| 2023 | • | 260 | 8.4% | 7.5% | 9.4% | 7.5% | 7.4% |
Source: OHID, based on Office for National Statistics data
The percentage of very low birth weight babies is small and has been around 1.5% between 2010 and 2018. The percentage has been 1.7% or more for four of the last five years, and for these years, the rate in Hull was also statistically significantly higher than England.
Compared with benchmark
Very low birth weight of all babies (Persons 0 yrs)
|
Period
|
Kingston upon Hull |
Yorkshire and the Humber region (statistical)
|
England
|
||||
|---|---|---|---|---|---|---|---|
|
Count
|
Value
|
95%
Lower CI |
95%
Upper CI |
||||
| 2010 | • | 60 | 1.6% | 1.2% | 2.0% | 1.5% | 1.4% |
| 2011 | • | 59 | 1.5% | 1.2% | 2.0% | 1.6% | 1.4% |
| 2012 | • | 48 | 1.2% | 0.9% | 1.6% | 1.3% | 1.3% |
| 2013 | • | 54 | 1.5% | 1.1% | 1.9% | 1.4% | 1.3% |
| 2014 | • | 58 | 1.6% | 1.3% | 2.1% | 1.3% | 1.3% |
| 2015 | • | 47 | 1.3% | 1.0% | 1.7% | 1.3% | 1.3% |
| 2016 | • | 44 | 1.2% | 0.9% | 1.6% | 1.3% | 1.2% |
| 2017 | • | 53 | 1.5% | 1.2% | 2.0% | 1.3% | 1.1% |
| 2018 | • | 50 | 1.5% | 1.1% | 2.0% | 1.2% | 1.2% |
| 2019 | • | 57 | 1.8% | 1.4% | 2.3% | 1.1% | 1.1% |
| 2020 | • | 57 | 1.8% | 1.4% | 2.4% | 1.1% | 1.0% |
| 2021 | • | 38 | 1.2% | 0.9% | 1.7% | 1.0% | 1.0% |
| 2022 | • | 56 | 1.8% | 1.4% | 2.3% | 1.1% | 1.0% |
| 2023 | • | 52 | 1.7% | 1.3% | 2.2% | 1.1% | 1.1% |
Source: OHID, based on Office for National Statistics data
Among live births born to term (37+ weeks gestational age), the percentage of low birth weight babies in Hull has been relatively similar to England although there has been some year-on-year variability.
For the last two years, the percentage of low birth weight babies among those born to term has been lower in Hull compared to England.
Compared with benchmark
Low birth weight of term babies (Persons >=37 weeks gestational age at birth)
|
Period
|
Kingston upon Hull |
Yorkshire and the Humber region (statistical)
|
England
|
||||
|---|---|---|---|---|---|---|---|
|
Count
|
Value
|
95%
Lower CI |
95%
Upper CI |
||||
| 2006 | • | 104 | 3.2% | 2.7% | 3.9% | 3.3% | 3.0% |
| 2007 | • | 96 | 3.0% | 2.5% | 3.7% | 3.2% | 2.9% |
| 2008 | • | 114 | 3.3% | 2.8% | 4.0% | 3.1% | 2.9% |
| 2009 | • | 91 | 2.8% | 2.3% | 3.4% | 3.3% | 2.9% |
| 2010 | • | 86 | 2.5% | 2.0% | 3.0% | 3.0% | 2.9% |
| 2011 | • | 103 | 2.9% | 2.4% | 3.5% | 3.1% | 2.8% |
| 2012 | • | 94 | 2.6% | 2.1% | 3.2% | 2.9% | 2.8% |
| 2013 | • | 93 | 2.7% | 2.2% | 3.3% | 3.0% | 2.8% |
| 2014 | • | 78 | 2.4% | 1.9% | 3.0% | 3.1% | 2.9% |
| 2015 | • | 109 | 3.3% | 2.7% | 4.0% | 3.0% | 2.8% |
| 2016 | • | 93 | 2.9% | 2.4% | 3.5% | 2.9% | 2.8% |
| 2017 | • | 86 | 2.8% | 2.2% | 3.4% | 3.0% | 2.8% |
| 2018 | • | 101 | 3.4% | 2.8% | 4.1% | 3.1% | 2.9% |
| 2019 | • | 71 | 2.5% | 2.0% | 3.1% | 3.0% | 2.9% |
| 2020 | • | 72 | 2.6% | 2.1% | 3.2% | 3.0% | 2.9% |
| 2021 | • | 80 | 2.9% | 2.3% | 3.5% | 3.0% | 2.8% |
| 2022 | • | 96 | 3.4% | 2.8% | 4.1% | 3.2% | 2.9% |
| 2023 | • | 70 | 2.5% | 2.0% | 3.1% | 3.1% | 2.9% |
| 2024 | • | 68 | 2.4% | 1.9% | 3.1% | 3.3% | 3.0% |
Source: OHID, based on Office for National Statistics data
Newborn Hearing Screening
Almost all newborn babies in Hull had their hearing screening test in 2024/25 (99.1%). The percentage in Hull was the same as the Yorkshire and Humber region and marginally higher than England.
Compared with benchmark
| Indicator | Period | England | Yorkshire and the Humber region (statistical) | Kingston upon Hull | East Riding of Yorkshire | North East Lincolnshire | North Lincolnshire | York | North Yorkshire UA | Barnsley | Doncaster | Rotherham | Sheffield | Bradford | Calderdale | Kirklees | Leeds | Wakefield |
|---|---|---|---|---|---|---|---|---|---|---|---|---|---|---|---|---|---|---|
Newborn Hearing Screening: Coverage (Persons <1 yr) | 2024/25 | 98.8 | 99.1 | 99.1 | 98.9 | 99.6 | 98.3 | 99.5 | 99.2 | 99.0 | 97.8 | 99.2 | 98.1 | 99.4 | 99.7 | 99.5 | 99.3 | 99.4 |
The rates have been consistently high in Hull compared to England and the region. The screening rates reduced in 2020/21 due to the COVID-19 pandemic for both England and the region, but no such decrease was apparent in Hull.
The percentage has been marginally lower in the last three years than earlier years.
Around 27 infants in Hull did not have their newborn hearing screening in 2024/25.
Compared with benchmark
Newborn Hearing Screening: Coverage (Persons <1 yr)
|
Period
|
Kingston upon Hull |
Yorkshire and the Humber region (statistical)
|
England
|
||||
|---|---|---|---|---|---|---|---|
|
Count
|
Value
|
95%
Lower CI |
95%
Upper CI |
||||
| 2013/14 | • | 3565 | 99.4% | 99.0% | 99.6% | 98.4% | 98.5% |
| 2014/15 | • | 3460 | 99.7% | 99.5% | 99.9% | 98.5% | 98.5% |
| 2015/16 | • | 3538 | 99.7% | 99.4% | 99.8% | 98.6% | 98.7% |
| 2017/18 | • | 3350 | 99.9% | 99.7% | 100% | 99.1% | 98.9% |
| 2018/19 | • | 3227 | 99.8% | 99.5% | 99.9% | 99.2% | 99.2% |
| 2019/20 | • | 3138 | 99.6% | 99.3% | 99.8% | 98.4% | 98.2% |
| 2020/21 | • | 3045 | 99.6% | 99.3% | 99.8% | 97.6% | 97.5% |
| 2021/22 | • | 3140 | 99.8% | 99.5% | 99.9% | 98.6% | 98.7% |
| 2022/23 | • | 3006 | 99.1% | 98.7% | 99.4% | 98.2% | 98.5% |
| 2023/24 | • | 3104 | 99.0% | 98.6% | 99.3% | 99.0% | 99.0% |
| 2024/25 | • | 2965 | 99.1% | 98.7% | 99.4% | 99.1% | 98.8% |
Source: NHS England, Newborn Hearing Screening Programme
New Birth Visits and 6-8 Week Health Checks
For 2024/25, the percentage of new birth visits completed within the first 14 days and the percentage of 6-8 week visits completed within the time period are high in Hull compared to England and the Yorkshire and Humber region, and both are statistically significantly higher in Hull compared to England. These early visits are very important so that any problems can be picked up quickly especially those relating to maternal emotional and mental wellbeing.
Compared with benchmark
| Indicator | Period | England | Yorkshire and the Humber region (statistical) | Kingston upon Hull | East Riding of Yorkshire | North East Lincolnshire | North Lincolnshire | York | North Yorkshire UA | Barnsley | Doncaster | Rotherham | Sheffield | Bradford | Calderdale | Kirklees | Leeds | Wakefield |
|---|---|---|---|---|---|---|---|---|---|---|---|---|---|---|---|---|---|---|
Proportion of New Birth Visits (NBVs) completed within 14 days (Persons <14 days) | 2024/25 | 85.2 | 83.4 | 87.8 | 92.1 | 80.7 | 84.2 | 67.1 | 92.6 | 76.8 | 64.9 | 83.2 | 87.0 | 98.0 | 33.0 | 77.9 | 89.2 | 76.2 |
Proportion of infants receiving a 6 to 8 week review (Persons 6-8 weeks) | 2024/25 | 85.1 | 77.4 | 87.5 | 94.0 | 88.2 | 87.9 | 84.7 | 95.2 | 95.3 | 86.9 | 88.8 | 90.6 | 92.1 | 83.0 | 76.8 | 13.9 | 90.6 |
The percentage of new birth visits completed within 14 days in Hull was significantly lower than England during 2017/18 and 2018/19, but increased from a low of 82.9% in 2017/18 to a high of 89.5% in 2020/21. The rate has since decreased to 87.8% for 2024/25, but this is still higher than England.
There were approximately 366 new birth visits that were not completed within 14 days in Hull during 2024/25.
Compared with benchmark
Proportion of New Birth Visits (NBVs) completed within 14 days (Persons <14 days)
|
Period
|
Kingston upon Hull |
Yorkshire and the Humber region (statistical)
|
England
|
||||
|---|---|---|---|---|---|---|---|
|
Count
|
Value
|
95%
Lower CI |
95%
Upper CI |
||||
| 2017/18 | • | 2808 | 82.9% | 81.6% | 84.1% | 84.0% | 87.7% |
| 2018/19 | • | 2743 | 83.9% | 82.6% | 85.1% | 85.7% | 88.8% |
| 2019/20 | • | 2746 | 87.4% | 86.2% | 88.5% | 83.7% | 87.1% |
| 2020/21 | • | 2764 | 89.5% | 88.4% | 90.5% | 82.3% | 88.0% |
| 2021/22 | • | 2660 | 87.9% | 86.7% | 89.0% | 77.9% | 82.7% |
| 2022/23 | • | 2303 | 84.9% | 83.5% | 86.2% | 77.0% | 79.7% |
| 2023/24 | • | 2676 | 86.8% | 85.6% | 88.0% | 79.9% | 83.0% |
| 2024/25 | • | 2634 | 87.8% | 86.6% | 89.0% | 83.4% | 85.2% |
Source: OHID, based on interim reporting data for universal health visiting services
The percentage of infants receiving a 6-8 week review in Hull was similar to England for 2017/18 (84.6% versus 84.3%), but the percentage increased in Hull to a high of 93.0% in 2019/20. Whilst the rate in Hull has subsequently decreased, it is still statistically significantly higher than England at 87.5% for 2024/25, and has been consistently higher than England for the last seven years.
There were approximately 381 infants that were not receive their 6-8 week review in Hull during 2024/25.
Compared with benchmark
Proportion of infants receiving a 6 to 8 week review (Persons 6-8 weeks)
|
Period
|
Kingston upon Hull |
Yorkshire and the Humber region (statistical)
|
England
|
||||
|---|---|---|---|---|---|---|---|
|
Count
|
Value
|
95%
Lower CI |
95%
Upper CI |
||||
| 2017/18 | • | 3278 | 84.6% | 83.4% | 85.7% | 84.4% | 84.3% |
| 2018/19 | • | 3389 | 89.2% | 88.2% | 90.1% | 86.4% | 85.4% |
| 2019/20 | • | 3374 | 93.0% | 92.1% | 93.8% | 88.1% | 85.1% |
| 2020/21 | • | 3295 | 92.6% | 91.7% | 93.4% | 78.1% | 80.2% |
| 2021/22 | • | 3216 | 91.8% | 90.9% | 92.7% | 85.4% | 81.6% |
| 2022/23 | • | 2547 | 82.8% | 81.5% | 84.1% | 79.6% | 79.8% |
| 2023/24 | • | 2588 | 85.3% | 84.0% | 86.5% | 76.9% | 81.8% |
| 2024/25 | • | 2666 | 87.5% | 86.2% | 88.6% | 77.4% | 85.1% |
Source: OHID, based on interim reporting data for universal health visiting services
A&E Attendances and Hospital Admissions
Information is also available on A&E attendances and hospital admissions within A&E Attendances and Hospital Admissions under Health Factors under Children and Young People.
Stillbirth and Infant Mortality
Information relating to stillbirths, neonatal deaths, post-neonatal deaths and infant deaths is given under Stillbirths and Infant Mortality within Pregnancy and Infants within Children and Young People.
Strategic Need and Service Provision
The Better Births national maternity review states that “every women, every pregnancy, every baby and every family is different. Therefore, quality services (by which we mean safe, clinically effective and providing a good experience) must be personalised”. The vision for maternity services across England is “for them to become safer, more personalised, kinder, professional and more family friendly; where every woman has access to information to enable her to make decisions about her care; and where she and her baby can access support that is centred around their individual needs and circumstances. And for all staff to be supported to deliver care which is women centred, working in high performing teams, in organisations which are well led and in cultures that promote innovation, continuous learning, and break down organisational and professional boundaries”. The national Maternity Transformation Programme seeks to achieve the vision set out in Better Births vision working across nine work streams: (1) transforming the workforce; (2) sharing data and information; (3) harnessing digital technology; (4) reforming the payment system; (5) promoting good practice for safer care; (6) improving prevention; (7) improving access to perinatal mental health services; (8) supporting local transformation; (9) increasing choice and personalisation.
Work needs to continue to reduce the under 18 conception rate, as well as reduce the number of women who are obese or who smoke, with a need to provide help and advice prior to pregnancy to attempt to reduce these risks (although recognising that not all pregnancies are planned). Identifying risks and intervening early to improve maternal health and wellbeing, improving birth preparation, promoting positive parenting skills, and creating an environment for children and young people that builds self-esteem and resilience, with good emotional health. Early help and intervention for all families should be timely, accessible and appropriate for their circumstances. Hull’s Early Help and Prevention offer is focused on a whole family approach which aims to identify individuals and families with problems and brings together different services and agencies to collectively look at what support is needed and then work together to deliver the required support in an coordinated way. The strategy outlines the approach to ensure that collaboration and alignment of services, and that early help may be ‘early in life or at the earliest opportunity’ which is also part of the day job, helpful, non-stigmatising, preventative, targeted and tailored. There are four thresholds of need: (i) no additional needs which is the universal response to build resilience in children and young people; (ii) additional needs involving prevention and early help; (iii) complex needs involving a targeted response of early help and interventions; and (iv) risk of significant harm which includes child protection procedures and safeguarding services.
Local analysis has shown that women living in the most deprived fifth of areas of Hull are more likely to have babies born prematurely and have babies born with low birth weight (likely the latter a consequence of the former). As there are more total births among women living in the most deprived fifth of areas of Hull, this means that a higher percentage of ‘high risk’ babies (born prematurely and/or with a low birth weight) for women living in the most deprived fifth of areas of Hull. This might have implications on discharge if additional or special equipment is required.
Resources
The Office for Health Improvement & Disparities’ Fingertips: https://fingertips.phe.org.uk/
Maternity Services Liaison Committees, An introduction to maternity services in the NHS, 2014, The Office for Health Improvement & Disparities (formerly Public Health England): London.
Cumberlege, J. and National Maternity Review, Better Births: Improving outcomes of maternity services in England. A Five Year Forward View for maternity care. 2016, National Maternity Review: London.
NHS England, Maternity Transformation Programme. 2016, NHS England: London.
Early Help. Service Guide and Performance Review 2019/20.
NHS Improving Care. Improving Access to Perinatal Mental Health Services in England – A Review, 2017.
Updates
This page was last updated / checked on 23 April 2026.
This page is due to be updated / checked in August 2026.