Index
This topic area covers statistics and information relating to early years in Hull including local strategic need and service provision including good child development and ‘readiness’ for school. Further information relating to Schools, Education and Qualifications is given under Health and Wellbeing Influences. Information relating to Children with Special Educational Needs or Disabilities is under Health Factors under Children and Young Children. Further information on early help in relation to mental health and emotional wellbeing is given in Mental Health and Emotional Wellbeing Among Children and Young People under Health Factors within Children and Young People. Further information relating to A&E attendances and hospital admissions is given within A&E Attendances and Hospital Admissions under Health Factors within Children and Young People. More information on the reasons for referral for early help is available on Hull’s Early Help and Prevention Programme within Child Development under Children and Young People, and this can give an indication around the needs of children living in Hull.
This page contains information from the Office for Health Improvement & Disparities’ Fingertips. Information is taken ‘live’ from the site so uses the latest available data from Fingertips and displays it on this page. As a result, some comments on this page may relate to an earlier period of time until this page is next updated (see review dates at the end of this page).
Summary Infographic
Headlines
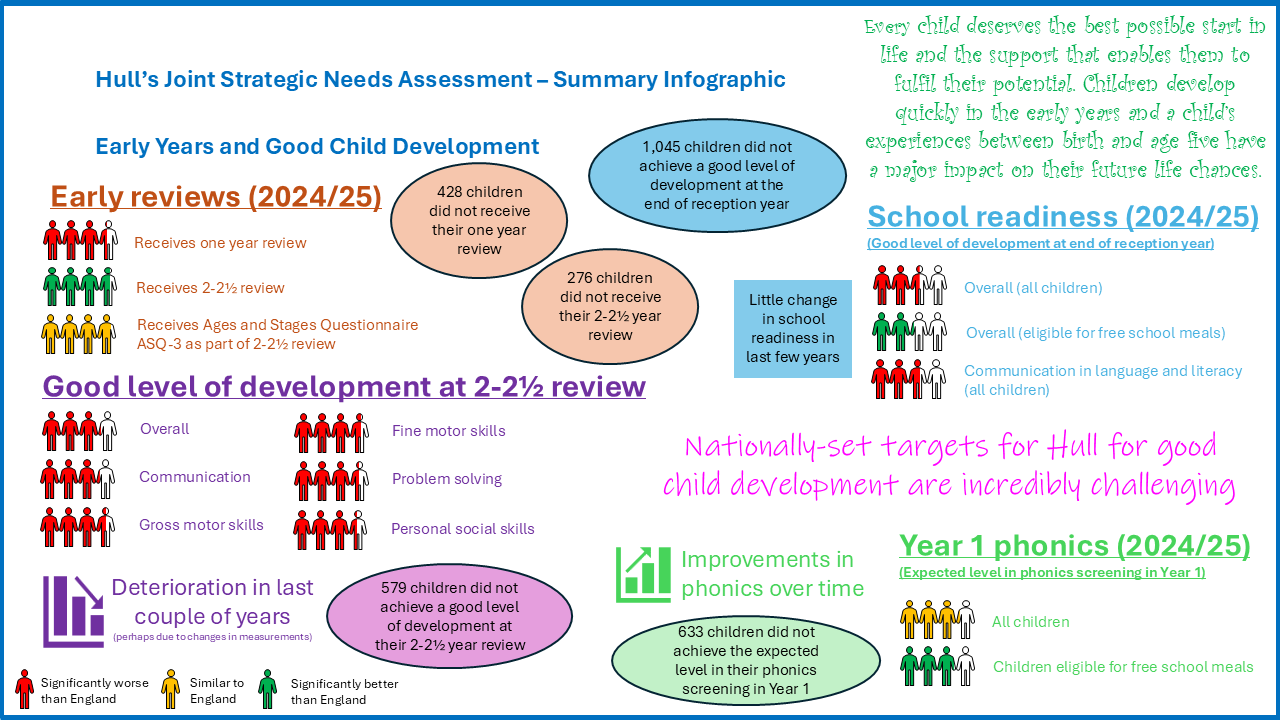
- Every child deserves the best possible start in life and the support that enables them to fulfil their potential. Children develop quickly in the early years and a child’s experiences between birth and age five have a major impact on their future life chances.
- The majority of children in Hull lead happy and healthy lives, are part of loving families who take good care of them and support them to reach their potential. All children in Hull deserve the best possible start in life but unfortunately there are some who face disadvantages that affect their development, which impacts on their future potential, health and happiness.
- In 2024/25, 86% of infants had their one year review and 91% of children had their 2-2.5 year review in Hull compared to 88% and 81% respectively in England. The percentages who had their reviews had been consistently higher in Hull compared to England until 2021/22, but have decreased in Hull since then, with the percentage receiving their 12-month review in 2024/25 significantly lower than England for the first time, although the percentages receiving their 2-2.5 year review remained statistically significantly higher in Hull than England.
- Of those who had their 2-25. year review, almost all (94%) had the Ages and Stages Questionnaire version 3 completed. From this questionnaire, it is possible to examine achievement against expected levels of development.
- Of out the children receiving the assessment, 78.9% achieved a good level of development which is significantly lower than England (81.4%). The percentages of children achieving the expected level of development in communication skills, gross and fine motor skills, problem-solving skills and personal-social skills were all statistically significantly lower in Hull compared to England for 2024/25. The percentage achieving the expected levels overall and for these specific measures have generally been higher in Hull compared to England. However, given Hull’s high levels of deprivation and data quality issues acknowledged to be present within this data (prior to 2022/23), any findings relating to outcomes among 2-2.5 year olds in Hull should be treated cautiously.
- Assessments in schools were not undertaken during the 2019/20 and 2020/21 school years due to the COVID-19 pandemic. In the 2018/19 school year, the percentage of children who achieved a good level of development at the end of reception year (aged 4-5 years) in preparation for entry into school Year 1 was 67.7% in Hull (compared to 71.5% for England), but the rate has fallen for both Hull (to 65.3%) and England (to 68.3%) for 2024/25, and it is likely this is due to the COVID-19 pandemic and lower levels of child development among these children during that period prior to commencing school. Whilst the percentage for 2024/25 is statistically significantly lower in Hull compared to England for all pupils, the percentage among children eligible for free school meals is statically significantly higher than England.
- The same was true for the percentage of children who were at the expected level of development in communication, language and literacy skills at the end of reception year. In Hull, the percentage fell from 68.0% for 2018/19 to 66.0% for 2024/25, statistically significantly lower in Hull compared to England (69.7%).
- In 2024/25, among children in Year 1 (aged 5-6 years), 79.5% achieved the expected levels in phonics compared to 79.8% in England. This is similar for Hull to the pre-pandemic level seen in 2018/19 (79.2%) but a decrease for England (81.8% in 2018/19). For children eligible for free school meals, 71.6% achieved the expected level in phonics which was statistically significantly higher than England at 66.6%.
The Population Affected – Why Is It Important?
Every child deserves the best possible start in life and the support that enables them to fulfil their potential. Children develop quickly in the early years and a child’s experiences between birth and age five have a major impact on their future life chances. A secure and happy childhood is important in its own right. Good parenting and high quality early learning together provide the foundation children need to make the most of their abilities and talents as they grow up.
The majority of children in Hull lead happy and healthy lives, are part of loving families who take good care of them and support them to reach their potential. All children in Hull deserve the best possible start in life but unfortunately there are some who face disadvantages that affect their development, which impacts on their future potential, health and happiness. Providing ‘Early Help’ plays a vital part in offering these children and their families the support they need to reach their potential and keep them safe.
Marmot in his strategic review of health inequalities in England post-2010 stated that parents are the most important ‘educators’ of their children for both cognitive and non-cognitive skills. He also stated that parental involvement in their child’s reading has been found to be the most important determinant of language and emergent literacy.
Literacy is the combination of reading, writing, speaking and listening skills we all need to fulfil our potential. These life skills are essential to the happiness, health and wealth of individuals and society. Fourteen percent of children and young people in lower income homes rarely or never read their books for pleasure. One in five parents easily find the opportunity to read to their children, with the rest struggling to read to their children due to fatigue and busy lifestyles.
Analysis of data from the Millennium Cohort Study suggests that parents who combine high levels of parental warmth with high levels of supervision are more likely to have children at age five who are more confident, autonomous and empathic. On the other hand, a ‘disengaged’ parenting style is associated with poorer outcomes for children in terms of qualifications, relationship problems, unemployment and becoming teenage parents.
As well as good home learning environment, early years’ education is very important. The original Sure Start Children’s Centres programme was based on evidence that effective early intervention prevented costs to society later on. Locally-led community-based programmes can engage those families who might not otherwise seek help. Pre-school shows a significant positive effect on early cognitive outcomes for all levels of quality and duration compared to none. Furthermore, having long pre-school experience has greater benefit on literacy outcomes, whatever the quality, although long good quality pre-school had the greatest effects on early outcomes and at age 11 (test scores and social and behavioural outcomes).
Ensuring children are ready for school and can achieve good levels of education is essential for them to achieve well-paid satisfying regular employment, increase resilience, and improve health and wellbeing. Children living in more deprived areas are more likely to grow up thinking that poverty, poor housing, and unemployment are the norm, which could result in cyclic behaviours with these children behaving as their parents do as they reach adulthood. Early intervention in childhood can help reduce physical and mental health problems and prevent social dysfunction being passed from one generation to the next. More information is available on Hull’s Early Help and Prevention Programme within Child Development under Children and Young People.
Following the Children and Families Act 2014, children and young people (under the age of 25 years) who have special educational needs may have an Education, Health and Care (EHC) plan, developed by all professionals and the family working together, to address all needs that a child or young person has within education, health and care.
The national definition of Early Help is: “The total support that improves a family’s resilience and outcomes, or reduces the chance of a problem getting worse”. As the national definition says, effective Early Help services can prevent problems from occurring and can tackle them head on when they do, before problems get worse. It also helps to build resilience in families, developing strength and skills that prepare children for adult life and help families to cope better with the challenges life throws at them.
The Hull Picture
Good Child Development and Readiness for School
Child Development Reviews at Ages One and Two Years
Children have a development review when they are one and between the ages of 2 and 2.5 years.
During 2024/25, almost nine in ten children in Hull received their 12 month (85.8%) and just over nine in ten (91.1%) children received their 2 – 2.5 year review in Hull. This was statistically significantly lower than England for the one year review, but statistically significantly higher for the 2 – 2.5 year review.
Of those those who had a 2 – 2.5 year review, almost all (94.0%) had the Ages and Stages Questionnaire 3 (ASQ-3) completed as part of their Healthy Child Programme review, and this was statistically significantly higher than England. From the ASQ-3, it is possible to measure achievement against expected levels of development.
Compared with benchmark
| Indicator | Period | England | Yorkshire and the Humber region (statistical) | Kingston upon Hull | East Riding of Yorkshire | North East Lincolnshire | North Lincolnshire | York | North Yorkshire UA | Barnsley | Doncaster | Rotherham | Sheffield | Bradford | Calderdale | Kirklees | Leeds | Wakefield |
|---|---|---|---|---|---|---|---|---|---|---|---|---|---|---|---|---|---|---|
Proportion of children receiving a 12-month review (Persons 1 yr) | 2024/25 | 88.4 | 93.4 | 85.8 | 96.1 | 96.0 | 91.6 | 93.8 | 99.5 | 97.6 | 94.1 | 94.0 | 95.8 | 96.7 | 93.5 | 88.2 | 87.8 | 96.1 |
Proportion of children who received a 2 to 2 and a half year review (Persons 2-2.5 yrs) | 2024/25 | 80.8 | 88.4 | 91.1 | 94.6 | 95.3 | 84.1 | 89.2 | 96.7 | 91.6 | 91.0 | 91.2 | 89.1 | 86.6 | 88.5 | 79.6 | 80.5 | 94.5 |
Proportion of children aged 2 to 2 and a half years receiving ASQ-3 as part of the Healthy Child Programme or integrated review (Persons 2-2.5 yrs) | 2024/25 | 93.9 | 92.1 | 94.0 | 96.2 | 99.2 | 96.2 | 97.7 | 99.3 | 98.1 | 97.3 | 93.2 | 96.1 | 93.5 | 91.2 | 69.4 | 81.7 | 99.0 |
The percentage of children receiving their one year reviews was around 93% between 2017/18 and 2019/20, but decreased to 90% for 2020/21 which could be associated with the COVID-19 pandemic. The rate increased back to around 93% for 2021/22, but has been lower since then. The percentage in Hull in 2024/25 is 85.8%, lower than it was previously in Hull between 2017/18 and 2021/22. Except for the last three years, the percentage in Hull had been statistically significantly higher than England.
In total, 423 children in Hull did not receive their one year review in 2024/25.
Compared with benchmark
Proportion of children receiving a 12-month review (Persons 1 yr)
|
Period
|
Kingston upon Hull |
Yorkshire and the Humber region (statistical)
|
England
|
||||
|---|---|---|---|---|---|---|---|
|
Count
|
Value
|
95%
Lower CI |
95%
Upper CI |
||||
| 2017/18 | • | 3287 | 93.1% | 92.2% | 93.9% | 85.5% | 82.6% |
| 2018/19 | • | 3179 | 93.4% | 92.5% | 94.2% | 90.4% | 82.3% |
| 2019/20 | • | 3017 | 93.6% | 92.7% | 94.4% | 91.7% | 83.6% |
| 2020/21 | • | 2871 | 89.9% | 88.9% | 90.9% | 88.9% | 76.1% |
| 2021/22 | • | 2886 | 93.5% | 92.6% | 94.3% | 90.7% | 82.0% |
| 2022/23 | • | 2119 | 81.4% | 79.9% | 82.9% | 92.2% | 82.6% |
| 2023/24 | • | 2604 | 87.0% | 85.7% | 88.1% | - | 86.5% |
| 2024/25 | • | 2558 | 85.8% | 84.5% | 87.0% | 93.4% | 88.4% |
Source: OHID, based on interim reporting data for universal health visiting services
The percentage of children receiving their 2 – 2.5 year reviews was around 85% between 2018/19 and 2020/21, and then increased to 89% for 2021/22. However, this fell to 87% for 2022/23 and decreased even more the last year to 81%, but bounced back in the most recent year, 2024/25, to 91.1%. Throughout 2017/18 to 2024/25 the rate in Hull has been statistically significantly higher than the rate for England.
In total, 276 children did not receive their 2 – 2.5 year review in 2024/25.
Compared with benchmark
Proportion of children who received a 2 to 2 and a half year review (Persons 2-2.5 yrs)
|
Period
|
Kingston upon Hull |
Yorkshire and the Humber region (statistical)
|
England
|
||||
|---|---|---|---|---|---|---|---|
|
Count
|
Value
|
95%
Lower CI |
95%
Upper CI |
||||
| 2017/18 | • | 2789 | 79.6% | 78.2% | 80.9% | 78.6% | 75.7% |
| 2018/19 | • | 3001 | 86.7% | 85.5% | 87.8% | 82.6% | 77.6% |
| 2019/20 | • | 2959 | 85.5% | 84.3% | 86.6% | 82.8% | 78.6% |
| 2020/21 | • | 2774 | 84.3% | 83.0% | 85.5% | 80.4% | 71.5% |
| 2021/22 | • | 2747 | 89.3% | 88.2% | 90.4% | 77.7% | 74.1% |
| 2022/23 | • | 2364 | 87.3% | 86.0% | 88.5% | 82.4% | 73.6% |
| 2023/24 | • | 2396 | 80.5% | 79.1% | 81.9% | 89.3% | 78.4% |
| 2024/25 | • | 2830 | 91.1% | 90.0% | 92.0% | 88.4% | 80.8% |
Source: OHID, based on interim reporting data for universal health visiting services
Since 2016/17, the percentage of children who were assessed using the ASQ-3 questionnaire out of those who received their 2-2.5 year review has been generally been lower than England, but the differences have been relatively small at around 1-5 percentage points. However, almost all of the reviews completed in 2023/24 in Hull were assessed using the ASQ-3 questionnaire, although the percentage decreased to 94% in 2024/25, similar to England.
Compared with benchmark
Proportion of children aged 2 to 2 and a half years receiving ASQ-3 as part of the Healthy Child Programme or integrated review (Persons 2-2.5 yrs)
|
Period
|
Kingston upon Hull |
Yorkshire and the Humber region (statistical)
|
England
|
||||
|---|---|---|---|---|---|---|---|
|
Count
|
Value
|
95%
Lower CI |
95%
Upper CI |
||||
| 2015/16 | • | 843 | 25.6% | 24.2% | 27.1% | 62.2% | 81.3% |
| 2016/17 | • | 2801 | 92.0% | 91.0% | 92.9% | 88.3% | 89.4% |
| 2017/18 | • | 2603 | 87.2% | 86.0% | 88.4% | 87.6% | 90.2% |
| 2018/19 | • | 2662 | 87.5% | 86.3% | 88.7% | 90.3% | 90.3% |
| 2019/20 | • | 2664 | 88.1% | 86.9% | 89.2% | 91.3% | 92.6% |
| 2020/21 | • | 2513 | 86.9% | 85.6% | 88.1% | 75.7% | 85.2% |
| 2021/22 | • | 2543 | 91.0% | 89.8% | 92.0% | 88.9% | 90.3% |
| 2022/23 | • | 2202 | 85.9% | 84.5% | 87.2% | 91.2% | 92.5% |
| 2023/24 | • | 2384 | 99.5% | 99.1% | 99.7% | 90.8% | 93.3% |
| 2024/25 | • | 2741 | 94.0% | 93.1% | 94.8% | 92.1% | 93.9% |
Source: OHID, based on interim reporting data for universal health visiting services
For 2024/25, among children aged 2 – 2.5 years who completed the ASQ-3 as part of their review, 78.9% achieved a good level of development in Hull, the second lowest among Yorkshire and Humber local authorities, and significantly lower than for England (81.4%).
Compared with benchmark
| Indicator | Period | England | Yorkshire and the Humber region (statistical) | Kingston upon Hull | East Riding of Yorkshire | North East Lincolnshire | North Lincolnshire | York | North Yorkshire UA | Barnsley | Doncaster | Rotherham | Sheffield | Bradford | Calderdale | Kirklees | Leeds | Wakefield |
|---|---|---|---|---|---|---|---|---|---|---|---|---|---|---|---|---|---|---|
Child development: percentage of children achieving a good level of development at 2 to 2 and a half years (Persons 2-2.5 yrs) | 2024/25 | 81.4 | 85.6 | 78.9 | 89.6 | 77.7 | 85.7 | 92.2 | 88.6 | 84.7 | 87.3 | 88.9 | 84.0 | 82.2 | 86.3 | 82.1 | 86.8 | 89.4 |
There is some year-on-year variability in the percentages of Hull children achieving a good level of development, but the percentage had been consistently higher in Hull compared to England until the last two years. However, prior to these two years, the information should be treated cautiously as it was acknowledged by The Office for Health Improvement & Disparities on their Fingertips tool that “there are concerns regarding the quality of these data indicators [for 2022/23 and earlier]”.
Compared with benchmark
Child development: percentage of children achieving a good level of development at 2 to 2 and a half years (Persons 2-2.5 yrs)
|
Period
|
Kingston upon Hull |
Yorkshire and the Humber region (statistical)
|
England
|
||||
|---|---|---|---|---|---|---|---|
|
Count
|
Value
|
95%
Lower CI |
95%
Upper CI |
||||
| 2017/18 | • | 2331 | 89.6% | 88.3% | 90.7% | 86.0% | 83.3% |
| 2018/19 | • | 2386 | 89.6% | 88.4% | 90.7% | 87.9% | 84.1% |
| 2019/20 | • | 2322 | 87.2% | 85.8% | 88.4% | 86.7% | 83.3% |
| 2020/21 | • | 2265 | 90.1% | 88.9% | 91.2% | 84.9% | 82.9% |
| 2021/22 | • | 2164 | 85.1% | 83.7% | 86.4% | 82.7% | 81.1% |
| 2022/23 | • | 1950 | 88.6% | 87.2% | 89.8% | 84.6% | 79.2% |
| 2023/24 | • | 1903 | 79.8% | 78.2% | 81.4% | 85.7% | 80.4% |
| 2024/25 | • | 2164 | 78.9% | 77.4% | 80.4% | 85.6% | 81.4% |
Source: OHID, based on interim reporting data for universal health visiting services
For 2024/25, the percentage of 2-2.5 year old children assessed on the ASQ-3 achieving the expected level in achieving the expected level in communication skills, fine and gross motor skills, problem-solving skills and personal-social skills were all statistically significantly lower in Hull compared to England.
Compared with benchmark
| Indicator | Period | England | Yorkshire and the Humber region (statistical) | Kingston upon Hull | East Riding of Yorkshire | North East Lincolnshire | North Lincolnshire | York | North Yorkshire UA | Barnsley | Doncaster | Rotherham | Sheffield | Bradford | Calderdale | Kirklees | Leeds | Wakefield |
|---|---|---|---|---|---|---|---|---|---|---|---|---|---|---|---|---|---|---|
Child development: percentage of children achieving the expected level in communication skills at 2 to 2 and a half years (Persons 2-2.5 yrs) | 2024/25 | 87.6 | 89.9 | 80.4 | 93.4 | 82.2 | 89.9 | 94.8 | 91.3 | 88.7 | 91.4 | 91.6 | 88.6 | 89.0 | 90.8 | 87.4 | 93.5 | 91.2 |
Child development: percentage of children achieving the expected level in gross motor skills at 2 to 2 and a half years (Persons 2-2.5 yrs) | 2024/25 | 93.6 | 95.3 | 89.0 | 96.2 | 92.9 | 95.1 | 97.0 | 96.8 | 95.1 | 95.4 | 96.8 | 96.2 | 95.2 | 95.2 | 94.1 | 95.5 | 96.6 |
Child development: percentage of children achieving the expected level in fine motor skills at 2 to 2 and a half years (Persons 2-2.5 yrs) | 2024/25 | 93.7 | 96.1 | 90.2 | 97.5 | 94.4 | 96.2 | 98.7 | 95.8 | 96.9 | 96.3 | 98.6 | 95.7 | 94.7 | 98.3 | 97.3 | 96.2 | 97.3 |
Child development: percentage of children achieving the expected level in problem solving skills at 2 to 2 and a half years (Persons 2-2.5 yrs) | 2024/25 | 93.0 | 94.0 | 87.4 | 96.7 | 93.2 | 93.8 | 97.4 | 95.1 | 93.4 | 95.1 | 95.5 | 93.9 | 91.9 | 95.2 | 93.5 | 94.1 | 96.2 |
Child development: percentage of children achieving the expected level in personal social skills at 2 to 2 and a half years (Persons 2-2.5 yrs) | 2024/25 | 91.8 | 93.4 | 86.7 | 96.0 | 91.6 | 93.9 | 96.8 | 94.4 | 92.6 | 93.9 | 94.5 | 93.6 | 91.3 | 95.6 | 93.6 | 93.6 | 95.2 |
In general, the percentages have been consistently high in Hull compared to England. However, given Hull’s high levels of deprivation, it is possible that the figures do not reflect the situation in Hull, and it is acknowledged that there have been data quality issues associated with these indicators.
Compared with benchmark
Child development: percentage of children achieving the expected level in communication skills at 2 to 2 and a half years (Persons 2-2.5 yrs)
|
Period
|
Kingston upon Hull |
Yorkshire and the Humber region (statistical)
|
England
|
||||
|---|---|---|---|---|---|---|---|
|
Count
|
Value
|
95%
Lower CI |
95%
Upper CI |
||||
| 2017/18 | • | 2425 | 93.2% | 92.1% | 94.1% | 91.5% | 88.8% |
| 2018/19 | • | 2489 | 93.5% | 92.5% | 94.4% | 92.0% | 90.0% |
| 2019/20 | • | 2433 | 91.3% | 90.2% | 92.3% | 90.4% | 88.9% |
| 2020/21 | • | 2361 | 94.0% | 93.0% | 94.8% | 89.6% | 86.8% |
| 2021/22 | • | 2260 | 88.9% | 87.6% | 90.0% | 86.6% | 86.5% |
| 2022/23 | • | 2012 | 91.4% | 90.1% | 92.5% | 89.0% | 85.3% |
| 2023/24 | • | 2044 | 85.7% | 84.3% | 87.1% | 89.8% | 86.6% |
| 2024/25 | • | 2203 | 80.4% | 78.8% | 81.8% | 89.9% | 87.6% |
Source: OHID, based on interim reporting data for universal health visiting services
Child development: percentage of children achieving the expected level in gross motor skills at 2 to 2 and a half years (Persons 2-2.5 yrs)
|
Period
|
Kingston upon Hull |
Yorkshire and the Humber region (statistical)
|
England
|
||||
|---|---|---|---|---|---|---|---|
|
Count
|
Value
|
95%
Lower CI |
95%
Upper CI |
||||
| 2017/18 | • | 2521 | 96.8% | 96.1% | 97.5% | 95.0% | 91.5% |
| 2018/19 | • | 2585 | 97.1% | 96.4% | 97.7% | 96.2% | 93.5% |
| 2019/20 | • | 2590 | 97.2% | 96.5% | 97.8% | 94.5% | 93.8% |
| 2020/21 | • | 2488 | 99.0% | 98.5% | 99.3% | 94.3% | 91.8% |
| 2021/22 | • | 2448 | 96.3% | 95.5% | 96.9% | 93.1% | 93.4% |
| 2022/23 | • | 1916 | 87.0% | 85.5% | 88.4% | 94.8% | 92.8% |
| 2023/24 | • | 2278 | 95.6% | 94.7% | 96.3% | 95.5% | 93.3% |
| 2024/25 | • | 2440 | 89.0% | 87.8% | 90.1% | 95.3% | 93.6% |
Source: OHID, based on interim reporting data for universal health visiting services
Child development: percentage of children achieving the expected level in fine motor skills at 2 to 2 and a half years (Persons 2-2.5 yrs)
|
Period
|
Kingston upon Hull |
Yorkshire and the Humber region (statistical)
|
England
|
||||
|---|---|---|---|---|---|---|---|
|
Count
|
Value
|
95%
Lower CI |
95%
Upper CI |
||||
| 2017/18 | • | 2542 | 97.7% | 97.0% | 98.2% | 94.7% | 92.0% |
| 2018/19 | • | 2598 | 97.6% | 96.9% | 98.1% | 96.2% | 94.0% |
| 2019/20 | • | 2568 | 96.4% | 95.6% | 97.0% | 94.9% | 94.1% |
| 2020/21 | • | 2491 | 99.1% | 98.7% | 99.4% | 94.4% | 92.0% |
| 2021/22 | • | 2461 | 96.8% | 96.0% | 97.4% | 93.1% | 93.2% |
| 2022/23 | • | 2134 | 96.9% | 96.1% | 97.6% | 96.0% | 92.6% |
| 2023/24 | • | 2295 | 96.3% | 95.4% | 97.0% | 96.1% | 93.3% |
| 2024/25 | • | 2473 | 90.2% | 89.1% | 91.3% | 96.1% | 93.7% |
Source: OHID, based on interim reporting data for universal health visiting services
Child development: percentage of children achieving the expected level in problem solving skills at 2 to 2 and a half years (Persons 2-2.5 yrs)
|
Period
|
Kingston upon Hull |
Yorkshire and the Humber region (statistical)
|
England
|
||||
|---|---|---|---|---|---|---|---|
|
Count
|
Value
|
95%
Lower CI |
95%
Upper CI |
||||
| 2017/18 | • | 2537 | 97.5% | 96.8% | 98.0% | 95.3% | 91.9% |
| 2018/19 | • | 2595 | 97.5% | 96.8% | 98.0% | 96.5% | 94.3% |
| 2019/20 | • | 2585 | 97.0% | 96.3% | 97.6% | 94.8% | 93.9% |
| 2020/21 | • | 2473 | 98.4% | 97.8% | 98.8% | 94.4% | 91.9% |
| 2021/22 | • | 2430 | 95.6% | 94.7% | 96.3% | 92.3% | 92.7% |
| 2022/23 | • | 2044 | 92.8% | 91.7% | 93.8% | 93.7% | 91.8% |
| 2023/24 | • | 2102 | 88.2% | 86.8% | 89.4% | 93.7% | 92.5% |
| 2024/25 | • | 2396 | 87.4% | 86.1% | 88.6% | 94.0% | 93.0% |
Source: OHID, based on interim reporting data for universal health visiting services
Child development: percentage of children achieving the expected level in personal social skills at 2 to 2 and a half years (Persons 2-2.5 yrs)
|
Period
|
Kingston upon Hull |
Yorkshire and the Humber region (statistical)
|
England
|
||||
|---|---|---|---|---|---|---|---|
|
Count
|
Value
|
95%
Lower CI |
95%
Upper CI |
||||
| 2017/18 | • | 2532 | 97.3% | 96.6% | 97.8% | 94.8% | 91.3% |
| 2018/19 | • | 2593 | 97.4% | 96.7% | 97.9% | 94.9% | 92.9% |
| 2019/20 | • | 2565 | 96.3% | 95.5% | 96.9% | 94.4% | 92.9% |
| 2020/21 | • | 2450 | 97.5% | 96.8% | 98.0% | 93.8% | 90.2% |
| 2021/22 | • | 2385 | 93.8% | 92.8% | 94.7% | 91.4% | 91.1% |
| 2022/23 | • | 2085 | 94.7% | 93.7% | 95.5% | 93.3% | 90.3% |
| 2023/24 | • | 2250 | 94.4% | 93.4% | 95.2% | 93.7% | 91.2% |
| 2024/25 | • | 2377 | 86.7% | 85.4% | 87.9% | 93.4% | 91.8% |
Source: OHID, based on interim reporting data for universal health visiting services
School Readiness Measured in Reception Year
‘School readiness’ is also measured at the end of Reception year (Early Years Foundation Stage) to ascertain if a child is achieving the expected level of development for their age in preparation for the child entering school Year 1.
The overall percentages achieving a good level of development at the end of Reception year and the percentage achieving the expected level in communication, language and literacy skills at the end of Reception in Hull was slightly lower than England for 2024/25 despite Hull’s increased levels of deprivation (65.3% versus 68.3%). However, due to the relatively large number of children measured the differences are statistically significantly lower in Hull than England.
For the subset of children who are eligible for school meals though, Hull performs statistically significantly better than England with 56.1% achieving a good level of development at the end of Reception compared to 51.3% for England.
Around two-thirds of Hull’s of children at the end of Reception are at the expected level or above for their development in communication, language and literacy skills for 2024/25 which is statistically significantly lower than England where almost seven in ten achieve the expected level.
Compared with benchmark
| Indicator | Period | England | Yorkshire and the Humber region (statistical) | Kingston upon Hull | East Riding of Yorkshire | North East Lincolnshire | North Lincolnshire | York | North Yorkshire UA | Barnsley | Doncaster | Rotherham | Sheffield | Bradford | Calderdale | Kirklees | Leeds | Wakefield |
|---|---|---|---|---|---|---|---|---|---|---|---|---|---|---|---|---|---|---|
School readiness: percentage of children achieving a good level of development at the end of Reception (Persons 5 yrs) | 2024/25 | 68.3 | 66.2 | 65.3 | 68.5 | 66.7 | 66.7 | 71.4 | 70.6 | 67.9 | 67.5 | 64.9 | 65.5 | 61.9 | 65.3 | 66.4 | 63.9 | 69.6 |
School readiness: percentage of children with free school meal status achieving a good level of development at the end of Reception (Persons 5 yrs) | 2024/25 | 51.3 | 49.2 | 56.1 | 45.8 | 54.6 | 49.7 | 46.7 | 45.5 | 56.0 | 53.5 | 44.2 | 46.5 | 50.4 | 44.5 | 50.5 | 45.8 | 53.2 |
School readiness: percentage of children achieving at least the expected level of development in communication and language and literacy skills at the end of Reception (Persons 5 yrs) | 2024/25 | 69.7 | 67.5 | 66.0 | 70.6 | 67.2 | 67.7 | 72.3 | 72.2 | 68.8 | 68.2 | 66.2 | 66.6 | 62.8 | 66.5 | 68.0 | 65.5 | 70.6 |
Data is not available for 2019/20 and 2020/21 as assessments were not undertaken in schools due to national lockdowns for the COVID-19 pandemic. Schools were closed to the majority of pupils between the end of March 2020 to the end of the school year in July 2020, and during the majority of the Spring term between Christmas and Easter in 2021 (opening a couple of weeks prior to the Easter school holiday). The historical data prior to this has now not been included in Fingertips, but between 2012/13 and 2018/19, there had been a consistent improvement in the percentages of children in reception year achieving a good level of development in Hull. There was a sharp improvement in the first 3-4 years as the new assessment became established, with slight improvements thereafter.
Prior to the COVID-19 pandemic during the 2018/19 school year, 67.7% of children in Reception year achieved a good level of development in Hull compared to 71.8% for England and 70.0% for the region.
It is possible that the post-pandemic decrease to around 65% achieving a good level of development at the end of Reception year is associated with the impact of the COVID-19 pandemic on child development, although the decrease between 2018/19 and 2024/25 was marginally larger for England (4.8% decrease) compared to Hull (3.5% decrease).
In 2024/25, 1,965 children out of 3,010 children achieved a good level of development at the end of Reception year.
Compared with benchmark
School readiness: percentage of children achieving a good level of development at the end of Reception (Persons 5 yrs)
|
Period
|
Kingston upon Hull |
Yorkshire and the Humber region (statistical)
|
England
|
||||
|---|---|---|---|---|---|---|---|
|
Count
|
Value
|
95%
Lower CI |
95%
Upper CI |
||||
| 2021/22 | • | 2049 | 65.0% | 63.3% | 66.7% | 64.4% | 65.2% |
| 2022/23 | • | 2083 | 65.5% | 63.8% | 67.1% | 66.1% | 67.2% |
| 2023/24 | • | 1974 | 64.5% | 62.8% | 66.2% | 66.1% | 67.7% |
| 2024/25 | • | 1965 | 65.3% | 63.6% | 67.0% | 66.2% | 68.3% |
Source: Department for Education
Prior to the COVID-19 pandemic during the 2018/19 school year, 58.8% of children in Reception year who were eligible for free school meals achieved a good level of development in Hull compared to 56.5% for England and 54.1% for the region. So there have been reductions also within the cohort of children who are eligible for free school meals. However, the reduction between 2018/19 and 2024/25 at 4.6% was smaller in Hull compared to England (-9.2%).
In 2024/25, 380 children out of 677 children who were eligible for free school meals achieved a good level of development at the end of Reception year.
Compared with benchmark
School readiness: percentage of children with free school meal status achieving a good level of development at the end of Reception (Persons 5 yrs)
|
Period
|
Kingston upon Hull |
Yorkshire and the Humber region (statistical)
|
England
|
||||
|---|---|---|---|---|---|---|---|
|
Count
|
Value
|
95%
Lower CI |
95%
Upper CI |
||||
| 2021/22 | • | 472 | 59.7% | 56.2% | 63.0% | 48.7% | 49.1% |
| 2022/23 | • | 449 | 56.3% | 52.8% | 59.7% | 50.5% | 51.6% |
| 2023/24 | • | 377 | 55.0% | 51.2% | 58.6% | 50.1% | 51.5% |
| 2024/25 | • | 380 | 56.1% | 52.4% | 59.8% | 49.2% | 51.3% |
Source: Department for Education
The percentage of children achieving at least the expected level of development in communication, language and literacy skills at the end of Reception also decreased in Hull from 68.0% for 2018/19 to 66.0% for 2024/25.
In 2024/25, 1,987 children out of 3,010 children achieved at least the expected level of development in communication, language and literacy skills at their end of reception year.
Compared with benchmark
School readiness: percentage of children achieving at least the expected level of development in communication and language and literacy skills at the end of Reception (Persons 5 yrs)
|
Period
|
Kingston upon Hull |
Yorkshire and the Humber region (statistical)
|
England
|
||||
|---|---|---|---|---|---|---|---|
|
Count
|
Value
|
95%
Lower CI |
95%
Upper CI |
||||
| 2021/22 | • | 2074 | 65.8% | 64.2% | 67.5% | 65.9% | 67.1% |
| 2022/23 | • | 2107 | 66.3% | 64.6% | 67.9% | 67.5% | 68.8% |
| 2023/24 | • | 2003 | 65.5% | 63.8% | 67.1% | 67.4% | 69.2% |
| 2024/25 | • | 1987 | 66.0% | 64.3% | 67.7% | 67.5% | 69.7% |
Source: Department for Education
Expected Levels Among Year 1 Children
Fingertips also presents information on the percentage of children in Year 1 who are at the expected level in terms of phonics screening check.
For 2024/25, a similar percentage of children achieved a good level of development in the phonic screening in Hull (79.5%) compared to England (79.8%), but a statistically significantly higher percentage of children in Hull who were eligible for free school meals among children achieved a good level of development in the phonic screening compared with England (71.6% versus 66.6%).
Compared with benchmark
| Indicator | Period | England | Yorkshire and the Humber region (statistical) | Kingston upon Hull | East Riding of Yorkshire | North East Lincolnshire | North Lincolnshire | York | North Yorkshire UA | Barnsley | Doncaster | Rotherham | Sheffield | Bradford | Calderdale | Kirklees | Leeds | Wakefield |
|---|---|---|---|---|---|---|---|---|---|---|---|---|---|---|---|---|---|---|
School readiness: percentage of children achieving the expected level in the phonics screening check in Year 1 (Persons 6 yrs) | 2024/25 | 79.8 | 79.9 | 79.5 | 80.1 | 80.5 | 76.7 | 80.6 | 82.0 | 84.7 | 79.8 | 77.0 | 76.3 | 77.7 | 81.0 | 80.5 | 80.4 | 84.2 |
School readiness: percentage of children with free school meal status achieving the expected level in the phonics screening check in Year 1 (Persons 6 yrs) | 2024/25 | 66.6 | 67.9 | 71.6 | 65.1 | 69.7 | 64.3 | 64.5 | 64.3 | 78.6 | 68.8 | 62.2 | 64.4 | 69.9 | 67.6 | 70.9 | 65.7 | 73.5 |
Again, assessments were not completed in 2019/20 and 2020/21 due to the COVID-19 lockdowns and schools being closed for part of the school year.
The trends over time follow a similar pattern to that for ‘school readiness’ measured at the end of reception year. Quite large increases were observed after the assessments were first introduced as schools got used to the new assessments, and after they were established, there were much smaller increases in the percentages achieving the expected levels of development. There was a decrease in Hull between 2018/19 and 2021/22 likely associated with the pandemic, but the percentage has increased since, and remains at pre-pandemic levels in 2024/25.
Compared with benchmark
School readiness: percentage of children achieving the expected level in the phonics screening check in Year 1 (Persons 6 yrs)
|
Period
|
Kingston upon Hull |
Yorkshire and the Humber region (statistical)
|
England
|
||||
|---|---|---|---|---|---|---|---|
|
Count
|
Value
|
95%
Lower CI |
95%
Upper CI |
||||
| 2011/12 | • | 1529 | 51.3% | 49.5% | 53.1% | 57.3% | 57.9% |
| 2012/13 | • | 1932 | 62.8% | 61.0% | 64.5% | 67.2% | 69.1% |
| 2013/14 | • | 2161 | 65.9% | 64.3% | 67.5% | 72.3% | 74.2% |
| 2014/15 | • | 2370 | 72.8% | 71.3% | 74.3% | 74.1% | 76.8% |
| 2015/16 | • | 2584 | 76.8% | 75.4% | 78.2% | 78.4% | 80.5% |
| 2016/17 | • | 2639 | 77.4% | 76.0% | 78.8% | 78.8% | 81.1% |
| 2017/18 | • | 2872 | 80.0% | 78.6% | 81.2% | 80.3% | 82.5% |
| 2018/19 | • | 2707 | 79.2% | 77.8% | 80.5% | 80.2% | 81.8% |
| 2021/22 | • | 2562 | 77.0% | 75.6% | 78.4% | 75.3% | 75.5% |
| 2022/23 | • | 2585 | 79.7% | 78.3% | 81.0% | 79.2% | 78.8% |
| 2023/24 | • | 2604 | 80.3% | 78.9% | 81.7% | 80.4% | 80.2% |
| 2024/25 | • | 2455 | 79.5% | 78.1% | 80.9% | 79.9% | 79.8% |
Source: Department for Education
The trends over time in the percentage of children in Year 1 who are at the expected level in terms of phonics screening check followed a similar pattern for the subset eligible for free school meals although there was no such reduction between 2018/19 and 2021/22. The percentage in Hull decreased has marginally in the last two year, but the rate in Hull has been statistically significantly higher than England in each year since the pandemic.
Compared with benchmark
School readiness: percentage of children with free school meal status achieving the expected level in the phonics screening check in Year 1 (Persons 6 yrs)
|
Period
|
Kingston upon Hull |
Yorkshire and the Humber region (statistical)
|
England
|
||||
|---|---|---|---|---|---|---|---|
|
Count
|
Value
|
95%
Lower CI |
95%
Upper CI |
||||
| 2011/12 | • | 436 | 40.4% | 37.6% | 43.4% | 43.0% | 44.5% |
| 2012/13 | • | 602 | 55.2% | 52.2% | 58.1% | 53.5% | 55.8% |
| 2013/14 | • | 552 | 55.0% | 51.9% | 58.0% | 58.9% | 61.3% |
| 2014/15 | • | 574 | 65.3% | 62.1% | 68.4% | 61.5% | 64.7% |
| 2015/16 | • | 547 | 68.9% | 65.6% | 72.0% | 65.9% | 68.6% |
| 2016/17 | • | 603 | 70.0% | 66.8% | 72.9% | 65.4% | 68.4% |
| 2017/18 | • | 604 | 70.2% | 67.0% | 73.1% | 66.9% | 70.1% |
| 2018/19 | • | 585 | 69.9% | 66.7% | 72.9% | 68.2% | 70.1% |
| 2021/22 | • | 733 | 71.0% | 68.2% | 73.7% | 62.4% | 62.0% |
| 2022/23 | • | 749 | 74.1% | 71.3% | 76.7% | 67.9% | 66.5% |
| 2023/24 | • | 696 | 73.8% | 70.9% | 76.5% | 68.9% | 68.1% |
| 2024/25 | • | 659 | 71.6% | 68.6% | 74.4% | 67.9% | 66.6% |
Source: Department for Education
Early Help
More information on the reasons for referral for early help is available on Hull’s Early Help and Prevention Programme within Child Development under Children and Young People, and this can give an indication around the needs of children living in Hull.
Strategic Need and Service Provision
As a good education is very important for future health and wellbeing, it is essential that children are ready for school, and children and young people are able to maximise their achievements whilst at school, college and university, so that they can have good employment prospects. Children potentially requiring additional support should be assessed as quickly as possible as early help gives rise to better outcomes. Children with an Education and Health Care plan or in receipt of Special Educational Needs support need to have clear, comprehensive, integrated plans drawn up as soon as possible, with all professionals and the family working together to give the child the best possible care and support. There should also be promotion of physical and mental wellbeing across all educational settings.
Therefore it is essential that children and families requiring help can access the right help quickly. It is also imperative that service providers as part of their routine visits and child assessments seek out children and families who require help as not all those who require help will ask for help. More information is available on Hull’s Early Help and Prevention Programme within Child Development under Children and Young People. The model of support from Hull’s Early Help and Prevention Programme reduces demand for specialist and acute services by using a joined up and evidence based approach to Early Help, resulting in improved outcomes and life chances for families through their needs being met earlier.
Resources
The Office for Health Improvement & Disparities’ Fingertips. https://fingertips.phe.org.uk
Marmot, M., Fair society, healthy lives: the Marmot review: strategic review of health inequalities in England post-2010. University College London Institute of Health: London, 2010.
A Bus, A.G., M.H. van IJzendoorn, and A.D. Pellegrini, Joint book reading makes for success in learning to read: a meta-analysis on intergenerational transmission of literacy. Review of Educational Research, 1995. 65(1): p. 1-21.
Lexmond, J. and R. Reeves, Building Character. 2009, Demos.: London.
National Institute for Health and Care Excellence, Social and emotional wellbeing for children and young people: Local government briefing. www.nice.org.uk. 2013, National Institute for Health and Care Excellence: London.
Bynner, J., Childhood risks and protective factors in social exclusion. 2001, London: Institute of Education.
Farrington, D., Explaining and preventing crime: the globalization of knowledge. 1999: The American Society of Criminology.
Utting, D., Suggestions for the UK: an overview of possible action.
Department for Education, Early years evidence pack: pack summarising evidence on achievement at the early years foundation stage. 2011, Department for Education: London.
Early Help. Service Guide and Performance Review 2019/20. Hull City Council, 2020.
Hull’s Early Help and Prevention Strategy 2021-25. https://www.hull.gov.uk/downloads/file/1726/Hull_Early_Help_and_Prevention_Strategy_2021_25.pdf
Updates
This page was last updated / checked on 23 April 2026.
This page is due to be updated / checked in September 2026.