Index
This topic area covers statistics and information relating to crime in Hull including local strategic need and service provision. Further information can also be found within Domestic Abuse under Health and Wellbeing Influences. A needs assessment was completed in Hull during 2023 for people with multiple unmet needs which included people involved with the criminal justice system. The report – which was finalised in 2024 – is available within Multiple Unmet Needs under Vulnerable Groups.
This page contains information from the Office for Health Improvement & Disparities’ Fingertips. Information is taken ‘live’ from the site so uses the latest available data from Fingertips and displays it on this page. As a result, some comments on this page may relate to an earlier period of time until this page is next updated (see review dates at the end of this page).
Headlines
- Crime and the fear of crime can have a high impact on people’s mental wellbeing, but can also affects their families and community.
- The total number of reported crimes and incidents of anti-social behaviour that occurred in Hull has been decreasing over the last five years with an average of 3,113 crimes and incidents of anti-social behaviour per month during 2025/26. This compares to an average of 3,459 crimes and incidents of anti-social behaviour per month for 2021/22 and 3,821 for 2018/19.
- Violent and sexual offences account for the largest percentage of reported crime with 1,280 reported incidents per month during 2025/26 representing 41.1% of all reported crimes and incidents of anti-social behaviour. The total number has decreased slightly from 1,297 on average per month in 2024/23, with the percentage also decreasing, from 41.6% last year.
- Over the past five years, that is comparing 2021/22 with 2025/26, crimes of violence and sexual offences decreased only slightly (by 3%), with larger decreases seen for criminal damage and arson (-32%), public order offences (-24%), bicycle theft (-19%), burglaries (-8%) and theft from the person (-6%). Recorded incidents of anti-social behaviour saw a 52% decrease over the past five years, from an average of 450 incidents per month in 2021/22 to an average of 215 per month in 2025/26. Crimes of shoplifting increased by 54% since 2021/22, possession of weapons increased by 93% (although a very small, less than 1%, proportion of overall crime) and robbery increased by 74% (but again a small (1.3%) fraction of overall crime. The number of drug offences rose by 62% over the five years to 2025/26, exceeding the previous peak seen in 2020/21.
- During 2025/26, violent and sexual offences account for 41% of all reported crimes and anti-social behaviour incidents, while incidents of shoplifting (10%), public order (10%), criminal damage and arson (9%), and anti-social behaviour (7%) accounting for more than one-third of the reported incidents.
- Across Humberside Police Area (covering Hull, East Riding of Yorkshire, North East Lincolnshire and North Lincolnshire), the rate per 1,000 of 16+ population of recorded domestic abuse-related incidents and crimes increased between 2015/16 and 2018/19 (peaking at 36.6), but then decreased slowly in each subsequent year to a low of 30.2 per 1,000 population in 2022/23. However, the rate increased to 36.1 in 2023/24 and then to 39.9 incidents per 1,000 population for 2024/25, higher than the earlier peak. It is likely that the rates are higher in Hull relative to the Humberside Police Area average, and anecdotal evidence suggests there has been an increase in domestic abuse in recent years, particularly during the COVID-19 pandemic. Local services have recently seen a 100% increase in demand.
- The rate of hospital admissions due to violence has decreased since 2009/10-2011/12, with the largest decreases mainly in the first four to five years, with little change in the rate between 2014/15-2016/17 and 2017/18-2019/20, although decreases did occur in 2018-19-2020/21 and 2019/20-2021/22. However, in 2021/22-2023/24 the rate increased to 56.0 admissions per 100,000 population, with a further small increase in 2022/23-2024/25 to 56.8 per 100,000 population
- The rate of sexual offences increased sharply between 2010/11 and 2018/19, but decreased in 2019/20 and has stayed at broadly the same level since then. The rates are considerably higher than England. During 2024/25, there were 1,052 sexual offences reported (which excludes exposure and voyeurism). It is likely that part of the increase could be related to more willingness to report sexual offences and/or reporting of historical offences.
- The rate of violent offences increased sharply between 2010/11 and 2018/19, and has remained relatively unchanged since then. The rates are considerably higher than England. During 2024/25, there were 13,696 violent crimes (‘violence against the person’) reported.
- The city centre has the highest rate of crime (all crimes and anti-social behaviour incidents) per 1,000 resident population. This is not particularly surprising given the large increase in the non-resident population during the day as well as a substantial night time economy. Furthermore, it also has one of the highest concentrations of shops, parked cars and cycles, which increases the opportunities for crime. Some of the other areas of the city where the rates of crime and anti-social behaviour is relatively high also includes areas where shopping centres are located or areas with a night-time economy.
- In 2022, there were 629 first time offenders (aged 10+ years) in Hull equating to a rate of 269 per 100,000 population which was 62% higher than England (166). The rate has generally been decreasing in Hull since 2014 when the rate was 381 per 100,000 population. The percentage of offenders who re-offend within a year and the average number of re-offences per re-offender have both increased in the last year between 2022/23 and 2023/24. For 2023/24, there were 985 re-offenders (offending within one year) out of 2,906 (33.9%) offenders with on average 5.25 re-offences per re-offender so a total of 5,168 re-offences committed by the 985 re-offenders. The percentage reoffending and the average number of re-offences per re-offender are both higher in Hull (33.9% and 5.25 respectively) compared to England (28.1% and 4.75 respectively) for 2023/24.
- In 2024, there were 63 young people aged 10-17 years who received their first conviction, caution or youth caution in Hull. This equates to a rate of 225 first time entrants into the youth justice system per 100,000 population aged 10-17 years which is 63% higher than England (138 per 100,000 population). The numbers have fallen sharply since 2010 and 2011 when they are were around 200 first time entrants into the youth justice system among 10-17 year olds. In 2011, there were 924 young people aged 10-17 years who received their first conviction, caution or youth caution per 100,000 population with 220 young people in total. So the numbers have decreased to around one-quarter that number in the most recent year, 2024.
- Some changes over time can be related to better recording and focus on different crimes (such as domestic abuse), and changes to recording methods and ways of working. Clearly, the impact of the COVID-19 with lockdowns, and changes to behaviour such as working at home, less social contact, closures and restrictions on pubs will have had an influence on the crime figures for 2020 and 2021.
The Population Affected – Why Is It Important?
Unsurprisingly, research has found that the effect of local crime rates does affect the mental wellbeing of residents. Crime causes considerable mental distress of residents, and these effects are mainly driven by property crime. However, there is also an effect due to violent crime.
The Office for Health Improvement & Disparities (previously Public Health England) stated that individuals dependent on opioids and/or crack cocaine are responsible for an estimated 45% of acquisitive crime (shoplifting, burglary, vehicle crime and robbery), and around 40% of all violent crimes are alcohol-related. Social return on investment tools for drugs and alcohol make the case for investing in drug and alcohol treatment programmes to reduce overall crime and anti-social behaviour to reduce costs incurred by drug and alcohol issues to society and the economy.
The Hull Picture
Humber Strategic Needs Assessment
The Humber Violence Prevention Partnership have produced a Strategic Needs Assessment which examines and analyses crime data to provide insight into serious violence in the Humber region. Producing a Strategic Needs Assessment is a Home Office requirement for all Violence Reduction Units and provides the evidence base for shaping response to strategy and commissioning interventions.
The data aims to identify priority crime types, drivers of serious violence, risk factors, people at risk, and hotspot locations and hot-times.
Their Strategic Needs Assessment for the Humber region is available at https://humbervpp.org/our-work/research-analysis
They found that data suggested an increase in 2023/24 for police recorded knife-enabled violence (up 10% from 793 to 900 crimes) with the number of hospital admissions for assault from a sharp object remaining the same for 2023/24 (60 admissions). Levels of police recorded serious violence remained similar in 2023/24 but violence involving under 25s decreased by 3%. The level of recorded violence increases from 15:00 to 02:59 with one-third occurring during the weekend. Violence is significantly more likely to occur in urban, densely populated areas with high levels of deprivation. Men and boys (53%) are more likely to be a victim of a violent act when compared to women and girls (47%). This likelihood increases when the outcome to the violent act is more severe. The opposite is true for domestic abuse flagged crimes. Men and boys are responsible for perpetrating three-quarters of police recorded serious violence. Most people involved with serious violence were aged between 15 and 39 years. One-third of people suffering and perpetrating violence are aged 25 years or under. There has been an increase in the prevalence of children missing from education. This is seen in the data as more absences and suspensions from school and more parents are choosing to provide education at home (elective home education).
The evidence suggests that the drivers of serious violence in the Humber region are: increased prevalence of traumatic adverse childhood experiences, increased exposure to violence in the family and neighbourhood, increased feelings of vulnerability and a need for self-protection, increased exposure to situational risk leading to an increased chance of experiencing violence, and increased perception that status can only be gained through illegitimate means.
Total Number Crimes and Types of Crimes
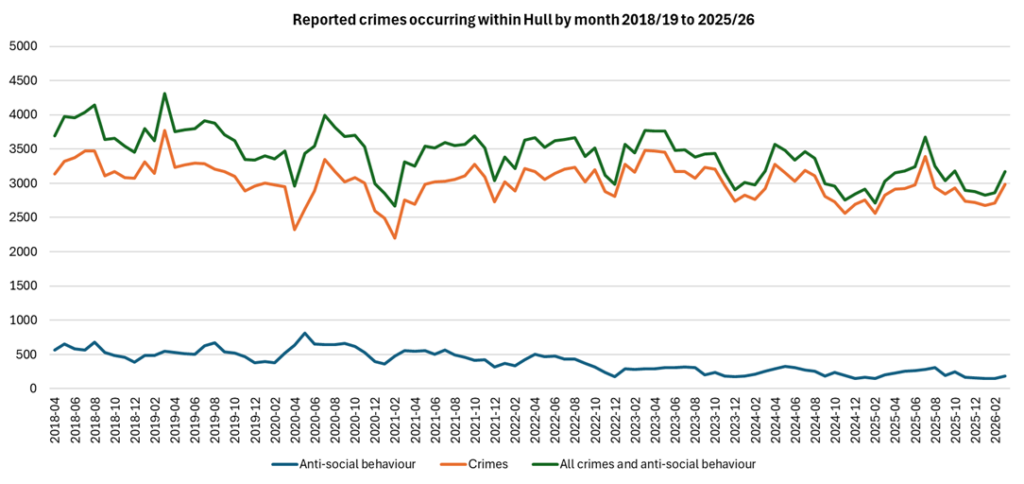
From Humberside Police data, there were 34,769 recorded crimes and a further 2,582 incidents of anti-social behaviour for the latest financial year 2025/26 in Hull. There were fewer reported crimes during the COVID-19 pandemic with the lockdowns and changes to people’s behaviour, but proportionately more incidents of anti-social behaviour. The total number of recorded incidents of anti-social behaviour has been falling and for 2025/26 is less than half of what it was in 2019/20. The total number of crimes and anti-social behaviour combined has also decreased over time.
| Financial year | Anti-social behaviour | All crimes | All crime and ASB |
| 2018/19 | 6,412 | 39,439 | 45,851 |
| 2019/20 | 6,026 | 37,336 | 43,362 |
| 2020/21 | 6,975 | 33,519 | 40,494 |
| 2021/22 | 5,396 | 36,108 | 41,504 |
| 2022/23 | 4,272 | 37,640 | 41,912 |
| 2023/24 | 2,988 | 36,998 | 39,986 |
| 2024/25 | 2,726 | 34,693 | 37,419 |
| 2025/26 | 2,582 | 34,769 | 37,351 |
Total number of reported crimes and incidents of anti-social behaviour in Hull by financial year
The total number of recorded incidents of anti-social behaviour varied between 148 and 809 per month between April 2018 and March 2026. The number of incidents has been generally decreasing with a peak during the first lockdown during the COVID-19 pandemic (lockdown started at the end of March 2020) and the lowest number of incidents of anti-social behaviour occurred more recently in February 2025.
The total number of recorded crimes has also been decreasing over time with the highest number occurring in 2018/19 with a peak of 3,772 recorded crimes during March 2019. The total number of reported crimes per month varied between 3,075 and 3,772 per month during 2018/19. The total number of crimes dipped to 2,323 in April 2020 and to a low of 2,195in February 2021, and both decreases will be associated with the pandemic and occurred in periods of lockdowns for the pandemic. The total number of reported crimes per month varied between 2,712 and 3,396 per month during the latest financial year 2025/26.
Over the last five years, violence and sexual offences accounted for the greatest numbers of reported crimes with around 1,100 to 1,500 such crimes each month. Public order offences had the second highest monthly average (350 per month) followed by criminal damage and arson (320 per month), and anti-social behavioural (300 per month), although the patterns over time differed.
There has been little change in the reported number of violence and sexual offences and public order offences over the last five years (decreasing by 3% in 2025/26 compared with 2021/22), but a large reduction over this time period for criminal damage (32% decrease since 2021/22). Reported cases of anti-social behaviour peaked during the COVID-19 pandemic, but have since decreased to levels considerably lower than pre-pandemic levels, more than halving since 2021/22. Levels of shoplifting were highest pre-pandemic, reducing considerably for both 2020/21 and 2021/22, but have increased by just over one-third in 2022/23, and by a further 17% in 2023/24. Although fractionally lower than in 2023/24 the number of reported shoplifting crimes in 2025/26 was 54% higher than in 2021/22, with these increases likely associated in part to the cost of living crisis. Although constituting a small fraction of overall crimes (less than 1%), possession of weapons increased by 93% since 2021/22. Similarly, robbery rose by 74% since 2021/22, but again constituted a small fraction of overall crime in 2025/26 (1.3%). The number of drug offences increased by 62% between 2021/22 and 2025/26, exceeding the previous peak seen in 2020/21.
Anti-social behaviour, criminal damage and arson, public order offences, bicycle theft, burglaries and theft from the person all decreased between 2021/22 and 2025/26, by 52%, 32%, 24%, 19%, 8% and 6% respectively. Other crimes, which include forgery, perjury and other miscellaneous crime (an eclectic grouping of offences, for example (but not limited to) bail offences, wildlife crime, dangerous driving and bigamy) also decreased between 2021/22 and 2025/26 by 12%.
| Crime type (monthly average number) | 2018/19 | 2019/20 | 2020/21 | 2021/22 | 2022/23 | 2023/24 | 2024/25 | 2025/26 |
| Violence and sexual offences | 1,184 | 1,182 | 1,205 | 1,317 | 1,279 | 1,368 | 1,297 | 1,280 |
| Shoplifting | 381 | 315 | 193 | 195 | 262 | 306 | 287 | 301 |
| Public order | 296 | 325 | 373 | 390 | 413 | 357 | 296 | 297 |
| Criminal damage and arson | 424 | 416 | 340 | 386 | 362 | 308 | 268 | 263 |
| Anti-social behaviour | 534 | 502 | 581 | 450 | 356 | 249 | 227 | 215 |
| Other theft | 255 | 216 | 174 | 191 | 221 | 212 | 203 | 200 |
| Burglary | 255 | 241 | 185 | 155 | 197 | 185 | 174 | 143 |
| Vehicle crime | 205 | 164 | 93 | 106 | 131 | 91 | 101 | 113 |
| Drugs | 46 | 47 | 60 | 47 | 35 | 38 | 53 | 76 |
| Bicycle theft | 90 | 65 | 36 | 68 | 85 | 66 | 54 | 55 |
| Robbery | 33 | 27 | 24 | 23 | 31 | 36 | 28 | 40 |
| Possession of weapons | 17 | 18 | 18 | 15 | 20 | 23 | 25 | 29 |
| Theft from person | 30 | 24 | 12 | 16 | 19 | 19 | 22 | 15 |
| Other crime | 72 | 71 | 79 | 99 | 83 | 77 | 85 | 87 |
| Total | 3,821 | 3,614 | 3,375 | 3,459 | 3,493 | 3,332 | 3,118 | 3,113 |
Whilst anti-social behaviour accounted for 17.3% of all recorded crime and anti-social behaviour in 2020/21, this had decreased to 7.5% by 2023/24. Violence and sexual offences accounted for the greatest numbers of recorded crimes – more than one-third of all recorded crimes and anti-social behaviour incidents (41.1% in 2023/24). Public order accounted for one in nine of all recorded recorded crime and anti-social behaviour in 2023/24, while both criminal damage and arson, and shoplifting each accounted for around one in eleven of all incidents in 2023/24. Anti-social behaviour, other theft, burglary, vehicle crime, bicycle theft, robbery and theft from a person accounted for around one-third of all recorded crimes and anti-social behaviour incidents in 2019/20, but this was reduced to 25.8% for 2023/24.
| Crime type | 2018/19 (%) | 2019/20 (%) | 2020/21 (%) | 2021/22 (%) | 2022/23 (%) | 2023/24 (%) | 2024/25 (%) | 2025/26 (%) |
| Violence and sexual offences | 31.0 | 32.7 | 35.7 | 38.1 | 36.6 | 41.1 | 41.6 | 41.1 |
| Shoplifting | 10.0 | 8.7 | 5.7 | 5.6 | 7.5 | 9.2 | 9.2 | 9.7 |
| Public order | 7.8 | 9.0 | 11.1 | 11.3 | 11.8 | 10.7 | 9.5 | 9.5 |
| Criminal damage and arson | 11.1 | 11.5 | 10.1 | 11.2 | 10.4 | 9.2 | 8.6 | 8.5 |
| Anti-social behaviour | 14.0 | 13.9 | 17.2 | 13.0 | 10.2 | 7.5 | 7.3 | 6.9 |
| Other theft | 6.7 | 6.0 | 5.2 | 5.5 | 6.3 | 6.4 | 6.5 | 6.4 |
| Burglary | 6.7 | 6.7 | 5.5 | 4.5 | 5.6 | 5.6 | 5.6 | 4.6 |
| Vehicle crime | 5.4 | 4.5 | 2.8 | 3.1 | 3.8 | 2.7 | 3.2 | 3.6 |
| Drugs | 1.2 | 1.3 | 1.8 | 1.4 | 1.0 | 1.1 | 1.7 | 2.4 |
| Bicycle theft | 2.4 | 1.8 | 1.1 | 2.0 | 2.4 | 2.0 | 1.7 | 1.8 |
| Robbery | 0.9 | 0.7 | 0.7 | 0.7 | 0.9 | 1.1 | 0.9 | 1.3 |
| Possession of weapons | 0.4 | 0.5 | 0.5 | 0.4 | 0.6 | 0.7 | 0.8 | 0.9 |
| Theft from person | 0.8 | 0.7 | 0.4 | 0.5 | 0.5 | 0.6 | 0.7 | 0.5 |
| Other crime | 1.9 | 2.0 | 2.3 | 2.9 | 2.4 | 2.3 | 2.7 | 2.8 |
| Total | 100.0 | 100.0 | 100.0 | 100.0 | 100.0 | 100.0 | 100.0 | 100.0 |
Domestic Abuse and Violent Crime
The Office for Health Improvement and Disparities’ Fingertips tool presents information on the rate of domestic abuse-related incidents and crimes, and violent crime rates. For 2024/25, the rate of domestic abuse-related incidents and crimes was higher in Hull compared to England. The same crime rate is given for Hull, East Riding of Yorkshire, North Lincolnshire and North East Lincolnshire – local authorities are allocated the rate of the police force area within which they sit (in this case Humberside Police). It is likely that the rate will differ across the four local authorities, and the rate may be higher in Hull than other parts of the Humberside Police area. The local needs assessment of Multiple Unmet Need found that violent crime rates were 69% higher than England, and that Hull residents accounted for 50% of all first time offenders and 40% of all proven re-offenders and re-offences across the Humberside Police Area, so it is perhaps not unreasonable to assume that 45% of all crimes (or domestic abuse-related incidents and crimes) within the Humberside Police Area relate to Hull residents.
For the three year period 2022/23-2024/25, the hospital admission rate for violence was 78% higher in Hull compared to England.
For 2024/25, the rate of violent offences was 60% higher in Hull compared to England, and the rate of sexual offences was around 26% higher in Hull.
The rate of domestic abuse-related incidents and crimes, and violent and sexual offence crimes are given as the number of crimes per 1,000 population, and the hospital admission rate is given as a directly standardised rate per 100,000 population (standardised to the European Standard Population). Further information can also be found within Domestic Abuse under Health and Wellbeing Influences. Violent crimes include all ‘violence against the person’ offences (and do not include sexual offences). The rate of sexual offences include all sexual offences except for exposure and voyeurism.
Compared with benchmark
| Indicator | Period | England | Yorkshire and the Humber region (statistical) | Kingston upon Hull | East Riding of Yorkshire | North East Lincolnshire | North Lincolnshire | York | North Yorkshire UA | Barnsley | Doncaster | Rotherham | Sheffield | Bradford | Calderdale | Kirklees | Leeds | Wakefield |
|---|---|---|---|---|---|---|---|---|---|---|---|---|---|---|---|---|---|---|
Domestic abuse related incidents and crimes (Persons 16+ yrs) | 2024/25 | 26.8 | 34.4 | 39.9 | 39.9 | 39.9 | 39.9 | 15.7 | 15.7 | 32.7 | 32.7 | 32.7 | 32.7 | 40.1 | 40.1 | 40.1 | 40.1 | 40.1 |
Violent crime - hospital admissions for violence (including sexual violence) (Persons All ages) | 2022/23 - 24/25 | 31.9 | 37.8 | 56.8 | 28.5 | 62.9 | 42.4 | 31.5 | 24.2 | 66.7 | 57.1 | 43.4 | 44.2 | 30.4 | 32.5 | 35.1 | 25.9 | 45.6 |
Violent crime - violence offences per 1,000 population (Persons All ages) | 2024/25 | 31.4 | 40.0 | 50.2 | 22.5 | 46.9 | 32.5 | 25.1 | 20.2 | 36.7 | 43.7 | 36.0 | 33.6 | 54.2 | 48.1 | 41.0 | 46.4 | 49.0 |
Violent crime - sexual offences per 1,000 population (Persons All ages) | 2024/25 | 3.1 | 3.7 | 3.9 | 2.0 | 3.9 | 3.0 | 2.4 | 2.3 | 3.4 | 3.8 | 3.2 | 3.2 | 5.0 | 4.2 | 3.9 | 4.2 | 4.0 |
The rate of domestic abuse-related incidents and crimes have increased in recent years, and part of this increase might be attributed to better awareness and reporting, although rates did fall slightly in the three years between 2018/19 and 2021/22, with a larger decrease in 2022/23. However, the rate has increased for the most recent two years and is higher in 2024/25 than the previous peak observed in 2018/19 and 2019/20 prior to the pandemic.
Anecdotally it has been suggested that the rate of domestic abuse has increased in Hull, particularly during the pandemic. Local services have recently seen a 100% increase in demand as reported in the needs assessment of Multiple Unmet Need. Furthermore, not all domestic abuse will be reported or recorded as such if it were reported.
Further information can be found within Domestic Abuse under Health and Wellbeing Influences.
Compared with benchmark
Domestic abuse related incidents and crimes (Persons 16+ yrs)
|
Period
|
Kingston upon Hull |
Yorkshire and the Humber region (statistical)
|
England
|
||||
|---|---|---|---|---|---|---|---|
|
Count
|
Value
|
95%
Lower CI |
95%
Upper CI |
||||
| 2015/16 | • | - | 24.8 | - | - | 24.6 | 22.1 |
| 2016/17 | • | - | 30.0 | - | - | 26.4 | 22.6 |
| 2017/18 | • | - | 31.1 | - | - | 28.4 | 23.7 |
| 2018/19 | • | - | 36.6 | - | - | 32.8 | 25.8 |
| 2019/20 | • | - | 36.3 | - | - | 32.7 | 26.5 |
| 2020/21 | • | - | 34.9 | - | - | 34.5 | 28.0 |
| 2021/22 | • | - | 34.8 | - | - | 36.5 | 28.6 |
| 2022/23 | • | - | 30.2 | - | - | 36.3 | 28.3 |
| 2023/24 | • | - | 36.1 | - | - | 34.6 | 27.1 |
| 2024/25 | • | - | 39.9 | - | - | 34.4 | 26.8 |
Source: Office for National Statistics
Some crime information – particularly relating to domestic abuse – is only available at Humberside Police Area level, so it is useful to note the percentage that Hull residents account for in relation to the Humberside Police Area for crime measures that are available at local authority level.
For the three year period 2022/23 to 2024/25, there were 475 admissions for violence among Hull residents with 255 for East Riding of Yorkshire, 280 for North East Lincolnshire and 200 for North Lincolnshire. Based on mid-year 2024 population estimates, the total population of these four local authorities is 962,532 and with an estimated 275,401 residents in Hull, Hull residents accounted for 28.6% of the population. However, Hull residents account for 39.3% of admissions for violence.
Compared with benchmark
Violent crime - hospital admissions for violence (including sexual violence) (Persons All ages) 2022/23 - 24/25
| Area |
Recent
Trend |
Count
|
Value
|
95%
Lower CI |
95%
Upper CI |
|
|---|---|---|---|---|---|---|
| England | 55538 | 31.9 | 31.6 | 32.2 | ||
| Yorkshire and the Humber region (statistical) | 6295 | 37.8 | 36.9 | 38.8 | ||
| Kingston upon Hull | 475 | 56.8 | 51.7 | 62.2 | ||
| East Riding of Yorkshire | 255 | 28.5 | 25.1 | 32.3 | ||
| North East Lincolnshire | 280 | 62.9 | 55.6 | 70.8 | ||
| North Lincolnshire | 200 | 42.4 | 36.7 | 48.7 | ||
| York | 200 | 31.5 | 27.2 | 36.3 | ||
| North Yorkshire UA | 395 | 24.2 | 21.8 | 26.7 | ||
| Barnsley | 480 | 66.7 | 60.8 | 73.0 | ||
| Doncaster | 515 | 57.1 | 52.2 | 62.2 | ||
| Rotherham | 340 | 43.4 | 38.9 | 48.3 | ||
| Sheffield | 805 | 44.2 | 41.1 | 47.4 | ||
| Bradford | 520 | 30.4 | 27.8 | 33.1 | ||
| Calderdale | 195 | 32.5 | 28.1 | 37.4 | ||
| Kirklees | 465 | 35.1 | 32.0 | 38.5 | ||
| Leeds | 680 | 25.9 | 24.0 | 28.0 | ||
| Wakefield | 485 | 45.6 | 41.6 | 49.8 |
Source: OHID, based on NHS England and Office for National Statistics data
There were 13,696 violent offences reported in Hull during 2024/25 and 34,574 across the Humberside Police Area so Hull residents accounts for 39.6% of all violent offences across the Humberside Police Area.
Compared with benchmark
Violent crime - violence offences per 1,000 population (Persons All ages) 2024/25
| Area |
Recent
Trend |
Count
|
Value
|
95%
Lower CI |
95%
Upper CI |
|
|---|---|---|---|---|---|---|
| England | 1817639 | 31.4 | 31.3 | 31.4 | ||
| Yorkshire and the Humber region (statistical) | 224425 | 40.0 | 39.8 | 40.2 | ||
| Kingston upon Hull | 13696 | 50.2 | 49.3 | 51.0 | ||
| East Riding of Yorkshire | 7899 | 22.5 | 22.0 | 23.0 | ||
| North East Lincolnshire | 7449 | 46.9 | 45.9 | 48.0 | ||
| North Lincolnshire | 5534 | 32.5 | 31.6 | 33.3 | ||
| York | 5183 | 25.1 | 24.4 | 25.8 | ||
| North Yorkshire UA | 12681 | 20.2 | 19.8 | 20.5 | ||
| Barnsley | 9140 | 36.7 | 35.9 | 37.5 | ||
| Doncaster | 13786 | 43.7 | 43.0 | 44.4 | ||
| Rotherham | 9818 | 36.0 | 35.3 | 36.7 | ||
| Sheffield | 19365 | 33.6 | 33.2 | 34.1 | ||
| Bradford | 30302 | 54.2 | 53.6 | 54.8 | ||
| Calderdale | 10064 | 48.1 | 47.1 | 49.0 | ||
| Kirklees | 18185 | 41.0 | 40.4 | 41.6 | ||
| Leeds | 38685 | 46.4 | 46.0 | 46.9 | ||
| Wakefield | 17801 | 49.0 | 48.3 | 49.8 |
Source: OHID, based on Home Office and Office for National Statistics data
There were 1,052 sexual offences reported in Hull during 2024/25 and 2,884 across the Humberside Police Area so Hull residents accounts for 36.5% of all reported sexual offences across the Humberside Police Area.
Compared with benchmark
Violent crime - sexual offences per 1,000 population (Persons All ages) 2024/25
| Area |
Recent
Trend |
Count
|
Value
|
95%
Lower CI |
95%
Upper CI |
|
|---|---|---|---|---|---|---|
| England | 180991 | 3.1 | 3.1 | 3.1 | ||
| Yorkshire and the Humber region (statistical) | 20534 | 3.7 | 3.6 | 3.7 | ||
| Kingston upon Hull | 1052 | 3.9 | 3.6 | 4.1 | ||
| East Riding of Yorkshire | 702 | 2.0 | 1.9 | 2.2 | ||
| North East Lincolnshire | 617 | 3.9 | 3.6 | 4.2 | ||
| North Lincolnshire | 513 | 3.0 | 2.8 | 3.3 | ||
| York | 493 | 2.4 | 2.2 | 2.6 | ||
| North Yorkshire UA | 1451 | 2.3 | 2.2 | 2.4 | ||
| Barnsley | 840 | 3.4 | 3.1 | 3.6 | ||
| Doncaster | 1211 | 3.8 | 3.6 | 4.1 | ||
| Rotherham | 866 | 3.2 | 3.0 | 3.4 | ||
| Sheffield | 1820 | 3.2 | 3.0 | 3.3 | ||
| Bradford | 2797 | 5.0 | 4.8 | 5.2 | ||
| Calderdale | 879 | 4.2 | 3.9 | 4.5 | ||
| Kirklees | 1718 | 3.9 | 3.7 | 4.1 | ||
| Leeds | 3473 | 4.2 | 4.0 | 4.3 | ||
| Wakefield | 1468 | 4.0 | 3.8 | 4.3 |
Source: OHID, based on Home Office and Office for National Statistics data
Whilst the rate of hospital admissions due to violence has decreased since 2009/10-2011/12, the largest decreases were mainly in the first four to five years, and there had been little change in the rate between 2014/15-2016/17 and 2017/18-2019/20, although decreases did occur in 2018-19-2020/21 and 2019/20-2021/22. However, in 2021/22-2023/24 the rate increased to 56.0 admissions per 100,000 population, with a further small increase in 2022/23-2024/25 to 56.8 per 100,000 population.
There were 475 recorded admissions over the three year period 2022/23-2024/25 equating to an average of 158 per year.
Compared with benchmark
Violent crime - hospital admissions for violence (including sexual violence) (Persons All ages)
|
Period
|
Kingston upon Hull |
Yorkshire and the Humber region (statistical)
|
England
|
||||
|---|---|---|---|---|---|---|---|
|
Count
|
Value
|
95%
Lower CI |
95%
Upper CI |
||||
| 2009/10 - 11/12 | • | 934 | 108.3 | 101.3 | 115.6 | 76.7 | 61.7 |
| 2010/11 - 12/13 | • | 790 | 91.6 | 85.2 | 98.4 | 73.0 | 56.6 |
| 2011/12 - 13/14 | • | 710 | 83.1 | 77.0 | 89.6 | 68.1 | 51.5 |
| 2012/13 - 14/15 | • | 610 | 71.5 | 65.9 | 77.5 | 60.9 | 46.6 |
| 2013/14 - 15/16 | • | 580 | 68.6 | 63.0 | 74.5 | 57.4 | 44.6 |
| 2014/15 - 16/17 | • | 540 | 63.6 | 58.3 | 69.3 | 53.9 | 42.7 |
| 2015/16 - 17/18 | • | 545 | 63.7 | 58.3 | 69.4 | 53.5 | 43.2 |
| 2016/17 - 18/19 | • | 540 | 63.1 | 57.8 | 68.8 | 54.6 | 44.7 |
| 2017/18 - 19/20 | • | 535 | 62.8 | 57.5 | 68.4 | 53.8 | 45.5 |
| 2018/19 - 20/21 | • | 485 | 57.7 | 52.6 | 63.1 | 47.7 | 41.7 |
| 2019/20 - 21/22 | • | 425 | 50.9 | 46.1 | 56.1 | 42.9 | 38.4 |
| 2020/21 - 22/23 | • | 425 | 50.9 | 46.1 | 56.1 | 39.0 | 34.3 |
| 2021/22 - 23/24 | • | 465 | 56.0 | 51.0 | 61.4 | 40.1 | 34.2 |
| 2022/23 - 24/25 | • | 475 | 56.8 | 51.7 | 62.2 | 37.8 | 31.9 |
Source: OHID, based on NHS England and Office for National Statistics data
The rate of violent offences has increased considerably over time between 2010/11 and 2021/22 from 17.7 to a high of 57.2 offences per 100,000 population. The rate has fallen slightly in 2024/25 but at 50.2 offences per 100,000 population, the rate is still very high compared to 2010/11 (almost three times higher). It is possible that the way crimes are recorded over time will affect the rate, but it is unlikely t0 account for such a large increase. It is also possible that reporting of crimes has changed over time as well.
In 2024/25, there were 13,696 violence offences reported to police in Hull.
Compared with benchmark
Violent crime - violence offences per 1,000 population (Persons All ages)
|
Period
|
Kingston upon Hull |
Yorkshire and the Humber region (statistical)
|
England
|
||||
|---|---|---|---|---|---|---|---|
|
Count
|
Value
|
95%
Lower CI |
95%
Upper CI |
||||
| 2015/16 | • | 6457 | 24.7 | 24.1 | 25.4 | 17.9 | 17.2 |
| 2016/17 | • | 8825 | 33.6 | 32.9 | 34.3 | 23.5 | 19.9 |
| 2017/18 | • | 10221 | 38.5 | 37.8 | 39.3 | 28.9 | 23.7 |
| 2018/19 | • | 14367 | 53.7 | 52.8 | 54.6 | 37.2 | 28.2 |
| 2019/20 | • | 14467 | 53.9 | 53.1 | 54.8 | 38.2 | 29.4 |
| 2020/21 | • | 14153 | 52.7 | 51.8 | 53.5 | 37.0 | 29.7 |
| 2021/22 | • | 15295 | 57.2 | 56.3 | 58.1 | 43.7 | 35.0 |
| 2022/23 | • | 13236 | 49.7 | 48.8 | 50.5 | 45.6 | 35.0 |
| 2023/24 | • | 14403 | 53.6 | 52.7 | 54.5 | 42.6 | 33.0 |
| 2024/25 | • | 13696 | 50.2 | 49.3 | 51.0 | 40.0 | 31.4 |
Source: OHID, based on Home Office and Office for National Statistics data
The number of sexual offences per 1,000 population followed a very similar pattern to violent offences, increasing sharply between 2010/11 and 2018/19. Whilst the rate fell between between 2018/19 and 2019/20 from 4.6 to 4.0 per 1,000 population, the rate has remained at a similar level since then.
In 2024/25, there were 1,052 sexual offences that were reported to police in Hull.
Compared with benchmark
Violent crime - sexual offences per 1,000 population (Persons All ages)
|
Period
|
Kingston upon Hull |
Yorkshire and the Humber region (statistical)
|
England
|
||||
|---|---|---|---|---|---|---|---|
|
Count
|
Value
|
95%
Lower CI |
95%
Upper CI |
||||
| 2015/16 | • | 576 | 2.2 | 2.0 | 2.4 | 2.0 | 1.7 |
| 2016/17 | • | 764 | 2.9 | 2.7 | 3.1 | 2.3 | 1.9 |
| 2017/18 | • | 1083 | 4.1 | 3.8 | 4.3 | 2.9 | 2.4 |
| 2018/19 | • | 1220 | 4.6 | 4.3 | 4.8 | 3.2 | 2.6 |
| 2019/20 | • | 1061 | 4.0 | 3.7 | 4.2 | 3.1 | 2.5 |
| 2020/21 | • | 1072 | 4.0 | 3.8 | 4.2 | 2.7 | 2.3 |
| 2021/22 | • | 1086 | 4.1 | 3.8 | 4.3 | 3.3 | 3.0 |
| 2022/23 | • | 1050 | 3.9 | 3.7 | 4.2 | 3.4 | 3.0 |
| 2023/24 | • | 1042 | 3.9 | 3.6 | 4.1 | 3.3 | 2.9 |
| 2024/25 | • | 1052 | 3.9 | 3.6 | 4.1 | 3.7 | 3.1 |
Source: OHID, based on Home Office and Office for National Statistics data
Geographical Areas Most Affected By Crimes
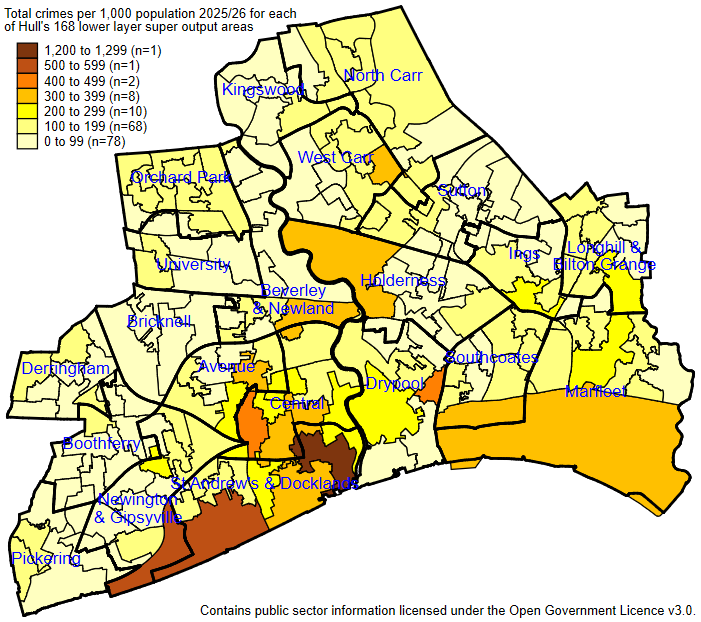
The total number of crimes differs substantially across Hull. The information is available at lower layer super output area geographical level, of which there are 168 such areas in Hull (following the 2021 Census). The rates are given as the total number of crimes in 2023/24 per 1,000 residents. This gives a reasonable way to ‘standardised’ the number of crimes for most geographical areas. However, areas with higher daytime populations (people working or shopping in those geographical areas) and/or a vibrant night time economy, those with higher numbers of cars, cycles and shops will have higher rates of crime with the higher non-resident populations, as well as the higher number of vehicles and shops which could be targeted. This is the case with the city centre, and thus these areas have the highest levels of crime and anti-social behaviour reported.
The area with the highest rate crime and anti-social behaviour rate has a rate two times higher than any other lower layer super output area in Hull. The area covers Paragon Street, Jamison Street, King Edward Street, Prospect Street, Brook Street, Prospect shopping centre, Whitefriargate, some of Princes Quay shopping centre, Queen’s gardens, and most of the Old Town area of Hull down to the docks including Humber Street.
The area with the second highest crime rates cover an area in both St Andrew’s & Docklands ward and Newington & Gipsyville wards which includes most of Hessle Road and an area between Brighton Street in the west to Daltry Street in the east, and includes St Andrew’s Quay retail park.
The two areas with the next highest crime rates are: an area around the Mount Pleasant/Holderness Road intersection; an area covering the western end of Spring Bank, Argyle Street and Derringham Street, and stretching as far as Hull Royal Infirmary.
The eight areas with the next highest rates are spread across the city: an area in Avenue ward around Princes Avenue; an area within West Carr ward which includes the Northpoint Shopping Centre; an area to the west of the city centre (including Wilberforce Street, Spring Street, Portland Place, the Eastern ends of Spring Bank and Anlaby Road); an area covering the southern side of Clough Road; an area in Holderness ward north of Chamberlain Road, East of the River Hull, South of Sutton Road, West of Leads Road and the footpaths/cycle paths and allotments running from Chamberlain Road to Leads Road; an area to the south west of the city centre, including the Fruit Market, Hull Marina, Kingston Retail Park and the Thornton Estate; an area to the North of the city centre around Freetown Way; an area in Marfleet ward around the docks, the Ferry Terminal and Marfleet Avenue.
Hull Data Observatory
Further information is also given for Hull on the Hull Data Observatory (opens a new window) which may provide more up-to-date information as it is automatically populated with new data.
The 12 month rolling rates for different types of crime generally show that Hull has higher rates of crime per 1,000 population compared to England for violence and sexual offences, public order offences, criminal damage and arson, burglary, robbery, shoplifting, bicycle theft and possession of weapons; lower rates for theft from a person and anti-social behaviour; similar rates or more variable rates for vehicle crime and drug offences. Some of these differences will be expected given that Hull is a city, and both England clearly includes large rural areas which generally have fewer crimes.
The Hull Data Observatory also includes the trends over time by crime type for each ward in Hull, and these differ considerably by ward and type of crime.
First-Time Offenders and Re-offending
The Office for Health Improvement and Disparities’ Fingertips presents information on the rate of first-time offenders, and re-offending. The number of first time offenders per 100,000 population for 2022, the percentage of offenders who re-offend within one year (or within a further six months to allow the offences to be proven in court), and the average number of re-offences per re-offender for 2023/24 are all substantially higher in Hull compared to England.
The rate of first time offenders in Hull is almost two-thirds higher than for England (62% higher), and the percentage of offenders who re-offend is around one-fifth higher in Hull compared to England (21% higher in Hull) whereas the average number of reoffences in Hull is 11% higher than England.
Compared with benchmark
| Indicator | Period | England | Yorkshire and the Humber region (statistical) | Kingston upon Hull | East Riding of Yorkshire | North East Lincolnshire | North Lincolnshire | York | North Yorkshire UA | Barnsley | Doncaster | Rotherham | Sheffield | Bradford | Calderdale | Kirklees | Leeds | Wakefield |
|---|---|---|---|---|---|---|---|---|---|---|---|---|---|---|---|---|---|---|
First time offenders (Persons 10+ yrs) | 2022 | 166 | 185 | 269 | 105 | 207 | 193 | 115 | 140 | 156 | 217 | 178 | 173 | 241 | 248 | 186 | 190 | 186 |
Reoffending levels: percentage of offenders who reoffend (Persons All ages) | 2023/24 | 28.1 | 32.9 | 33.9 | 27.1 | 33.0 | 34.0 | 34.0 | 27.9 | 35.3 | 33.8 | 32.5 | 33.7 | 31.6 | 31.1 | 30.2 | 35.3 | 36.2 |
Reoffending levels: average number of reoffences per reoffender (Persons All ages) | 2023/24 | 4.75 | 5.28 | 5.25 | 5.02 | 5.86 | 6.14 | 5.85 | 5.13 | 6.38 | 5.48 | 5.24 | 5.57 | 4.24 | 5.03 | 5.30 | 5.01 | 5.72 |
The rate of first time offenders has been quite variable, but has generally been decreasing since 2014 (although the rate in 2015 was particularly low). The number of first time offenders decreased significantly in 2020 – perhaps due to the COVID-19 pandemic – but increased slightly in 2021. With a further slight decrease in 2022, the rate in Hull is lower in 2022 than it was for 2019 prior to the pandemic, and is following a similar decreasing trajectory as it has been mostly doing since 2014.
In 2022, there were 629 first time offenders in Hull.
Compared with benchmark
First time offenders (Persons 10+ yrs)
|
Period
|
Kingston upon Hull |
Yorkshire and the Humber region (statistical)
|
England
|
||||
|---|---|---|---|---|---|---|---|
|
Count
|
Value
|
95%
Lower CI |
95%
Upper CI |
||||
| 2012 | • | 1150 | 512 | 483 | 543 | 326 | 367 |
| 2013 | • | 1041 | 462 | 434 | 491 | 298 | 335 |
| 2014 | • | 858 | 381 | 356 | 407 | 299 | 319 |
| 2015 | • | 698 | 308 | 286 | 332 | 274 | 295 |
| 2016 | • | 818 | 359 | 335 | 385 | 251 | 268 |
| 2017 | • | 811 | 352 | 329 | 378 | 232 | 240 |
| 2018 | • | 718 | 309 | 287 | 332 | 209 | 217 |
| 2019 | • | 739 | 317 | 294 | 340 | 205 | 207 |
| 2020 | • | 595 | 254 | 234 | 275 | 174 | 160 |
| 2021 | • | 672 | 288 | 266 | 310 | 200 | 167 |
| 2022 | • | 629 | 269 | 249 | 291 | 185 | 166 |
Source: OHID, based on Ministry of Justice and Office for National Statistics data
The percentage of offenders who re-offend within one year (or within a further six months to allow the offences to be proven in court) has shown a consistent decreasing trend in Hull between 2016/17 and 2021/22, but increased in the last two years.
For 2023/24, just over one-third (33.9%) of offenders reoffended within six months with 985 reoffending out of 2,906 offenders.
Compared with benchmark
Reoffending levels: percentage of offenders who reoffend (Persons All ages)
|
Period
|
Kingston upon Hull |
Yorkshire and the Humber region (statistical)
|
England
|
||||
|---|---|---|---|---|---|---|---|
|
Count
|
Value
|
95%
Lower CI |
95%
Upper CI |
||||
| 2016/17 | • | 1476 | 38.1% | - | - | 31.5% | 29.2% |
| 2017/18 | • | 1265 | 36.9% | - | - | 30.8% | 29.1% |
| 2018/19 | • | 1194 | 36.1% | - | - | 29.8% | 27.9% |
| 2019/20 | • | 1098 | 34.0% | - | - | 28.0% | 25.4% |
| 2020/21 | • | 884 | 32.7% | - | - | 26.7% | 24.1% |
| 2021/22 | • | 975 | 30.6% | - | - | 27.7% | 25.0% |
| 2022/23 | • | 844 | 32.0% | - | - | 30.4% | 26.2% |
| 2023/24 | • | 985 | 33.9% | - | - | 32.9% | 28.1% |
Source: OHID, based on Ministry of Justice data
The average number of re-offences per re-offender increased in Hull between 2016/17 and 2018/19, then decreased between 2018/19 and 2021/22, but has increased in the past two years.
There were 5,168 re-offences in total committed by the 985 reoffenders (with 5.25 re-offences for each reoffender).
Compared with benchmark
Reoffending levels: average number of reoffences per reoffender (Persons All ages)
|
Period
|
Kingston upon Hull |
Yorkshire and the Humber region (statistical)
|
England
|
||||
|---|---|---|---|---|---|---|---|
|
Count
|
Value
|
95%
Lower CI |
95%
Upper CI |
||||
| 2016/17 | • | 6329 | 4.29 | - | - | 4.22 | 4.01 |
| 2017/18 | • | 5796 | 4.58 | - | - | 4.27 | 4.05 |
| 2018/19 | • | 5644 | 4.73 | - | - | 4.29 | 4.00 |
| 2019/20 | • | 4871 | 4.44 | - | - | 4.01 | 3.74 |
| 2020/21 | • | 3884 | 4.39 | - | - | 3.92 | 3.60 |
| 2021/22 | • | 3945 | 4.05 | - | - | 4.04 | 3.71 |
| 2022/23 | • | 3603 | 4.27 | - | - | 4.52 | 4.04 |
| 2023/24 | • | 5168 | 5.25 | - | - | 5.28 | 4.75 |
Source: OHID, based on Ministry of Justice data
Youth Offending
The Office for Health Improvement and Disparities’ Fingertips also presents information on the rate of first time entrants into the youth justice system (per 100,000 population), as well as the rate of children aged 10-17 years who have been cautioned or sentenced per 1,000 population (i.e. who are in the youth justice system by age).
For 2024, the rate of first time entrants into the youth justice system was 63% higher than England, while the rate of young people aged 10-17 years entering the youth justice system in Hull was 29% higher than England for 2020/21.
The first time entrants into the youth justice system included 10-17 year olds who receive their first reprimand, warning or youth caution per 100,000 population whereas the rate of 10-17 year olds within the youth justice system included those who have been cautioned or sentenced, so the two measures involve different measures and levels of severity.
Compared with benchmark
| Indicator | Period | England | Yorkshire and the Humber region (statistical) | Kingston upon Hull | East Riding of Yorkshire | North East Lincolnshire | North Lincolnshire | York | North Yorkshire UA | Barnsley | Doncaster | Rotherham | Sheffield | Bradford | Calderdale | Kirklees | Leeds | Wakefield |
|---|---|---|---|---|---|---|---|---|---|---|---|---|---|---|---|---|---|---|
First time entrants to the youth justice system (Persons 10-17 yrs) | 2024 | 137.7 | 151.5 | 224.9 | 106.9 | 129.6 | 137.4 | 86.7 | 140.0 | 215.0 | 166.2 | 140.5 | 239.2 | 129.8 | 186.1 | 99.2 | 154.4 | 101.7 |
Children entering the youth justice system (10-17 yrs) (Persons 10-17 yrs) | 2020/21 | 2.8 | 3.2 | 3.6 | 1.2 | 2.5 | 1.9 | 1.9 | 2.9 | 1.7 | 2.1 | 2.6 | 2.7 | 4.3 | 4.1 | 4.0 | 4.2 | 3.8 |
Whilst the rate of first time entrants into the youth justice system has decreased in Hull since 2017, the rate has generally been higher than England. The rate for the latest year, 2024, is 63% higher in Hull compared to England.
The number of first time entrants into the youth justice system – currently at 63 young people aged 10-17 years – is one-fifth of the number in 2011 (when there were 220 first time entrants into the youth justice system in Hull) and almost one-quarter the number in 2012 (when there were 170 first time entrants into the youth justice system in Hull).
Compared with benchmark
First time entrants to the youth justice system (Persons 10-17 yrs)
|
Period
|
Kingston upon Hull |
Yorkshire and the Humber region (statistical)
|
England
|
||||
|---|---|---|---|---|---|---|---|
|
Count
|
Value
|
95%
Lower CI |
95%
Upper CI |
||||
| 2014 | • | 87 | 396.1 | 317.2 | 488.6 | 478.6 | 415.2 |
| 2015 | • | 86 | 396.1 | 317.0 | 489.0 | 429.1 | 376.6 |
| 2016 | • | 97 | 448.5 | 363.9 | 546.8 | 352.9 | 333.8 |
| 2017 | • | 117 | 533.1 | 441.1 | 638.5 | 324.4 | 299.7 |
| 2018 | • | 69 | 306.1 | 238.2 | 387.4 | 245.9 | 244.0 |
| 2019 | • | 68 | 293.2 | 227.9 | 371.3 | 228.8 | 216.3 |
| 2020 | • | 42 | 173.1 | 124.8 | 233.9 | 187.2 | 173.0 |
| 2021 | • | 49 | 198.6 | 147.3 | 261.8 | 182.9 | 150.7 |
| 2022 | • | 62 | 239.9 | 184.2 | 307.3 | 176.7 | 151.9 |
| 2023 | • | 43 | 162.0 | 117.6 | 217.5 | 159.2 | 145.7 |
| 2024 | • | 63 | 224.9 | 172.8 | 287.7 | 151.5 | 137.7 |
Source: OHID, based on Ministry of Justice and Office for National Statistics data
The rate of young people within the youth justice system in Hull decreased sharply between 2013/14 and 2015/16, and whilst the rate increased between 2015/16 and 2016/17, the rate has generally fallen since then.
Over the period 2013/14 to 2020/21, the rate of young people entering the youth justice system has been statistically significantly higher in Hull compared to England with the exception of 2015/16.
The rate for the latest year 2020/21 is the lowest it has been since 2013/14.
For 2020/21, there were 87 young people aged 10-17 years who had previously received a caution or sentence.
Compared with benchmark
Children entering the youth justice system (10-17 yrs) (Persons 10-17 yrs)
|
Period
|
Kingston upon Hull |
Yorkshire and the Humber region (statistical)
|
England
|
||||
|---|---|---|---|---|---|---|---|
|
Count
|
Value
|
95%
Lower CI |
95%
Upper CI |
||||
| 2013/14 | • | 270 | 12.3 | 10.9 | 13.9 | 8.8 | 7.9 |
| 2014/15 | • | 190 | 8.8 | 7.6 | 10.1 | 8.1 | 7.4 |
| 2015/16 | • | 137 | 6.4 | 5.4 | 7.6 | 6.9 | 6.4 |
| 2016/17 | • | 189 | 8.8 | 7.6 | 10.1 | 6.0 | 5.5 |
| 2017/18 | • | 176 | 8.0 | 6.9 | 9.3 | 5.6 | 5.1 |
| 2018/19 | • | 133 | 5.9 | 4.9 | 7.0 | 4.4 | 4.1 |
| 2019/20 | • | 134 | 5.8 | 4.8 | 6.8 | 3.9 | 3.5 |
| 2020/21 | • | 87 | 3.6 | 2.9 | 4.5 | 3.2 | 2.8 |
Source: Ministry of Justice and Office for National Statistics
Strategic Need and Service Provision
There are a number of initiatives and multi-agency work happening around domestic abuse, violence against women and girls, and responding to problems identified by communities.
The four key objectives in Hull’s Community Safety Partnership Strategy for 2022-25 are:
- reducing serious and violent crime;
- reducing the number of offenders and reoffenders;
- support for vulnerable people and victims of crime; and
- engaged and empowered communities.
The Police and Crime Plan for Humberside 2021-24 has three aims:
- Engaged, Resilient and Inclusive Communities;
- Safer Communities; and
- Effective Organisations.
Hull’s Alcohol and Drugs Partnership Strategy 2022-2025 is primarily focussed on preventing and reducing harm to individuals; however, it is well integrated with other relevant plans and strategies that reflect the full breadth of alcohol and drug related issues across Hull. Such strategies and plans include the Safer Hull plans and programme through Community Safety Partnership, the Humberside Police Drugs Strategy, and Safeguarding and Early Help Strategies. The Government’s 10 year drug strategy, From Harm to Hope (2022) focuses on reducing crime associated with drug use and also improved treatment. Social return on investment tools for drugs and alcohol make the case for investing in drug and alcohol treatment programmes to reduce overall crime and anti-social behaviour to reduce costs incurred by drug and alcohol issues to society and the economy.
People’s circumstances can often be improved by early help, and any early help and intervention for all families should be timely, accessible and appropriate for their circumstances. Hull’s Early Help and Prevention offer is focused on a whole family approach which aims to identify individuals and families with problems and brings together different services and agencies to collectively look at what support is needed and then work together to deliver the required support in a coordinated way. The framework outlines the approach to ensure that collaboration and alignment of services, and that early help may be ‘early in life or at the earliest opportunity’ which is also part of the day job, helpful, non-stigmatising, preventative, targeted and tailored.
The COVID-19 pandemic, associated lockdowns, and changes to working and social behaviour is likely to have changed the number and type of crimes reported. With pubs, nightclubs and restaurants closed or with restrictions placed up on them during the lockdowns, this would have affected alcohol-related violence and anti-social behaviour. However, other crimes have been more prevalent such as domestic abuse with an increased number of calls and referrals into domestic abuse services. Following sustained local and national campaigns, domestic abuse reports rose during the pandemic and at March 2022, the number of victims receiving support has been at the highest levels ever for the city.
Resources
Dustmann, C. and F. Fasani, The effect of local area crime on the mental health of residents. www.ucl.ac.uk. 2012, University College London: London.
The Office for Health Improvement and Disparities (formerly Public Health England). Police and Crime Commissioner support pack 2018-19: key drug and alcohol data: Summary of area data for Police and Crime Commissioners: Kingston upon Hull. London, 2017.
Data Police UK. https://data.police.uk/
Hull Data Observatory. https://data.hull.gov.uk/crime-and-community-safety/
The Office for Health Improvement and Disparities’ Fingertips: https://fingertips.phe.org.uk/
Hull’s Community Safety Partnership Strategy for 2022-25. https://www.hull.gov.uk/crime-and-safety/community-crime-and-prevention/community-safety-partnership
Police and Crime Plan for Humberside 2021-24. https://www.humberside-pcc.gov.uk/Our-Work/Police-and-Crime-Plan.aspx
UK Government, 2022. From harm to hope: A 10-year drugs plan to cut crime and save lives. https://www.gov.uk/government/publications/from-harm-to-hope-a-10-year-drugs-plan-to-cut-crime-and-save-lives
Hull City Council. Hull Alcohol and Drugs Partnership Strategy 2022-2025. https://www.hull.gov.uk/sites/hull/files/media/Editor%20-%20Public%20health/Hull%20Alcohol%20and%20Drugs%20Strategy%202022-2025.pdf
Updates
This page was last updated / checked on 29 June 2026.
This page is due to be updated / checked in June 2027.