Index
This topic area covers statistics and information relating to drugs use among adults in Hull including local strategic need and service provision. Further information relating to Drug Use Among Young People is given under Lifestyle Factors within Children and Young People. Use of drugs has been collected within Hull’s Health and Wellbeing Surveys and full reports are available under Surveys within Tools and Resources. A needs assessment was completed in Hull during 2023 for people with multiple unmet needs which included people who used drugs. The report – which was finalised in 2024 – is available within Multiple Unmet Needs under Vulnerable Groups.
This page contains information from the Office for Health Improvement & Disparities’ Fingertips. Information is taken ‘live’ from the site so uses the latest available data from Fingertips and displays it on this page. As a result, some comments on this page may relate to an earlier period of time until this page is next updated (see review dates at the end of this page).
Headlines
- Different illicit drugs and prescribed medication have different effects on physical and mental health, and some are highly addictive. Drugs can have a serious impact not just on the individual, but also their family and friends, and there is a detrimental effect on the entire community.
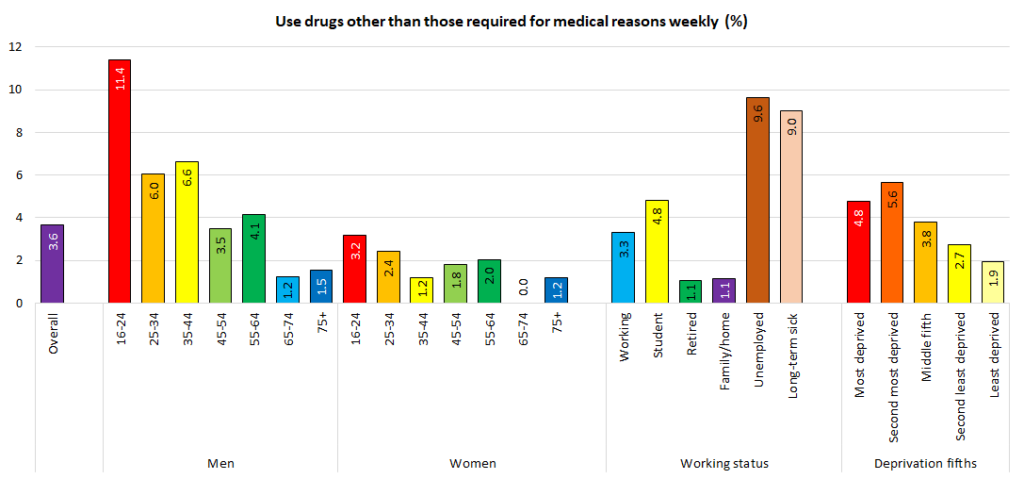
- From the local Health and Wellbeing Survey 2019, around one in ten men aged 16-24 years, people who were unemployed and people who were not working due to long-term illness or disability stated they used drugs other than those required for medical reasons either everyday or weekly. Fewer than 2% of men aged 65+ years and women aged 35+ years did. Around 6% of men aged 25-34 years, around 4% of men aged 45-64 years and around 3% of women aged 16-24 years also used drugs other than those required for medical reasons either everyday or weekly.
- For 2019/20, it was estimated that there were more than twice as many opiate and/or crack users in Hull compared to England (22.2 versus 9.5 persons per 1,000 population) with an estimated 3,798 residents of Hull aged 15-64 years using opiates and/or crack cocaine. There has been a 23% increase in the rate for Hull since 2016/17 compared to a 7% increase for England.
- More than six in ten (62%) of adults aged 18+ years with substance use treatment need engage with community-based drug services following their release from prison which is higher than England (57%) for 2024/25.
- For 2020/21, when there were 2,137 residents in treatment this equated to 10.6 residents in treatment per 1,000 population (more than twice as high as England at 4.5 per 1,000 population).
- Successful completion of drug treatment (left free of drug dependence and did not re-represent within six months) was 24.0% for non-opiates and 3.4% for opiates in Hull for 2023/24 which was lower than England (29.5% and 5.1% respectively).
- Over 80% of people admitted to treatment for substance use smoked in Hull, and whilst the data is 2019/20, it is still likely to be very high in Hull.
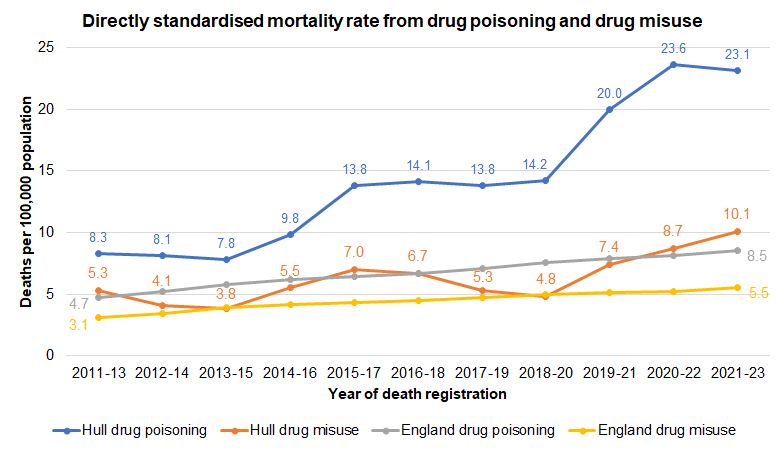
- The directly standardised mortality rate from drug misuse was statistically significantly higher in Hull compared to England for 2021-23 and almost twice as high (10.1 versus 5.5 deaths per 100,000 population) with 77 deaths in total over the three year period. The mortality rate was higher among men with 53 deaths (13.6 deaths per 100,000 population) than it was with women with 24 deaths (6.4 deaths per 100,000 population).
- The number of drug misuse deaths in Hull increased between 2001-03 and 2005-07 to reach a peak of 7.9 deaths per 100,000 population. The rate then gradually decreased in Hull to a low of 3.8 deaths per 100,000 population for 2013-15. The number of drug misuse deaths did increase, and there were a number of deaths in 2017 which increased the rate to 7.0 deaths per 100,000 population for 2015-17. Whilst the rate did decrease to 4.8 deaths per 100,000 population for 2018-20, the rate has increased sharply to a new high of 10.1 deaths per 100,000 population in 2021-23.
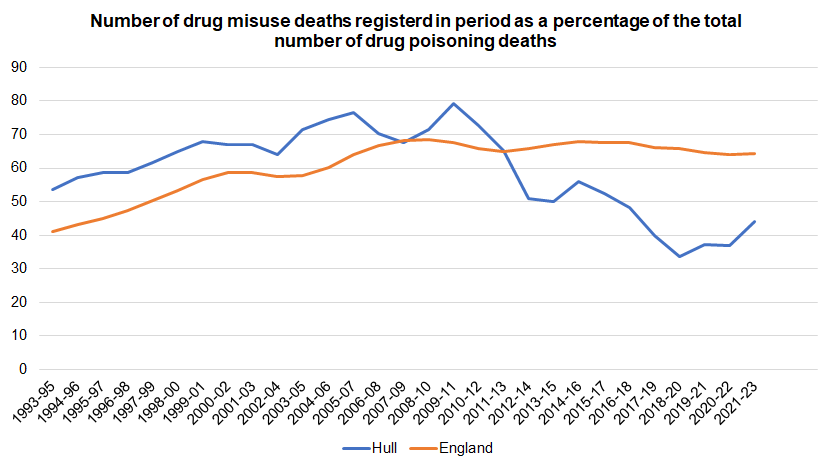
- However, whilst the sharp increase in the drug misuse deaths in Hull is of concern, perhaps of even more concern is the increase in deaths from drug poisoning in Hull. Traditionally, the number of drug misuse deaths is seen as a measure of the impact of drugs on mortality, but drug misuse deaths in Hull have decreased as a percentage of the drug poisoning deaths in Hull. Drug misuse deaths form a subset of drug poisoning deaths, and a death can only be classified as a drug misuse death if a drug controlled under the Misuse of Drugs Act 1971 is specifically mentioned on the death certificate. In Hull, the number of drug misuse deaths as a percentage of drug poisoning deaths was just over 50% for 1993-95 but increased to 80% in 2010-12 before falling to only 37% in 2020-22 (44% for 2021-23). In contrast, the percentage for England has increased from 40% in 1993-95 to 64% for 2021-23.
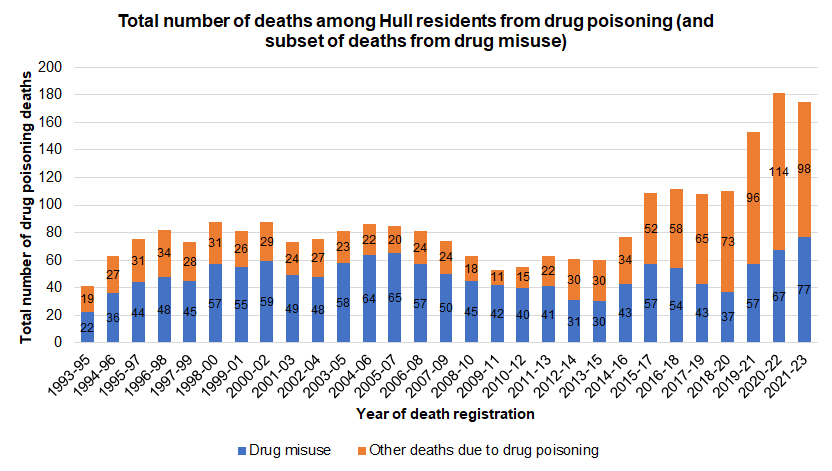
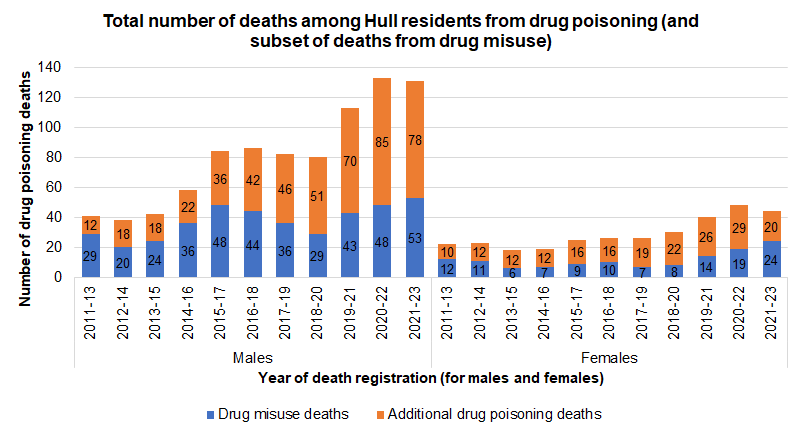
- The total number of drug misuse deaths has increased in Hull in the last decade or so. There were just over 40 deaths in each three year period between 2008-10 and 2011-13 with number decreasing to just over 30 for 2012-14 and 2013-15. The numbers did increase to 57 for 2015-17 when there were a high number of deaths in Hull due to the introduction of a very toxic ingredient (carfentanil/fentanyl) into the local drug supply (predominantly heroin) which was swiftly dealt with by the National Crime Agency. Whilst the numbers fell to 37 deaths for 2018-20, the numbers have increased each successive year (to 57, 67 and 77 for 2019-21, 2020-21 and 2021-23). However, by reporting the mortality rate from drug misuse alone, this masks an even larger increase in Hull from deaths from drug poisoning. Between 2008-10 and 2013-15, there were between 53 and 63 deaths each three year period in Hull from drug poisoning, but this has increased sharply to 181 deaths for 2020-22 although has fallen slightly to 175 for 2021-23.
- The mortality rate from drug poisoning in Hull was around 8 deaths per 100,000 population between 2011-13 and 2013-15, but increased to almost 10 deaths per 100,000 population for 2014-16, and to around 14 deaths per 100,000 population between 2015-17 and 2018-20. However, there has been a sharp increase to 20 deaths per 100,000 population for 2019-21 and to 23 deaths per 100,000 population for 2020-22 and 2021-23.
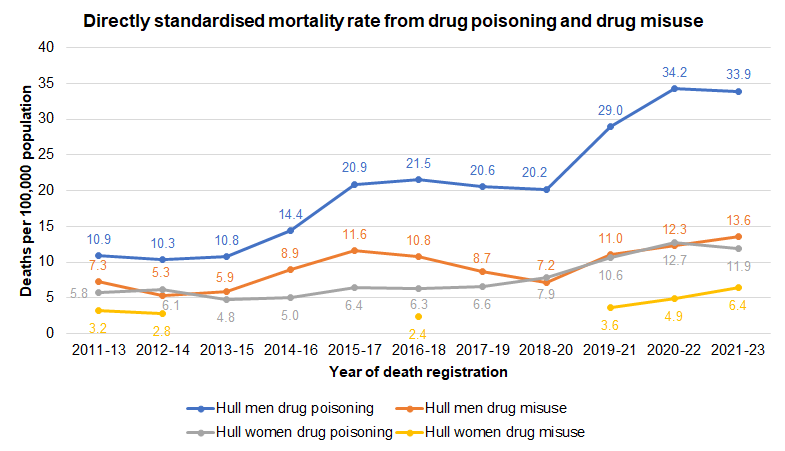
- Between 2011-13 and 2021-23, the mortality rate from drug misuse has doubled for both men and women in Hull, as has the mortality from drug poisoning among women. However, the greatest increase has been for drug poisoning among men where the mortality rate has tripled.
- Nationally, an increase in the number of deaths was also noted together with a reduction in the number of new drug users which suggests a higher death rate among existing long-term drug users. The Office for National Statistics state possible explanations are an ageing cohort of drug users likely to be suffering from the effects of long-term drug use and becoming increasing susceptible to a fatal overdose, new trends in taking specific drugs which may increase the risk of an overdose, and a potential increase in disengagement or non-compliance with opiate substitute therapy.
The Population Affected – Why Is It Important?
Different illicit drugs and prescribed medication have different effects on physical and mental health, and some are highly addictive. From the NHS, the health risks from illicit drugs and substances include death from an overdose, lung disease from smoking drugs, HIV or viral hepatitis, serious infections in the body and bloodstream, fertility problems, damage to veins and body tissue through injecting drugs, overheating and dehydration, kidney problems, schizophrenia, hallucinatory states, insomnia, fits, agitation, aggression, confusion, paranoia, psychosis, memory problems, depression, anxiety and lack of concentration. It can also be dangerous to drive after taking drugs, increasing the risk of an accident.
Illicit drugs and prescribed medication misuse can have a serious impact not just on the individual, but also their family and friends who may require considerable support. There also can be a detrimental effect on the entire community. It is estimated that individuals dependent on opioids and/or crack cocaine are responsible for 45% of acquisitive crime (shoplifting, burglary, vehicle crime and robbery).
When a person has been ill or where a death occurs following an event such as a heart attack or stroke, it is possible to register the death very quickly. These deaths are generally registered within five days of occurrence of the death. However, suspicious and unexplained deaths need to be investigated to determine the cause of death. For these types of deaths including all drug-related deaths, a Coroner’s Inquest is required. After a Coroner’s Inquest is held, the death certificate is issued and the death can be registered. As deaths from drug poisoning can take some time before they are registered, the national statistics relating to drug misuse and drug poisoning mortality relate to the period of time in which the death was registered rather than when the death occurred (also see Delays to Death Registration below for further information).
The underlying cause of death is determined by the Office for National Statistics based on information recorded on the death certificate and is coded using the International Classification of Disease version 10. Deaths related to drug use are a subset of the drug poisoning deaths.
Drug poisoning deaths involve the following underlying cause of death (ICD 10 codes):
- mental and behavioural disorders due to drug use (F11-F16, F18-F19);
- accidental poisoning by drugs, medicaments and biological substances (X40-X44);
- intentional self-poisoning by drugs, medicaments and biological substances (X60-X64);
- assault by drugs, medicaments and biological substances (X85); and
- poisoning by drugs, medicaments and biological substances, undetermined intent (Y10-Y14).
Deaths related to drug misuse involve the same underlying causes of death, and deaths from mental and behavioural disorders due to drugs (F11-F16 and F19), but accidental poisoning (X40-X44), intentional self-poisoning (X60-X64), poisoning of undetermined intent (Y10-Y14), assault of drugs (X85), and mental and behavioural disorders due to the use of volatile solvents (F18) require that a drug controlled under the Misuse of Drugs Act 1971 was mentioned on the death certificate.
Thus the difference between drug poisoning deaths and deaths due to drug misuse is that deaths due to drug use need to have a specific mention of a drug controlled under the Misuse of Drugs Act 1971 mentioned on the death certificate for deaths relating to accident poisoning, accidental poisoning, poisoning with undetermined intent, those related to assault, and mental and behavioural disorders due to volatile solvents. Whereas the drug poisoning deaths just need any of these causes to be mentioned and the specific drug(s) do not need to be named on the death certificate. Different coroners across the country may record their evidence and information on the death record differently. The coding of deaths and assigning International Classification of Disease codes is undertaken by the Office for National Statistics (ONS) based on information supplied on the death record by the coroner. Due to the way in which information is recorded on the death certificate and coded by ONS, it is possible that a person who has used drugs for a long time who dies of drug poisoning is not necessarily recorded as dying from drug misuse (but are classified as dying from the broader category of drug poisoning).
The Hull Picture
Frequency of Using Drugs Other Than Those Required for Medical Reasons
In Hull’s Health and Wellbeing Survey 2019, 85% stated they had never used drugs other than those required for medical reasons, 4.6% had not used them in the last five years, 2.1% not in the last year, 1.9% rarely in the last year, 1.9% had used them a few times a year, 0.8% monthly, 1.5% weekly and 2.2% everyday.
However, there was a substantial difference by age and gender with 11.4% of men aged 16-24 years stating they used such drugs weekly compared to fewer than 2% among men aged 65+ years and women aged 35+ years. Just under one in ten people who were unemployed or were not working due to long-term illness and disability also stated they used such drugs weekly.
Estimated Prevalence of Opiate and/or Crack Cocaine Use
In 2019/20, it was estimated that the prevalence of opiate and/or crack cocaine use among people aged 15-64 years was 22.2 per 1,000 population in Hull which was more than double the rate in England.
The estimated prevalence uses a capture-recapture method to estimate the number of people who used opiate and/or crack cocaine. The capture-recapture method is often used to estimate the population size of an animal species with animals trapped, marked in a harmless way and released, and then new traps are set a few days later, and the number of marked and unmarked animals caught being recorded. The population size is then estimated to be the number in the first sample multiplied by the number in the second sample divided by the number in the second sample previously marked. In the case of opiate and/or crack use, the number of people who use opiate and/or crack cocaine were identified from drug treatment, probation, police and prison data was used, and then the overlap between the data sources was used together with modelling techniques to examine this overlap and to produce prevalence estimates for those aged 15-64 years based on this capture-recapture methodology.
Compared with benchmark
| Indicator | Period | England | Yorkshire and the Humber region (statistical) | Kingston upon Hull | East Riding of Yorkshire | North East Lincolnshire | North Lincolnshire | York | North Yorkshire UA | Barnsley | Doncaster | Rotherham | Sheffield | Bradford | Calderdale | Kirklees | Leeds | Wakefield |
|---|---|---|---|---|---|---|---|---|---|---|---|---|---|---|---|---|---|---|
Estimated prevalence of opiate and/or crack cocaine use (Persons 15-64 yrs) | 2022/23 | 8.5 | 11.6 | 20.4 | 6.1 | 17.0 | 14.4 | 9.3 | 5.5 | 13.9 | 15.6 | 13.2 | 12.5 | 14.4 | 11.5 | 9.6 | 9.8 | 12.0 |
The rate in Hull was also highest across the Yorkshire and Humber region for 2019/20 with an estimated 3,798 residents of Hull aged 18-64 years using opiate and/or crack cocaine.
Compared with benchmark
Estimated prevalence of opiate and/or crack cocaine use (Persons 15-64 yrs) 2022/23
| Area |
Recent
Trend |
Count
|
Value
|
95%
Lower CI |
95%
Upper CI |
|
|---|---|---|---|---|---|---|
| England | 310717 | 8.5 | 8.1 | 8.9 | ||
| Yorkshire and the Humber region (statistical) | 40746 | 11.6 | 11.1 | 12.1 | ||
| Kingston upon Hull | 3604 | 20.4 | 18.9 | 21.8 | ||
| East Riding of Yorkshire | 1237 | 6.1 | 5.3 | 6.7 | ||
| North East Lincolnshire | 1645 | 17.0 | 15.2 | 18.5 | ||
| North Lincolnshire | 1496 | 14.4 | 13.0 | 15.7 | ||
| York | 1273 | 9.3 | 8.3 | 10.1 | ||
| North Yorkshire UA | 2052 | 5.5 | 5.0 | 6.0 | ||
| Barnsley | 2155 | 13.9 | 12.8 | 15.1 | ||
| Doncaster | 3063 | 15.6 | 14.3 | 16.5 | ||
| Rotherham | 2211 | 13.2 | 12.2 | 14.4 | ||
| Sheffield | 4691 | 12.5 | 11.7 | 13.5 | ||
| Bradford | 5050 | 14.4 | 13.5 | 15.5 | ||
| Calderdale | 1502 | 11.5 | 10.6 | 12.6 | ||
| Kirklees | 2665 | 9.6 | 8.8 | 10.5 | ||
| Leeds | 5379 | 9.8 | 9.4 | 10.5 | ||
| Wakefield | 2717 | 12.0 | 11.2 | 12.9 |
Source: OHID, based on multiple sources
The estimates have been similar in Hull for 2011/12, 2014/15 and 2016/17 at around 18 to 19 per 1,000 population aged 15-64 years, substantially higher than the rate in England which increased from 8.4 in 2011/12 to 8.9 in 2016/17 per 1,000 population. However, the rate in Hull is higher for 2019/20 at 22.2 per 1,000 population which is an increase of 23% since 2016/17. The increased between 2016/17 and 2019/20 for England was lower at 7%.
Compared with benchmark
Estimated prevalence of opiate and/or crack cocaine use (Persons 15-64 yrs)
|
Period
|
Kingston upon Hull |
Yorkshire and the Humber region (statistical)
|
England
|
||||
|---|---|---|---|---|---|---|---|
|
Count
|
Value
|
95%
Lower CI |
95%
Upper CI |
||||
| 2011/12 | • | 3229 | 18.4 | 16.5 | 20.4 | 10.4 | 8.4 |
| 2014/15 | • | 3309 | 19.1 | 16.4 | 21.6 | 10.6 | 8.6 |
| 2016/17 | • | 3146 | 18.1 | 16.8 | 20.3 | 10.8 | 8.9 |
| 2019/20 | • | 3798 | 22.2 | 19.9 | 24.5 | 12.0 | 9.5 |
| 2022/23 | • | 3604 | 20.4 | 18.9 | 21.8 | 11.6 | 8.5 |
Source: OHID, based on multiple sources
Adults With Substance Use Treatment Need Who Engage With Services Following Release From Prison
During 2024/25, over six in ten adults aged 18+ years with substance use treatment need engaged with community-based drug services following their release from prison. This was higher than England where the percentages was 57%.
The number of individuals who successfully engage in community-based structured treatment following release from prison is defined as starting a treatment intervention within 21 days of release from prison. The indicator is presented as a percentage out of the number of individuals who at the point of departure from prison were transferred to a community treatment provider in the local authority for structured treatment interventions post release.
Compared with benchmark
| Indicator | Period | England | Yorkshire and the Humber region (statistical) | Kingston upon Hull | East Riding of Yorkshire | North East Lincolnshire | North Lincolnshire | York | North Yorkshire UA | Barnsley | Doncaster | Rotherham | Sheffield | Bradford | Calderdale | Kirklees | Leeds | Wakefield |
|---|---|---|---|---|---|---|---|---|---|---|---|---|---|---|---|---|---|---|
Adults with substance misuse treatment need who successfully engage in community based structured treatment following release from prison (Persons 18+ yrs) | 2024/25 | 57.1 | 65.9 | 62.2 | 60.3 | 71.8 | 70.7 | 54.4 | 76.0 | 74.5 | 76.5 | 59.0 | 66.9 | 62.7 | 60.4 | 64.0 | 58.4 | 76.0 |
In 2015/16, the percentage was 35%, but halved to around 16% between 2016/17 and 2018/19. In contrast, the percentage in England and across the region increased slightly. Between 2019/20 and 2021/22, the percentage in Hull was comparable to England, and whilst the rate fell in Hull for 2022/23, the rate has increased substantially to its highest level at 62% in Hull for 2024/25.
Compared with benchmark
Adults with substance misuse treatment need who successfully engage in community based structured treatment following release from prison (Persons 18+ yrs)
|
Period
|
Kingston upon Hull |
Yorkshire and the Humber region (statistical)
|
England
|
||||
|---|---|---|---|---|---|---|---|
|
Count
|
Value
|
95%
Lower CI |
95%
Upper CI |
||||
| 2015/16 | • | 116 | 35.0% | 30.1% | 40.3% | 40.9% | 30.3% |
| 2016/17 | • | 71 | 16.9% | 13.7% | 20.8% | 32.1% | 30.3% |
| 2017/18 | • | 59 | 15.1% | 11.9% | 19.0% | 37.5% | 32.1% |
| 2018/19 | • | 68 | 16.7% | 13.4% | 20.6% | 38.7% | 34.2% |
| 2019/20 | • | 134 | 30.7% | 26.6% | 35.2% | 39.0% | 34.5% |
| 2020/21 | • | 152 | 37.3% | 32.8% | 42.1% | 40.8% | 38.1% |
| 2021/22 | • | 141 | 35.8% | 31.2% | 40.6% | 40.2% | 37.4% |
| 2022/23 | • | 120 | 34.2% | 29.4% | 39.3% | 43.0% | 42.6% |
| 2023/24 | • | 183 | 58.7% | 53.1% | 64.0% | 62.6% | 53.3% |
| 2024/25 | • | 263 | 62.2% | 57.5% | 66.7% | 65.9% | 57.1% |
Source: Office for Health Improvement and Disparities, National Drug Treatment Monitoring System
Numbers in Specialist Drug Treatment Services
In 2020/21, there were 10.6 people aged 18+ years per 1,000 population in Hull who were in specialist drug treatment services, which is 2.4 times higher the rate in England.
Compared with benchmark
| Indicator | Period | England | Yorkshire and the Humber region (statistical) | Kingston upon Hull | East Riding of Yorkshire | North East Lincolnshire | North Lincolnshire | York | North Yorkshire UA | Barnsley | Doncaster | Rotherham | Sheffield | Bradford | Calderdale | Kirklees | Leeds | Wakefield |
|---|---|---|---|---|---|---|---|---|---|---|---|---|---|---|---|---|---|---|
Adults in treatment at specialist drug misuse services: rate per 1000 population (Persons 18+ yrs) | 2020/21 | 4.5 | 5.7 | 10.6 | 2.3 | 8.6 | 5.9 | 3.6 | 2.5 | 5.7 | 6.9 | 6.6 | 5.5 | 7.4 | 5.4 | 5.6 | 6.3 | 7.2 |
The rate in Hull is the highest across Yorkshire and Humber. For 2020/21, only Middlesbrough (15.4), Hartlepool (11.6) and Blackpool (11.4) have higher rates among the 147 upper-tier local authorities across England with data for this indicator. However, with any such comparison, the numbers accessing treatment will be influenced by the way services are provided within each geographical area, and it is possible that certain geographical areas will have a higher percentage accessing services in whom there is a need, and there also might be differences between the ‘entry’ criteria for those accessing treatment or waiting lists, so any comparison needs to take these factors into consideration. Nevertheless, it is clear there are very high numbers of people in Hull accessing specialist drug treatment services.
Compared with benchmark
Adults in treatment at specialist drug misuse services: rate per 1000 population (Persons 18+ yrs) 2020/21
| Area |
Recent
Trend |
Count
|
Value
|
95%
Lower CI |
95%
Upper CI |
|
|---|---|---|---|---|---|---|
| England | 199156 | 4.5 | 4.5 | 4.5 | ||
| Yorkshire and the Humber region (statistical) | 25009 | 5.7 | 5.7 | 5.8 | ||
| Kingston upon Hull | 2137 | 10.6 | 10.2 | 11.1 | ||
| East Riding of Yorkshire | 637 | 2.3 | 2.1 | 2.5 | ||
| North East Lincolnshire | 1069 | 8.6 | 8.1 | 9.1 | ||
| North Lincolnshire | 803 | 5.9 | 5.5 | 6.3 | ||
| York | 633 | 3.6 | 3.4 | 3.9 | ||
| North Yorkshire UA | 1252 | 2.5 | 2.4 | 2.6 | ||
| Barnsley | 1116 | 5.7 | 5.4 | 6.0 | ||
| Doncaster | 1693 | 6.9 | 6.6 | 7.2 | ||
| Rotherham | 1367 | 6.6 | 6.2 | 6.9 | ||
| Sheffield | 2613 | 5.5 | 5.3 | 5.8 | ||
| Bradford | 2955 | 7.4 | 7.1 | 7.7 | ||
| Calderdale | 896 | 5.4 | 5.1 | 5.8 | ||
| Kirklees | 1901 | 5.6 | 5.3 | 5.8 | ||
| Leeds | 3948 | 6.3 | 6.1 | 6.5 | ||
| Wakefield | 1989 | 7.2 | 6.9 | 7.5 |
Source: OHID, based on National Drug Treatment Monitoring System and Office for National Statistics data
The rate in Hull has been around 10 per 1,000 population (or 1% of the population) in Hull since 2013/14, but as previously mentioned slightly lower in 2017/18.
Compared with benchmark
Adults in treatment at specialist drug misuse services: rate per 1000 population (Persons 18+ yrs)
|
Period
|
Kingston upon Hull |
Yorkshire and the Humber region (statistical)
|
England
|
||||
|---|---|---|---|---|---|---|---|
|
Count
|
Value
|
95%
Lower CI |
95%
Upper CI |
||||
| 2013/14 | • | 2140 | 10.6 | 10.1 | 11.0 | 6.2 | 5.0 |
| 2014/15 | • | 2060 | 10.2 | 9.7 | 10.6 | 6.1 | 4.8 |
| 2015/16 | • | 2105 | 10.4 | 9.9 | 10.8 | 5.9 | 4.7 |
| 2016/17 | • | 2013 | 9.9 | 9.4 | 10.3 | 5.8 | 4.6 |
| 2017/18 | • | 1801 | 8.8 | 8.4 | 9.2 | 5.6 | 4.4 |
| 2019/20 | • | 2019 | 10.0 | 9.5 | 10.4 | 5.6 | 4.5 |
| 2020/21 | • | 2137 | 10.6 | 10.2 | 11.1 | 5.7 | 4.5 |
Source: OHID, based on National Drug Treatment Monitoring System and Office for National Statistics data
Hepatitis Tests and Vaccinations Among Eligible People in Drug Treatment Services
During 2016/17, 5.6% of people entering drug treatment services who were eligible had had a course of hepatitis B vaccination (compared to 8.1% in England), and for 2017/18, 84.3% had had a hepatitis C vaccination (compared to 84.2% for England).
Compared with benchmark
| Indicator | Period | England | Yorkshire and the Humber region (statistical) | Kingston upon Hull | East Riding of Yorkshire | North East Lincolnshire | North Lincolnshire | York | North Yorkshire UA | Barnsley | Doncaster | Rotherham | Sheffield | Bradford | Calderdale | Kirklees | Leeds | Wakefield |
|---|---|---|---|---|---|---|---|---|---|---|---|---|---|---|---|---|---|---|
Persons entering drug misuse treatment - Percentage of eligible persons completing a course of hepatitis B vaccination (Persons 18+ yrs) | 2016/17 | 8.1 | 7.6 | 5.6 | - | 15.1 | 48.4 | 5.7 | 5.0 | 2.5 | 1.5 | - | - | 9.0 | 2.9 | 4.3 | 1.0 | 10.5 |
Persons in drug misuse treatment who inject drugs - Percentage of eligible persons who have received a hepatitis C test (Persons 18+ yrs) | 2017/18 | 84.2 | 83.6 | 84.3 | 65.0 | 77.0 | 87.0 | 91.3 | 87.9 | 65.7 | 84.7 | 75.0 | 93.8 | 84.7 | 92.0 | 88.2 | 87.7 | 75.8 |
Users Successfully Completing Treatment
For 2023/24, just under one-quarter of non-opiate users and 3.4% of opiate users successfully completed treatment compared to 29.5% and 5.1% respectively for England. The percentages in Hull were statistically significantly lower in Hull than England.
Successful treatment was defined as users who had left drug treatment (free of drug(s) of dependence) who did not then re-present to treatment again within six months (and it is given as a percentage of the total number of users in treatment).
Compared with benchmark
| Indicator | Period | England | Yorkshire and the Humber region (statistical) | Kingston upon Hull | East Riding of Yorkshire | North East Lincolnshire | North Lincolnshire | York | North Yorkshire UA | Barnsley | Doncaster | Rotherham | Sheffield | Bradford | Calderdale | Kirklees | Leeds | Wakefield |
|---|---|---|---|---|---|---|---|---|---|---|---|---|---|---|---|---|---|---|
Successful completion of drug treatment: non opiate users (Persons 18+ yrs) | 2024/25 | 29.1 | 29.6 | 23.5 | 44.8 | 28.3 | 40.3 | 18.7 | 30.6 | 35.5 | 25.9 | 19.0 | 22.3 | 29.2 | 35.2 | 30.6 | 34.3 | 31.9 |
Successful completion of drug treatment: opiate users (Persons 18+ yrs) | 2024/25 | 5.3 | 5.3 | 3.9 | 6.7 | 4.4 | 7.5 | 3.3 | 8.8 | 6.7 | 3.8 | 4.5 | 4.0 | 4.0 | 8.7 | 4.1 | 7.6 | 4.3 |
Between 2010/11 and 2020/21, except for 2016/17, the percentage of non-opiate users aged 18+ years successfully completing treatment has been consistently lower than England.
Whilst the percentage have increased slightly in Hull in the last year between 2022/23 and 2023/24, the absolute number completing treatment has increased substantially for non-opiate users from just over 100 to 176 people.
There is considerably year-on-year variability in Hull as illustrated by the relatively wide confidence intervals as the total numbers are relatively small (see Confidence Intervals and Small Numbers in the Glossary for more information).
In 2023/24, 176 non-opiate users successful completed treatment (out of 733) in Hull.
Compared with benchmark
Successful completion of drug treatment: non opiate users (Persons 18+ yrs)
|
Period
|
Kingston upon Hull |
Yorkshire and the Humber region (statistical)
|
England
|
||||
|---|---|---|---|---|---|---|---|
|
Count
|
Value
|
95%
Lower CI |
95%
Upper CI |
||||
| 2010/11 | • | 47 | 35.3% | 27.7% | 43.8% | 30.4% | 34.4% |
| 2011/12 | • | 69 | 28.9% | 23.5% | 34.9% | 36.7% | 36.8% |
| 2012/13 | • | 96 | 28.2% | 23.6% | 33.1% | 35.9% | 37.9% |
| 2013/14 | • | 97 | 27.2% | 22.8% | 32.0% | 36.3% | 37.8% |
| 2014/15 | • | 102 | 26.8% | 22.6% | 31.5% | 40.1% | 39.2% |
| 2015/16 | • | 117 | 30.2% | 25.8% | 34.9% | 34.8% | 37.3% |
| 2016/17 | • | 168 | 42.3% | 37.6% | 47.2% | 36.0% | 37.1% |
| 2017/18 | • | 91 | 29.4% | 24.6% | 34.7% | 37.7% | 36.9% |
| 2018/19 | • | 70 | 22.9% | 18.5% | 27.9% | 29.6% | 34.4% |
| 2019/20 | • | 67 | 19.0% | 15.2% | 23.4% | 31.0% | 34.2% |
| 2020/21 | • | 127 | 29.3% | 25.2% | 33.7% | 33.6% | 33.0% |
| 2021/22 | • | 102 | 21.4% | 17.9% | 25.3% | 32.6% | 34.3% |
| 2022/23 | • | 109 | 20.1% | 16.9% | 23.6% | 31.9% | 31.4% |
| 2023/24 | • | 176 | 24.0% | 21.0% | 27.2% | 29.2% | 29.5% |
| 2024/25 | • | 199 | 23.5% | 20.8% | 26.5% | 29.6% | 29.1% |
Source: Office for Health Improvement and Disparities, National Drug Treatment Monitoring System
In general, the same pattern occurred for opiate users and successful completion of treatment although there was less of a discrepancy between Hull and England. In 2016, the percentage was also high as it was for non-opiate users.
The success rate was particularly low in 2020 which could be due to disruptions to services initially due to the COVID-19 pandemic. The percentage has increased since then.
The confidence intervals are also relatively wide due to small numbers (see Confidence Intervals and Small Numbers in the Glossary for more information).
In 2023/24, 57 opiate users successful completed treatment (out of 1,676) in Hull.
Compared with benchmark
Successful completion of drug treatment: opiate users (Persons 18+ yrs)
|
Period
|
Kingston upon Hull |
Yorkshire and the Humber region (statistical)
|
England
|
||||
|---|---|---|---|---|---|---|---|
|
Count
|
Value
|
95%
Lower CI |
95%
Upper CI |
||||
| 2010/11 | • | 137 | 6.6% | 5.6% | 7.8% | 5.1% | 6.7% |
| 2011/12 | • | 147 | 7.2% | 6.2% | 8.4% | 7.3% | 8.6% |
| 2012/13 | • | 142 | 7.4% | 6.3% | 8.6% | 7.0% | 8.3% |
| 2013/14 | • | 135 | 7.5% | 6.4% | 8.8% | 6.9% | 7.8% |
| 2014/15 | • | 93 | 5.4% | 4.4% | 6.5% | 6.2% | 7.4% |
| 2015/16 | • | 98 | 5.7% | 4.7% | 6.9% | 5.8% | 6.7% |
| 2016/17 | • | 165 | 10.0% | 8.6% | 11.5% | 5.7% | 6.7% |
| 2017/18 | • | 115 | 7.4% | 6.2% | 8.8% | 5.5% | 6.5% |
| 2018/19 | • | 75 | 5.0% | 4.0% | 6.2% | 4.7% | 5.8% |
| 2019/20 | • | 76 | 4.7% | 3.7% | 5.8% | 5.1% | 5.6% |
| 2020/21 | • | 38 | 2.3% | 1.7% | 3.1% | 4.2% | 4.7% |
| 2021/22 | • | 47 | 2.8% | 2.1% | 3.7% | 4.5% | 5.0% |
| 2022/23 | • | 59 | 3.5% | 2.7% | 4.5% | 4.5% | 5.0% |
| 2023/24 | • | 57 | 3.4% | 2.7% | 4.4% | 5.0% | 5.1% |
| 2024/25 | • | 64 | 3.9% | 3.0% | 4.9% | 5.3% | 5.3% |
Source: Office for Health Improvement and Disparities, National Drug Treatment Monitoring System
Smoking Prevalence Among Adults Admitted to Substance Treatment Services
Over 80% of people admitted to substance treatment services in 2019/20 smoked.
Compared with benchmark
| Indicator | Period | England | Yorkshire and the Humber region (statistical) | Kingston upon Hull | East Riding of Yorkshire | North East Lincolnshire | North Lincolnshire | York | North Yorkshire UA | Barnsley | Doncaster | Rotherham | Sheffield | Bradford | Calderdale | Kirklees | Leeds | Wakefield |
|---|---|---|---|---|---|---|---|---|---|---|---|---|---|---|---|---|---|---|
Smoking prevalence in adults (aged 18 and over) admitted to treatment for substance misuse (NDTMS) - all opiates (Persons 18+ yrs) | 2019/20 | 70.2 | 73.8 | 86.6 | 60.7 | 79.6 | 67.7 | 43.8 | 70.1 | 75.5 | 62.3 | 81.8 | 74.2 | 81.3 | 74.5 | 69.5 | 78.5 | 64.4 |
Smoking prevalence in adults (aged 18 and over) admitted to treatment for substance misuse (NDTMS) - non-opiates (Persons 18+ yrs) | 2019/20 | 62.0 | 66.4 | 80.6 | 47.6 | 72.7 | 65.9 | 26.7 | 66.7 | 78.6 | 66.7 | 61.7 | 31.5 | 75.0 | 79.1 | 83.7 | 73.6 | 49.4 |
The number of adults admitted to services who smoked has increased over time in Hull, but it is possible that this increase is due to better recording of smoking status.
Compared with benchmark
Smoking prevalence in adults (aged 18 and over) admitted to treatment for substance misuse (NDTMS) - all opiates (Persons 18+ yrs)
|
Period
|
Kingston upon Hull |
Yorkshire and the Humber region (statistical)
|
England
|
||||
|---|---|---|---|---|---|---|---|
|
Count
|
Value
|
95%
Lower CI |
95%
Upper CI |
||||
| 2016/17 | • | 181 | 79.7% | 74.0% | 84.4% | 68.1% | 59.4% |
| 2017/18 | • | 228 | 85.7% | 81.0% | 89.4% | 75.2% | 68.4% |
| 2018/19 | • | 209 | 89.7% | 85.1% | 93.0% | 75.1% | 70.4% |
| 2019/20 | • | 239 | 86.6% | 82.1% | 90.1% | 73.8% | 70.2% |
Source: Office for Health Improvement and Disparities, National Drug Treatment Monitoring System
Smoking prevalence in adults (aged 18 and over) admitted to treatment for substance misuse (NDTMS) - non-opiates (Persons 18+ yrs)
|
Period
|
Kingston upon Hull |
Yorkshire and the Humber region (statistical)
|
England
|
||||
|---|---|---|---|---|---|---|---|
|
Count
|
Value
|
95%
Lower CI |
95%
Upper CI |
||||
| 2016/17 | • | 24 | 75.0% | 57.9% | 86.7% | 52.2% | 47.3% |
| 2017/18 | • | 18 | 75.0% | 55.1% | 88.0% | 59.4% | 56.7% |
| 2018/19 | • | 17 | 89.5% | 68.6% | 97.1% | 64.2% | 60.4% |
| 2019/20 | • | 25 | 80.6% | 63.7% | 90.8% | 66.4% | 62.0% |
Source: Office for Health Improvement and Disparities, National Drug Treatment Monitoring System
Deaths from Drug Poisoning and Drug Misuse
Difference Between Drug Poisoning and Drug Misuse Causes
As mentioned above deaths from drug misuse are a subset of drug poisoning deaths. Deaths are only classified as a drug misuse death if the specific name of a drug controlled under the Misuse of Drugs Act 1971 is mentioned on the death certificate record (see The Population Affected – Why is it Important? above for more details).
Deaths from Drug Misuse
The directly standardised mortality rate per 100,000 population (standardised to the European Standard Population) for deaths related to drug use is statistically significantly higher in Hull for 2021-23 compared to England for both men and women.
The mortality rate in Hull is 70% higher than England for men and more than double the rate in Hull for women.
Compared with benchmark
| Indicator | Period | England | Yorkshire and the Humber region (statistical) | Kingston upon Hull | East Riding of Yorkshire | North East Lincolnshire | North Lincolnshire | York | North Yorkshire UA | Barnsley | Doncaster | Rotherham | Sheffield | Bradford | Calderdale | Kirklees | Leeds | Wakefield |
|---|---|---|---|---|---|---|---|---|---|---|---|---|---|---|---|---|---|---|
Deaths from drug misuse (Persons All ages) | 2022 - 24 | 5.8 | 7.9 | 10.1 | 3.9 | 6.5 | 4.8 | 8.2 | 5.0 | 8.9 | 10.5 | 8.3 | 7.8 | 9.3 | 11.0 | 6.3 | 9.3 | 10.6 |
Deaths from drug misuse (Male All ages) | 2022 - 24 | 8.4 | 11.3 | 14.4 | 5.3 | 6.6 | 4.6 | 12.2 | 6.5 | 13.0 | 16.2 | 10.6 | 12.1 | 14.7 | 15.8 | 8.9 | 13.1 | 13.9 |
Deaths from drug misuse (Female All ages) | 2022 - 24 | 3.3 | 4.7 | 5.7 | 2.6 | 6.3 | 4.9 | 4.5 | 3.6 | 4.9 | 4.8 | 6.2 | 3.7 | 4.1 | 6.6 | 3.7 | 5.6 | 7.2 |
Between 2001-03 and 2020-22, in general, the mortality rate per 100,000 population from drug use has been statistically significantly higher in Hull than England with only five time periods where the rate was not statistically significantly higher (although for four of these five periods the rate in Hull was still higher than England just not statistically significantly with only one year where Hull had the same mortality rate as England).
The number of drug related deaths in Hull saw a spike in 2017 due to the introduction of a very toxic ingredient (carfentanil/fentanyl) into the local drug supply (predominantly heroin). The National Crime Agency and law enforcement took swift action to identify and cut off supply lines with the situation closely monitored by all agencies subsequently.
However, whilst the mortality rate decreased between 2015-17 and 2018-20 from 7.0 to 4.8 deaths per 100,000 population with the exclusion of the year 2017, the rate in Hull has increased sharply between 2018-20 and 2021/23 to a new high of 10.1 deaths per 100,000 population.
Since 2009-11, there has been around 40 deaths registered in each three year period, with a temporary spike in 2017. In 2018-20, the rate is among the lowest it has been in Hull since 2001-03 (only 2012-14 and 2013-15 had lower rates) with a total of 37 deaths from drug misuse over the three year period 2018-20. However, the numbers have increased and there were 77 deaths from drug misuse that were registered during the three year period 2021-23 so an average of 26 deaths per year.
Compared with benchmark
Deaths from drug misuse (Persons All ages)
|
Period
|
Kingston upon Hull |
Yorkshire and the Humber region (statistical)
|
England
|
||||
|---|---|---|---|---|---|---|---|
|
Count
|
Value
|
95%
Lower CI |
95%
Upper CI |
||||
| 2001 - 03 | • | 49 | 5.5 | 4.1 | 7.3 | 3.7 | 3.0 |
| 2002 - 04 | • | 48 | 5.6 | 4.1 | 7.4 | 3.7 | 2.8 |
| 2003 - 05 | • | 58 | 7.0 | 5.3 | 9.1 | 3.7 | 2.8 |
| 2004 - 06 | • | 64 | 7.8 | 6.0 | 10.0 | 3.7 | 2.9 |
| 2005 - 07 | • | 65 | 7.9 | 6.1 | 10.2 | 3.6 | 3.0 |
| 2006 - 08 | • | 57 | 7.1 | 5.4 | 9.2 | 3.6 | 3.2 |
| 2007 - 09 | • | 50 | 6.2 | 4.6 | 8.3 | 3.6 | 3.4 |
| 2008 - 10 | • | 45 | 5.8 | 4.2 | 7.8 | 3.7 | 3.4 |
| 2009 - 11 | • | 42 | 5.4 | 3.9 | 7.3 | 3.6 | 3.2 |
| 2010 - 12 | • | 40 | 5.2 | 3.7 | 7.1 | 3.5 | 3.0 |
| 2011 - 13 | • | 41 | 5.3 | 3.8 | 7.2 | 3.5 | 3.1 |
| 2012 - 14 | • | 31 | 4.1 | 2.8 | 5.8 | 3.7 | 3.4 |
| 2013 - 15 | • | 30 | 3.8 | 2.6 | 5.4 | 4.5 | 3.9 |
| 2014 - 16 | • | 43 | 5.5 | 3.9 | 7.4 | 4.9 | 4.2 |
| 2015 - 17 | • | 57 | 7.0 | 5.3 | 9.1 | 5.5 | 4.3 |
| 2016 - 18 | • | 54 | 6.7 | 5.0 | 8.8 | 5.7 | 4.5 |
| 2017 - 19 | • | 43 | 5.3 | 3.8 | 7.2 | 6.2 | 4.7 |
| 2018 - 20 | • | 37 | 4.8 | 3.3 | 6.6 | 6.7 | 5.0 |
| 2019 - 21 | • | 57 | 7.4 | 5.6 | 9.6 | 6.8 | 5.1 |
| 2020 - 22 | • | 67 | 8.7 | 6.7 | 11.1 | 7.0 | 5.2 |
| 2021 - 23 | • | 77 | 10.0 | 7.9 | 12.6 | 7.5 | 5.5 |
| 2022 - 24 | • | 78 | 10.1 | 8.0 | 12.6 | 7.9 | 5.8 |
Source: OHID, based on Office for National Statistics data
The majority of the 77 deaths registered during 2021-23 were among men with 53 (69%) of deaths registered in total over the three year period. There has been some year-on-year variability in the mortality rate. The mortality rate was high at 14.1 deaths per 100,000 population in 2004-06, but had steadily decreased to a low of 5.3 deaths per 100,000 population for 2012-14. The rate had subsequently increased to 11.6 deaths per 100,000 population for 2015-17 before decreasing to 7.2 deaths per 100,000 population for 2018-20. However, in the last three years, the rate has increased sharply – almost doubling – to a high not seen since 2005-07.
The confidence intervals are relatively wide due to small numbers (see Confidence Intervals and Small Numbers in the Glossary for more information).
Compared with benchmark
Deaths from drug misuse (Male All ages)
|
Period
|
Kingston upon Hull |
Yorkshire and the Humber region (statistical)
|
England
|
||||
|---|---|---|---|---|---|---|---|
|
Count
|
Value
|
95%
Lower CI |
95%
Upper CI |
||||
| 2001 - 03 | • | 40 | 9.0 | 6.4 | 12.3 | 6.0 | 4.6 |
| 2002 - 04 | • | 38 | 8.9 | 6.3 | 12.2 | 6.1 | 4.3 |
| 2003 - 05 | • | 52 | 12.4 | 9.2 | 16.3 | 6.1 | 4.3 |
| 2004 - 06 | • | 59 | 14.1 | 10.7 | 18.2 | 6.1 | 4.5 |
| 2005 - 07 | • | 57 | 13.4 | 10.1 | 17.4 | 5.9 | 4.7 |
| 2006 - 08 | • | 45 | 10.8 | 7.8 | 14.5 | 5.7 | 5.0 |
| 2007 - 09 | • | 37 | 8.8 | 6.2 | 12.2 | 5.8 | 5.3 |
| 2008 - 10 | • | 34 | 8.4 | 5.8 | 11.7 | 5.8 | 5.3 |
| 2009 - 11 | • | 35 | 8.5 | 5.9 | 11.8 | 5.5 | 4.9 |
| 2010 - 12 | • | 30 | 7.5 | 5.0 | 10.8 | 5.2 | 4.4 |
| 2011 - 13 | • | 29 | 7.3 | 4.9 | 10.6 | 5.1 | 4.5 |
| 2012 - 14 | • | 20 | 5.3 | 3.2 | 8.2 | 5.4 | 4.9 |
| 2013 - 15 | • | 24 | 5.9 | 3.7 | 8.7 | 6.7 | 5.7 |
| 2014 - 16 | • | 36 | 8.9 | 6.2 | 12.4 | 7.3 | 6.2 |
| 2015 - 17 | • | 48 | 11.6 | 8.6 | 15.5 | 8.0 | 6.3 |
| 2016 - 18 | • | 44 | 10.8 | 7.8 | 14.5 | 8.4 | 6.6 |
| 2017 - 19 | • | 36 | 8.7 | 6.1 | 12.1 | 9.0 | 6.8 |
| 2018 - 20 | • | 29 | 7.2 | 4.8 | 10.4 | 9.8 | 7.3 |
| 2019 - 21 | • | 43 | 11.0 | 7.9 | 14.8 | 9.8 | 7.5 |
| 2020 - 22 | • | 48 | 12.3 | 9.1 | 16.4 | 10.1 | 7.6 |
| 2021 - 23 | • | 53 | 13.6 | 10.1 | 17.8 | 10.7 | 8.0 |
| 2022 - 24 | • | 57 | 14.4 | 10.9 | 18.7 | 11.3 | 8.4 |
Source: OHID, based on Office for National Statistics data
For women, there has been around 10-12 deaths registered for most of the three year periods 2002-04 to 2018-20 although in some cases fewer than 10 (and the data is not presented for those years due to small numbers). The mortality rates from drug misuse has increased for women in Hull in the last three years to reach a new high of 6.4 deaths per 100,000 population. The highest rate prior to the pandemic was 3.4 deaths per 100,000 population for 2007-09 so the current rate is almost double the highest rate prior to the pandemic.
The confidence intervals are relatively wide due to small numbers (see Confidence Intervals and Small Numbers in the Glossary for more information). Where data is presented for Hull, the mortality rate has been higher than England for all periods except for 2016-18 where the rate is the same as England. In the last two years, despite the small numbers, the rate in Hull is statistically significantly higher than England.
During the three year period 2021-23, there were 24 deaths from drug misuse registered among Hull women so an average of around eight deaths per year.
Compared with benchmark
Deaths from drug misuse (Female All ages)
|
Period
|
Kingston upon Hull |
Yorkshire and the Humber region (statistical)
|
England
|
||||
|---|---|---|---|---|---|---|---|
|
Count
|
Value
|
95%
Lower CI |
95%
Upper CI |
||||
| 2002 - 04 | • | 10 | 2.1 | 1.0 | 4.0 | 1.5 | 1.3 |
| 2006 - 08 | • | 12 | 3.1 | 1.6 | 5.4 | 1.5 | 1.4 |
| 2007 - 09 | • | 13 | 3.4 | 1.8 | 5.8 | 1.5 | 1.5 |
| 2008 - 10 | • | 11 | 3.0 | 1.5 | 5.4 | 1.6 | 1.5 |
| 2010 - 12 | • | 10 | 2.8 | 1.3 | 5.2 | 1.8 | 1.6 |
| 2011 - 13 | • | 12 | 3.2 | 1.6 | 5.6 | 1.9 | 1.7 |
| 2012 - 14 | • | 11 | 2.8 | 1.4 | 5.1 | 2.0 | 1.8 |
| 2016 - 18 | • | 10 | 2.4 | 1.2 | 4.5 | 3.1 | 2.5 |
| 2019 - 21 | • | 14 | 3.6 | 2.0 | 6.1 | 4.0 | 2.8 |
| 2020 - 22 | • | 19 | 4.9 | 2.9 | 7.7 | 4.0 | 2.9 |
| 2021 - 23 | • | 24 | 6.4 | 4.1 | 9.6 | 4.4 | 3.1 |
| 2022 - 24 | • | 21 | 5.7 | 3.5 | 8.7 | 4.7 | 3.3 |
Source: OHID, based on Office for National Statistics data
Deaths from Drug Poisoning And Comparison With Deaths from Drug Misuse
The Office for Health Improvement & Disparities’ Fingertips presents the number and mortality rates for deaths from drug misuse, but information is also available on deaths from drug poisoning (although not on Fingertips).
Based on official statistics from the Office for National Statistics, there were 51 deaths among Hull residents that were recorded as a result of drug poisoning which were registered during 2020, 67 registered during 2021 and 63 registered during 2022. These are the highest absolute numbers since at least 1993. Whilst the numbers reduced to 45 deaths that were registered during 2023, the number of deaths due to drug use remained relatively unchanged.
| Year of registration | Number of drug poisoning deaths in Hull | Number of deaths due to drug misuse in Hull | |
| 1993 | 7 | 3 | |
| 1994 | 10 | 5 | |
| 1995 | 24 | 14 | |
| 1996 | 29 | 17 | |
| 1997 | 22 | 13 | |
| 1998 | 31 | 18 | |
| 1999 | 20 | 14 | |
| 2000 | 37 | 25 | |
| 2001 | 24 | 16 | |
| 2002 | 27 | 18 | |
| 2003 | 22 | 15 | |
| 2004 | 26 | 15 | |
| 2005 | 33 | 28 | |
| 2006 | 27 | 21 | |
| 2007 | 25 | 16 | |
| 2008 | 29 | 20 | |
| 2009 | 20 | 14 | |
| 2010 | 14 | 11 | |
| 2011 | 19 | 17 | |
| 2012 | 22 | 12 | |
| 2013 | 22 | 12 | |
| 2014 | 17 | 7 | |
| 2015 | 21 | 11 | |
| 2016 | 39 | 25 | |
| 2017 | 49 | 21 | |
| 2018 | 24 | 8 | |
| 2019 | 35 | 14 | |
| 2020 | 51 | 15 | |
| 2021 | 67 | 28 | |
| 2022 | 63 | 24 | |
| 2023 | 45 | 25 |
Of particular note is the percentage of deaths that are recorded as drug misuse deaths out of the total number of drug poisoning deaths. Between the three year periods 1993-95 and 2015-17, the majority of drug poisoning deaths were also classified as drug misuse deaths. Between 1993-95 and 1996-98 and between 2012-14 and 2015-17, the percentage was under 60%, but for the period 1997-99 and 2011-13 the percentages ranged from 62% to 79%. For the the more recent periods of 2017-19 to 2020-21, the percentages have been 40%, 34%, 37% and 37% respectively, although they have increased to 44% for 2021-23.
The main difference between deaths recorded as drug misuse and recorded as drug poisoning is that drug misuse deaths require a mention of a specific drug controlled under the Misuse of Drugs Act 1971 on the death certificate. It is possible that the changes have occurred over time in either the use and/or recording of specific drugs on the death certificate. This could result if there were changes over time in the specific drugs people were dying from, if these were not specifically listed by name under the Misuse of Drugs Act 1971. If this was the case, this would result in a lower percentage of drug poisoning deaths recorded as drug misuse deaths. As the number of deaths from drug misuse is generally the measure used for drug-related mortality, this does become a problem for Hull as it will not give the true picture on the impact of deaths which are related to drug misuse in Hull. It is also possible that the way in which the underlying cause of death is determined by the Office for National Statistics based on information provided within the death certificate could have changed slightly over time. There could be other changes over time which could have influenced the recording of drug poisoning deaths.
However, the pattern is different for different for England with a tendency for the number of drug misuse deaths as a percentage of the total drug poisonings death to have increased over time from around 40% for 1993-95 to 64% in 2021-23.
Over the three year period 1993-95, there were 41 drug poisoning deaths registered among Hull residents but this increased over time to around 80 deaths over three years between 1996-98 and 2007-09. The number of drug poisoning deaths fell slightly to around 60 over each three year period between 2008-10 and 2013-15. However, since 2013-15, the number of deaths has increased to around 110 over three years between 2015-17 and 2018-20 before increasing to 153 for 2019-21 and to 181 for 2020-22, although there has been a small decrease to 175 for 2021-23.
Whilst there was considerable variability between 1993-95 and 2014-16, the total number of deaths from drug poisoning rose sharply between 2015-17 and 2021-23. If the total number of deaths from drug misuse are examined this sharp increase is less obvious. There were 57, 67 and 77 deaths from drug misuse for 2019-21, 2020-22 and 2021-23 respectively with a total number of deaths from drug poisoning being 153, 181 and 175 respectively. There have been other periods of time when the total number of deaths from drug misuse was 55 or more (1998-00 to 2000-02 and 2003-05 to 2006-08) but the highest number of deaths from drug poisoning from these seven periods of time was 88 deaths far below the number currently.
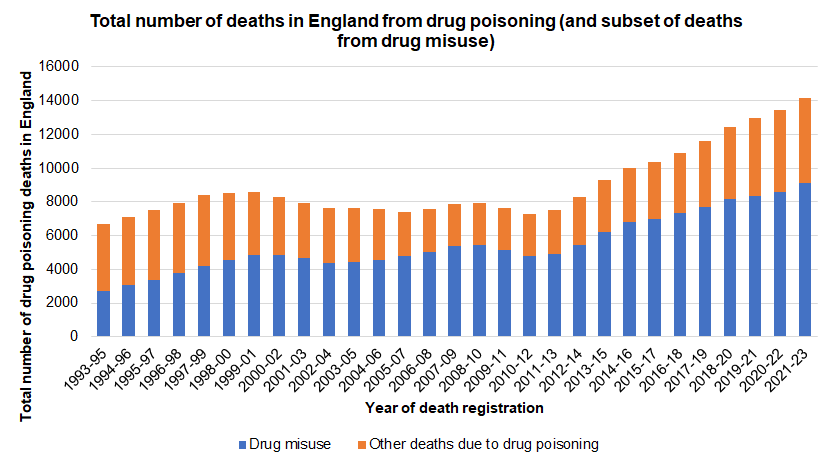
The pattern is quite different for England with between 7,300 and 7,900 deaths from drug poisoning in total between 2001-03 and 2011-13 with drug misuse deaths making up between 58% and 68% of these deaths depending on the period of time (drug misuse deaths ranged from 4,400 to 5,400 within this period). Whilst there has been a substantial increase to over 14,000 total drug poisoning deaths for 2021-23 as the percentage of deaths that were drug misuse (64%) has remained relatively unchanged. It means that the number of drug misuse deaths has increased at a similar rate to the increase in the total drug poisoning deaths. Between 2011-13 and 2021-23, the percentage increase in the total number of drug poisoning deaths was 88% and the percentage increase in the total number of drug misuse deaths was 86%.
However, in Hull prior to the relatively large increases, the total number of deaths from drug poisoning has increased by 127% between 2014-16 and 2021-23 whereas the number of deaths from drug misuse has increased by 79% (as the percentage of deaths from drug misuse has decreased by 21% from 56% to 44%).
The directly standardised mortality rate from drug poisoning deaths registered during the three year period 2021 to 2023 was 23.1 deaths per 100,000 population for persons, 33.9 deaths per 100,000 population for males and 11.9 deaths per 100,000 population for for females. Hull ranked third highest of of the 281 lower-tier local authorities where the mortality rate is provided (with 10+ deaths registered over the three years). Only Middlesbrough (28.5 deaths per 100,000 population) and Blackpool (31.9 deaths per 100,000 population) have higher mortality rates. Hull also ranks third highest (out of 250 upper-tier local authorities with data) for males in relation to deaths from drug poisoning with Middlesbrough (40.5 deaths per 100,000 population) and Blackpool (46.6 deaths per 100,000 population) having higher mortality rates. Hull ranks eighth highest (out of 175 upper-tier local authorities with data) for females in relation to deaths from drug poisoning with Blackpool (17.3 deaths per 100,000 population) having the highest mortality rate.
As a relatively low percentage of Hull’s drug poisoning deaths are recorded as drug misuse deaths, the rankings for Hull for drug misuse are not as high (18th highest out of 236 for persons, 30th highest out of 192 for males, and 15th highest out of 87 for females).
There is a strong association with deprivation. Based on the Index of Multiple Deprivation 2019, among the 317 local authorities at the time, Hull was ranked the fourth most deprived local authority in England, and Blackpool and Middlesbrough were ranked as first and fifth highest.
Examining the trends over time, from the low of 3.8 deaths per 100,000 population from drug misuse in 2013-15, there has been an increase of 166% to 10.1 deaths per 100,000 population for 2021-23 (with the current rate more than two and a half times higher than it was eight years ago). However, for drug poisoning, from the low of 7.8 deaths per 100,000 population in 2013-15, there has been an increase of 203% to 23.6 deaths per 100,000 population to 2021-23 (triple the rate) although the rate has fallen slightly to 23.1 deaths per 100,000 population for the latest period 2021-23.
The increase in the mortality rate from drug poisoning in the last decade has been much greater than the increase in the mortality rate from drug misuse.
There has also been an increase in both the drug poisoning and drug misuse mortality rates for England but the increase in the rate for drug poisoning in Hull has been much greater than for England.
The total number of deaths is higher among Hull men and has increased by a greater margin compared to women over the last decade.
In Hull, the mortality rate is much higher among men compared to men, and the increase in the mortality rate in the last decade has also been much greater among men compared to women for drug poisoning.
Between 2011-13 and 2021-23, the directly standardised mortality rate for drug misuse and drug poisoning among women has doubled (almost doubled in the case of drug misuse for men), but the mortality rate for drug poisoning among men has tripled over the same period. Information on drug misuse among women is not available for all periods of time for Hull as the number of deaths is too small (fewer than 10).
Local Analysis of Drug Poisoning Deaths
A local analysis of drug poisoning mortality has been undertaken in Hull to compare the mortality rate over time and examine the recent increase in the number of deaths which included examining data for 2015-19 and 2020-21 to assess any potential impact on the number of deaths due to the COVID-19 pandemic. The local analysis has been undertaken using the local mortality dataset which contains limited information on personal characteristics (gender, age at death, postcode from which deprivation can be measured and ward of residence, and underlying cause of death based on the International Classification of Disease version 10). It is not possible to undertake a local analysis on drug misuse deaths as information relating to the name(s) of specific drugs mentioned on the death certificate is not included in the dataset, although the ICD codes for cause of death are included which are much broader. Nevertheless it may provide some insight into the recent increase as follows by comparing drug poisonings deaths registered during 2015-19 with those registered during 2020-21:
- Of the 167 drug poisoning death registered during 2015-19, there was more than one year but less than two years between the date of death and the date of registration of the death for 11 (6.6%) deaths. For deaths registered during 2020-21, 17 (14.4%) of the 118 drug poisoning deaths had a delay of more than one year in death registration.
- Just under one-quarter (24.0%) of deaths registered during 2015-19 were among women compared to 27.1% for deaths registered during 2020-21.
- Whilst a similar percentage of drug poisoning deaths among men occurred in men aged under 35 years that were registered during 2015-19 (25%) and 2020-21 (23%), a higher percentage of men were aged 45+ years for deaths registered during 2020-21 (49%) compared to 2015-19 (35%). Among men, the median age at death was 41 years for deaths registered during 2015-19 but 44 years for deaths registered during 2020-21.
- Among women, around two-thirds (65%) of drug poisoning deaths registered during 2015-19 were among those aged under 45 years, this was 41% for deaths registered during 2020-21. Among women, the median age at death was 41 years for deaths registered during 2015-19 but 45 years for deaths registered during 2020-21.
- Based on the Index of Multiple Deprivation 2019, a higher percentage of deaths were registered during 2020-21 among men living in the most deprived areas of Hull compared to deaths registered during 2015-19. Overall, 37% of drug poisoning deaths among men that registered during 2020-21 occurred among men living in the most deprived fifth of areas of Hull and 26% occurred among men living in the second most deprived fifth of areas of Hull compared to 26% and 32% respectively for deaths registered during 2015-19. This was not the case for women, who had a higher percentage of drug poisoning deaths among women living in the most deprived areas of Hull for deaths registered during 2015-19 compared to 2020-21.
- Almost one-quarter (23.7%) of drug poisoning deaths which were registered during 2020-21 occurred among residents of St Andrew’s & Docklands ward, and this was considerably lower for deaths registered during 2015-19 (13.8%). The local authority was involved in relocating many homeless people from hostels into other temporary accommodation during the COVID-19 pandemic. If the people who died of drug poisoning whose deaths were registered during 2020-21 had recently moved then this could have affected the associations between deprivation and ward.
- For drug poisoning deaths registered during 2020-21, the percentage that were classified as suicide and undermined intent was lower compared than those registered during 2015-19 (8% versus 11%).
- The majority of drug poisoning deaths had an underlying cause of accidental poisoning, and this was the case for men for deaths registered during 2015-19 (87%) and 2020-21 (92%) and for women for deaths registered during 2015-19 (78%) and 2020-21 (84%).
- The number of deaths from ‘nonopioid analgesics, antipyretics and antirheumatics’, from ‘antiepileptic, sedative-hypnotic, antiparkinsonism and psychotropic drugs, not elsewhere classified’ and from ‘other drugs acting on the autonomic nervous system’ were too small to present separately, but overall from all three categories combined, there were five deaths among men and women that were registered during 2015-19, and 10 deaths among men and women that were registered during 2020-21. This was almost three times as many deaths registered during 2020-21 (8.5%) compared to 2015-19 (3.0%).
- It is not possible to examine drug poisonings from specific drugs as the coding is too wide with ‘narcotics’ as an entire group (38% of deaths registered during 2015-19 and 21% of deaths registered during 2020-21), and the majority of drug poisoning deaths are classified as ‘other and unspecified drugs, medicaments and biological substances’. The percentage of deaths from this latter category was higher among deaths registered during 2020-21 than 2015-19 (69% versus 50%). It is possible that this difference could reflect changes in the information presented on the death certificate or it could reflect differences in the substances or possibly combinations of substances.
Delays to Death Registration
There have been differences over time in the time period between death occurrence and death registration in Hull. For drug poisoning deaths which occurred between 2006 and 2014, none of them were registered a year or more after the death, and fewer than 10% of those deaths which occurred between 2015 and 2017. However, there was an increase subsequently. Just over one quarter (26.5%) of all drug poisoning deaths which occurred in 2018 were registered a year or more later, and this percentage remained relatively high during 2019 (17.5%) and 2020 (15.9%) before increasing to a high of 29.9% for deaths which occurred during 2021.
The relatively high number of deaths which occurred during 2017 and 2018 which were due to the introduction of a very toxic ingredient (carfentatil/fentanyl) into the local drug supply (predominantly heroin) mentioned above likely had an impact on death registration locally as there were greater delays to death registration. Not long after this, from March 2020, there were also substantial delays to death registration due to the COVID-19 pandemic. The number of all deaths increased which would have created additional delays in relation to death registration, and as noted above, combined with a substantial increase in the number of drug poisoning deaths in Hull had further resulted in delays to death registration. It would not have been possible to hold Coroner’s Inquest during the lockdown periods of the COVID-19 pandemic, and there were likely other restrictions which would have prevented or delayed Coroner’s Inquests. This problem is not unique to Hull, there were delays to inquests and death registration throughout the entire country following the pandemic.
The impact on the delays to death registration may affect the pattern of the mortality rates over time as the mortality rates are based on death registration. If there are consistent delays over time, this is less likely to affect the mortality rates. However, if there are delays in death registration it will mean that there will be fewer deaths registered in one year and potentially more later when the backlog is dealt with.
Estimated and Projected Numbers Living With a Drug Dependency
The Projecting Adult Needs and Service Information (PANSI) provides current estimates and future projections at local authority level of the number of people with different health needs. The prevalence for different age groups and for males and females estimated from different surveys and research has been applied to current population estimates and population projections to provide estimates for each local authority.
The estimates relating to drug dependence was based on the Adult Psychiatric Morbidity Survey conducted in 2014 in England. People who reported usage of particular drugs were asked about signs of dependence on that drug. The signs or markers, they were asked about were: daily use for two weeks or more; having a sense of need or dependence; inability to abstain; increased tolerance; and withdrawal symptoms. A new range of psychoactive substances (NPS) have entered the market but were not assessed in the survey. PANSI acknowledge that uncertainty over their content and rapid changes in what is available makes measuring the use of these substances in surveys challenging and knowledge of the prevalence of their use is limited.
The survey was completed some time ago, and it has been acknowledged that there has been the introduction of NPS substances since then. Furthermore, it is likely that the prevalence is higher in Hull given the relatively high levels of deprivation. Nevertheless, the prevalence estimates have been presented here and can be used as a guide to the potential prevalence.
The number of men and women aged 18-64 years with drug dependence is estimated to be 6,310 for Hull in 2023, and is projected to remain relatively unchanged.
| Gender/age | 2025 | 2030 | 2035 | 2040 | 2045 |
| Males 18-24 | 1,676 | 1,805 | 1,805 | 1,687 | 1,558 |
| Males 25-34 | 1,379 | 1,267 | 1,300 | 1,360 | 1,346 |
| Males 35-44 | 776 | 828 | 820 | 792 | 808 |
| Males 45-54 | 368 | 368 | 400 | 430 | 430 |
| Males 55-65 | 211 | 199 | 182 | 185 | 201 |
| Males 18-64 | 4,410 | 4,467 | 4,508 | 4,454 | 4,344 |
| Females 18-24 | 598 | 662 | 658 | 621 | 575 |
| Females 25-34 | 697 | 629 | 632 | 660 | 653 |
| Females 35-44 | 480 | 505 | 485 | 453 | 453 |
| Females 45-54 | 153 | 156 | 175 | 185 | 179 |
| Females 55-64 | 129 | 121 | 110 | 113 | 127 |
| Females 18-64 | 2,057 | 2,073 | 2,061 | 2,031 | 1,987 |
| All aged 18-64 | 6,466 | 6,541 | 6,568 | 6,485 | 6,330 |
Strategic Need and Service Provision
The Government’s 10-year Drugs Plan has three overarching aims to (1) Break drug supply chains, (2) Deliver world-class treatment and recovery services and (3) Achieve a shift in the demand for recreational drugs. The 10-Year Drugs Plan expects to reverse the rising trend in drug use, prevent drug deaths and expand treatment capacity. The document also recognises that addiction needs to be treated as a chronic health conditions, and therefore more needs to be done to break down stigma, save lives and support long-term recovery.
The Government’s Drugs Plan requires local authorities in England to rebuild commissioned substance treatment services to improve quality, capacity and outcomes, and commits to offer improvement support to make sure that local areas have the capacity and capability to deliver the transformation needed.
Hull’s Alcohol and Drugs Partnership Strategy 2022-25 provides key priorities and recommendations for preventing alcohol related harm. The Strategy has six priorities:
- Developing a Prevention and Early Intervention approach across the partnership;
- Implement a more targeted approach to support at-risk groups;
- Improving services to effectively support young people and adults with co-existing mental illness and substance use, and/or with multiple and complex needs;
- Tackling alcohol/drug related stigma to ensure people have equitable access to services and resources.;
- Developing community assets to achieve and sustain recovery; and
- Reducing the risks associated with alcohol/drug use by utilising a harm reduction approach.
The local Strategy has been co-produced with partners and relevant stakeholders to ensure local integration and shared accountability, and is well integrated with other strategies and plans to ensure a well-integrated approach to addressing drug problems across the city. Such strategies and plans include the Safer Hull plans and programme through the Community Safety Partnership, the Humberside Police Drugs Strategy, and Safeguarding and Early Help Strategies.
Social return on investment tools for drugs and alcohol make the case of investing in treatment programs to reduce overall crime and anti-social behaviour to reduce costs to society and the economy. It is estimated that over 323,447 crimes are committed before drug treatment entry. The main three crimes recorded for people in drug treatment are shoplifting (50%), drug offences (29%) and begging (7%) with an estimated 16% reduction in criminal activity and approximately 50,848 crimes prevented after starting treatment. The gross benefit of drug treatment in 2017/18 in Hull was estimated to be over £16,712,400.
The Office for National Statistics in relation to an increase in the deaths related to drug poisoning in England and Wales, note that the reasons behind this are complex and differ by drug type. They state that the overall trend is driven primarily by deaths involving opiates but also by an increase in deaths involving other substances like cocaine. They state that across Europe, rates of deaths involving heroin and morphine have been increasing while the number of new heroin and morphine users has fallen. This indicates higher rates of death among existing long-term drug users. Their possible explanations include an ageing cohort of long-term drug users becoming increasing susceptible to a fatal overdose, new trends in taking specific drugs which may increase the risk of an overdose, and a potential increase in disengagement or non-compliance with opiate substitute therapy.
Resources
Local Health and Wellbeing Survey 2019
The Office for Health Improvement & Disparities’ Fingertips: https://fingertips.phe.org.uk/
Office for National Statistics. Deaths related to drug poisoning in England and Wales: 2021 registrations. https://www.ons.gov.uk/peoplepopulationandcommunity/birthsdeathsandmarriages/deaths/bulletins/deathsrelatedtodrugpoisoninginenglandandwales/latest
Projecting Adult Needs and Service Information (PANSI). www.pansi.org.uk
Government’s 2017 Drug Strategy. https://assets.publishing.service.gov.uk/government/uploads/system/uploads/attachment_data/file/628148/Drug_strategy_2017.PDF
UK Government. From harm to hope: A 10-year drugs plan to cut crime and save lives. https://www.gov.uk/government/publications/from-harm-to-hope-a-10-year-drugs-plan-to-cut-crime-and-save-lives/from-harm-to-hope-a-10-year-drugs-plan-to-cut-crime-and-save-lives
Hull City Council. Drug and Alcohol Support. https://www.hull.gov.uk/health-and-wellbeing/public-health/drug-and-alcohol-support
Hull City Council. Hull Alcohol and Drugs Strategy 2022-25. https://www.hull.gov.uk/sites/hull/files/media/Editor%20-%20Public%20health/Hull%20Alcohol%20and%20Drugs%20Strategy%202022-2025.pdf
ReNew Hull. Recovery Hub. https://www.changegrowlive.org/hull-renew/recovery-hub
Updates
This page was last updated / checked on 12 January 2026.
This page is due to be updated / checked in September 2026.