Index
This topic area covers statistics and information relating to healthy weight among children and young people in Hull including local strategic need and service provision. Further information relating to Healthy Weight among Adults is given under Lifestyle Factors within Adults. Information relating to wanting to lose or gain weight was collected in Hull’s Young People Health and Wellbeing Surveys, and height and weight was recorded in Hull’s Adult Health and Wellbeing Surveys, and full reports are available under Surveys within Tools and Resources.
This page contains information from the Office for Health Improvement & Disparities’ Fingertips. Information is taken ‘live’ from the site so uses the latest available data from Fingertips and displays it on this page. As a result, some comments on this page may relate to an earlier period of time until this page is next updated (see review dates at the end of this page).
Summary Infographic
Headlines
- Children’s height and weight are routinely measured as part of the National Child Measurement Programme (NCMP) during reception year (Year R – aged 4-5 years) and Year 6 (aged 10-11 years) and has been since 2006/07 (except for 2020/21 due to the COVID-19 pandemic).
- In 2024/25, 2,895 Year R and 3,160 Year 6 children were measured as part of NCMP. This represented 90.0% of Year R children and 89.0% of Year 6 children which was lower than England (94.7% and 93.6% respectively).
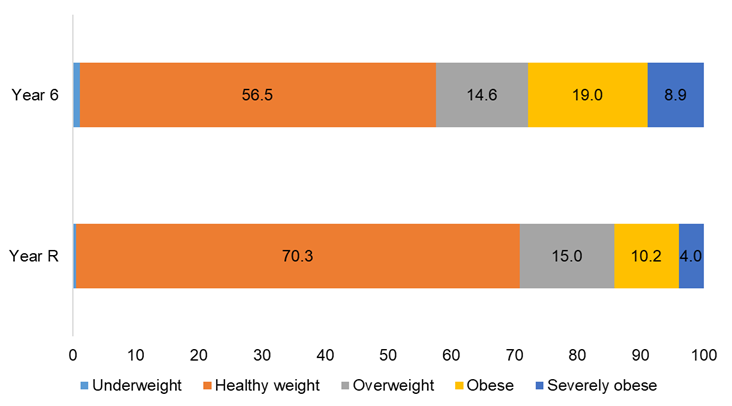
- For the 2024/25 school year, the majority of Year R and Year 6 children in Hull were a healthy weight with 70.3% of Year R children and 56.5% of Year 6 children being a healthy weight. Few Year R (0.5%) or Year 6 (1.1%) children were underweight.
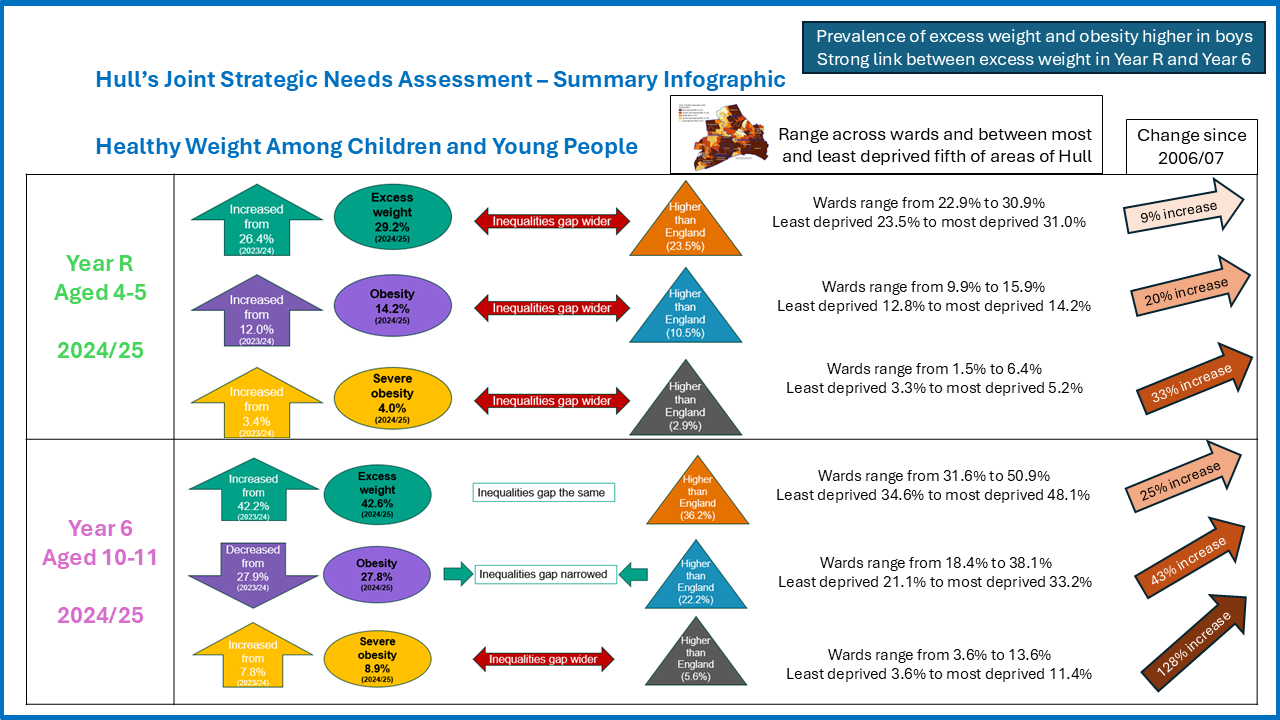
- Among children in Year R for the 2024/25 school year, 29.2% were either living with overweight or obesity. This is a relatively sharp increase in the last year from 26.4% and the latest prevalence is equal highest to the previous high in 2018/19. There has also been an increase across England in the last year but the increase in Hull has been greater. The prevalence is statistically significantly higher in Hull than England (23.5%). Overall, 845 Year R children were living with excess weight in Hull.
- One in seven (14.2%) Year R pupils were living with obesity in 2024/25 (of which 4.0% were severely obese) which has increased in the last two years although the prevalence is currently below its peak of 4.8% in 2021/22. There has also been an increase across England, but as the increase in the last two years has been greater in Hull, the inequalities gap between Hull and England has increased. Overall, 410 Year R children were living with obesity in Hull including 115 Year R children who were living with severe obesity.
- Among Year 6 children, 42.6% were either living with overweight or obesity in 2024/25 which was an increase in the previous two years. The rates are only marginally below the peak of 42.7% in 2021/22. There was also an increase across England, but the prevalence in Hull is considerably higher than England (36.2%). Overall, 1,345 Year 6 children were living with excess weight in Hull.
- Just over one-quarter (27.8%) of Year 6 children were living with obesity in 2024/25 which is similar to 2023/24 (27.9%). However, within this category, there has been a relatively sharp increase in the percentages of Year 6 children who are living with severe obesity (increasing from 7.8% in 2023/24 to 8.9% in 2024/25). The prevalence of severe obesity among Year 6 children has more than doubled since 2006/07 when it was 3.9%. The prevalence of severe obesity increased by 0.1 percentage points across England, and with a much higher increase for Hull, the inequalities gap for severe obesity has increased in the last year. Overall, 880 Year 6 children were living with obesity in Hull including 280 Year 6 children who were living with severe obesity in 2024/25.
- For Year R children in 2024/25, Hull ranked 7th highest out of the 151 upper-tier local authorities (worse 5%) for the percentage of children living with excess weight and obesity (both same rankings), and 15th highest (out of 150 and worst 10%) for severe obesity.
- For Year 6 children in 2024/25, Hull ranked 9th highest out of the 151 upper-tier local authorities (worse 6%) for the percentage of children living with excess weight, 10th highest (worst 7%) for obesity and 3rd highest (worst 2%) for severe obesity.
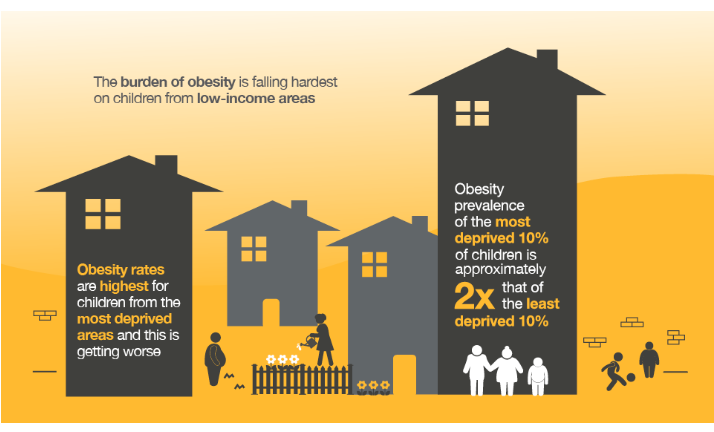
- The prevalence of obesity is more than twice as high among children living in the most deprived tenth of areas of England compared to children living in the least deprived tenth of areas of England for 2023/24, so it is not particularly surprising that the prevalence estimates are so high in Hull with its very high levels of deprivation. For children living with obesity, Hull is ranked as joint 12th highest among England’s 151 upper-tier local authorities (range 5.7% in Wokingham to 13.9% in Hartlepool) for Year R, and ranked joint 7th highest for Year 6 children (range 13.3% for Richmond upon Thames to 31.0% in Sandwell).
- From local analyses for the 2024/25 school year, a higher percentage of boys were living with excess weight, obesity or severe obesity compared to girls in Hull for both Year R and Year 6 children. This was also the case for England, although the differences between the boys and girls in Hull was greater than the differences in England. The differences in Hull were particularly high for Year 6 children living with severe obesity where the prevalence among males was double that of females (11.9% versus 5.4%).
- From local analyses for the 2024/25 school year, there was no statistically significant difference in the body mass index classification among different ethnic groups for either Year R or Year 6 children in Hull, although Year R children from ‘other’ minority ethnic groups had a statistically significantly higher percentage living with severe obesity compared to the Hull average (7.2% versus 4.0%). However, not all children had ethnicity recorded, and a higher percentage had ethnicity recorded as ‘other’ compare to 2021 Census so the local results on ethnicity should be treated relatively cautiously.
- From local analyses for the 2024/25 school year, among Year R children, the percentage living with excess weight varied from 22.9% in Kingswood to 30.6% in Sutton. Compared to the Hull average, the prevalence was statistically significantly lower in Kingswood ward. The percentage of children living with obesity varied from 9.9% in Bricknell to 15.9% in University, although the differences were not statistically significantly. The percentage of Year R children living with severe obesity varied from 1.5% in Kingswood to 6.4% in St Andrew’s & Docklands. Kingwood and Boothferry wards had a statistically significantly lower prevalence of severe obesity compared to the Hull average whereas Newington & Gipsyville, and St Andrew’s & Docklands had statistically significantly higher prevalence estimates of severe obesity among Year R children.
- From local analyses for the 2024/25 school year, among Year 6 children, the percentage living with excess weight varied from 31.6% in Kingswood ward to 50.9% in St Andrew’s & Docklands. Compared to the Hull average, the prevalence was statistically significantly higher in Central, Marfleet, Newington & Gipsyville, and St Andrew’s & Docklands wards and statistically significantly lower in Avenue, Bricknell, Holderness, Kingswood and Sutton wards. The percentage of children living with obesity varied from 18.4% in Kingswood to 38.1% in Central. Compared to the Hull average, the prevalence was statistically significantly higher in Central and St Andrew’s & Docklands wards and statistically significantly lower in Derringham, Avenue, Bricknell, Kingswood and Holderness wards. The percentage of Year 6 children living with severe obesity varied from 3.6% in Kingswood to 13.6% in St Andrew’s & Docklands. The prevalence of severe obesity was statistically significantly lower in Avenue and Kingswood wards compared to the Hull average, and statistically significantly higher in St Andrew’s & Docklands ward.
- From local analyses for the 2024/25 school year, across Hull’s eight Family Hub Clusters, there was variation in the prevalence of Year R and Year 6 children living with excess weight, obesity and severe obesity, although Fenchurch tended to have the highest number of children living with excess weight as the total number of children living in this Family Hub Cluster was highest.
- From local analyses for the 2024/25 school year, among Year R children, there was a statistically significant trend in the prevalence of excess weight and severe obesity among Year R children across Hull’s local deprivation fifths, and also a trend for Year 6 children for obesity.
- The prevalence of excess weight was 7.5 percentage points higher for Year R children and 13.5 percentage points higher for Year 6 children who lived in the most deprived fifth of areas of Hull compared to children who lived in the least deprived fifth of areas of Hull (31.0% versus 23.5% for Year R children and 48.1% versus 34.6% for Year 6 children).
- The percentage of children living with obesity was 12.1 percentage points higher for Year 6 children who lived in the most deprived fifth of areas of Hull compared to children who lived in the least deprived fifth of areas of Hull (33.2% versus 21.1% for Year 6 children).
- The percentage of children living with severe obesity was 1.9 percentage points higher for Year R children and 7.8 percentage points higher for Year 6 children who lived in the most deprived fifth of areas of Hull compared to children who lived in the least deprived fifth of areas of Hull (5.2% versus 3.3% for Year R children and 11.4% versus 3.6% for Year 6 children).
- A ‘paired analysis’ has been completed on 2,873 children who were measured in reception year in 2016/17 and their weight classifications were compared with their measurements six years later in Year 6 in 2022/23. There was a very strong association between weight in reception year and weight in Year 6. Children living with excess weight in reception year were much more likely to be living with excess weight in Year 6, and the likelihood was much higher among those living with obesity or severe obesity in reception year. Overall, half of children (52%) were a healthy weight in both reception year and Year 6, but one-fifth had moved from a healthy weight in reception year to living with excess weight in Year 6. A further 6.5% were living with excess weight in reception year but were a healthy weight in Year 6. One in five (20%) children were living with excess weight in both reception year and Year 6, and 9.4% of these children remained in the same excess weight category (overweight, obese or severe obesity), 2.2% had moved to a lower weight category in Year 6 but still had excess weight, and 8.9% had moved to a higher weight category in Year 6.
- In the paired analysis, boys and children living in the most deprived three-fifths of areas of Hull were more likely to be living with excess weight or living with obesity in Year 6 even after taking into account their weight classification in reception year. Boys also had an increased likelihood of living with severe obesity in Year 6 after taking into account their reception year weight classification. However, children living in the most deprived areas of Hull had no increased risk of living with severe obesity in Year 6 (they may have had an increased risk compared to children living in the least deprived areas of Hull but this was because they had higher levels of excess weight in reception year – they had no increased risk above that).
The Population Affected – Why Is It Important?
There are certain risks associated with being underweight or overweight.
Children and adults who are underweight or have poor nutrition have an increased risk of malnutrition, vitamin deficiencies, or anaemia, osteoporosis from too little vitamin D and calcium, decreased immune function, fertility issues caused by irregular menstrual cycles, and growth and development issues, especially in children and teenagers.
Excess weight in childhood is a significant health issue for children, young people, and their families. It can have serious implications for the physical and mental health of a child, which can then follow into adulthood. Children and young people who are living with excess weight are more likely to become adults with excess weight.
Excess weight among adults can reduce life expectancy by between three and ten years, depending on the severity of the obesity. Excess weight increases the risk of numerous daily problems and health conditions as well as increased complications within pregnancy. Excess weight can cause health issues and increase physical inactivity, but also can affect self-esteem and underlying mental health. In children and young people, it could increase bullying and impact negatively on their education and ultimately their future employment prospects. The cost of being overweight and obese to society and the economy is estimated to be £27 billion per year. The cost could increase to just under £50 billion in 2050 if obesity rates continue to rise.
The burden of excess weight falls hardest on children from lower income families.
The National Child Measurement Programme (NCMP) has been running since the school year 2006/07. Virtually all children in reception year (Year R) aged 4-5 years of age and all children in the last year of primary school (in Year 6) aged 10-11 years have their height and weight measured. The programme was affected during the COVID-19 pandemic. For England overall, participation rates are normally around 95%, but was 75% for the 2019/20 school year as schools closed in March 2020. Analysis revealed that figures for 2019/20 were comparable to previous years at national and regional levels. Local authority rates for 2019/20 were not as robust, and some estimates were unreliable. Hull was one of the local authorities not affected as all children in Hull had already been measured by March 2020. In 2020/21, local authorities were asked to collect a representative 10% sample because it was not feasible to expect a full NCMP collection so late into the academic year. This enabled national and regional estimates of children’s weight to be published, but no information at local authority level. The collection for 2021/22 was not affected, although the response rate in 2021/22 at 92% overall was slightly lower than pre-pandemic levels.
Given that children of different ages and genders grow and develop at different rates, the method used to define weight classification in UK children differs to the methods used for adults. The body mass index (BMI) is still used for children which is calculated as weight (in kilograms) by the square of height (in metres), but the BMI value is compared to reference sample measurements gathered in 1990 which takes into consideration age and gender (Cole and Freeman). These are referred to as UK 1990 growth reference charts.
- Underweight is based being lower than the 2nd centile (bottom 2% in 1990).
- Healthy weight as between the 2nd centile and less than the 85th centile (83% of population in 1990).
- Overweight as on or above the 85th centile (15% of population in 1990).
- Living with obesity as on or above the 95th centile (5% of population in 1990).
- Living with severe obesity as on or above the 99.6th centile (0.4% of population in 1990).
These thresholds are lower than clinical thresholds as these thresholds are used for monitoring at the population level and include more children who are within the ‘at risk’ of moving into the excess weight categories with the intention being that the ‘at risk’ cohort is known and can potentially have interventions to reduce their body mass index centile.
The Hull Picture
Prevalence Estimates
The Office for Health Improvement & Disparities’ Fingertips presents the percentage of children living with being underweight, a healthy weight, overweight, obesity and severe obesity as well as excess weight among children aged 4-5 years in reception year (Year R), and aged 10-11 years in Year 6 from the National Child Measurement Programme (NCMP) based on the local authority of where that child lives.
In 2024/25, 2,895 Year R and 3,160 Year 6 children were measured as part of NCMP. This represented 90.0% of Year R children and 89.0% of Year 6 children which was lower than England (94.7% and 93.6% respectively).
In the 2024/25 school year, 29.2% of children in Year R in Hull are living with excess weight including 14.2% who were living with obesity (which included 4.0% who were living with severe obesity). Very few Hull children in Year R were classified as underweight.
The majority (70.3%) were a healthy weight.
Compared with benchmark
| Indicator | Period | England | Yorkshire and the Humber region (statistical) | Kingston upon Hull | East Riding of Yorkshire | North East Lincolnshire | North Lincolnshire | York | North Yorkshire UA | Barnsley | Doncaster | Rotherham | Sheffield | Bradford | Calderdale | Kirklees | Leeds | Wakefield |
|---|---|---|---|---|---|---|---|---|---|---|---|---|---|---|---|---|---|---|
Reception prevalence of underweight (Persons 4-5 yrs) | 2024/25 | 1.1 | 0.9 | 0.5 | 0.4 | - | 0.6 | 1.3 | 0.3 | 0.6 | 0.6 | 0.7 | 1.1 | 1.5 | 1.0 | 1.6 | 0.9 | 1.2 |
Reception prevalence of healthy weight (Persons 4-5 yrs) | 2024/25 | 75.4 | 73.2 | 70.3 | 71.7 | 67.0 | 72.1 | 75.8 | 74.7 | 72.9 | 70.2 | 70.8 | 74.3 | 74.4 | 72.8 | 72.5 | 75.1 | 73.6 |
Reception prevalence of overweight (Persons 4-5 yrs) | 2024/25 | 13.0 | 13.9 | 15.0 | 16.9 | 17.8 | 15.6 | 13.2 | 14.6 | 14.0 | 16.2 | 14.8 | 13.0 | 11.7 | 13.7 | 13.3 | 13.0 | 13.3 |
Reception prevalence of obesity (including severe obesity) (Persons 4-5 yrs) | 2024/25 | 10.5 | 12.0 | 14.2 | 11.1 | 14.6 | 11.4 | 9.9 | 10.4 | 12.5 | 13.0 | 13.6 | 11.6 | 12.2 | 12.3 | 12.5 | 11.0 | 11.9 |
Reception prevalence of severe obesity (Persons 4-5 yrs) | 2024/25 | 2.9 | 3.6 | 4.0 | 3.2 | 4.4 | 3.2 | 3.3 | 2.6 | 3.6 | 3.5 | 4.3 | 3.4 | 4.3 | 3.4 | 3.9 | 3.2 | 3.6 |
Reception prevalence of overweight (including obesity) (Persons 4-5 yrs) | 2024/25 | 23.5 | 25.9 | 29.2 | 28.0 | 32.4 | 27.0 | 23.2 | 24.9 | 26.6 | 29.2 | 28.3 | 24.6 | 24.0 | 26.3 | 25.9 | 24.0 | 25.2 |
In Hull in the 2024/25 school year, more than four in ten Year 6 children (42.6%) are living with excess weight including over one-quarter (27.8%) who were living with obesity (which included 8.9% who were living with severe obesity).
Compared with benchmark
| Indicator | Period | England | Yorkshire and the Humber region (statistical) | Kingston upon Hull | East Riding of Yorkshire | North East Lincolnshire | North Lincolnshire | York | North Yorkshire UA | Barnsley | Doncaster | Rotherham | Sheffield | Bradford | Calderdale | Kirklees | Leeds | Wakefield |
|---|---|---|---|---|---|---|---|---|---|---|---|---|---|---|---|---|---|---|
Year 6 prevalence of underweight (Persons 10-11 yrs) | 2024/25 | 1.6 | 1.4 | 1.1 | 1.1 | 1.3 | 1.6 | 1.4 | 0.7 | 1.3 | 1.4 | 1.3 | 1.5 | 2.2 | 1.3 | 1.4 | 1.3 | 1.2 |
Year 6 prevalence of healthy weight (Persons 10-11 yrs) | 2024/25 | 62.2 | 60.7 | 56.5 | 62.5 | 59.6 | 59.1 | 63.9 | 65.1 | 58.4 | 58.3 | 58.3 | 60.7 | 58.1 | 62.5 | 61.0 | 62.4 | 61.2 |
Year 6 prevalence of overweight (Persons 10-11 yrs) | 2024/25 | 13.9 | 13.9 | 14.6 | 13.8 | 12.7 | 13.4 | 15.1 | 14.9 | 14.4 | 13.8 | 13.9 | 13.5 | 13.8 | 13.2 | 13.9 | 13.5 | 13.6 |
Year 6 prevalence of obesity (including severe obesity) (Persons 10-11 yrs) | 2024/25 | 22.2 | 24.1 | 27.8 | 22.7 | 26.1 | 26.2 | 19.3 | 19.3 | 25.9 | 26.6 | 26.7 | 24.1 | 25.9 | 23.1 | 23.7 | 22.8 | 23.9 |
Year 6 prevalence of severe obesity (Persons 10-11 yrs) | 2024/25 | 5.6 | 6.4 | 8.9 | 5.3 | 7.3 | 7.6 | 3.6 | 4.2 | 7.0 | 8.0 | 7.8 | 7.0 | 6.8 | 5.5 | 6.5 | 5.9 | 6.2 |
Year 6 prevalence of overweight (including obesity) (Persons 10-11 yrs) | 2024/25 | 36.2 | 37.9 | 42.6 | 36.4 | 39.1 | 39.5 | 34.7 | 34.2 | 40.4 | 40.3 | 40.5 | 37.7 | 39.7 | 36.3 | 37.6 | 36.3 | 37.5 |
The prevalence of the BMI categories is illustrated in graphical form below for Hull for 2024/25 comparing Year R and Year 6 children.
Year R (Aged 4-5 Years)
The percentage of Year R children who are underweight is relatively low in Hull compared to other local authorities in the region for 2024/25.
Compared with benchmark
Reception prevalence of underweight (Persons 4-5 yrs) 2024/25
| Area |
Recent
Trend |
Count
|
Value
|
95%
Lower CI |
95%
Upper CI |
|
|---|---|---|---|---|---|---|
| England | 5989 | 1.1 | 1.1 | 1.1 | ||
| Yorkshire and the Humber region (statistical) | 505 | 0.9 | 0.8 | 1.0 | ||
| Kingston upon Hull | 15 | 0.5 | 0.3 | 0.9 | ||
| East Riding of Yorkshire | 10 | 0.4 | 0.2 | 0.6 | ||
| North East Lincolnshire | - | - | - | - | ||
| North Lincolnshire | 10 | 0.6 | 0.3 | 1.2 | ||
| York | 20 | 1.3 | 0.8 | 1.9 | ||
| North Yorkshire UA | 15 | 0.3 | 0.2 | 0.5 | ||
| Barnsley | 15 | 0.6 | 0.3 | 0.9 | ||
| Doncaster | 20 | 0.6 | 0.4 | 0.9 | ||
| Rotherham | 20 | 0.7 | 0.5 | 1.1 | ||
| Sheffield | 65 | 1.1 | 0.8 | 1.4 | ||
| Bradford | 95 | 1.5 | 1.3 | 1.9 | ||
| Calderdale | 20 | 1.0 | 0.7 | 1.6 | ||
| Kirklees | 75 | 1.6 | 1.3 | 2.0 | ||
| Leeds | 70 | 0.9 | 0.7 | 1.1 | ||
| Wakefield | 45 | 1.2 | 0.9 | 1.6 |
Source: Department of Health and Social Care, National Child Measurement Programme
The percentage of Year R children who are a healthy weight in Hull is among the lowest in the region for 2024/25.
Compared with benchmark
Reception prevalence of healthy weight (Persons 4-5 yrs) 2024/25
| Area |
Recent
Trend |
Count
|
Value
|
95%
Lower CI |
95%
Upper CI |
|
|---|---|---|---|---|---|---|
| England | 411345 | 75.4 | 75.3 | 75.5 | ||
| Yorkshire and the Humber region (statistical) | 40110 | 73.2 | 72.8 | 73.5 | ||
| Kingston upon Hull | 2035 | 70.3 | 68.6 | 71.9 | ||
| East Riding of Yorkshire | 2035 | 71.7 | 70.0 | 73.3 | ||
| North East Lincolnshire | 1055 | 67.0 | 64.8 | 69.4 | ||
| North Lincolnshire | 1135 | 72.1 | 70.0 | 74.4 | ||
| York | 1145 | 75.8 | 73.5 | 77.9 | ||
| North Yorkshire UA | 3670 | 74.7 | 73.5 | 76.0 | ||
| Barnsley | 1920 | 72.9 | 71.1 | 74.5 | ||
| Doncaster | 2315 | 70.2 | 68.6 | 71.7 | ||
| Rotherham | 1980 | 70.8 | 69.2 | 72.5 | ||
| Sheffield | 4320 | 74.3 | 73.2 | 75.4 | ||
| Bradford | 4600 | 74.4 | 73.3 | 75.5 | ||
| Calderdale | 1510 | 72.8 | 70.8 | 74.7 | ||
| Kirklees | 3455 | 72.5 | 71.2 | 73.8 | ||
| Leeds | 6170 | 75.1 | 74.2 | 76.0 | ||
| Wakefield | 2760 | 73.6 | 72.2 | 75.0 |
Source: Department of Health and Social Care, National Child Measurement Programme
The percentage of Year R children in Hull who are in the overweight category but not living with obesity is relatively high compared to other areas in the region for 2024/25.
Compared with benchmark
Reception prevalence of overweight (Persons 4-5 yrs) 2024/25
| Area |
Recent
Trend |
Count
|
Value
|
95%
Lower CI |
95%
Upper CI |
|
|---|---|---|---|---|---|---|
| England | 71013 | 13.0 | 12.9 | 13.1 | ||
| Yorkshire and the Humber region (statistical) | 7645 | 13.9 | 13.7 | 14.2 | ||
| Kingston upon Hull | 435 | 15.0 | 13.8 | 16.4 | ||
| East Riding of Yorkshire | 480 | 16.9 | 15.6 | 18.3 | ||
| North East Lincolnshire | 280 | 17.8 | 15.9 | 19.7 | ||
| North Lincolnshire | 245 | 15.6 | 13.9 | 17.5 | ||
| York | 200 | 13.2 | 11.6 | 15.0 | ||
| North Yorkshire UA | 715 | 14.6 | 13.6 | 15.5 | ||
| Barnsley | 370 | 14.0 | 12.8 | 15.5 | ||
| Doncaster | 535 | 16.2 | 14.9 | 17.5 | ||
| Rotherham | 415 | 14.8 | 13.6 | 16.2 | ||
| Sheffield | 755 | 13.0 | 12.2 | 13.9 | ||
| Bradford | 725 | 11.7 | 11.0 | 12.6 | ||
| Calderdale | 285 | 13.7 | 12.4 | 15.4 | ||
| Kirklees | 635 | 13.3 | 12.4 | 14.4 | ||
| Leeds | 1065 | 13.0 | 12.3 | 13.7 | ||
| Wakefield | 500 | 13.3 | 12.3 | 14.4 |
Source: Department of Health and Social Care, National Child Measurement Programme
The percentage of Year R children who are living with obesity in Hull is the second highest in the region for 2024/25 marginally below North East Lincolnshire.
Compared with benchmark
Reception prevalence of obesity (including severe obesity) (Persons 4-5 yrs) 2024/25
| Area |
Recent
Trend |
Count
|
Value
|
95%
Lower CI |
95%
Upper CI |
|
|---|---|---|---|---|---|---|
| England | 57242 | 10.5 | 10.4 | 10.6 | ||
| Yorkshire and the Humber region (statistical) | 6565 | 12.0 | 11.7 | 12.3 | ||
| Kingston upon Hull | 410 | 14.2 | 12.9 | 15.4 | ||
| East Riding of Yorkshire | 315 | 11.1 | 10.0 | 12.3 | ||
| North East Lincolnshire | 230 | 14.6 | 13.0 | 16.5 | ||
| North Lincolnshire | 180 | 11.4 | 10.0 | 13.2 | ||
| York | 150 | 9.9 | 8.4 | 11.4 | ||
| North Yorkshire UA | 510 | 10.4 | 9.6 | 11.3 | ||
| Barnsley | 330 | 12.5 | 11.3 | 13.8 | ||
| Doncaster | 430 | 13.0 | 12.0 | 14.3 | ||
| Rotherham | 380 | 13.6 | 12.3 | 14.9 | ||
| Sheffield | 675 | 11.6 | 10.8 | 12.5 | ||
| Bradford | 755 | 12.2 | 11.5 | 13.1 | ||
| Calderdale | 255 | 12.3 | 11.0 | 13.8 | ||
| Kirklees | 595 | 12.5 | 11.6 | 13.5 | ||
| Leeds | 905 | 11.0 | 10.4 | 11.7 | ||
| Wakefield | 445 | 11.9 | 10.9 | 12.9 |
Source: Department of Health and Social Care, National Child Measurement Programme
The percentage of Year R children who are living with severe obesity in Hull is among the highest in the region for 2024/25 with North East Lincolnshire, Rotherham and Bradford all having higher prevalence figures.
Compared with benchmark
Reception prevalence of severe obesity (Persons 4-5 yrs) 2024/25
| Area |
Recent
Trend |
Count
|
Value
|
95%
Lower CI |
95%
Upper CI |
|
|---|---|---|---|---|---|---|
| England | 15995 | 2.9 | 2.9 | 3.0 | ||
| Yorkshire and the Humber region (statistical) | 1950 | 3.6 | 3.4 | 3.7 | ||
| Kingston upon Hull | 115 | 4.0 | 3.4 | 4.8 | ||
| East Riding of Yorkshire | 90 | 3.2 | 2.7 | 4.0 | ||
| North East Lincolnshire | 70 | 4.4 | 3.6 | 5.7 | ||
| North Lincolnshire | 50 | 3.2 | 2.4 | 4.1 | ||
| York | 50 | 3.3 | 2.4 | 4.2 | ||
| North Yorkshire UA | 130 | 2.6 | 2.2 | 3.1 | ||
| Barnsley | 95 | 3.6 | 2.9 | 4.3 | ||
| Doncaster | 115 | 3.5 | 2.9 | 4.1 | ||
| Rotherham | 120 | 4.3 | 3.7 | 5.2 | ||
| Sheffield | 200 | 3.4 | 3.0 | 3.9 | ||
| Bradford | 265 | 4.3 | 3.8 | 4.8 | ||
| Calderdale | 70 | 3.4 | 2.6 | 4.1 | ||
| Kirklees | 185 | 3.9 | 3.3 | 4.4 | ||
| Leeds | 265 | 3.2 | 2.9 | 3.6 | ||
| Wakefield | 135 | 3.6 | 3.0 | 4.2 |
Source: Department of Health and Social Care, National Child Measurement Programme
Overall, the percentage of Year R children who are living excess weight (overweight, obesity or severe obesity) in Hull is the joint second highest in the region for 2024/25 with North East Lincolnshire having a higher prevalence and Doncaster having the same prevalence.
Compared with benchmark
Reception prevalence of overweight (including obesity) (Persons 4-5 yrs) 2024/25
| Area |
Recent
Trend |
Count
|
Value
|
95%
Lower CI |
95%
Upper CI |
|
|---|---|---|---|---|---|---|
| England | 128255 | 23.5 | 23.4 | 23.6 | ||
| Yorkshire and the Humber region (statistical) | 14210 | 25.9 | 25.6 | 26.3 | ||
| Kingston upon Hull | 845 | 29.2 | 27.6 | 30.9 | ||
| East Riding of Yorkshire | 795 | 28.0 | 26.4 | 29.7 | ||
| North East Lincolnshire | 510 | 32.4 | 30.1 | 34.8 | ||
| North Lincolnshire | 425 | 27.0 | 24.9 | 29.3 | ||
| York | 350 | 23.2 | 21.0 | 25.2 | ||
| North Yorkshire UA | 1225 | 24.9 | 23.7 | 26.1 | ||
| Barnsley | 700 | 26.6 | 25.0 | 28.3 | ||
| Doncaster | 965 | 29.2 | 27.7 | 30.8 | ||
| Rotherham | 790 | 28.3 | 26.7 | 30.1 | ||
| Sheffield | 1430 | 24.6 | 23.5 | 25.7 | ||
| Bradford | 1485 | 24.0 | 22.9 | 25.1 | ||
| Calderdale | 545 | 26.3 | 24.3 | 28.1 | ||
| Kirklees | 1235 | 25.9 | 24.7 | 27.1 | ||
| Leeds | 1975 | 24.0 | 23.1 | 25.0 | ||
| Wakefield | 945 | 25.2 | 23.8 | 26.6 |
Source: Department of Health and Social Care, National Child Measurement Programme
Year 6 (Aged 10-11 Years)
The percentage of Year 6 children who are underweight in Hull is among the lowest in the region for 2024/25.
Compared with benchmark
Year 6 prevalence of underweight (Persons 10-11 yrs) 2024/25
| Area |
Recent
Trend |
Count
|
Value
|
95%
Lower CI |
95%
Upper CI |
|
|---|---|---|---|---|---|---|
| England | 9637 | 1.6 | 1.6 | 1.6 | ||
| Yorkshire and the Humber region (statistical) | 850 | 1.4 | 1.3 | 1.5 | ||
| Kingston upon Hull | 35 | 1.1 | 0.8 | 1.5 | ||
| East Riding of Yorkshire | 35 | 1.1 | 0.8 | 1.6 | ||
| North East Lincolnshire | 25 | 1.3 | 1.0 | 2.1 | ||
| North Lincolnshire | 30 | 1.6 | 1.1 | 2.2 | ||
| York | 25 | 1.4 | 0.9 | 2.0 | ||
| North Yorkshire UA | 40 | 0.7 | 0.6 | 1.0 | ||
| Barnsley | 35 | 1.3 | 0.9 | 1.7 | ||
| Doncaster | 50 | 1.4 | 1.1 | 1.9 | ||
| Rotherham | 40 | 1.3 | 0.9 | 1.7 | ||
| Sheffield | 95 | 1.5 | 1.3 | 1.9 | ||
| Bradford | 160 | 2.2 | 1.9 | 2.5 | ||
| Calderdale | 30 | 1.3 | 0.8 | 1.7 | ||
| Kirklees | 75 | 1.4 | 1.1 | 1.8 | ||
| Leeds | 125 | 1.3 | 1.1 | 1.6 | ||
| Wakefield | 45 | 1.2 | 0.9 | 1.6 |
Source: Department of Health and Social Care, National Child Measurement Programme
The percentage of Year 6 children who are a healthy weight in Hull is the lowest in the region for 2024/25.
Compared with benchmark
Year 6 prevalence of healthy weight (Persons 10-11 yrs) 2024/25
| Area |
Recent
Trend |
Count
|
Value
|
95%
Lower CI |
95%
Upper CI |
|
|---|---|---|---|---|---|---|
| England | 373570 | 62.2 | 62.1 | 62.4 | ||
| Yorkshire and the Humber region (statistical) | 37035 | 60.7 | 60.3 | 61.1 | ||
| Kingston upon Hull | 1785 | 56.5 | 54.7 | 58.2 | ||
| East Riding of Yorkshire | 2000 | 62.5 | 60.8 | 64.2 | ||
| North East Lincolnshire | 1105 | 59.6 | 57.3 | 61.7 | ||
| North Lincolnshire | 1085 | 59.1 | 56.8 | 61.3 | ||
| York | 1140 | 63.9 | 61.7 | 66.2 | ||
| North Yorkshire UA | 3570 | 65.1 | 63.8 | 66.3 | ||
| Barnsley | 1620 | 58.4 | 56.5 | 60.2 | ||
| Doncaster | 2045 | 58.3 | 56.6 | 59.9 | ||
| Rotherham | 1800 | 58.3 | 56.5 | 60.0 | ||
| Sheffield | 3725 | 60.7 | 59.5 | 62.0 | ||
| Bradford | 4305 | 58.1 | 57.0 | 59.3 | ||
| Calderdale | 1490 | 62.5 | 60.5 | 64.4 | ||
| Kirklees | 3155 | 61.0 | 59.6 | 62.3 | ||
| Leeds | 5830 | 62.4 | 61.4 | 63.3 | ||
| Wakefield | 2385 | 61.2 | 59.7 | 62.8 |
Source: Department of Health and Social Care, National Child Measurement Programme
The percentage of Year 6 children in Hull who are in the overweight category but not living with obesity is relatively high compared to other local authorities in the region for 2024/25.
Compared with benchmark
Year 6 prevalence of overweight (Persons 10-11 yrs) 2024/25
| Area |
Recent
Trend |
Count
|
Value
|
95%
Lower CI |
95%
Upper CI |
|
|---|---|---|---|---|---|---|
| England | 83544 | 13.9 | 13.8 | 14.0 | ||
| Yorkshire and the Humber region (statistical) | 8460 | 13.9 | 13.6 | 14.1 | ||
| Kingston upon Hull | 460 | 14.6 | 13.4 | 15.9 | ||
| East Riding of Yorkshire | 440 | 13.8 | 12.6 | 15.0 | ||
| North East Lincolnshire | 235 | 12.7 | 11.3 | 14.4 | ||
| North Lincolnshire | 245 | 13.4 | 11.8 | 14.9 | ||
| York | 270 | 15.1 | 13.6 | 17.0 | ||
| North Yorkshire UA | 815 | 14.9 | 13.9 | 15.8 | ||
| Barnsley | 400 | 14.4 | 13.2 | 15.8 | ||
| Doncaster | 485 | 13.8 | 12.7 | 14.9 | ||
| Rotherham | 430 | 13.9 | 12.7 | 15.1 | ||
| Sheffield | 830 | 13.5 | 12.7 | 14.4 | ||
| Bradford | 1020 | 13.8 | 13.0 | 14.6 | ||
| Calderdale | 315 | 13.2 | 11.9 | 14.6 | ||
| Kirklees | 720 | 13.9 | 13.0 | 14.9 | ||
| Leeds | 1265 | 13.5 | 12.8 | 14.2 | ||
| Wakefield | 530 | 13.6 | 12.6 | 14.8 |
Source: Department of Health and Social Care, National Child Measurement Programme
The percentage of Year 6 children who are living with obesity in Hull is the highest in the region for 2024/25.
Compared with benchmark
Year 6 prevalence of obesity (including severe obesity) (Persons 10-11 yrs) 2024/25
| Area |
Recent
Trend |
Count
|
Value
|
95%
Lower CI |
95%
Upper CI |
|
|---|---|---|---|---|---|---|
| England | 133553 | 22.2 | 22.1 | 22.4 | ||
| Yorkshire and the Humber region (statistical) | 14690 | 24.1 | 23.7 | 24.4 | ||
| Kingston upon Hull | 880 | 27.8 | 26.4 | 29.5 | ||
| East Riding of Yorkshire | 725 | 22.7 | 21.2 | 24.1 | ||
| North East Lincolnshire | 485 | 26.1 | 24.3 | 28.3 | ||
| North Lincolnshire | 480 | 26.2 | 24.2 | 28.2 | ||
| York | 345 | 19.3 | 17.7 | 21.3 | ||
| North Yorkshire UA | 1060 | 19.3 | 18.3 | 20.4 | ||
| Barnsley | 720 | 25.9 | 24.3 | 27.6 | ||
| Doncaster | 935 | 26.6 | 25.1 | 28.1 | ||
| Rotherham | 825 | 26.7 | 25.1 | 28.2 | ||
| Sheffield | 1480 | 24.1 | 23.0 | 25.2 | ||
| Bradford | 1915 | 25.9 | 24.9 | 26.9 | ||
| Calderdale | 550 | 23.1 | 21.5 | 24.9 | ||
| Kirklees | 1225 | 23.7 | 22.5 | 24.9 | ||
| Leeds | 2130 | 22.8 | 22.0 | 23.7 | ||
| Wakefield | 930 | 23.9 | 22.6 | 25.3 |
Source: Department of Health and Social Care, National Child Measurement Programme
The percentage of Year 6 children who are living with severe obesity in Hull is the highest in the region for 2024/25.
Compared with benchmark
Year 6 prevalence of severe obesity (Persons 10-11 yrs) 2024/25
| Area |
Recent
Trend |
Count
|
Value
|
95%
Lower CI |
95%
Upper CI |
|
|---|---|---|---|---|---|---|
| England | 33484 | 5.6 | 5.5 | 5.6 | ||
| Yorkshire and the Humber region (statistical) | 3930 | 6.4 | 6.2 | 6.6 | ||
| Kingston upon Hull | 280 | 8.9 | 7.9 | 9.8 | ||
| East Riding of Yorkshire | 170 | 5.3 | 4.6 | 6.1 | ||
| North East Lincolnshire | 135 | 7.3 | 6.3 | 8.7 | ||
| North Lincolnshire | 140 | 7.6 | 6.5 | 8.9 | ||
| York | 65 | 3.6 | 2.8 | 4.5 | ||
| North Yorkshire UA | 230 | 4.2 | 3.7 | 4.8 | ||
| Barnsley | 195 | 7.0 | 6.2 | 8.1 | ||
| Doncaster | 280 | 8.0 | 7.1 | 8.9 | ||
| Rotherham | 240 | 7.8 | 6.8 | 8.7 | ||
| Sheffield | 430 | 7.0 | 6.4 | 7.6 | ||
| Bradford | 505 | 6.8 | 6.3 | 7.4 | ||
| Calderdale | 130 | 5.5 | 4.7 | 6.5 | ||
| Kirklees | 335 | 6.5 | 5.9 | 7.2 | ||
| Leeds | 555 | 5.9 | 5.5 | 6.4 | ||
| Wakefield | 240 | 6.2 | 5.5 | 7.0 |
Source: Department of Health and Social Care, National Child Measurement Programme
Overall, the percentage of Year 6 children who are living excess weight (overweight, obesity or severe obesity) in Hull is the highest in the region for 2024/25.
Compared with benchmark
Year 6 prevalence of overweight (including obesity) (Persons 10-11 yrs) 2024/25
| Area |
Recent
Trend |
Count
|
Value
|
95%
Lower CI |
95%
Upper CI |
|
|---|---|---|---|---|---|---|
| England | 217097 | 36.2 | 36.0 | 36.3 | ||
| Yorkshire and the Humber region (statistical) | 23150 | 37.9 | 37.5 | 38.3 | ||
| Kingston upon Hull | 1345 | 42.6 | 40.8 | 44.2 | ||
| East Riding of Yorkshire | 1165 | 36.4 | 34.7 | 38.0 | ||
| North East Lincolnshire | 725 | 39.1 | 36.8 | 41.2 | ||
| North Lincolnshire | 725 | 39.5 | 37.2 | 41.6 | ||
| York | 620 | 34.7 | 32.5 | 36.9 | ||
| North Yorkshire UA | 1875 | 34.2 | 33.0 | 35.5 | ||
| Barnsley | 1120 | 40.4 | 38.6 | 42.2 | ||
| Doncaster | 1415 | 40.3 | 38.7 | 42.0 | ||
| Rotherham | 1250 | 40.5 | 38.8 | 42.2 | ||
| Sheffield | 2310 | 37.7 | 36.4 | 38.9 | ||
| Bradford | 2940 | 39.7 | 38.6 | 40.8 | ||
| Calderdale | 865 | 36.3 | 34.4 | 38.3 | ||
| Kirklees | 1945 | 37.6 | 36.3 | 38.9 | ||
| Leeds | 3395 | 36.3 | 35.3 | 37.3 | ||
| Wakefield | 1460 | 37.5 | 36.0 | 39.1 |
Source: Department of Health and Social Care, National Child Measurement Programme
Trends Over Time
As mentioned earlier, all children were not measured 2020/21 due to the COVID-19 pandemic and only a 10% sample was collected so the trends nationally could be reported. Between 2019/20 and 2020/21, the prevalence of excess weight among Year R children across England increased from 23.0% to 27.7% with a fall back to 22.3% in 2021/22 and to 21.3% in 2022/23. A very similar pattern was observed among Year 6 children where 35.2% were classified as living with excess weight in 2019/20 which increased to 40.9% in 2020/21 before falling back to 37.8% in 2021/22 and to 36.6% in 2022/23. Across England, it was also noted that the increases in the prevalence were much greater among areas of high deprivation. Thus it is likely that the prevalence of excess weight increased in Hull considerably between 2019/20 and 2020/21. It is also reasonable to assume that these affects would be present among younger children too, which would potentially impact on the prevalence for future years. This would mean that any change in the prevalence in Hull needed to be greater than England to achieve pre-pandemic levels.
The number of children in different weight classifications have been rounded to the nearest five within Fingertips.
Year R (Aged 4-5 Years)
The total number of children in reception year who are underweight is small so it would be expected that there was some year-on-year variability in the percentage over time, although the percentage remained relatively steady at 0.5% and 0.6% between 2014/15 to 2019/20. The percentage has been slightly higher for 2021/22 (0.9%) and 2022/23 (0.7%) but has decreased back to 0.5% for the 2023/24 and 2024/25 school years.
The percentage of Year R children in Hull who are classified as being underweight has been consistently lower than in the region and England.
There were only around 15 Hull children in Year R who were classified as being underweight for the 2024/25 school year.
Compared with benchmark
Reception prevalence of underweight (Persons 4-5 yrs)
|
Period
|
Kingston upon Hull |
Yorkshire and the Humber region (statistical)
|
England
|
||||
|---|---|---|---|---|---|---|---|
|
Count
|
Value
|
95%
Lower CI |
95%
Upper CI |
||||
| 2006/07 | • | 10 | 0.4% | 0.3% | 0.9% | - | 1.3% |
| 2007/08 | • | 15 | 0.6% | 0.4% | 1.0% | 1.3% | 1.3% |
| 2008/09 | • | 15 | 0.6% | 0.3% | 0.9% | 1.1% | 1.0% |
| 2009/10 | • | 10 | 0.4% | 0.2% | 0.7% | 1.1% | 0.9% |
| 2010/11 | • | 25 | 0.8% | 0.6% | 1.3% | 1.0% | 1.0% |
| 2011/12 | • | 25 | 0.8% | 0.5% | 1.1% | 0.9% | 0.9% |
| 2012/13 | • | 15 | 0.5% | 0.3% | 0.8% | 0.8% | 0.9% |
| 2013/14 | • | 25 | 0.8% | 0.6% | 1.2% | 0.9% | 0.9% |
| 2014/15 | • | 20 | 0.6% | 0.3% | 0.9% | 0.9% | 1.0% |
| 2015/16 | • | 20 | 0.6% | 0.4% | 0.9% | 0.9% | 1.0% |
| 2016/17 | • | 20 | 0.5% | 0.3% | 0.8% | 1.1% | 1.0% |
| 2017/18 | • | 20 | 0.6% | 0.3% | 0.8% | 0.9% | 1.0% |
| 2018/19 | • | 15 | 0.5% | 0.3% | 0.8% | 0.9% | 1.0% |
| 2019/20 | • | 15 | 0.5% | 0.3% | 0.8% | 0.8% | 0.9% |
| 2021/22 | • | 25 | 0.9% | 0.6% | 1.3% | 1.1% | 1.2% |
| 2022/23 | • | 20 | 0.7% | 0.4% | 0.9% | 1.1% | 1.2% |
| 2023/24 | • | 15 | 0.5% | 0.4% | 0.9% | 1.0% | 1.2% |
| 2024/25 | • | 15 | 0.5% | 0.3% | 0.9% | 0.9% | 1.1% |
Source: Department of Health and Social Care, National Child Measurement Programme
The percentage of Year R children in Hull who are classified as being a healthy weight has been consistently lower than in the region and England. The percentage in Hull was 4% lower than England in 2006/07 and remained around that level for a number of years, although the gap between Hull and England increased for 2015/16 when the percentage in Hull was 7% and the difference remained at this level or increased to 2021/22. For 2023/24, the difference between Hull and England had reduced to 3.9 percentage points or 5%, but for the latest year 2024/25, the inequalities gap has increased to 5.1 percentage points or 7.3%.
There were 2,035 children in Year R who were classified as being a healthy weight for the 2024/25 school year.
Compared with benchmark
Reception prevalence of healthy weight (Persons 4-5 yrs)
|
Period
|
Kingston upon Hull |
Yorkshire and the Humber region (statistical)
|
England
|
||||
|---|---|---|---|---|---|---|---|
|
Count
|
Value
|
95%
Lower CI |
95%
Upper CI |
||||
| 2006/07 | • | 1675 | 72.8% | 70.9% | 74.5% | - | 75.8% |
| 2007/08 | • | 1720 | 72.9% | 71.0% | 74.6% | 76.1% | 76.2% |
| 2008/09 | • | 1995 | 73.6% | 72.0% | 75.3% | 76.2% | 76.2% |
| 2009/10 | • | 2085 | 74.1% | 72.5% | 75.7% | 76.9% | 76.0% |
| 2010/11 | • | 2275 | 75.5% | 73.9% | 77.0% | 76.9% | 76.4% |
| 2011/12 | • | 2260 | 73.1% | 71.6% | 74.8% | 77.0% | 76.5% |
| 2012/13 | • | 2495 | 76.7% | 75.2% | 78.1% | 77.3% | 76.9% |
| 2013/14 | • | 2420 | 75.5% | 74.1% | 77.0% | 76.9% | 76.5% |
| 2014/15 | • | 2470 | 74.7% | 73.2% | 76.2% | 77.5% | 77.2% |
| 2015/16 | • | 2485 | 71.5% | 70.0% | 73.0% | 76.7% | 76.9% |
| 2016/17 | • | 2635 | 71.6% | 70.1% | 73.0% | 76.7% | 76.4% |
| 2017/18 | • | 2420 | 70.9% | 69.3% | 72.3% | 76.1% | 76.6% |
| 2018/19 | • | 2320 | 70.2% | 68.7% | 71.8% | 75.4% | 76.5% |
| 2019/20 | • | 2285 | 71.0% | 69.5% | 72.6% | 75.2% | 76.1% |
| 2021/22 | • | 2075 | 70.9% | 69.3% | 72.6% | 75.1% | 76.5% |
| 2022/23 | • | 2275 | 74.0% | 72.4% | 75.5% | 76.4% | 77.5% |
| 2023/24 | • | 2150 | 72.9% | 71.3% | 74.5% | 75.3% | 76.8% |
| 2024/25 | • | 2035 | 70.3% | 68.6% | 71.9% | 73.2% | 75.4% |
Source: Department of Health and Social Care, National Child Measurement Programme
The percentage of Year R children in Hull who are living with excess weight (excluding those living with obesity) has been consistently higher than in the region and England.
There was a relatively high percentage for both Hull and England in 2019/20, but the percentage overweight has decreased in 2021/22. However, the percentage has increased the last three years. However, whilst this measure is included on Fingertips, it does not portray the true levels of excess weight when it does not include obesity.
There were 435 Year R children who were living with excess weight in 2024/25 (not including those living with obesity).
Compared with benchmark
Reception prevalence of overweight (Persons 4-5 yrs)
|
Period
|
Kingston upon Hull |
Yorkshire and the Humber region (statistical)
|
England
|
||||
|---|---|---|---|---|---|---|---|
|
Count
|
Value
|
95%
Lower CI |
95%
Upper CI |
||||
| 2006/07 | • | 345 | 15.0% | 13.6% | 16.5% | - | 13.1% |
| 2007/08 | • | 340 | 14.4% | 13.1% | 15.9% | 12.8% | 13.0% |
| 2008/09 | • | 420 | 15.5% | 14.1% | 16.9% | 13.1% | 13.2% |
| 2009/10 | • | 395 | 14.0% | 12.8% | 15.3% | 12.8% | 13.3% |
| 2010/11 | • | 415 | 13.8% | 12.6% | 15.1% | 13.0% | 13.2% |
| 2011/12 | • | 445 | 14.4% | 13.2% | 15.7% | 13.1% | 13.1% |
| 2012/13 | • | 425 | 13.1% | 12.0% | 14.3% | 12.9% | 13.0% |
| 2013/14 | • | 450 | 14.0% | 12.9% | 15.3% | 13.0% | 13.1% |
| 2014/15 | • | 490 | 14.8% | 13.6% | 16.0% | 12.7% | 12.8% |
| 2015/16 | • | 535 | 15.4% | 14.2% | 16.6% | 13.0% | 12.8% |
| 2016/17 | • | 550 | 14.9% | 13.8% | 16.1% | 12.5% | 13.0% |
| 2017/18 | • | 520 | 15.2% | 14.0% | 16.4% | 13.0% | 12.8% |
| 2018/19 | • | 510 | 15.4% | 14.3% | 16.8% | 13.5% | 12.9% |
| 2019/20 | • | 495 | 15.4% | 14.2% | 16.7% | 13.6% | 13.1% |
| 2021/22 | • | 400 | 13.7% | 12.5% | 15.0% | 12.8% | 12.1% |
| 2022/23 | • | 425 | 13.8% | 12.6% | 15.0% | 12.6% | 12.2% |
| 2023/24 | • | 425 | 14.4% | 13.2% | 15.7% | 13.0% | 12.4% |
| 2024/25 | • | 435 | 15.0% | 13.8% | 16.4% | 13.9% | 13.0% |
Source: Department of Health and Social Care, National Child Measurement Programme
The percentage of Year R children living with obesity was reasonably consistent between 9% and 11% between 2006/07 and 2014/15, but gradually increased to 13.0% prior to the pandemic (children were measured in Hull for the 2019/20 school year prior to March 2020 when lockdowns commenced and schools were closed). There was a sharp increase in the prevalence to a new high of 14.5% for 2021/22, and whilst this decreased to 11.5% for the 2022/23 school year, it has increased over the last two years so is almost as high as it was in 2021/22.
The percentage has also increased across England in the last year.
For 2023/24, the prevalence of obesity in Hull among Year R children is 2.4 percentage points or 25% higher than England. However, for the latest school year of 2024/25, this has increased to 3.7 percentage points or 35% higher.
There were 410 Year R children who were living with obesity in 2024/25.
Compared with benchmark
Reception prevalence of obesity (including severe obesity) (Persons 4-5 yrs)
|
Period
|
Kingston upon Hull |
Yorkshire and the Humber region (statistical)
|
England
|
||||
|---|---|---|---|---|---|---|---|
|
Count
|
Value
|
95%
Lower CI |
95%
Upper CI |
||||
| 2006/07 | • | 270 | 11.7% | 10.5% | 13.2% | - | 9.9% |
| 2007/08 | • | 285 | 12.1% | 10.8% | 13.4% | 9.8% | 9.6% |
| 2008/09 | • | 280 | 10.3% | 9.2% | 11.5% | 9.6% | 9.6% |
| 2009/10 | • | 320 | 11.4% | 10.3% | 12.7% | 9.1% | 9.8% |
| 2010/11 | • | 295 | 9.8% | 8.8% | 10.9% | 9.1% | 9.4% |
| 2011/12 | • | 360 | 11.7% | 10.6% | 12.8% | 9.0% | 9.5% |
| 2012/13 | • | 315 | 9.7% | 8.8% | 10.8% | 8.9% | 9.3% |
| 2013/14 | • | 305 | 9.5% | 8.6% | 10.6% | 9.2% | 9.5% |
| 2014/15 | • | 330 | 10.0% | 9.0% | 11.1% | 8.8% | 9.1% |
| 2015/16 | • | 435 | 12.5% | 11.4% | 13.6% | 9.4% | 9.3% |
| 2016/17 | • | 480 | 13.0% | 12.0% | 14.1% | 9.7% | 9.6% |
| 2017/18 | • | 460 | 13.5% | 12.3% | 14.6% | 9.9% | 9.5% |
| 2018/19 | • | 450 | 13.6% | 12.6% | 14.9% | 10.2% | 9.7% |
| 2019/20 | • | 420 | 13.0% | 11.9% | 14.3% | 10.5% | 9.9% |
| 2021/22 | • | 425 | 14.5% | 13.2% | 15.8% | 11.0% | 10.1% |
| 2022/23 | • | 355 | 11.5% | 10.5% | 12.8% | 9.9% | 9.2% |
| 2023/24 | • | 355 | 12.0% | 11.0% | 13.3% | 10.7% | 9.6% |
| 2024/25 | • | 410 | 14.2% | 12.9% | 15.4% | 12.0% | 10.5% |
Source: Department of Health and Social Care, National Child Measurement Programme
The change in the prevalence of severe obesity in Year R in Hull follows a similar pattern to that for obesity.
The prevalence of severe obesity in Year R was around 3% between 2006/07 and 2015/16, but has increased since then to a peak of 4.8% in 2021/22. The prevalence decreased markedly to 3.1% for 2022/23, but has increased to 4.0% for the latest school year 2024/25.
There had also been a steady increase in the prevalence nationally although the rate of increase was much lower. For 2023/24, there is a difference of 0.8 percentage points or 31% between Hull and England. However, the inequalities gap has increased over the last year to 1.1 percentage points or 38%.
There were 115 Year R children who were living with severe obesity in 2024/25.
Compared with benchmark
Reception prevalence of severe obesity (Persons 4-5 yrs)
|
Period
|
Kingston upon Hull |
Yorkshire and the Humber region (statistical)
|
England
|
||||
|---|---|---|---|---|---|---|---|
|
Count
|
Value
|
95%
Lower CI |
95%
Upper CI |
||||
| 2006/07 | • | 70 | 3.0% | 2.5% | 3.9% | - | 2.4% |
| 2007/08 | • | 65 | 2.8% | 2.2% | 3.6% | 2.3% | 2.3% |
| 2008/09 | • | 70 | 2.6% | 2.1% | 3.3% | 2.1% | 2.2% |
| 2009/10 | • | 75 | 2.7% | 2.2% | 3.4% | 2.2% | 2.3% |
| 2010/11 | • | 75 | 2.5% | 1.9% | 3.0% | 2.1% | 2.3% |
| 2011/12 | • | 100 | 3.2% | 2.6% | 3.9% | 2.1% | 2.3% |
| 2012/13 | • | 90 | 2.8% | 2.2% | 3.3% | 2.1% | 2.1% |
| 2013/14 | • | 75 | 2.3% | 1.8% | 2.9% | 2.3% | 2.3% |
| 2014/15 | • | 85 | 2.6% | 2.1% | 3.1% | 2.0% | 2.1% |
| 2015/16 | • | 100 | 2.9% | 2.3% | 3.4% | 2.3% | 2.3% |
| 2016/17 | • | 120 | 3.3% | 2.8% | 3.9% | 2.4% | 2.3% |
| 2017/18 | • | 115 | 3.4% | 2.8% | 4.1% | 2.5% | 2.4% |
| 2018/19 | • | 135 | 4.1% | 3.5% | 4.9% | 2.7% | 2.4% |
| 2019/20 | • | 110 | 3.4% | 2.9% | 4.2% | 2.7% | 2.5% |
| 2021/22 | • | 140 | 4.8% | 4.0% | 5.6% | 3.2% | 2.9% |
| 2022/23 | • | 95 | 3.1% | 2.6% | 3.8% | 2.7% | 2.5% |
| 2023/24 | • | 100 | 3.4% | 2.9% | 4.2% | 3.0% | 2.6% |
| 2024/25 | • | 115 | 4.0% | 3.4% | 4.8% | 3.6% | 2.9% |
Source: Department of Health and Social Care, National Child Measurement Programme
The prevalence of excess weight in Hull has been consistently higher than England since 2006/07 when the NCMP began, but the difference between Hull and England increased for the 2015/16 school year. The inequalities gap had been around 4 percentage points, but increased to 5.8 percentage points for 2015/16. The inequalities gap has remained high since 2015/16 although it did decrease post pandemic.
The prevalence in Hull has increased over time and reached a peak of 29.2% in 2018/19. The prevalence in Hull decreased slightly between 2018/19 and 2021/22 with a larger decrease between 2021/22 and 2022/23, although the rate has increased for 2023/24 with a sharper increase in the last year for Hull to reach 29.2% which is the same as the peak in 2018/19.
The pattern nationally has been reasonably similar to the trends for Hull although much smaller year-on-year changes.
There were 845 Year R children who were living with excess weight in 2024/25.
Compared with benchmark
Reception prevalence of overweight (including obesity) (Persons 4-5 yrs)
|
Period
|
Kingston upon Hull |
Yorkshire and the Humber region (statistical)
|
England
|
||||
|---|---|---|---|---|---|---|---|
|
Count
|
Value
|
95%
Lower CI |
95%
Upper CI |
||||
| 2006/07 | • | 615 | 26.7% | 25.0% | 28.6% | - | 22.9% |
| 2007/08 | • | 625 | 26.5% | 24.8% | 28.3% | 22.6% | 22.6% |
| 2008/09 | • | 700 | 25.8% | 24.1% | 27.4% | 22.7% | 22.8% |
| 2009/10 | • | 715 | 25.4% | 23.9% | 27.1% | 22.0% | 23.1% |
| 2010/11 | • | 715 | 23.7% | 22.2% | 25.2% | 22.1% | 22.6% |
| 2011/12 | • | 805 | 26.1% | 24.5% | 27.6% | 22.1% | 22.6% |
| 2012/13 | • | 745 | 22.9% | 21.4% | 24.3% | 21.9% | 22.2% |
| 2013/14 | • | 755 | 23.6% | 22.2% | 25.1% | 22.2% | 22.5% |
| 2014/15 | • | 820 | 24.8% | 23.3% | 26.3% | 21.5% | 21.9% |
| 2015/16 | • | 970 | 27.9% | 26.4% | 29.4% | 22.4% | 22.1% |
| 2016/17 | • | 1030 | 28.0% | 26.5% | 29.4% | 22.2% | 22.6% |
| 2017/18 | • | 980 | 28.7% | 27.1% | 30.2% | 22.9% | 22.4% |
| 2018/19 | • | 965 | 29.2% | 27.7% | 30.8% | 23.7% | 22.6% |
| 2019/20 | • | 915 | 28.4% | 26.9% | 30.0% | 24.1% | 23.0% |
| 2021/22 | • | 825 | 28.2% | 26.6% | 29.8% | 23.7% | 22.3% |
| 2022/23 | • | 780 | 25.4% | 23.9% | 27.0% | 22.5% | 21.3% |
| 2023/24 | • | 780 | 26.4% | 25.0% | 28.1% | 23.8% | 22.1% |
| 2024/25 | • | 845 | 29.2% | 27.6% | 30.9% | 25.9% | 23.5% |
Source: Department of Health and Social Care, National Child Measurement Programme
Year 6 (Aged 10-11 Years)
The prevalence of Year 6 children who are classified as underweight has been relatively variable over time ranging from 0.5% to 1.2% although the highest prevalence estimates have tended to occur in the last eight years with the prevalence 1% or higher.
In the 2024/25 school year, there were 35 Year 6 children in Hull who were classified as underweight.
Compared with benchmark
Year 6 prevalence of underweight (Persons 10-11 yrs)
|
Period
|
Kingston upon Hull |
Yorkshire and the Humber region (statistical)
|
England
|
||||
|---|---|---|---|---|---|---|---|
|
Count
|
Value
|
95%
Lower CI |
95%
Upper CI |
||||
| 2006/07 | • | 20 | 1.0% | 0.6% | 1.4% | - | 1.5% |
| 2007/08 | • | 25 | 1.0% | 0.7% | 1.5% | 1.4% | 1.4% |
| 2008/09 | • | 20 | 0.8% | 0.5% | 1.2% | 1.4% | 1.3% |
| 2009/10 | • | 25 | 1.0% | 0.7% | 1.5% | 1.4% | 1.3% |
| 2010/11 | • | 15 | 0.6% | 0.4% | 1.0% | 1.4% | 1.3% |
| 2011/12 | • | 15 | 0.6% | 0.4% | 1.1% | 1.3% | 1.3% |
| 2012/13 | • | 15 | 0.6% | 0.4% | 1.1% | 1.5% | 1.3% |
| 2013/14 | • | 30 | 1.2% | 0.8% | 1.6% | 1.4% | 1.4% |
| 2014/15 | • | 15 | 0.5% | 0.4% | 0.9% | 1.4% | 1.4% |
| 2015/16 | • | 15 | 0.5% | 0.3% | 0.8% | 1.3% | 1.3% |
| 2016/17 | • | 30 | 1.0% | 0.7% | 1.4% | 1.5% | 1.3% |
| 2017/18 | • | 35 | 1.1% | 0.8% | 1.6% | 1.5% | 1.4% |
| 2018/19 | • | 35 | 1.1% | 0.9% | 1.6% | 1.3% | 1.4% |
| 2019/20 | • | 30 | 1.0% | 0.6% | 1.3% | 1.4% | 1.4% |
| 2021/22 | • | 30 | 1.0% | 0.7% | 1.4% | 1.4% | 1.5% |
| 2022/23 | • | 40 | 1.2% | 0.8% | 1.5% | 1.5% | 1.6% |
| 2023/24 | • | 35 | 1.1% | 0.8% | 1.5% | 1.6% | 1.7% |
| 2024/25 | • | 35 | 1.1% | 0.8% | 1.5% | 1.4% | 1.6% |
Source: Department of Health and Social Care, National Child Measurement Programme
The majority of Year 6 children in Hull are a healthy weight (just over half of children) although the percentage reduced to below 60% for the first time in 2021/22. The latest percentage of 56.5% for 2024/25 is the second lowest since NCMP began.
The percentage in Hull has been consistently lower than England and the region.
In 2024/25, there were 1,785 Year 6 children who were classified as having a healthy weight.
Compared with benchmark
Year 6 prevalence of healthy weight (Persons 10-11 yrs)
|
Period
|
Kingston upon Hull |
Yorkshire and the Humber region (statistical)
|
England
|
||||
|---|---|---|---|---|---|---|---|
|
Count
|
Value
|
95%
Lower CI |
95%
Upper CI |
||||
| 2006/07 | • | 1345 | 65.3% | 63.1% | 67.2% | - | 66.8% |
| 2007/08 | • | 1520 | 61.5% | 59.6% | 63.4% | 65.4% | 66.0% |
| 2008/09 | • | 1575 | 63.4% | 61.5% | 65.3% | 66.1% | 66.1% |
| 2009/10 | • | 1620 | 64.4% | 62.5% | 66.2% | 65.6% | 65.4% |
| 2010/11 | • | 1535 | 61.5% | 59.6% | 63.4% | 65.4% | 65.3% |
| 2011/12 | • | 1565 | 62.5% | 60.6% | 64.4% | 65.0% | 64.9% |
| 2012/13 | • | 1555 | 62.8% | 60.9% | 64.8% | 65.3% | 65.4% |
| 2013/14 | • | 1670 | 64.2% | 62.5% | 66.1% | 65.2% | 65.1% |
| 2014/15 | • | 1820 | 63.6% | 61.8% | 65.3% | 65.3% | 65.3% |
| 2015/16 | • | 1780 | 62.1% | 60.3% | 63.9% | 64.1% | 64.5% |
| 2016/17 | • | 1870 | 62.9% | 61.1% | 64.6% | 63.9% | 64.4% |
| 2017/18 | • | 1875 | 60.9% | 59.2% | 62.6% | 63.8% | 64.3% |
| 2018/19 | • | 1970 | 62.7% | 61.1% | 64.5% | 63.6% | 64.3% |
| 2019/20 | • | 1920 | 61.6% | 59.8% | 63.3% | 62.9% | 63.4% |
| 2021/22 | • | 1740 | 56.3% | 54.6% | 58.1% | 59.4% | 60.8% |
| 2022/23 | • | 2005 | 58.6% | 56.9% | 60.2% | 60.4% | 61.9% |
| 2023/24 | • | 1875 | 56.6% | 54.9% | 58.3% | 60.9% | 62.5% |
| 2024/25 | • | 1785 | 56.5% | 54.7% | 58.2% | 60.7% | 62.2% |
Source: Department of Health and Social Care, National Child Measurement Programme
A similar percentage of Year 6 children are living with excess weight (excluding obesity) in Hull compared to England, and this has been relatively consistent between 2006/07 and 2024/25 varying between 13.3% and 15.4%. The percentages are similar to England. However, the fact that this is similar to England is not necessarily a good thing as for Hull there has been a greater shift from the ‘healthy weight’ to ‘living with obesity’ categories as the percentages of Year 6 children in the ‘healthy weight’ category has been reducing and the percentages ‘living with obesity’ has been increasing in Hull. Thus whilst this measure is included on Fingertips, it does not portray the true levels of excess weight when it does not include obesity.
In the 2024/25 school year, there were 460 Year 6 children who were living with excess weight (not including those living with obesity).
Compared with benchmark
Year 6 prevalence of overweight (Persons 10-11 yrs)
|
Period
|
Kingston upon Hull |
Yorkshire and the Humber region (statistical)
|
England
|
||||
|---|---|---|---|---|---|---|---|
|
Count
|
Value
|
95%
Lower CI |
95%
Upper CI |
||||
| 2006/07 | • | 300 | 14.6% | 13.1% | 16.1% | - | 14.2% |
| 2007/08 | • | 370 | 15.0% | 13.7% | 16.5% | 14.2% | 14.3% |
| 2008/09 | • | 350 | 14.1% | 12.7% | 15.5% | 14.0% | 14.3% |
| 2009/10 | • | 345 | 13.7% | 12.5% | 15.2% | 14.2% | 14.6% |
| 2010/11 | • | 375 | 15.0% | 13.7% | 16.5% | 14.0% | 14.4% |
| 2011/12 | • | 365 | 14.6% | 13.2% | 16.0% | 14.4% | 14.7% |
| 2012/13 | • | 380 | 15.4% | 14.1% | 16.9% | 14.2% | 14.4% |
| 2013/14 | • | 365 | 14.0% | 12.7% | 15.4% | 14.2% | 14.4% |
| 2014/15 | • | 385 | 13.5% | 12.3% | 14.8% | 14.1% | 14.2% |
| 2015/16 | • | 395 | 13.8% | 12.6% | 15.2% | 14.3% | 14.3% |
| 2016/17 | • | 400 | 13.4% | 12.2% | 14.7% | 14.2% | 14.3% |
| 2017/18 | • | 440 | 14.3% | 13.2% | 15.6% | 14.1% | 14.2% |
| 2018/19 | • | 450 | 14.3% | 13.2% | 15.6% | 14.1% | 14.1% |
| 2019/20 | • | 440 | 14.1% | 13.0% | 15.4% | 13.8% | 14.1% |
| 2021/22 | • | 410 | 13.3% | 12.2% | 14.6% | 14.3% | 14.3% |
| 2022/23 | • | 460 | 13.5% | 12.4% | 14.7% | 14.0% | 13.9% |
| 2023/24 | • | 475 | 14.3% | 13.2% | 15.6% | 13.8% | 13.8% |
| 2024/25 | • | 460 | 14.6% | 13.4% | 15.9% | 13.9% | 13.9% |
Source: Department of Health and Social Care, National Child Measurement Programme
There was a steady increase in the prevalence of Year 6 children living with obesity for both Hull and England between 2006/07 and 2019/20 with the prevalence in Hull being statistically significantly higher than England for all years except 2013/14. Over this time, the prevalence increased from 19.4% in 2006/07 to 23.4% in 2019/20.
Between 2019/20 and 2021/22, there was an sharper increase in the prevalence for England and a much sharper increase for Hull, and whilst the prevalence reduced for 2022/23, it has increased for 2023/24 and has remained relatively unchanged for 2024/25 (only decreasing by 0.1 percentage points). The percentage for 2024/25 is the third highest since NCMP began.
In the 2024/25 school year, there were 880 Year 6 children who were living with obesity.
Compared with benchmark
Year 6 prevalence of obesity (including severe obesity) (Persons 10-11 yrs)
|
Period
|
Kingston upon Hull |
Yorkshire and the Humber region (statistical)
|
England
|
||||
|---|---|---|---|---|---|---|---|
|
Count
|
Value
|
95%
Lower CI |
95%
Upper CI |
||||
| 2006/07 | • | 400 | 19.4% | 17.8% | 21.2% | - | 17.5% |
| 2007/08 | • | 555 | 22.5% | 20.8% | 24.1% | 18.9% | 18.3% |
| 2008/09 | • | 540 | 21.7% | 20.2% | 23.5% | 18.6% | 18.3% |
| 2009/10 | • | 520 | 20.7% | 19.2% | 22.4% | 18.7% | 18.7% |
| 2010/11 | • | 570 | 22.8% | 21.2% | 24.5% | 19.2% | 19.0% |
| 2011/12 | • | 560 | 22.4% | 20.7% | 23.9% | 19.2% | 19.2% |
| 2012/13 | • | 520 | 21.0% | 19.5% | 22.7% | 19.0% | 18.9% |
| 2013/14 | • | 535 | 20.6% | 19.0% | 22.2% | 19.2% | 19.1% |
| 2014/15 | • | 640 | 22.4% | 20.9% | 23.9% | 19.2% | 19.1% |
| 2015/16 | • | 675 | 23.6% | 22.0% | 25.1% | 20.3% | 19.8% |
| 2016/17 | • | 675 | 22.7% | 21.3% | 24.3% | 20.4% | 20.0% |
| 2017/18 | • | 725 | 23.5% | 22.1% | 25.1% | 20.6% | 20.1% |
| 2018/19 | • | 680 | 21.7% | 20.3% | 23.1% | 21.0% | 20.2% |
| 2019/20 | • | 730 | 23.4% | 21.9% | 24.9% | 21.9% | 21.0% |
| 2021/22 | • | 905 | 29.3% | 27.8% | 31.0% | 24.9% | 23.4% |
| 2022/23 | • | 915 | 26.8% | 25.3% | 28.3% | 24.1% | 22.7% |
| 2023/24 | • | 925 | 27.9% | 26.4% | 29.5% | 23.6% | 22.1% |
| 2024/25 | • | 880 | 27.8% | 26.4% | 29.5% | 24.1% | 22.2% |
Source: Department of Health and Social Care, National Child Measurement Programme
A very similar trend over time occurred for severe obesity as for obesity, although there was more year-on-year variability in Hull, and the increase over time has been greater.
Between 2006/07 when NCMP began, the prevalence of severe obesity in Hull has more than doubled from 3.9% to 8.9% for 2024/25. There has been a particularly sharp increase in the last year with the prevalence increasing from 7.8% to 8.9%.
With such a relatively large increase in Hull compared to a very small increase for England between 2023/24 and 2024/25, the inequalities gap has increased and it is the largest it has been since 2006/07.
In the 2024/25 school year, in Hull, there were 280 Year 6 children who were living with severe obesity.
Compared with benchmark
Year 6 prevalence of severe obesity (Persons 10-11 yrs)
|
Period
|
Kingston upon Hull |
Yorkshire and the Humber region (statistical)
|
England
|
||||
|---|---|---|---|---|---|---|---|
|
Count
|
Value
|
95%
Lower CI |
95%
Upper CI |
||||
| 2006/07 | • | 80 | 3.9% | 3.2% | 4.9% | - | 3.2% |
| 2007/08 | • | 115 | 4.7% | 4.0% | 5.6% | 3.7% | 3.4% |
| 2008/09 | • | 110 | 4.4% | 3.6% | 5.3% | 3.5% | 3.4% |
| 2009/10 | • | 100 | 4.0% | 3.3% | 4.8% | 3.5% | 3.5% |
| 2010/11 | • | 125 | 5.0% | 4.3% | 6.0% | 3.6% | 3.6% |
| 2011/12 | • | 130 | 5.2% | 4.4% | 6.1% | 3.7% | 3.7% |
| 2012/13 | • | 105 | 4.2% | 3.6% | 5.2% | 3.5% | 3.6% |
| 2013/14 | • | 115 | 4.4% | 3.8% | 5.4% | 3.8% | 3.7% |
| 2014/15 | • | 150 | 5.2% | 4.4% | 6.0% | 3.8% | 3.7% |
| 2015/16 | • | 170 | 5.9% | 5.2% | 6.9% | 4.2% | 4.0% |
| 2016/17 | • | 155 | 5.2% | 4.5% | 6.1% | 4.3% | 4.1% |
| 2017/18 | • | 165 | 5.4% | 4.6% | 6.2% | 4.5% | 4.2% |
| 2018/19 | • | 150 | 4.8% | 4.1% | 5.6% | 4.7% | 4.4% |
| 2019/20 | • | 195 | 6.3% | 5.4% | 7.1% | 5.1% | 4.7% |
| 2021/22 | • | 245 | 7.9% | 7.0% | 8.9% | 6.4% | 5.8% |
| 2022/23 | • | 255 | 7.5% | 6.7% | 8.4% | 6.3% | 5.7% |
| 2023/24 | • | 260 | 7.8% | 7.0% | 8.8% | 6.3% | 5.5% |
| 2024/25 | • | 280 | 8.9% | 7.9% | 9.8% | 6.4% | 5.6% |
Source: Department of Health and Social Care, National Child Measurement Programme
The prevalence of excess weight in Year 6 for Hull has gradually increased between 2006/07 and 2019/20 from 34.0% to 37.6%, but the rate of increase has been higher since the pandemic. The prevalence increased to a high of 42.7% for 2021/22, and whilst the percentage fell to 40.4% for 2022/23, it has increased in the last three years, and is now only marginally below the high rate observed in 2021/22.
The prevalence of excess weight among Year 6 children in Hull is the second highest it has been since NCMP began having increased by 25% between 2006/07 when it was 34.0%.
In the 2024/25 school year, there were 1,345 Year 6 children who were living with excess weight in Hull.
Compared with benchmark
Year 6 prevalence of overweight (including obesity) (Persons 10-11 yrs)
|
Period
|
Kingston upon Hull |
Yorkshire and the Humber region (statistical)
|
England
|
||||
|---|---|---|---|---|---|---|---|
|
Count
|
Value
|
95%
Lower CI |
95%
Upper CI |
||||
| 2006/07 | • | 700 | 34.0% | 32.0% | 36.0% | - | 31.7% |
| 2007/08 | • | 925 | 37.4% | 35.6% | 39.4% | 33.1% | 32.6% |
| 2008/09 | • | 890 | 35.8% | 34.0% | 37.7% | 32.5% | 32.6% |
| 2009/10 | • | 870 | 34.6% | 32.7% | 36.5% | 33.0% | 33.4% |
| 2010/11 | • | 945 | 37.9% | 36.0% | 39.8% | 33.2% | 33.4% |
| 2011/12 | • | 920 | 36.7% | 34.9% | 38.7% | 33.7% | 33.9% |
| 2012/13 | • | 900 | 36.4% | 34.6% | 38.4% | 33.2% | 33.3% |
| 2013/14 | • | 895 | 34.4% | 32.7% | 36.4% | 33.4% | 33.5% |
| 2014/15 | • | 1025 | 35.8% | 34.1% | 37.6% | 33.3% | 33.2% |
| 2015/16 | • | 1070 | 37.3% | 35.7% | 39.2% | 34.6% | 34.2% |
| 2016/17 | • | 1075 | 36.1% | 34.4% | 37.9% | 34.6% | 34.2% |
| 2017/18 | • | 1170 | 38.0% | 36.2% | 39.6% | 34.7% | 34.3% |
| 2018/19 | • | 1130 | 36.0% | 34.4% | 37.7% | 35.1% | 34.3% |
| 2019/20 | • | 1170 | 37.6% | 35.9% | 39.3% | 35.8% | 35.2% |
| 2021/22 | • | 1320 | 42.7% | 40.9% | 44.4% | 39.2% | 37.8% |
| 2022/23 | • | 1380 | 40.4% | 38.7% | 41.9% | 38.1% | 36.6% |
| 2023/24 | • | 1400 | 42.2% | 40.6% | 44.0% | 37.5% | 35.8% |
| 2024/25 | • | 1345 | 42.6% | 40.8% | 44.2% | 37.9% | 36.2% |
Source: Department of Health and Social Care, National Child Measurement Programme
Initial Briefing Paper 2024/25
The national prevalence estimates were published on the 4 November 2025, and an initial Briefing Paper was produced which summarised the results for Hull.
Detailed Local Report 2024/25
A detailed local report has been produced which examines differences in body mass index classifications for Year R and Year 6 children living in Hull for the 2024/25 school year. The report examines differences between boys and girls, among different ethnic groups, among Hull’s 21 electoral wards, and by local deprivations fifths (based on the Index of Multiple Deprivation 2025).
Differences By Gender, Ethnicity, Geographical Areas of Residence and Deprivation
The detailed local report for 2024/25 above includes comparisons of differences in weight classifications by gender, ethnicity, geographical area of residence (wards, Area Committee Areas, the Integrated Care Board’s Neighbourhood Areas, and Family Hub Cluster areas) and by deprivation defined on the basis of the Index of Multiple Deprivation 2025 local fifths.
Changes in Weight Classification Over Time Among Same Cohort of Children (2016/17 and 2022/23)
It is also possible to examine the changes over time in the same children comparing a child’s weight classification in reception year aged 4-5 years with their weight classification measured six years later in Year 6 aged 10-11 years.
Such an analysis is often referred to as a ‘paired analysis’ as the two measurements on the same individuals are considered to be a pair in terms of data analysis. An analysis of such data is much more powerful compared to an analysis of unrelated or unpaired data, because one major element of random variation in any statistical model or data analysis is the difference in the two cohorts of individuals between two time points. For a paired analysis, the same individuals are measured between two time points, so the statistical variation of the individuals is considerably reduced.
This analysis was last undertaken when the data for measurements for the 2022/23 became available. Previous ‘paired analyses’ have also been undertaken on the Hull data from previous school year cohorts. As the same broad set of findings have been obtained when these paired analyses have been conducted previously, the paired analyses are not undertaken every year.
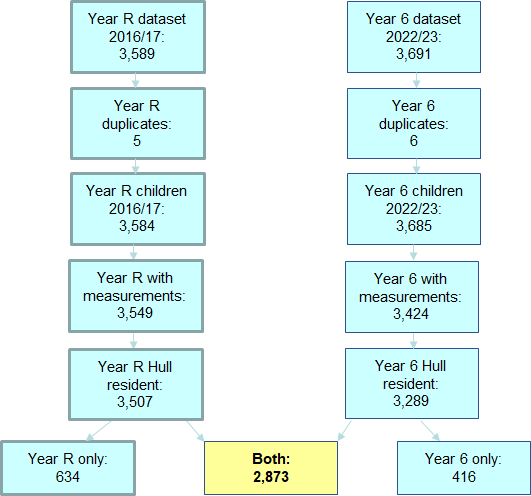
In the dataset of reception year children relating to the 2016/17 school year, there were 3,584 non-duplicate records of which 3,549 (99.0%) had their height and weight measurements recorded, and 3,507 (98.8%) of these measured children lived in Hull. In the Year 6 dataset relating to the 2022/23 school year, there were 3,685 non-duplicate records of which 3,424 (92.9%) had their height and weight recorded, and 3,289 (96.1%) of these measured children lived in Hull. The percentage of children who were measured in Year 6 is considerably lower than reception year, and this is because there were a higher rate of parents and/or children who refused consent to be measured. This could be associated with the increased levels of excess weight in Year 6. Fewer of these children lived in Hull. The reason for this is not clear, but could be associated with children remaining at the same primary school throughout their primary education but moving house and moving into neighbouring East Riding of Yorkshire.
- Overall, 2,873 of these children were ‘matched’ on their NHS number and were therefore identified as the same children.
- A further 623 reception year children had measurements for reception year and not in Year 6. This could be because they did not attend a Hull school in Year 6, did not live in Hull in Year 6, or attended a Hull school in Year 6 but were not measured (e.g. absent on the day or permission to measure was refused).
- A further 416 Year 6 children had measurements for Year 6 but not for reception year. This could be because they did not attend a Hull school in their reception year, did not live in Hull in their reception year, or attended a Hull school in their reception year but were not measured.
It is possible to examine the changes over time in a number of ways, including examining the measurements in reception year and presenting the measurements in Year 6 (looking forward – “what measurements did children in Year R have in Year 6”?) or examining the measurements in Year 6 and presenting the measurements in reception year (looking back – “what measurements did the Year 6 children have in Year R”?).
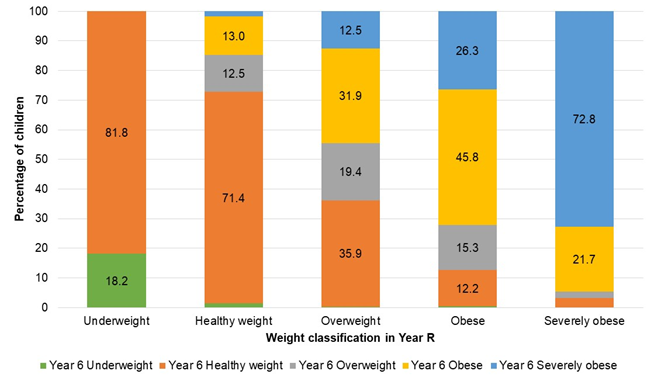
All Children
Firstly, if we examine the weight classifications in reception year and present the distribution of the weight classifications in Year 6 (looking forward). Half of all children were a healthy weight in both reception year and Year 6, although this differed slightly between the boys and girls with 48.9% of boys and 54.8% of girls in the healthy weight category for both school years. One-fifth of all children were living with excess weight in both school years and a further quarter were living with excess weight in either reception year or Year 6.
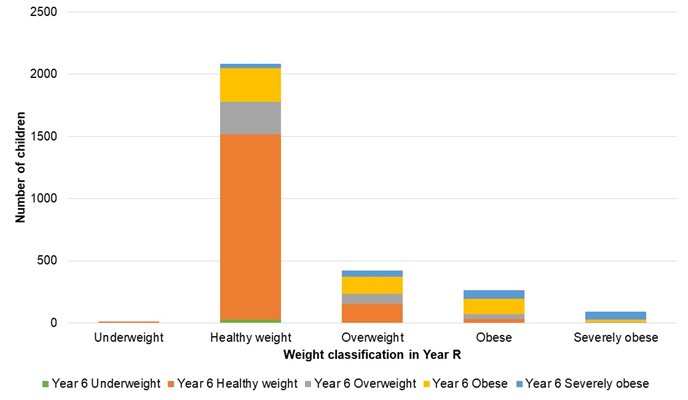
It can be seen above that a number of children changed weight classification between reception year and Year 6. This change is illustrated more clearly below which shows the percentage of children who were underweight, a healthy weight or living with excess weight in Year 6 for each of the weight classifications in reception year.
- All children who were underweight in reception year were either underweight in Year 6 or were a healthy weight in Year 6, with the majority (82%) being a healthy weight in Year 6.
- Of the children who were a healthy weight in reception year, a very small percentage were underweight in Year 6, seven in ten remained a healthy weight in Year 6, but the remainder were living with excess weight in Year 6.
- Just over one-third (36%) of the children who were overweight in reception were a healthy weight in Year 6, but 19% remained in the overweight group and 44% were living with obesity in Year 6 (including 13% who were living with severe obesity).
- Overall, 28% of of the children who were living with obesity in reception year reduced their weight in Year 6 (12% to a healthy weight and 15% to overweight), but seven in ten (72%) were still living with obesity in Year 6 including 26% who had increased their weight classification and were living with severe obesity.
- Almost three-quarters (73%) of children who were living with severe obesity in reception year were still living with severe obesity in Year 6. A further 22% had reduced their weight classification but were still living with obesity in Year 6. Relatively few reduced their weight classification and were a healthy weight or overweight in Year 6.
Whilst it is clear there is a strong association between excess weight in reception year and Year 6, there is also a great deal of variation. It is clear that it would be difficult to ‘predict’ with a good degree of accuracy, the weight classification in Year 6 based on the weight classification in reception year.
Secondly, we examine the weight classifications in Year 6 and present the distribution of the weight classifications in reception year (looking backwards). It can be seen that a very high number of children who were a healthy weight in Year 6 had been a healthy weight in reception year, and that the majority of children who were living with excess weight in Year 6 had also been a healthy weight in reception year, with the exception of children who were living with severe obesity in Year 6.
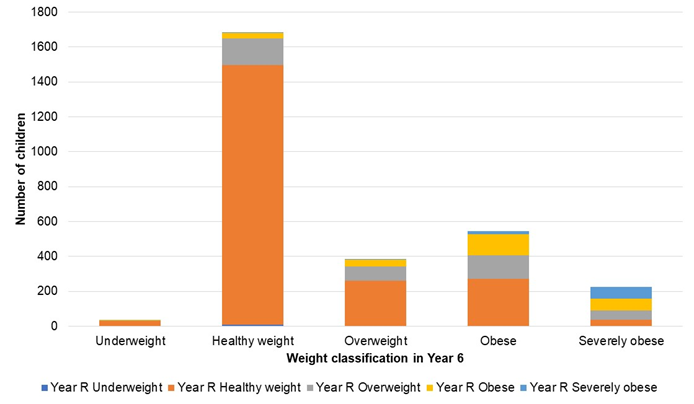
The percentage of children who were underweight, a healthy weight, overweight or were living with excess with obesity or severe obesity in reception year are given below for each weight classification in Year 6.
- Almost nine in ten of Year 6 children who were either underweight or a healthy weight in Year 6 had been a healthy weight in their reception year. Around one in ten children who were a healthy weight in Year 6 had been overweight or living with excess weight in reception year.
- Among those who were overweight in Year 6, two-thirds had been a healthy weight in their reception year, but 21% had been overweight and more than 10% had been living with excess weight in their reception year.
- Far fewer children who are living with obesity in Year 6 had been a healthy weight in their reception year (50% of those who were living with obesity in Year 6 and only 16% of those who were living with severe obesity in Year 6).
Again, the strong association between excess weight in reception year and Year 6 is clear. Nevertheless, as mentioned above, it would be difficult to predict the weight classification in one school year if the weight classification in the other school year was known. Even in the children who were living with severe obesity in Year 6, there is considerable variation in their weight classifications in reception year as they are relatively evenly split between the three weight classifications of (1) living with severe obesity, (2) living with obesity, and (3) overweight or healthy weight.
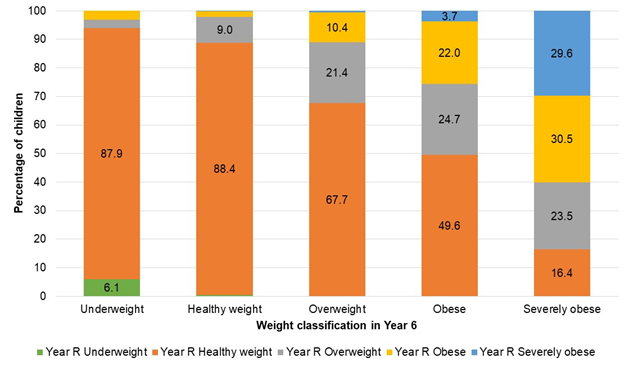
There were considerable variation in the weight classifications for some individuals. However, it is possible that a relatively small change in the body mass index centile could result in a change in weight category. For instance, more than three-quarters (77%) of all children who were overweight in their reception year and were living with excess weight in Year 6 had only increased their body mass index centile by less than 0.1, and over half (57%) of reception year children who were overweight and were living with severe obesity in Year 6 had increased their body mass index centile by less than 0.1.
There is less ‘scope’ to change the body mass index for the some weight classifications as there is less than 0.1 difference in the centile between categories, for instance, the centile for defining obesity is 95% and the centile for defining severe obesity is 99.6% so all individuals moving from one category to the other category will only move less than 0.1 in terms of the change in the centile. Similarly, larger changes in weight classification, the child must have moved more than 0.1 in terms of the change in the centile, for instance, moving from severe obesity (99.6% centile or above) to a healthy weight (2% to 85% centile) must have changed by more than 0.1 in terms of the change in their centile.
Whilst there were some substantial changes in individual children’s body mass indices over the six year period, the majority (62%) of centiles changed by less than +/- 0.2. Among those that did change by less than +/- 0.1, slightly more increased their body mass index centile between reception year and Year 6 than those who reduced it (20.8% versus 17.4%). This was also the case for changes greater than +/- 0.1 but less than +/- 0.2 with 12.6% increasing their body mass centile compared to 10.8% reducing it over the six year period. For those children with larger changes in their body mass index centile, the picture was a bit more mixed, but overall there was also more children who increased their body mass index centile compared to those who reduced it (19.9% versus 18.6%).
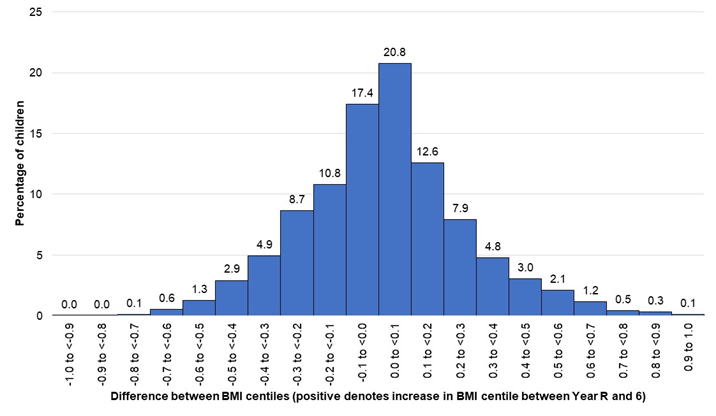
As depicted above, few children changed their body mass index centile by +/- 0.5 or more (179 children; 6.2%), with the majority changing by +/- 0.2 or less.
| Degree of change | Number | Percentage |
| +/- 0.9 to 1.0 | 5 | 0.2 |
| +/- 0.8 to 0.9 | 10 | 0.3 |
| +/- 0.7 to 0.8 | 17 | 0.6 |
| +/- 0.6 to 0.7 | 49 | 1.7 |
| +/- 0.5 to 0.6 | 98 | 3.4 |
| +/- 0.4 to 0.5 | 171 | 6.0 |
| +/- 0.3 to 0.4 | 279 | 9.7 |
| +/- 0.2 to 0.3 | 476 | 16.6 |
| +/- 0.1 to 0.2 | 671 | 23.4 |
| +/- 0.0 to 0.1 | 1,097 | 38.2 |
However, interestingly, whilst the majority (53.2%) of all children increased their body mass index centile between reception year and Year 6, there was a difference between different subgroups. Among the subset of children who remained in the same weight classification in reception year and Year 6, 60.5% had a lower centile in Year 6 and 39.5% had an increased centile in Year 6. Among children who were a healthy weight in both reception year and Year 6, 62.6% had reduced their body mass centile (thus 37.4% had increased it), but among children who had excess weight in both reception year and Year 6, only 32.8% had reduced their body mass index centile (thus 67.2% had increased it). Some of this might be an artefact of the changes necessary in the centile for a weight classification to change, but it does imply – together with the other changes mentioned above – that children who are already living with excess weight in reception year are more likely to have a higher weight classification in Year 6 compared to children who were a healthy weight in their reception year.
This is further highlighted in the table below which summarises the changes in weight classification. The children who had the same weight classification both in reception year and in Year 6 have also been split into those who reduced their body mass index centile and those who increased their body mass index centile.
| Change from Year R to Year 6 | Number | Percentage |
| Underweight for both | 2 | 0.1 |
| Underweight to healthy weight | 9 | 0.3 |
| Underweight to excess weight | 0 | 0.0 |
| Healthy weight to underweight | 29 | 1.0 |
| Healthy weight for both | 1,488 | 51.8 |
| ……………reduced body mass index centile | 932 | 32.4 |
| ……………increased body mass index centile | 556 | 19.4 |
| Healthy weight to overweight | 260 | 9.0 |
| Healthy weight to obese | 271 | 9.4 |
| Healthy weight to severe obesity | 37 | 1.3 |
| Overweight to underweight | 1 | 0.0 |
| Overweight to healthy weight | 152 | 5.3 |
| Overweight for both | 82 | 2.9 |
| ……………reduced body mass index centile | 33 | 1.1 |
| ……………increased body mass index centile | 49 | 1.7 |
| Overweight to obese | 135 | 4.7 |
| Overweight to severe obesity | 53 | 1.8 |
| Obese to underweight | 1 | 0.0 |
| Obese to healthy weight | 32 | 1.1 |
| Obese for both | 120 | 4.2 |
| ……………reduced body mass index centile | 43 | 1.5 |
| ……………increased body mass index centile | 77 | 2.7 |
| Obese to severe obesity | 69 | 2.4 |
| Severe obesity to underweight | 0 | 0.0 |
| Severe obesity to healthy weight | 3 | 0.1 |
| Severe obesity to overweight | 2 | 0.1 |
| Severe obesity to obese | 20 | 0.7 |
| Severe obesity for both | 67 | 2.3 |
| ……………reduced body mass index centile | 55 | 1.9 |
| ……………increased body mass index centile | 12 | 0.4 |
| Total | 2,873 | 100.0 |
These changes can be summarised by grouping overweight and living with obesity and severe obesity into a single excess weight category.
| Change from Year R to Year 6 | Number | Percentage |
| Underweight for both | 2 | 0.1 |
| Underweight to healthy weight | 9 | 0.3 |
| Underweight to excess weight | 0 | 0.0 |
| Healthy weight to underweight | 29 | 1.0 |
| Healthy weight for both | 1,488 | 51.8 |
| ……………reduced body mass index centile | 932 | 32.4 |
| ……………increased body mass index centile | 556 | 19.4 |
| Healthy weight to excess weight | 568 | 19.8 |
| Excess weight to underweight | 2 | 0.1 |
| Excess weight to healthy weight | 187 | 6.5 |
| Excess weight for both | 269 | 9.4 |
| Excess weight for both (bur reduced centile) | 62 | 2.2 |
| Excess weight for both (but increased centile) | 257 | 8.9 |
| Total | 2,873 | 100.0 |
By Gender
As expected, given the differences between boys and girls mentioned above, there were also differences in the prevalence of excess weight in this subset of children who had been measured in both 2016/17 and 2022/23.
| Weight classification | Males Year R 2016/17 | Males Year 6 2022/23 | Females Year R 2016/17 | Females Year 6 2022/23 |
| Underweight | 0.5 | 1.0 | 0.2 | 1.3 |
| Healthy weight | 71.8 | 55.9 | 73.4 | 61.5 |
| Overweight | 14.8 | 12.9 | 14.6 | 13.9 |
| Living with obesity | 9.8 | 21.2 | 8.4 | 16.6 |
| Living with severe obesity | 3.1 | 9.0 | 3.4 | 6.7 |
| Living with excess weight | 27.7 | 43.1 | 26.4 | 37.2 |
Examining the proportionate change in prevalence of the weight classifications between boys and girls, it is apparent that there is a larger shift towards excess weight among boys compared to girls, and this is also shown when the changes in weight classifications are summarised.
Among those children who were living with excess weight in reception year, there were no substantial differences between boys and girls in the percentages who increased their body mass index centile (13.9% versus 13.6%), and slightly more boys who were living with excess weight in reception year reduced their body mass index centile in Year 6 (13.8% versus 12.8%). The main reason why a higher percentage of boys were living with excess weight in Year 6 (and a higher proportionate increase in prevalence – relative to the prevalence in reception year – for boys) was associated with the difference in the percentages who had a healthy weight in reception year but were living with excess weight in Year 6. More than one-fifth of boys (21.9%) had a healthy weight in reception year but were living with excess weight in Year 6 compared to 17.5% of girls. As a result, fewer boys were a healthy weight for both reception year and Year 6 compared to girls (48.9% versus 54.8%).
| Change from Year R to Year 6 | Boys (%) | Girls (%) |
| Underweight for both | 0.1 | 0.0 |
| Underweight to healthy weight | 0.4 | 0.2 |
| Underweight to excess weight | 0.0 | 0.0 |
| Healthy weight to underweight | 0.9 | 1.1 |
| Healthy weight for both | 48.9 | 54.8 |
| ……………reduced body mass index centile | 29.2 | 35.9 |
| ……………increased body mass index centile | 19.8 | 18.9 |
| Healthy weight to excess weight | 21.9 | 17.5 |
| Excess weight to underweight | 0.0 | 0.1 |
| Excess weight to healthy weight | 6.5 | 6.5 |
| Excess weight for both | 21.2 | 19.7 |
| ……………reduced body mass index centile | 7.3 | 6.1 |
| ……………increased body mass index centile | 13.9 | 13.6 |
By Local Deprivation Fifth
The prevalence across the weight classifications within this subset of children with measurements in both 2016/17 and 2022/23 can be examined in relation to the lower layer super output area they live within. Each lower layer super output area has been assigned an Index of Multiple Deprivation score and can be classified as ranging from the ‘most deprived fifth of areas of Hull’ to the ‘least deprived fifth of areas of Hull’ (see Index of Multiple Deprivation for more information).
The weight classifications in reception year are presented and show higher levels of excess weight among children living in the most deprived areas of Hull. The prevalence of excess weight among reception year children living in the most deprived two-fifths of areas of Hull are similar to each other, with the rates lower for children living in the middle fifth of deprived areas of Hull, and then considerable lower again for children living in the least deprived two-fifths of areas of Hull.
| Weight classification in Year R (2016/17) | Most deprived | Second most | Middle fifth | Second least | Least deprived |
| Underweight | 0.8 | 0.3 | 0.4 | 0.0 | 0.2 |
| Healthy weight | 69.2 | 68.8 | 72.3 | 77.9 | 78.5 |
| Overweight | 15.0 | 16.4 | 14.7 | 13.6 | 12.6 |
| Living with obesity | 11.2 | 10.1 | 8.9 | 6.7 | 7.0 |
| Living with severe obesity | 3.7 | 4.5 | 3.7 | 1.8 | 1.4 |
| Living with excess weight | 29.9 | 30.9 | 27.3 | 22.1 | 21.3 |
Higher levels of excess weight among children living in the most deprived areas of Hull are also evident among Year 6 children. A similar pattern across the deprivation fifths is present as noted for reception year, in that there are similar high rates for children living in the most deprived two-fifths of areas, lower rates for the middle fifth and lower rates again for children living in the least deprived two-fifths of areas of Hull. However, in the case of the Year 6 children, there appears to be slightly more difference between the most deprived and second most deprived fifths (indeed the second most deprived has the highest rates of excess weight) and between the second least and least deprived fifths (with higher rates of excess weight for the second least deprived).
| Weight classification in Year 6 (2022/23) | Most deprived | Second most | Middle fifth | Second least | Least deprived |
| Underweight | 1.2 | 0.8 | 0.8 | 1.6 | 1.4 |
| Healthy weight | 55.4 | 53.7 | 57.4 | 64.0 | 66.9 |
| Overweight | 14.5 | 13.8 | 12.8 | 13.4 | 11.5 |
| Living with obesity | 20.2 | 21.7 | 20.0 | 15.2 | 15.7 |
| Living with severe obesity | 8.7 | 9.9 | 8.9 | 5.8 | 4.5 |
| Living with excess weight | 43.4 | 45.5 | 41.7 | 34.7 | 31.7 |
As a result of the different prevalence of excess weight, there are different changes in weight classification and body mass index centile over the six years based on where the children live in Hull.
Far fewer children living in the most deprived areas of Hull were a healthy weight for both reception year and Year 6 compared to children living in the least deprived areas of Hull. There were higher percentages of children in the most deprived areas who had moved from a healthy weight in reception year to excess weight in Year 6 (20.3% for most deprived fifth versus 16.2% for least deprived fifth). Additionally, slightly more children who were an excess weight for both reception year and Year 6, increased their body mass index centile among children living in the most deprived areas (14.6% versus 11.5%).
| Change from Year R to Year 6 | Most deprived (%) | Second most (%) | Middle fifth (%) | Second least (%) | Least deprived (%) |
| Underweight for both | 0.1 | 0.0 | 0.0 | 0.0 | 0.2 |
| Underweight to healthy weight | 0.7 | 0.3 | 0.4 | 0.0 | 0.0 |
| Underweight to excess weight | 0.0 | 0.0 | 0.0 | 0.0 | 0.0 |
| Healthy weight to underweight | 0.9 | 0.7 | 0.8 | 1.6 | 1.2 |
| Healthy weight for both | 48.0 | 45.9 | 51.9 | 57.3 | 61.1 |
| ……………reduced body mass index centile | 29.5 | 26.9 | 33.5 | 38.3 | 38.7 |
| ……………increased body mass index centile | 18.4 | 19.0 | 18.4 | 19.0 | 22.5 |
| Healthy weight to excess weight | 20.3 | 22.2 | 19.6 | 19.0 | 16.2 |
| Excess weight to underweight | 0.1 | 0.1 | 0.0 | 0.0 | 0.0 |
| Excess weight to healthy weight | 6.8 | 7.6 | 5.2 | 6.7 | 5.7 |
| Excess weight for both | 23.0 | 23.2 | 22.1 | 15.4 | 15.5 |
| ……………reduced body mass index centile | 8.4 | 7.3 | 8.1 | 4.5 | 4.1 |
| ……………increased body mass index centile | 14.6 | 15.9 | 14.0 | 11.0 | 11.5 |
Logistic Regression Model – Which Factors Predict Change?
Whilst it is very clear that children who were living with excess weight in reception year were much more likely to be living with excess weight in Year 6, particularly those children living with obesity and severe obesity, as mentioned above, it would difficult to ‘predict’ the weight classification in Year 6 with a good degree of accuracy simply based on weight classification in reception year alone as there is considerable variation among the individuals.
Regression is often used to attempt to predict a value based on different factors. The body mass index centiles are bounded in that they cannot extend beyond the range 0 to 1. So one of the most appropriate models is logistic regression where the predicted variable is binary which takes two values, for instance, yes or no.
In this circumstance, it is possible to generate multiple models depending on what is to be examined. For instance, the factor being predicted could be excess weight in Year 6 or it could be living with obesity (or severe obesity) in Year 6.
There were relatively few factors included in the dataset, only age, gender, local deprivation fifths and weight classifications. Age was taken into account already as the body mass index reference curves used age to calculate the body mass index centile for individual children.
However, it is possible to assess if gender, deprivation (local fifths or Index of Multiple Deprivation score) and weight classification (or body mass index centile) in reception year are statistically significant independent predictors of having excess weight (or living with obesity / severe obesity) in Year 6 or not using a logistic regression model.
The results from a logistic regression model are in the form of odds-ratios which give the increased (or decreased) odds (or likelihood) of a child having excess weight in Year 6 for one category compared to another (e.g. for a boy compared to a girl or for a one category change of the local deprivation fifths) or for a change in a continuous variable (e.g. for a change of 10 units or 30 units on the Index of Multiple Deprivation 2019 score). For example, if the odds-ratio was 1.13 for gender, then this would mean there is a 13% increase in the odds (or likelihood) of a boy having excess weight in Year 6 compared to a girl.
As there is random variation associated with such measurements, any estimates will differ (e.g. if using another cohort of children from another school year), the 95% confidence intervals are presented which gives a range of values where the true value will lie. Wide confidence intervals denote uncertainty in the size of the effects. Further information is available under Statistical Testing and Statistical Significance and under Confidence Interval within the Glossary.
Three models have been undertaken predicting excess weight, obesity and severe obesity. Statistical testing was undertaken to determine if the best model was to include deprivation and weight classification in Year R as categorical or continuous variables.
The real situation is known for all children (that is, we know if the child really did have excess weight, obesity or severe obesity in Year 6) so once the final model has been produced, it is possible to compare the results or accuracy of the model with the real situation to assess how good the model is. There are some formal statistical measures used to determine how good a test or model is at predicting a condition or disease.
- Sensitivity – percentage of people with condition correctly identified as such. If the person has the condition, what is the likelihood that the test will be positive?
- Specificity – percentage of people without the condition correctly identified as such. If the person does not have the condition, what is the likelihood that the test will be negative?
- Positive predictive value – percentage of people with a positive test result who have the condition. If the person has a positive test, what is the likelihood that they will have the condition?
- Negative predictive value – percentage of people with a negative test result who do not have the condition. If the person has a negative test, what is the likelihood that they will not have the condition?
The higher the values for sensitivity, specificity, positive predictive value and negative predictive value the better. However, in practice, it is a compromise between these different statistical measures, and there are no values that are considered to make the test or model ‘good’. Often different tests can be compared, especially if the test is on a continuous scale and a cut-off value determines if the test is positive or negative (for instance, levels of a chemical in the blood). In most cases, it can be realised if the test is poor at prediction, but in many cases, determining if the test is good depends on the specific circumstances in relation to the test or model, condition or disease, and any implications of obtaining a positive or negative test result (i.e. if further tests, interventions or treatments are required). How good a test is – if it is used – also determines resource use in terms of further tests, interventions or treatments.
Further information can be found within Testing Diagnostics within the Glossary.
Predicting Excess Weight in Year 6
Gender, deprivation (two categories – comparing most deprived three-fifths of areas of Hull with least deprived two-fifths of areas of Hull) and the body mass index centile in reception year (continuous variable) were statistical significant independent predictors of whether or not a child had excess weight in Year 6 or not.
Boys had a 37% increase in odds of having excess weight in Year 6 compared to girls even after adjusting for their body mass index centile in reception year and where they lived in relation to local deprivation levels.
Children living in the most deprived three-fifths of areas of Hull had a 46% increase in odds of having excess weight in Year 6, after taking into account their gender and their body mass index centile in reception year.
After considering gender and local deprivation levels, a child with a body mass index centile in reception year 0.1 higher than another child had a 60% increase in odds of having excess weight in Year 6. Comparing two children with a difference of 0.3 in their body mass index centiles in reception year, the child with the higher body mass index centile would have a three-fold increase in the odds of excess weight. For a 0.6 difference in body mass index centile in reception year, there was a 16-fold increase in odds. To put this in context, underweight was classified as below the 2nd centile, healthy weight as the 2nd centile or above but lower than the 85th centile, overweight as on or above the 85th centile. Living with obesity as on or above the 95th centile, and severe obesity as on or above the 99.6th centile. So if we are comparing two children with a difference of 0.6 in their body mass index centile in reception year, this would mean we would be comparing a child with a body mass index centile of 0.2 (healthy weight but relatively low for their height, age and gender) with another child with a body mass index centile of 0.8 in their reception year (healthy weight but almost at the cut-off value for overweight), or two children with body mass index centiles in reception year of 0.36 (healthy weight but relatively low for their height, age and gender) to 0.96 (living with obesity). It has already been noted that the children who were living with obesity in reception year were much more likely to be living with obesity in Year 6 as well compared to a child who was a healthy weight in reception year. So this analysis confirms through a modelling the association, but allows us to quantify the associations and assess if factors are independent predictors or not.
| Factor | Category / change | Odds ratio (95% CI) | Interpretation |
| Gender | Female | 1.0 | Reference category |
| Male | 1.37 (1.15 to 1.62) | 37% increase in odds | |
| Local deprivation fifth | Least deprived 40% of Hull | 1.0 | Reference category |
| Most deprived 60% of Hull | 1.46 (1.21 to 1.75) | 46% increase in odds | |
| Year R body mass index centile | 0.1 increase | 1.60 (1.05 to 2.42) | 60% increase in odds |
| 0.2 increase | 2.56 (1.69 to 3.88) | 156% increase in odds | |
| 0.3 increase | 4.09 (2.70 to 6.20) | 3-fold increase in odds | |
| 0.4 increase | 6.54 (4.31 to 9.91) | 6-fold increase in odds | |
| 0.5 increase | 10.5 (6.90 to 15.9) | 9-fold increase in odds | |
| 0.6 increase | 16.7 (11.0 to 25.4) | 16-fold increase in odds | |
| 0.7 increase | 26.7 (17.6 to 40.5) | 26-fold increase in odds | |
| 0.8 increase | 42.8 (28.2 to 64.8) | 42-fold increase in odds |
If the model was used to ‘predict’ which children would have excess weight in Year 6 then 63.2% of those with excess weight in Year 6 would be identified as such from the model (sensitivity), and 78.5% of those that did not have excess weight in Year 6 would be correctly identified as such from the model (specificity). Of all those ones identified as having excess weight in Year 6 model, 66.4% of them would really have excess weight in Year 6 (positive predictive value). Of all those ones identified as not having excess weight in Year 6 from the model, 76.1% of them would really not have excess weight in Year 6 (negative predictive value). Overall, 72.4% would be correctly identified in the model as either having excess weight in Year 6 or not having excess weight in Year 6.
This does mean that there is a relatively high ‘error’ rate with the model, and there would be considerable numbers of children having unnecessary interventions (370) or not receiving interventions they needed (424) if the model was used to ‘predict’ if a child was likely to have excess weight in Year 6 or not.
| Classified from model | Excess weight in Year 6 | No excess weight in Year 6 | Total |
| Excess weight from model | 732 | 370 | 1,102 |
| No excess weight from model | 424 | 1,347 | 1,771 |
| Total | 1,156 | 1,717 | 2,873 |
Predicting Obesity in Year 6
Gender, deprivation (two categories – comparing most deprived three-fifths of areas of Hull with least deprived two-fifths of areas of Hull) and the weight classification in reception year (four categories – underweight / healthy weight, overweight, obese and severe obesity) were statistical significant independent predictors of whether or not a child were living with obesity in Year 6 or not.
Boys had a 52% increase in odds of living with obesity in Year 6 compared to girls even after adjusting for their weight classification in reception year and where they lived in relation to local deprivation levels.
Children living in the most deprived three-fifths of areas of Hull had a 41% increase in odds of living with obesity in Year 6, after taking into account their gender and their weight classification in reception year.
After considering gender and local deprivation levels, a child with a weight classification in reception year one category higher than another child had a three-fold increase in odds of living with obesity in Year 6. This would represent a comparison of a child who was underweight or a healthy weight with a child who was overweight, or comparison of a child who was living with obesity with a child who was living with severe obesity.
A comparison of two children with a weight classification two categories different (for example, underweight / healthy weight compared to obesity, or overweight compared to severe obesity) resulted in a 16-fold increase in odds of living with obesity for the child in the higher weight classification compared to the lower weight classification in reception year. There was a 69-fold increase in odds of living with obesity for a three category difference in the reception year weight classification (that is, comparing a child who was underweight or healthy weight to a child who was living with severe obesity).
| Factor | Category / change | Odds ratio (95% CI) | Interpretation |
| Gender | Female | 1.0 | Reference category |
| Male | 1.52 (1.26 to 1.85) | 52% increase in odds | |
| Local deprivation fifth | Least deprived 40% of Hull | 1.0 | Reference category |
| Most deprived 60% of Hull | 1.41 (1.14 to 1.74) | 41% increase in odds | |
| Year R weight classification | 1-category increase | 4.13 (3.64 to 4.69) | 3-fold increase in odds |
| 2-category increase | 17.0 (15.0 to 19.4) | 16-fold increase in odds | |
| 3-category increase | 70.3 (61.9 to 79.9) | 69-fold increase in odds |
If the model was used to ‘predict’ which children would be living with obesity in Year 6 then 35.8% of those who were living with obesity in Year 6 would be identified as such from the model (sensitivity), and 96.3% of those who were not living with obesity in Year 6 would be correctly identified as such from the model (specificity). Of all those ones identified as living with obesity in Year 6 model, 78.0% of them would really be living with obesity in Year 6 (positive predictive value). Of all those ones identified as not living with obesity in Year 6 from the model, 80.3% of them would really not be living with obesity in Year 6 (negative predictive value). Overall, 80.0% would be correctly identified in the model as either living with obesity in Year 6 or not living with obesity in Year 6.
This does mean that there is a relatively high ‘error’ rate with the model, and there would be considerable numbers of children having unnecessary interventions (78) or not receiving interventions they needed (496) if the model was used to ‘predict’ if a child was likely to be living with obesity in Year 6 or not.
| Classified from model | Obesity in Year 6 | No obesity in Year 6 | Total |
| Obesity from model | 276 | 78 | 354 |
| No obesity from model | 496 | 2,023 | 2,519 |
| Total | 772 | 2,101 | 2,873 |
Predicting Severe Obesity in Year 6
Gender and the weight classification in reception year (four categories – underweight / healthy weight, overweight, obese and severe obesity) were statistical significant independent predictors of whether or not a child were living with severe obesity in Year 6 or not. Deprivation was not a significant independent predictor of severe obesity in Year 6. It is possible that children living in the more deprived areas of Hull were more likely to be living with severe obesity in Year 6 compared to children living in the least deprived areas of Hull, but this simply might be because they (generally) had higher levels of excess weight in their reception year.
After taking into account the weight classification in reception year, it does mean that there is no evidence that children living in the more deprived areas of Hull were at a greater risk of severe obesity in Year 6 (that is, an increased risk, over and above the levels ‘expected’ after taking into account their underlying weight in reception year).
Boys had a 52% increase in odds of living with severe obesity in Year 6 compared to girls even after adjusting for their weight classification in reception year.
After considering gender, a child with a weight classification in reception year one category higher than another child had a three-fold increase in odds of living with severe obesity in Year 6. This would represent a comparison of a child who was underweight or a healthy weight with a child who was overweight, or comparison of a child who was living with obesity with a child who was living with severe obesity.
A comparison of two children with a weight classification two categories different (for example, underweight / healthy weight compared to obesity, or overweight compared to severe obesity) resulted in a 16-fold increase in odds of living with severe obesity for the child in the higher weight classification compared to the lower weight classification in reception year. There was a 69-fold increase in odds of living with severe obesity in Year 6 for a three category difference in the reception year weight classification (that is, comparing a child who was underweight or healthy weight to a child who was living with severe obesity).
| Factor | Category / change | Odds ratio (95% CI) | Interpretation |
| Gender | Female | 1.0 | Reference category |
| Male | 1.46 (1.06 to 2.02) | 46% increase in odds | |
| Year R weight classification | 1-category increase | 4.73 (4.05 to 5.54)4 | 3-fold increase in odds |
| 2-category increase | 22.4 (19.2 to 26.2) | 21-fold increase in odds | |
| 3-category increase | 106 (90.8 to 124) | 105-fold increase in odds |
If the model was used to ‘predict’ which children would be living with severe obesity in Year 6 then 29.7% of those who were living with severe obesity in Year 6 would be correctly identified as such from the model (sensitivity), and 99.1% of those who were not living with severe obesity in Year 6 would be correctly identified as such from the model (specificity). Of all those ones identified as living with severe obesity in Year 6 based on the model, 72.8% of them would really be living with severe obesity in Year 6 (positive predictive value). Of all those ones identified as not living with severe obesity in Year 6 from the model, 94.3% of them would really not be living with severe obesity in Year 6 (negative predictive value). Overall, 93.6% would be correctly identified in the model as either living with severe obesity in Year 6 or not living with severe obesity in Year 6.
Whilst the ‘error’ rate is relatively low with the model and the underlying prevalence is low, the sensitivity of the model is low with less than 30% of children with severe obesity in Year 6 correctly identified as such from the model. So whilst there would be relatively few children having unnecessary interventions (25), the majority of children who need interventions would not receive them (159) if the model was used to ‘predict’ if a child was likely to be living with severe obesity in Year 6 or not.
| Classified from model | Severe obesity in Year 6 | No severe obesity in Year 6 | Total |
| Severe obesity from model | 67 | 25 | 92 |
| No severe obesity from model | 159 | 2,622 | 2,781 |
| Total | 226 | 2,647 | 2,873 |
Modelling Summary
The modelling has shown that gender, deprivation and weight classification in reception year are strong independent predictors of excess weight and living with obesity in Year 6. It has also been found that deprivation is not an independent predictor of severe obesity in Year 6 after taking into account gender and weight classification in reception year.
It has been shown that the models are not particularly useful in terms of trying to ‘predict’ which children might have excess weight in Year 6 based on their gender, deprivation levels of where they live and their weight in reception year. Such modelling would result in a relatively high ‘error’ rate, and if the models were used then some children would get an unnecessary intervention (including worry and concern) and a relatively high percentage of children who not get an intervention which they needed.
Nevertheless, even though the model cannot be use for prediction, it is important to examine the factors in this way. It would have been entirely feasible that boys and children living in the most deprived areas of Hull had an increased risk of excess weight in Year 6 simply because they had a higher weight classification in reception year. However, this analysis has shown that, even after taking into account the weight classification in reception year, boys and children living in the most deprived areas of Hull have an increased risk of excess weight in Year 6. That is, over and above that risk already ‘anticipated’ due to their increased weight classification in Year 6.
So children in higher weight classifications and with higher body mass index centile values in reception year were much more likely to be living with excess weight in Year 6, but this increased risk was even more so among boys and children living in the most deprived areas of Hull.
Boys also have an increased risk of living with severe obesity in Year 6 compared to girls, after taking into account their weight classification in reception year. However, children living in the most deprived areas do not. Children living in the most deprived areas of Hull may have an increased risk of severe obesity in Year 6 compared to children living in the least deprived areas of Hull, but this is simply because children living in the most deprived areas of Hull have slightly weights in reception year.
Barriers to Engagement
Parents and carers of children who are measured as part of the National Child Measurement Programme receive letters giving the body mass centile for their child, and providing the weight classification for their child. Parents and carers with children who are underweight and above a healthy weight are contacted via a telephone call, support is offered during this call and details of healthy weight services for children are provided.
However, in some cases there has been some reluctance to engage with services. To understand these barriers some research has been commissioned in Hull.
Strategic Need and Service Provision
Obesity is a complex problem with many drivers including behaviour, the environment, genetics, and culture.
Hull has developed a whole-system approach to promoting a healthy weight which considers the multi-factorial drivers of overweight and obesity and involves transformative co-ordination action across a broad range of disciplines and stakeholders. This views actions and behaviours of individuals in the context of the continuum of their lives from pre-natal through to older ages, and the transition through various life stages and transition points. Also there is action to tackle the ‘obesogenic’ environment, and ensuring opens spaces and places to be active are accessible. Long term sustainable change will only be achieved through the active engagement of schools, communities, families and individuals alongside Government legislation and policy.
This whole system approach to childhood healthy weight which makes this complex issue everybody’s business and encourages everyone to take proactive action.
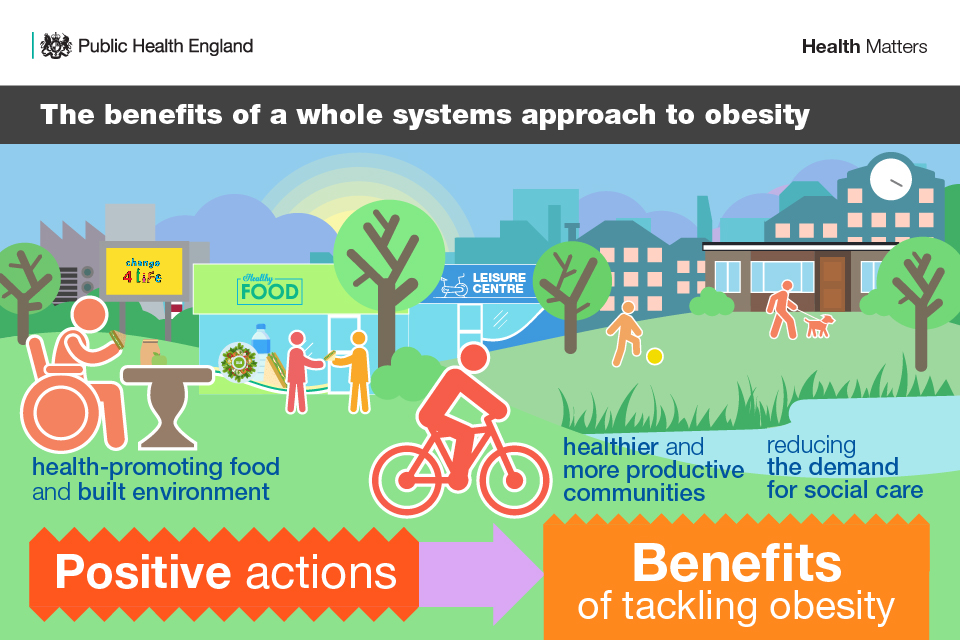
Some of these actions include:
- The Local Plan placing restrictions on the opening of new fast food outlets near secondary schools and recreational grounds.
- Tackling food insecurity and access to healthier foods through programmes such as healthy Holidays and the developing Hull Food Strategy.
- Investment in Family Hubs to support families to lead healthier lifestyles.
- Hull Culture and Leisure providing excellent sports facilities and parks where families can be active together.
- The voluntary and community sector providing activities such as healthy cooking programmes and physical activity opportunities.
- Engaging in national healthy lifestyle campaigns, such as Change 4 Life, and given them a local focus.
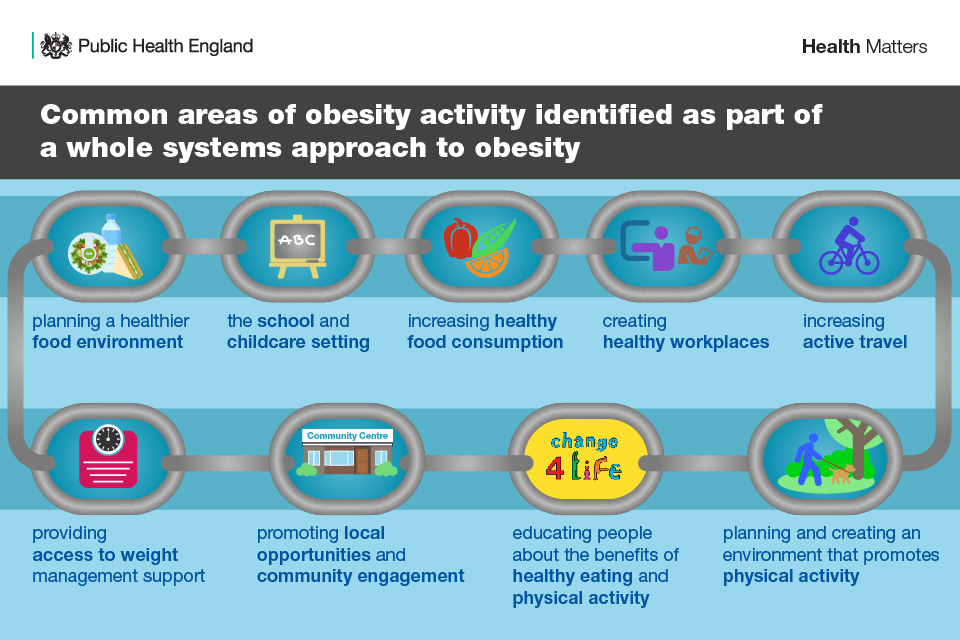
Resources
Cole TJ, Freeman JV, Preece MA. Body mass index reference curves for the UK, 1990.
Archives of Disease in Childhood 1995;73: 25‐9.
Cole TJ, Freeman JV, Preece MA. British 1990 growth reference centiles for weight,
height, body mass index and head circumference fitted by maximum penalized
likelihood. Statistics in Medicine 1998;17: 407‐29.
Freeman JV, Cole TJ, Chinn S, Jones PRM, White EM, Preece MA. Cross sectional
stature and weight reference curves for the UK, 1990. Archives of Disease in
Childhood 1995;73: 17‐24.
National Child Measurement Programme: National Child Measurement Programme, England, 2023/24 School Year. www.gov.uk/government/statistics/national-child-measurement-programme-england-202324-school-year
The Office for Health Improvement & Disparities’ Fingertips. https://fingertips.phe.org.uk
Updates
This page was last updated / checked on 30 March 2026.
This page is due to be updated / checked in November 2026.