Index
This topic area covers statistics and information relating to alcohol consumption among adults in Hull including local strategic need and service provision. Further information relating to Alcohol Consumption Among Young People is given under Lifestyle Factors within Children and Young People. Information relating to the frequency and quantity of alcohol consumption has been collected within Hull’s Health and Wellbeing Surveys and full reports are available under Surveys within Tools and Resources. A needs assessment was completed in Hull during 2023 for people with multiple unmet needs which included people who drank alcohol excessively. The report – which was finalised in 2024 – is available within Multiple Unmet Needs under Vulnerable Groups.
This page contains information from the Office for Health Improvement & Disparities’ Fingertips. Information is taken ‘live’ from the site so uses the latest available data from Fingertips and displays it on this page. As a result, some comments on this page may relate to an earlier period of time until this page is next updated (see review dates at the end of this page).
Headlines
- As well as alcoholic liver disease, alcohol consumption is a causal factor in 60 types of diseases and injuries, as well as a component cause in 200 others. As well as individual health risks, excessive alcohol consumption has significant effects on family, the community and the economy. Around 40% of all violent crimes are alcohol-related.
- The cost to society across England and Wales was estimated to be £21 billion in 2013/14 which covered external costs (treatment, crime, labour market, etc), and another estimate for 2006/07 was £55 billion which also included private costs to the individual such spending on alcohol, lawyer’s fees, human value costs from pain and grief associated with illness, disability and death. More recent estimates of the cost of alcohol on society are not available.
- For 2023/24, Hull has 775 premises licenced to sell alcohol which equates to 10.8 premises per square kilometre which is much higher than any other local authority in the region due to Hull being a city with tight geographical boundaries. The range across upper-tier local authorities in England ranges from 0.3 to 299 premises licenced to sell alcohol per square kilometre (Blackpool has the highest density outside London at 33.8 premises per square kilometre). Hull ranks at 42 highest out of the 266 lower-tier local authorities with data and 19th highest excluding the 30 local authorities with data that are in London. Furthermore, Hull has a high density of pubs, bars and nightclubs particularly around the city centre with all residents living within an eight minute drive of the nearest pub, bar or nightclub (almost all are within a three or four minute drive away).
- In Hull, whilst more young people and adults are never drinking alcohol, and the majority of those who are drinking are drinking less alcohol. However, there are higher levels of harmful alcohol consumption across Hull resulting in high levels of health-related harm and hospital admissions.
- From the local Health and Wellbeing Survey 2019, 22% never drank alcohol and 34% usually drank alcohol at least once a week. Overall, 32% displayed harmful drinking behaviour by drinking more than 14 units in a week, usually binge drinking weekly and/or having a high Fast Alcohol Screening Test score.
- Around 40% or more of men aged 16-74 years and 36% of women aged 16-24 years displayed harmful alcohol behaviours as did 38% of people who worked, 34% of students and 37% of people living in the least deprived fifth of areas of Hull.
- The rate of hospital admissions due to alcoholic liver disease in Hull was more than double that of England for 2022/23 (almost triple the rate for men, and not quite double the rate for women). Mortality rates from alcoholic liver disease were high among Hull, being more than one-third higher than England for deaths registered during 2022-24 although mortality rates were comparable in Hull to England for women.
- The rate of hospital admissions for alcohol-specific conditions / conditions wholly attributable to alcohol such as alcoholic liver disease and alcohol poisoning was 53% higher in Hull compared to England for 2023/24. Over the year, there were 2,325 admissions in total although some people could have been admitted more than once during the financial year and thus included more than once. The rate has increased substantially in the last year to 939 admissions per 100,000 population for 2023/24 (compared to 825 admissions per 100,000 population in 2022/23). The latest rate is the highest it has been since before 2016/17. Whilst the majority of the admissions are among men (66%), women account for the the majority of the increase in admissions in the last year (61%).
- There are also two other measures of the impact of alcohol on hospital admissions, both of which are modelled using Alcohol Attributable Fractions (AAF). AAF values are applied to each admission depending on the primary and secondary diagnosis codes assigned to the admission as well as the gender and age of the person being admitted. For instance, the AAF for epilepsy for males aged 25-34 years is 0.25 denoting that 25% of admissions are attributable to alcohol. Both use the maximum AAF value over all diagnosis codes, and the total AAF values are summed over all admissions within a period of time (most admissions will have an AAF value of zero). The narrow measure is the most frequently used and uses the maximum AAF value for the primary diagnosis (main reason for admission) and all secondary external causes (such as traffic accidents, falls, self-harm, etc). The broad measure uses the maximum AAF values over the primary diagnosis and all secondary diagnoses. During 2023/24, the alcohol-related admission rate (narrow measure) in Hull was 694 admissions per 100,000 population (930 for men and 471 for women). The rate was statistically significantly higher than England and among the highest in the region. Furthermore, the rate in Hull has increased in the last year particularly among Hull women. It was estimated that during 2023/24, there were 1,697 alcohol-related admissions in total (based on the narrow definition) in Hull (1,109 among men and 587 among women). The alcohol-related admission rate (broad measure) was also statistically significantly higher in Hull compared to England for 2023/24 and among the highest in the region at 2,357 admissions per 100,000 population (3,474 for men and 1,334 for women) with an estimated total number of 5,626 alcohol-related admissions in total (based on the broad definition) in Hull (3,985 among men and 1,640 among women) for 2023/24. The broad measure had also increased in the last year in Hull particularly among women.
- During 2024, there were 40deaths that were alcohol-specific or wholly attributable to alcohol among Hull residents giving a rate of 16.1 deaths per 100,000 population. Whilst the mortality rate has been increasing in Hull since 2006 when there were 12.0 deaths per 100,000 population, the rate has decreased in the last two years (from 20.3 deaths per 100,000 population in 2022).
- To estimate alcohol-related mortality, the AAF values have also been assigned to the causes of death (in most cases the AAF values are the same for each cause, gender and age group for diseases and medical conditions, but are generally the AAF value is higher for a death compared to an admission for external causes). The alcohol-related mortality rate is statistically significantly higher for men in Hull compared to England, and comparable to England for women for deaths registered during 2023. There was an estimated that there were 124 deaths (98 men and 26 women) that were alcohol-related that were registered during 2023. The alcohol-related mortality in Hull has increased between 2018 and 2022 for both men (from 63 to 82 deaths per 100,00 population) and women (from 22 to 29 deaths per 100,00 population), although in the last year, the rate increased for men (to 88 deaths per 100,00 population) but decreased relatively sharply for women (to 22 deaths per 100,00 population).
- The potential years of life that were lost due to alcohol-related mortality in 2023 were 54% higher among men in Hull, but comparable to England for women. It is estimated that there were 2,390 years of life lost for Hull men and 644 years of life lost for Hull women from alcohol-related deaths that were registered during 2023.
The Population Affected – Why Is It Important?
The following video from The Office for Health Improvement & Disparities (previously Public Health England) explains how ill health from both alcohol and tobacco can be prevented.
Alcohol consumption is the world’s third largest risk factor for disease and disability. Alcohol is a causal factor in 60 types of diseases and injuries, and a component cause in 200 others. Liver problems, reduced fertility, high blood pressure, increased risk of various cancers and heart attack are some of the numerous harmful effects of regularly drinking more than the recommended levels. Excessive alcohol consumption can also lead to fatigue, depression, weight gain, poor sleep and sexual problems.
Modelled estimates suggest that there were almost one-quarter of a million admissions attributable to alcohol that occurred in England during 2020/21.
No recent estimates of the cost of alcohol on society exist, but costs have been estimated previously and they are substantial. In 2013/14, the total annual cost to society of alcohol-related harm was estimated to be around £21 billion (£3.5 billion for NHS, £11 billion due to crime and £7 billion to the economy in terms of lost productivity). There are also significant effects on families and communities, with an increased risk of vandalism, violent crime, domestic abuse, road casualties and sickness absence from work. It is estimated that around 40% of all violent crimes are alcohol-related. The Office for Health Improvement & Disparities (previously Public Health England) cite a range between £27 billion and £52 billion from a study by Rehm et al which is based on external costs of alcohol from different studies in different countries and is based on the range of 1.4% and 2.7% of national income (applied to the UK national income in 2016). The National Society Marketing Centre estimated that the total societal cost of alcohol in England in 2006-07 was £55 billion and their estimate included the external costs above (treatment, crime, labour market, etc) as well as the costs to individuals including the cost of purchasing the alcohol and human value costs such as pain and grief associated with illness, disability and death.
It is recommended that men and women do not exceed 14 units of alcohol per week, and that people who do drink up to this level spread their drinking out over the week and have several alcohol-free days. These guidelines were updated in January 2016, and the fundamental change to the recommendations was that there is no safe level of drinking alcohol.
A local Health and Wellbeing Survey was conducted in 2019 involving over 4,000 adults (aged 16+ years) in Hull. The survey asked a number of questions relating to alcohol consumption and the results are presented below. Further information relating to the definitions used in this local survey in relation to alcohol consumption and alcohol harm can be found within the Glossary. The percentages differ slightly for the different analyses relating to alcohol as there were a number of questions enquiring about alcohol consumption, and not everybody answered every question so the total number of individuals differ slightly for the different analyses.
The Hull Picture
Density of Premises Licenced to Sell Alcohol
As Hull is a city with tightly defined geographical boundaries (compared to many other cities) and as a result it has a high density of premises licenced to sell alcohol compared to all other local authorities in the region. However, across England the density ranges from 0.3 to 299 premises per square kilometre for 2023/24. The lowest concentrations are in Northumberland and Slough (both 0.3 premises) and the highest in the City of London (at 299 premises) with Blackpool having the highest concentration outside London (at 33.8 premises). Therefore in relation to other cities beyond the Yorkshire and Humber region, the density in Hull is not as high. Hull is ranked 42nd highest (out of the 266 lower-tier local authorities in England with data) or 19th highest excluding the 30 local authorities with data in London.
The figures relate to the number of premises licenced to sell alcohol per square kilometre.
Compared with benchmark
| Indicator | Period | England | Yorkshire and the Humber region (statistical) | Kingston upon Hull | East Riding of Yorkshire | North East Lincolnshire | North Lincolnshire | York | Barnsley | Doncaster | Rotherham | Sheffield | Bradford | Calderdale | Kirklees | Leeds | Wakefield | North Yorkshire Cty |
|---|---|---|---|---|---|---|---|---|---|---|---|---|---|---|---|---|---|---|
Premises licensed to sell alcohol per square kilometre (Not applicable Not applicable) | 2023/24 | 1.3 | 1.1 | 10.8 | 0.5 | 2.4 | 0.6 | 3.4 | 2.0 | 1.4 | 2.5 | 4.8 | 3.0 | 1.7 | - | 4.2 | 3.2 | - |
This is even more evident when displayed graphically for the region.
Compared with benchmark
Premises licensed to sell alcohol per square kilometre (Not applicable Not applicable) 2023/24
| Area |
Recent
Trend |
Count
|
Value
|
95%
Lower CI |
95%
Upper CI |
|
|---|---|---|---|---|---|---|
| England | 170323 | 1.3 | 1.3 | 1.3 | ||
| Yorkshire and the Humber region (statistical) | 16190 | 1.1 | 1.0 | 1.1 | ||
| Kingston upon Hull | 775 | 10.8 | 10.1 | 11.6 | ||
| East Riding of Yorkshire | 1241 | 0.5 | 0.5 | 0.5 | ||
| North East Lincolnshire | 454 | 2.4 | 2.1 | 2.6 | ||
| North Lincolnshire | 501 | 0.6 | 0.5 | 0.6 | ||
| York | 917 | 3.4 | 3.2 | 3.6 | ||
| Barnsley | 646 | 2.0 | 1.8 | 2.1 | ||
| Doncaster | 812 | 1.4 | 1.3 | 1.5 | ||
| Rotherham | 716 | 2.5 | 2.3 | 2.7 | ||
| Sheffield | 1755 | 4.8 | 4.5 | 5.0 | ||
| Bradford | 1114 | 3.0 | 2.9 | 3.2 | ||
| Calderdale | 606 | 1.7 | 1.5 | 1.8 | ||
| Kirklees | - | - | - | - | ||
| Leeds | 2297 | 4.2 | 4.0 | 4.3 | ||
| Wakefield | 1085 | 3.2 | 3.0 | 3.4 | ||
| North Yorkshire Cty | - | - | - | - |
Source: OHID, based on Home Office and Office for National Statistics data
The number of premises licenced to sell alcohol has remained around 10 premises per square kilometre, although the figure for 2021/22 and 2023/24 at 10.8 premises per square kilometre. For 2023/24, there were a total of 775 premises in Hull licenced to sell alcohol.
Compared with benchmark
Premises licensed to sell alcohol per square kilometre (Not applicable Not applicable)
|
Period
|
Kingston upon Hull |
Yorkshire and the Humber region (statistical)
|
England
|
||||
|---|---|---|---|---|---|---|---|
|
Count
|
Value
|
95%
Lower CI |
95%
Upper CI |
||||
| 2015/16 | • | 705 | 9.9 | 9.2 | 10.6 | 1.1 | 1.2 |
| 2016/17 | • | 691 | 9.7 | 9.0 | 10.4 | 1.1 | 1.3 |
| 2017/18 | • | 719 | 10.1 | 9.3 | 10.8 | 1.3 | 1.3 |
| 2021/22 | • | 770 | 10.8 | 9.6 | 12.0 | 1.0 | 1.3 |
| 2023/24 | • | 775 | 10.8 | 10.1 | 11.6 | 1.1 | 1.3 |
Source: OHID, based on Home Office and Office for National Statistics data
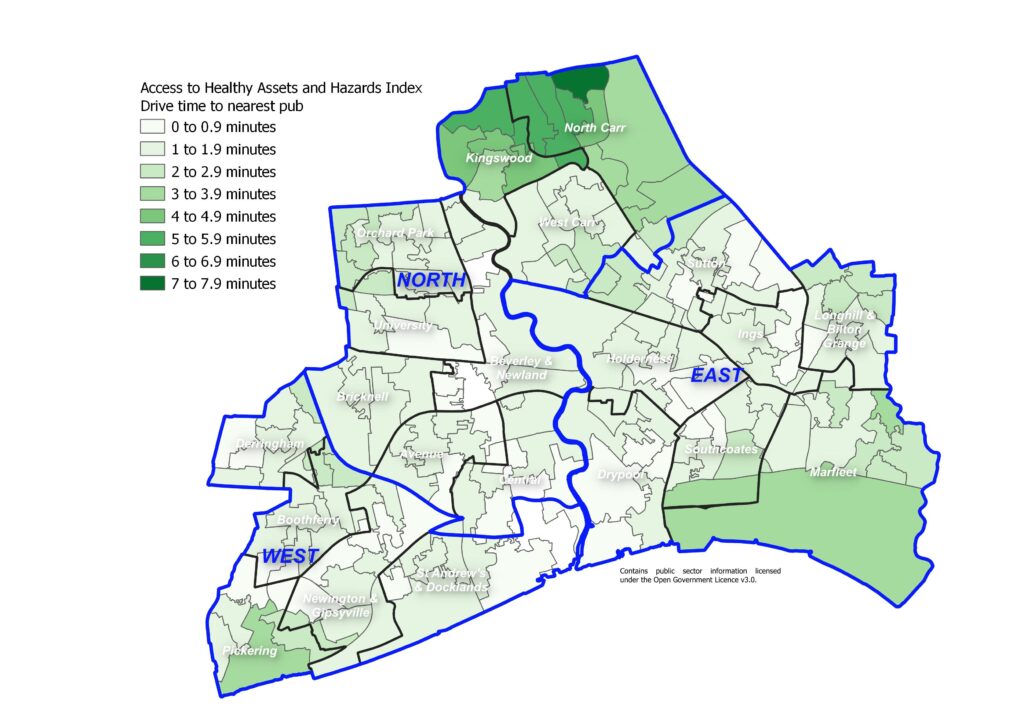
The Access to Healthy Assets and Hazards which includes drive times to nearest pub, bar or nightclub was updated in 2024.
The Access to Healthy Assets and Hazards (AHAH) index is designed to allow policy and decision makers to understand which areas have poor environments for health, and to help move away from treating features of the environment in isolation.
The Access to Healthy Assets and Hazards index is comprised of four domains: access to retail services (fast food outlets, gambling outlets, pubs/bars/nightclubs, off licences, tobacconists), access to health services (GP surgeries, A&E hospitals, pharmacies, dentists and leisure centres), the physical environment (green and blue spaces) and levels of air pollution (nitrogen dioxide (NO2), particulate matter smaller than 10 microns (PM10) and sulphur dioxide (SO2)).
In 2024, the Access to Healthy Assets and Hazards Index is very high in Hull with 44.7% of Hull’s population residing in the bottom fifth of areas nationally in relation to the Access to Healthy Assets and Hazards Index. The percentage nationally is 20.9% and across the other 14 lower tier local authorities in the region the range is from 1.3% to 32.6%.
Compared with benchmark
| Indicator | Period | England | Yorkshire and the Humber region (statistical) | Kingston upon Hull | East Riding of Yorkshire | North East Lincolnshire | North Lincolnshire | York | North Yorkshire UA | Barnsley | Doncaster | Rotherham | Sheffield | Bradford | Calderdale | Kirklees | Leeds | Wakefield |
|---|---|---|---|---|---|---|---|---|---|---|---|---|---|---|---|---|---|---|
Access to Healthy Assets & Hazards Index (Persons All ages) | 2024 | 20.9 | 18.2 | 44.7 | 9.4 | 23.6 | 10.7 | 1.3 | 13.4 | 10.2 | 6.2 | 9.7 | 13.7 | 32.6 | 5.1 | 13.1 | 30.3 | 18.8 |
Despite the very high levels in Hull, the index has decreased considerably since 2016 when nine in ten residents lived in the worst fifth of areas of England in relation to the index, although there was a large decrease between 2016 and 2017 to 46% with only relatively minor changes to 2022 and 2023.
In 2024, it is estimated that 120,220 residents in Hull live within areas defined as the bottom fifth of areas nationally based on the Access to Healthy Assets and Hazards Index.
Compared with benchmark
Access to Healthy Assets & Hazards Index (Persons All ages)
|
Period
|
Kingston upon Hull |
Yorkshire and the Humber region (statistical)
|
England
|
||||
|---|---|---|---|---|---|---|---|
|
Count
|
Value
|
95%
Lower CI |
95%
Upper CI |
||||
| 2016 | • | 233157 | 90.0% | - | - | 22.2% | 21.2% |
| 2017 | • | 120814 | 46.3% | - | - | 14.1% | 21.1% |
| 2022 | • | 114694 | 44.3% | - | - | 19.9% | 22.6% |
| 2024 | • | 120220 | 44.7% | - | - | 18.2% | 20.9% |
Source: Consumer Data Research Centre
Information relating to version 4 of the Access to Healthy Assets and Hazards index is available at lower layer super output area geographical level. There are 33,755 lower layer super output areas in England, and the percentile score has been calculated for each of the 168 lower layer super output areas in Hull. The index was updated in July 2024, and information on the individual components is available.
The drive times to the nearest pub, bar or nightclub are low in Hull. Whilst not everyone in a city will have access to a car or van (35% of households in Hull compared to 23% of households in England), the map does illustrate the density of pubs, bars and nightclubs in Hull, and many people will likely be a relatively short walk away from their nearest pub, bar or nightclub. If this is combined with the density of premises licenced to sell alcohol, access to alcohol is readily available throughout Hull.
Information on the other indicators is available under Geographical Area under Place.
Percentages Drinking Alcohol
Never Drinks Alcohol
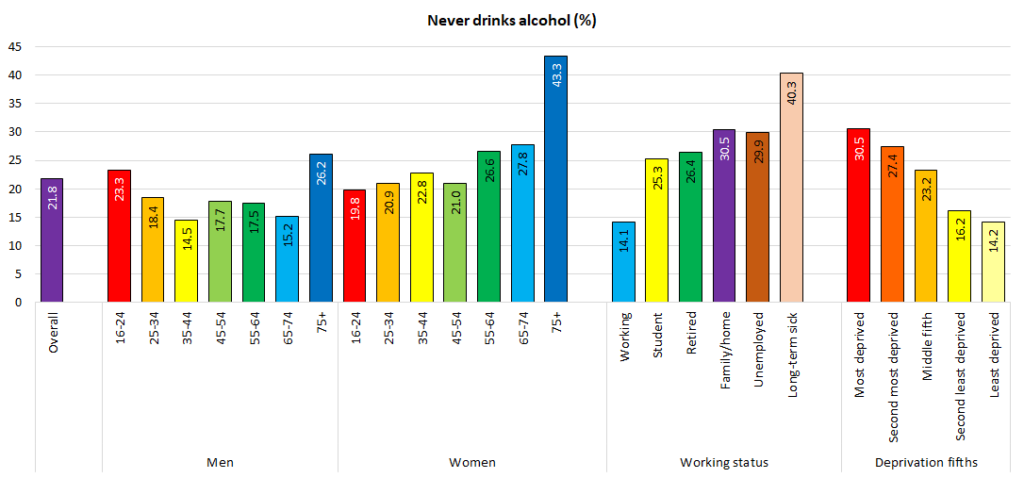
From the local Health and Wellbeing Survey 2019, 22% of residents aged 16+ years in Hull never drink alcohol. Women, people aged 75+ years and people living in the most deprived areas of Hull were the most likely to never drink alcohol. It is estimated that 208,867 people aged 16+ years live in Hull, and it is estimated that around 45,450 of them never drink alcohol. More people in Hull never drink alcohol compared to England (22% versus 18%) and also drink alcohol less frequently (34% versus 49% drinking weekly).
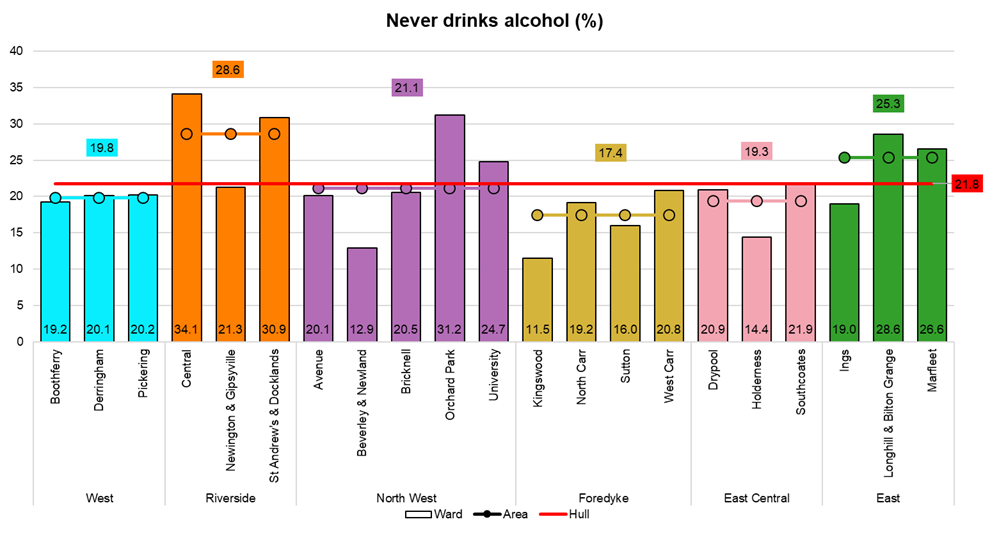
The percentage of adults reporting that they never drink alcohol varied considerably between electoral wards, with the highest percentages not drinking alcohol found in Central, St Andrew’s & Docklands and Orchard Park wards (34%, 31% and 31% respectively), while the lowest percentage of adults never drinking alcohol were in Kingswood, Beverley & Newland and Holderness wards (12%, 13% and 14% respectively).
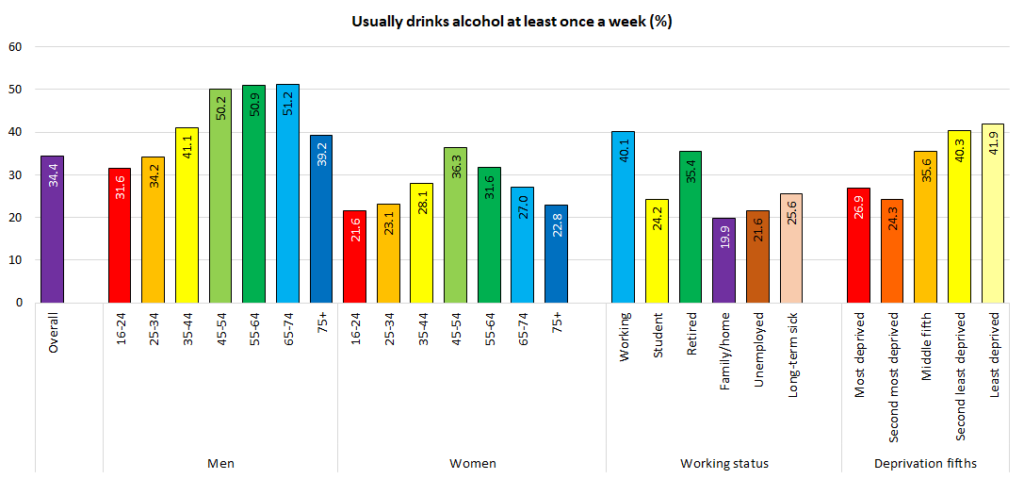
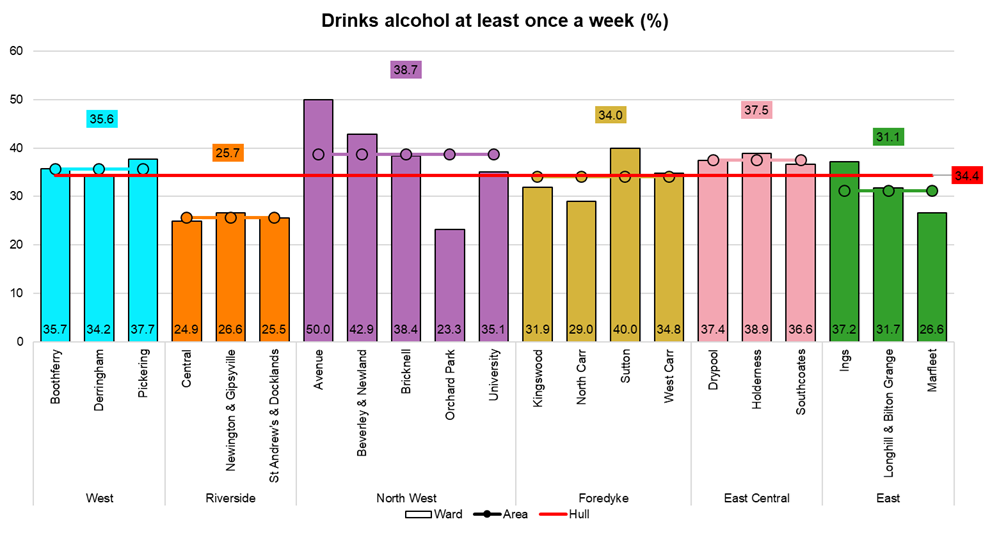
Drinks Weekly
Half of men aged 45-74 years, and more than four in ten men aged 35-44 years and people living in the least deprived two-fifths of areas of Hull drink alcohol at least once a week. Across all of Hull, it is estimated that 7,050 people drink alcohol every day, 10,650 drink alcohol 4-6 days a week, 54,050 drink alcohol 1-3 days a week and 46,200 drink alcohol 1-3 days a month and 45,450 drinking alcohol less than once a month. People in Hull drink alcohol less frequently than those in England with 58% of men and 41% of women in England drinking alcohol weekly compared to 42% of men and 27% of women in Hull.
The highest percentage of adults who drank alcohol at least once a week were found in Avenue, Beverley & Newland and Sutton wards (50%, 43% and 70% respectively) while the lowest percentage was found in Orchard Park (23%).
Harmful Drinking Behaviour
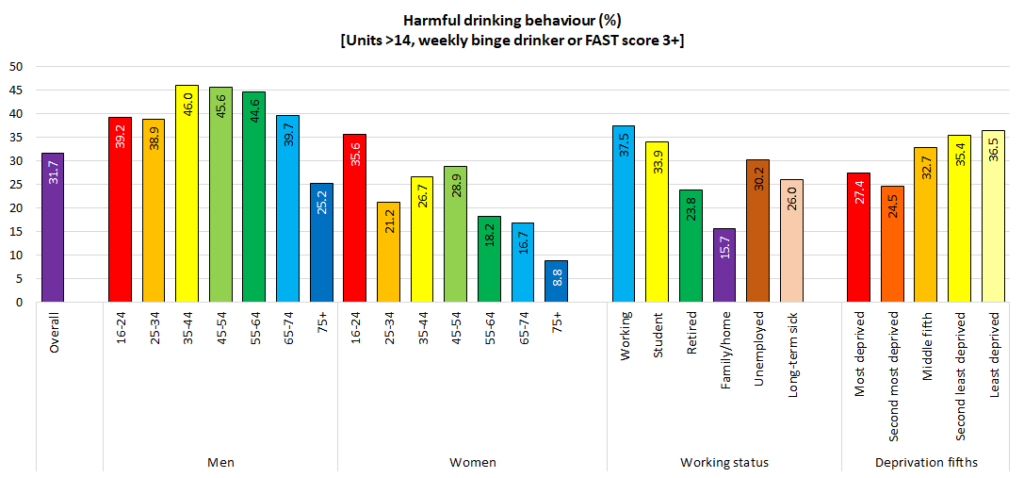
Overall, 31.7% of all adults in Hull display harmful drinking behaviour, although there are considerable differences by gender, age, employment status and deprivation. Harmful drinking behaviour was defined as drinking more than 14 units the previous week, usually binge drinking at least once a week and/or having a high Fast Alcohol Screening Test (FAST) score (sum of scores based on frequency of binge drinking, failing to do what was normally expected because of drinking and been unable to remember what happened the night before because of drinking, as well as having a friend, relative, doctor or health professional being concerned about drinking or suggesting the person cuts down). Further information relating to the definitions used in the survey is given in the Glossary.
More than one-third of men aged 16-74 years and women aged 16-24 years exhibited harmful alcohol behaviours. Across all of Hull, it is estimated that 66,250 adults aged 16+ years have harmful alcohol behaviours.
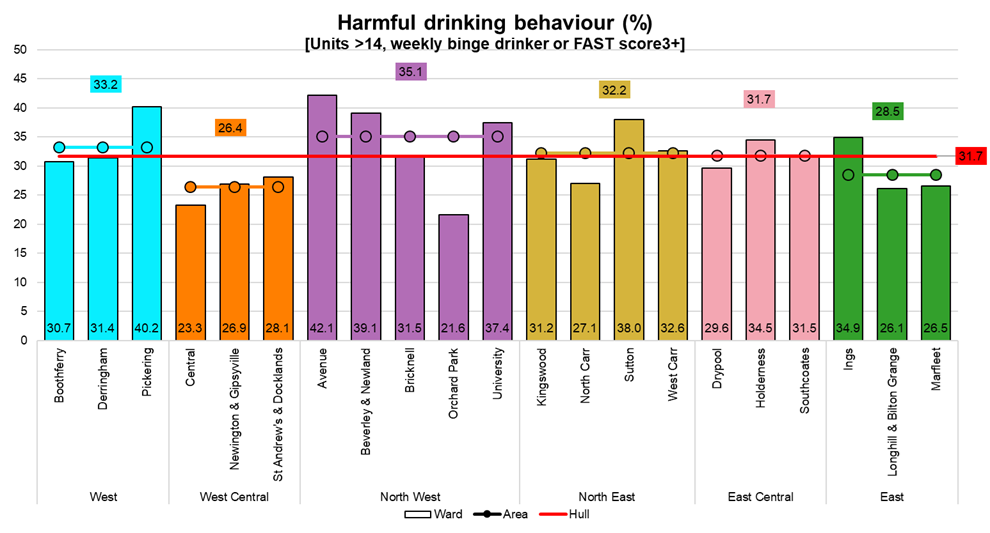
The percentage of adults exhibiting harmful alcohol behaviours varied between wards, ranging from 22% in Orchard Park and 23% in Central to 42% in Avenue and 40% in Pickering.
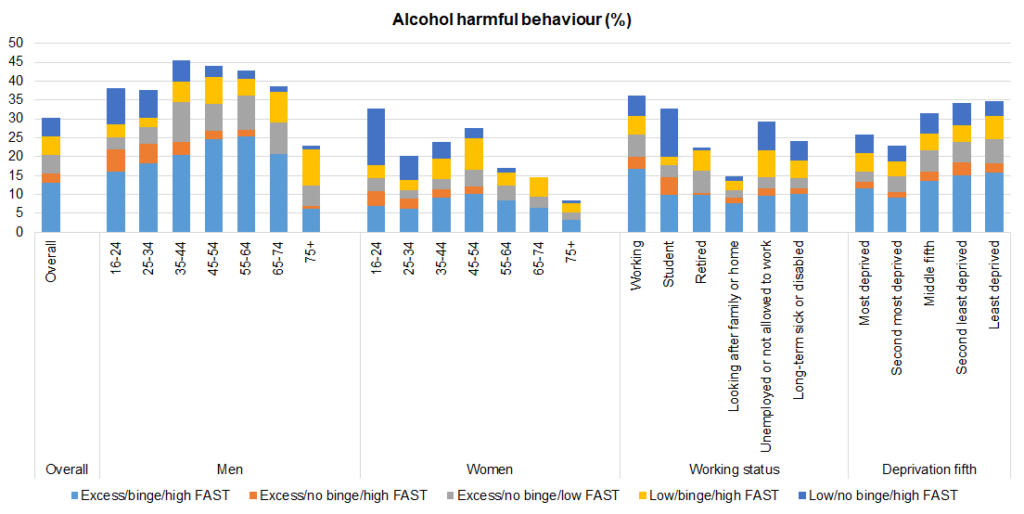
It was also possible to examine the different types of harmful behaviour in more detail (percentages might differ slightly from those quoted above as some people did not answer all the questions so the number of survey responders included differ slightly). Overall, 23% never drank alcohol, 27% had not exceeded the 14 units the previous week, did not binge drink weekly and had a low FAST score (<3), 4.8% had not exceeded the 14 units the previous week and did not binge drink weekly but had a high FAST score (3+), 4.9% had not exceeded the 14 units the previous week, but did binge drink weekly and also had a high FAST score, 4.9% had exceeded 14 units in the previous week but did not usual binge drink weekly and also had a low FAST score, 2.9% had exceeded 14 units in the previous week, did not usually binge drink weekly but had a high FAST score, and 13.2% had exceeded the 14 units the previous week, did binge drink weekly and had a high FAST score.
However, the pattern of these behaviours did differ slightly among the different groups of individuals. The most common harmful behaviour was generally having all three harmful alcohol behaviours, although for young people aged 16-24 years and students, they were more likely to just have a high FAST score. Overall, 16.0% of all those with harmful alcohol behaviours had a high FAST score only (13.2% out of 30.2%) so not exceeding the weekly units or regularly binge drinking, but this was 25.2% and 45.9% for men and women respectively aged 16-24 years, and 38.9% for students. Thus if the survey had just examined weekly consumption of alcohol and regular binge drinking, these young people would not have been classified as having harmful alcohol behaviours yet they would have achieved a threshold of further investigation if they had completed the Fast Alcohol Screening Test in an emergency setting.
Hospital Admissions due to Alcoholic Liver Disease
For alcoholic liver disease, the hospital admission rate in Hull is more than double the rate for England for 2022/23. It is almost triple the rate among men, and not quite double the rate for women. The rate is statistically significantly higher in Hull compared to England for men, but not for women.
Further information, including trends over time, are illustrated in Liver Disease within Health Factors under Adults.
Compared with benchmark
| Indicator | Period | England | Yorkshire and the Humber region (statistical) | Kingston upon Hull | East Riding of Yorkshire | North East Lincolnshire | North Lincolnshire | York | North Yorkshire UA | Barnsley | Doncaster | Rotherham | Sheffield | Bradford | Calderdale | Kirklees | Leeds | Wakefield |
|---|---|---|---|---|---|---|---|---|---|---|---|---|---|---|---|---|---|---|
Hospital admission rate for alcoholic liver disease (Persons All ages) | 2022/23 | 49.4 | 60.8 | 123.7 | 52.1 | 39.7 | 34.9 | 37.9 | 42.5 | 57.2 | 77.9 | 41.1 | 45.8 | 58.6 | 116.4 | 56.1 | 84.7 | 47.7 |
Hospital admission rate for alcoholic liver disease (Male All ages) | 2022/23 | 67.7 | 83.0 | 189.7 | 84.9 | 53.6 | 50.5 | 49.6 | 62.7 | 79.8 | 96.6 | 54.0 | 56.7 | 84.0 | 146.3 | 84.1 | 109.0 | 53.8 |
Hospital admission rate for alcoholic liver disease (Female All ages) | 2022/23 | 32.1 | 39.5 | 58.2 | 21.1 | 26.4 | 20.1 | 26.9 | 23.7 | 35.2 | 59.2 | 28.5 | 35.5 | 34.2 | 88.3 | 29.0 | 62.4 | 41.8 |
Deaths from Alcoholic Liver Disease
The premature mortality rate from alcoholic liver disease was significantly higher in Hull compared to England for men for deaths registered during 2022-24 (35% higher in Hull), but mortality rates were comparable for women.
Further information, including trends over time, are illustrated in Liver Disease within Health Factors under Adults.
Compared with benchmark
| Indicator | Period | England | Yorkshire and the Humber region (statistical) | Kingston upon Hull | East Riding of Yorkshire | North East Lincolnshire | North Lincolnshire | York | North Yorkshire UA | Barnsley | Doncaster | Rotherham | Sheffield | Bradford | Calderdale | Kirklees | Leeds | Wakefield |
|---|---|---|---|---|---|---|---|---|---|---|---|---|---|---|---|---|---|---|
Under 75 mortality rate from alcoholic liver disease (Persons <75 yrs) | 2022 - 24 | 11.4 | 12.7 | 14.4 | 7.5 | 16.3 | 15.8 | 12.7 | 9.8 | 15.5 | 14.9 | 11.2 | 13.8 | 13.8 | 14.4 | 12.9 | 11.9 | 14.5 |
Under 75 mortality rate from alcoholic liver disease (Male <75 yrs) | 2022 - 24 | 15.1 | 15.9 | 20.4 | 10.0 | 21.7 | 21.2 | 17.6 | 12.0 | 21.8 | 18.6 | 14.6 | 16.9 | 17.8 | 16.8 | 14.7 | 14.0 | 16.6 |
Under 75 mortality rate from alcoholic liver disease (Female <75 yrs) | 2022 - 24 | 7.9 | 9.6 | 8.3 | 5.2 | 11.0 | 10.5 | 8.0 | 7.7 | 9.3 | 11.3 | 8.0 | 10.8 | 10.0 | 12.1 | 11.2 | 9.9 | 12.4 |
Modelled Admissions and Deaths Attributable to Alcohol
On the Office for Health Improvement & Disparities’ Fingertips tool, information is provided on a number of indicators relating to alcohol. They estimate the number of admissions due to alcohol which are based on modelled estimates using Alcohol Attributable Fractions (AAFs).
Much more detailed information on AAFs, including examples, is given within the Glossary. However, in brief, each admission or death is assigned a primary diagnosis code and sometimes secondary diagnosis code(s) too based on the International Classification of Diseases (ICD). The secondary codes can relate to other diseases or medical conditions which are influential or affect treatment, but also can relate to an external cause such as a traffic accident, fall or injury. Each ICD diagnosis code has been assigned an AAF value of between 0 and 1 through vigorous research. The AAF is assigned a value of zero for ICD diagnoses codes where there is no evidence that alcohol is an influencing factor, one for wholly attributable conditions such as alcoholic liver disease, alcohol dependence or alcohol poisoning, and a value between these for other conditions where alcohol is a factor. For instance, the AAF would be 0.16 if it is evidenced that 16% of the time alcohol is a cause of that disease or medical condition, or alcohol is a factor 16% of the time for that external cause. Different AAF values are assigned on the basis of the gender and age group of the individual admitted to hospital or who has died (see Alcohol Attributable Fractions for more information). In most cases, the AAF values assigned to a hospital admission and a death are the same for the same ICD code, gender and age group, but in some cases they do differ particularly the external causes. In the case of external causes, the AAF value is generally higher for deaths than it is for admissions and around twice as high for deaths.
See Alcohol Specific Admissions and Deaths for the full list of diseases and conditions that fall under the alcohol-specific or wholly attributable to alcohol definition used by the Office for Health Improvement & Disparities.
The Office for Health Improvement & Disparities use three main types of alcohol admission rates within their Local Alcohol Profiles: alcohol-specific, their narrow measure, and their broad measure. The former two are the most commonly used.
- The alcohol-specific measures only includes admissions where any of the primary or secondary diagnoses codes are entirely due to alcohol, that is, a condition wholly attributable to alcohol (AAF has the value of one).
- The narrow definition of alcohol admissions considers all primary diagnoses codes and all secondary external diagnoses codes (such as those relating to traffic accidents, injuries and falls).
- The broad definition of alcohol admissions considers all primary and secondary diagnosis codes (so the same as the narrow measure but additionally any other diseases and medical conditions recorded under secondary diagnosis codes).
For each admission, the maximum AAF is calculated over all the diagnoses codes considered for that measure (in many cases the maximum AAF for a single admission will be zero). These AAFs are then summed over all admissions over a specified period to give an estimate of the total number of alcohol-related or alcohol-specific admissions for that specific period. It is then possible to divide this by the population to produce a rate. However, in most cases, the admission and mortality rates are given as directly standardised rates per 100,000 population standardised to the European Standard Population (see Directly Standardised Rates for more information about standardisation).
The rates are generally give as the number of admissions within a financial year, and it is possible that some of the same people were admitted more than once during the year.
Modelled Admissions Attributable to Alcohol
Alcohol-Specific Admissions / Admissions Wholly Attributable to Alcohol
The alcohol-specific number of admissions for Hull is high in 2023/24, being 53% higher than England. The rates in Hull are among the third highest for men and highest for women across the Yorkshire and Humber region.
Compared with benchmark
| Indicator | Period | England | Yorkshire and the Humber region (statistical) | Kingston upon Hull | East Riding of Yorkshire | North East Lincolnshire | North Lincolnshire | York | North Yorkshire UA | Barnsley | Doncaster | Rotherham | Sheffield | Bradford | Calderdale | Kirklees | Leeds | Wakefield |
|---|---|---|---|---|---|---|---|---|---|---|---|---|---|---|---|---|---|---|
Admission episodes for alcohol-specific conditions (Persons All ages) | 2023/24 | 612 | 640 | 939 | 507 | 702 | 600 | 809 | 565 | 939 | 631 | 910 | 635 | 565 | 607 | 570 | 596 | 550 |
Admission episodes for alcohol-specific conditions (Male All ages) | 2023/24 | 868 | 884 | 1250 | 689 | 1068 | 883 | 1141 | 760 | 1313 | 843 | 1267 | 870 | 799 | 847 | 804 | 808 | 755 |
Admission episodes for alcohol-specific conditions (Female All ages) | 2023/24 | 373 | 409 | 636 | 337 | 359 | 333 | 496 | 385 | 582 | 426 | 571 | 408 | 345 | 384 | 348 | 399 | 354 |
During the year 2023/24, there were 2,325 admissions to hospital for alcohol-specific conditions.
The rate of admissions in Hull for conditions wholly attributable to alcohol has remained relatively constant between 2016/17 and 2022/23 with generally just over 800 admissions per 100,000 population, although the rate did decrease slightly between 2016/17 and 2019/20 from 857 to 783 admissions per 100,000 population before increasing again to around 825 admissions per 100,000 population for 2021/22 and 2022/23. However, there has been a relatively sharp increase in the last year to a new high of 939 admissions per 100,000 population for 2023/24.
Compared with benchmark
Admission episodes for alcohol-specific conditions (Persons All ages)
|
Period
|
Kingston upon Hull |
Yorkshire and the Humber region (statistical)
|
England
|
||||
|---|---|---|---|---|---|---|---|
|
Count
|
Value
|
95%
Lower CI |
95%
Upper CI |
||||
| 2016/17 | • | 2140 | 857 | 820 | 894 | 589 | 558 |
| 2017/18 | • | 2142 | 862 | 826 | 900 | 603 | 565 |
| 2018/19 | • | 2118 | 855 | 819 | 893 | 649 | 621 |
| 2019/20 | • | 1959 | 783 | 748 | 819 | 638 | 639 |
| 2020/21 | • | 1982 | 810 | 775 | 847 | 589 | 582 |
| 2021/22 | • | 2018 | 826 | 790 | 863 | 644 | 626 |
| 2022/23 | • | 2029 | 825 | 789 | 862 | 609 | 581 |
| 2023/24 | • | 2325 | 939 | 901 | 979 | 640 | 612 |
Source: OHID, based on NHS England and Office for National Statistics data
For men, there was a similar pattern with the admission rate with the highest admission rate for the most recent year 2023/24.
For men during the year 2023/24, there were 1,530 admissions to hospital for alcohol-specific conditions.
Compared with benchmark
Admission episodes for alcohol-specific conditions (Male All ages)
|
Period
|
Kingston upon Hull |
Yorkshire and the Humber region (statistical)
|
England
|
||||
|---|---|---|---|---|---|---|---|
|
Count
|
Value
|
95%
Lower CI |
95%
Upper CI |
||||
| 2016/17 | • | 1482 | 1199 | 1137 | 1263 | 812 | 782 |
| 2017/18 | • | 1487 | 1196 | 1135 | 1260 | 830 | 790 |
| 2018/19 | • | 1449 | 1178 | 1117 | 1241 | 890 | 868 |
| 2019/20 | • | 1341 | 1074 | 1016 | 1134 | 873 | 893 |
| 2020/21 | • | 1315 | 1080 | 1022 | 1141 | 811 | 808 |
| 2021/22 | • | 1374 | 1132 | 1072 | 1194 | 890 | 879 |
| 2022/23 | • | 1416 | 1154 | 1094 | 1216 | 854 | 823 |
| 2023/24 | • | 1530 | 1250 | 1187 | 1315 | 884 | 868 |
Source: OHID, based on NHS England and Office for National Statistics data
For women, the rate ranged between 495 and 546 admissions per 100,000 population between 2016/17 and 2022/23, but there has been a substantial increase in the admission rate between 2022/23 to 2023/24 increasing by 28% from 497 to 636 admissions per 100,000 population.
For women during the year 2023/24, there were 795 admissions to hospital for alcohol-specific conditions which is an increase of 182 admissions since last year.
Whilst women account for fewer admissions overall compared to men (34% women and 66% men), women account for a greater percentage of the increase in the admission rate in the last year (61% women and 39% men).
Compared with benchmark
Admission episodes for alcohol-specific conditions (Female All ages)
|
Period
|
Kingston upon Hull |
Yorkshire and the Humber region (statistical)
|
England
|
||||
|---|---|---|---|---|---|---|---|
|
Count
|
Value
|
95%
Lower CI |
95%
Upper CI |
||||
| 2016/17 | • | 658 | 520 | 480 | 561 | 377 | 348 |
| 2017/18 | • | 655 | 529 | 489 | 572 | 387 | 354 |
| 2018/19 | • | 669 | 532 | 492 | 574 | 420 | 389 |
| 2019/20 | • | 618 | 495 | 456 | 536 | 417 | 401 |
| 2020/21 | • | 667 | 546 | 505 | 589 | 380 | 372 |
| 2021/22 | • | 644 | 526 | 486 | 569 | 412 | 390 |
| 2022/23 | • | 613 | 497 | 458 | 539 | 378 | 355 |
| 2023/24 | • | 795 | 636 | 592 | 682 | 409 | 373 |
Source: OHID, based on NHS England and Office for National Statistics data
Fingertips also gives the admission rate for alcohol-specific conditions among the under 18s. The rates are not age-standardised but are given as the estimated number of alcohol-related admissions per 100,000 population. Further information relating to Alcohol Consumption Among Young People is given under Lifestyle Factors within Children and Young People.
The admission rate for alcohol-specific conditions among the under 18s for both males and females in Hull for the three year period 2021/22 to 2023/24 is comparable to England.
For adults, the admission rates for alcohol-specific conditions are significantly higher for men compared to women generally around twice as high among men. However, the pattern is the reverse for under 18s with more women admitted to hospital for alcohol-specific conditions. This is not unique to Hull as the admission rates are higher among women compared to men for most local authorities (not York or Bradford) across the region for 2021/22-2023/24, although for Hull the difference in the admission rates for men and women is small compared to some local authorities within the region.
Compared with benchmark
| Indicator | Period | England | Yorkshire and the Humber region (statistical) | Kingston upon Hull | East Riding of Yorkshire | North East Lincolnshire | North Lincolnshire | York | North Yorkshire UA | Barnsley | Doncaster | Rotherham | Sheffield | Bradford | Calderdale | Kirklees | Leeds | Wakefield |
|---|---|---|---|---|---|---|---|---|---|---|---|---|---|---|---|---|---|---|
Admission episodes for alcohol-specific conditions (under 18 years) (Persons <18 yrs) | 2021/22 - 23/24 | 22.6 | 19.0 | 18.3 | 14.6 | 27.2 | 14.6 | 29.9 | 25.7 | 32.9 | 14.8 | 17.5 | 25.6 | 15.4 | 23.7 | 11.5 | 12.2 | 21.0 |
Admission episodes for alcohol-specific conditions (under 18 years) (Male <18 yrs) | 2021/22 - 23/24 | 15.4 | 14.6 | 16.3 | 13.5 | 23.5 | - | 37.8 | 19.8 | 16.7 | - | 13.7 | 16.7 | 15.9 | 14.5 | 7.9 | 7.5 | 17.4 |
Admission episodes for alcohol-specific conditions (under 18 years) (Female <18 yrs) | 2021/22 - 23/24 | 30.0 | 23.5 | 20.5 | 15.7 | 31.0 | - | 21.6 | 31.9 | 49.9 | 22.1 | 21.5 | 34.9 | 14.9 | 33.4 | 15.3 | 17.1 | 24.8 |
For males and females combined, the rate in Hull was statistically significantly higher than England between the period 2015/16-2017/18 and 2018/19-2020/21, but the rate has decreased substantially in Hull and has been comparable to England in the last three years.
Over the three year period, there were 33 alcohol-specific admissions in Hull so an average of just over 11 per year.
Compared with benchmark
Admission episodes for alcohol-specific conditions (under 18 years) (Persons <18 yrs)
|
Period
|
Kingston upon Hull |
Yorkshire and the Humber region (statistical)
|
England
|
||||
|---|---|---|---|---|---|---|---|
|
Count
|
Value
|
95%
Lower CI |
95%
Upper CI |
||||
| 2012/13 - 14/15 | • | 75 | 44.9 | 35.3 | 56.3 | 37.2 | 39.2 |
| 2013/14 - 15/16 | • | 60 | 35.6 | 26.2 | 44.5 | 35.9 | 37.6 |
| 2014/15 - 16/17 | • | 65 | 38.3 | 29.0 | 48.1 | 33.5 | 34.4 |
| 2015/16 - 17/18 | • | 80 | 46.7 | 36.5 | 57.4 | 33.7 | 33.2 |
| 2016/17 - 18/19 | • | 105 | 60.6 | 49.1 | 72.7 | 32.6 | 32.0 |
| 2017/18 - 19/20 | • | 100 | 57.2 | 45.5 | 68.3 | 30.6 | 31.2 |
| 2018/19 - 20/21 | • | 70 | 39.7 | 32.0 | 51.5 | 27.7 | 29.9 |
| 2019/20 - 21/22 | • | 50 | 28.2 | 21.0 | 37.2 | 23.8 | 28.8 |
| 2020/21 - 22/23 | • | 34 | 19.1 | 13.2 | 26.7 | 21.5 | 26.1 |
| 2021/22 - 23/24 | • | 33 | 18.3 | 12.6 | 25.7 | 19.0 | 22.6 |
Source: OHID, based on NHS England and Office for National Statistics data
The pattern among men follows a similar pattern to that observed for males and females combined.
For males aged under 18 years over the three year period, there were 15 alcohol-specific admissions in Hull so an average of around five per year.
Compared with benchmark
Admission episodes for alcohol-specific conditions (under 18 years) (Male <18 yrs)
|
Period
|
Kingston upon Hull |
Yorkshire and the Humber region (statistical)
|
England
|
||||
|---|---|---|---|---|---|---|---|
|
Count
|
Value
|
95%
Lower CI |
95%
Upper CI |
||||
| 2012/13 - 14/15 | • | 40 | 46.5 | 31.2 | 60.6 | 33.7 | 30.6 |
| 2013/14 - 15/16 | • | 30 | 34.6 | 24.3 | 50.7 | 31.0 | 29.5 |
| 2014/15 - 16/17 | • | 35 | 40.0 | 26.9 | 54.2 | 29.2 | 27.6 |
| 2015/16 - 17/18 | • | 45 | 50.9 | 38.1 | 69.4 | 28.5 | 26.7 |
| 2016/17 - 18/19 | • | 60 | 67.2 | 50.3 | 85.2 | 28.1 | 26.2 |
| 2017/18 - 19/20 | • | 60 | 66.6 | 52.8 | 88.3 | 26.6 | 25.3 |
| 2018/19 - 20/21 | • | 45 | 49.7 | 34.4 | 64.0 | 23.8 | 23.3 |
| 2019/20 - 21/22 | • | 30 | 33.0 | 22.3 | 47.1 | 19.3 | 20.7 |
| 2020/21 - 22/23 | • | 17 | 18.6 | 10.8 | 29.8 | 16.2 | 17.8 |
| 2021/22 - 23/24 | • | 15 | 16.3 | 9.1 | 26.9 | 14.6 | 15.4 |
Source: OHID, based on NHS England and Office for National Statistics data
Whilst the pattern for females followed a reasonably similar pattern as for males and females combined with a peak for 2014/16-2017/18, the relative difference with England was different. The admission rate in Hull was only statistically significantly for one period in Hull (2014/16-2017/18), and was statistically significantly lower than England for two of the last three periods (although comparable in the last period 2021/22-2023/24).
For females aged under 18 years over the three year period, there were 18 alcohol-specific admissions in Hull so an average of around six per year.
Compared with benchmark
Admission episodes for alcohol-specific conditions (under 18 years) (Female <18 yrs)
|
Period
|
Kingston upon Hull |
Yorkshire and the Humber region (statistical)
|
England
|
||||
|---|---|---|---|---|---|---|---|
|
Count
|
Value
|
95%
Lower CI |
95%
Upper CI |
||||
| 2012/13 - 14/15 | • | 35 | 43.3 | 32.2 | 63.0 | 40.8 | 48.2 |
| 2013/14 - 15/16 | • | 25 | 30.6 | 21.8 | 48.1 | 41.1 | 46.0 |
| 2014/15 - 16/17 | • | 30 | 36.5 | 24.6 | 52.0 | 38.3 | 41.6 |
| 2015/16 - 17/18 | • | 35 | 42.1 | 27.4 | 55.8 | 39.1 | 40.0 |
| 2016/17 - 18/19 | • | 45 | 53.6 | 39.1 | 71.7 | 37.0 | 38.0 |
| 2017/18 - 19/20 | • | 35 | 41.3 | 29.7 | 58.8 | 34.8 | 37.3 |
| 2018/19 - 20/21 | • | 30 | 35.0 | 22.7 | 48.6 | 31.8 | 36.9 |
| 2019/20 - 21/22 | • | 20 | 23.2 | 14.2 | 35.9 | 28.9 | 37.2 |
| 2020/21 - 22/23 | • | 17 | 19.6 | 11.4 | 31.4 | 27.0 | 34.7 |
| 2021/22 - 23/24 | • | 18 | 20.5 | 12.1 | 32.4 | 23.5 | 30.0 |
Source: OHID, based on NHS England and Office for National Statistics data
Alcohol-Related Admissions (Narrow Measure)
Hull has a much higher rate of alcohol-related admissions using the narrow measure compared to England (38% higher for 2023/24). The rates in Hull are the highest across Yorkshire and Humber for men, and the fourth highest for women.
In Hull, there were 694 alcohol-related admissions (using the narrow measure) during 2023/24 per 100,000 population (930 for men and 471 for women per 100,000 population).
Compared with benchmark
| Indicator | Period | England | Yorkshire and the Humber region (statistical) | Kingston upon Hull | East Riding of Yorkshire | North East Lincolnshire | North Lincolnshire | York | North Yorkshire UA | Barnsley | Doncaster | Rotherham | Sheffield | Bradford | Calderdale | Kirklees | Leeds | Wakefield |
|---|---|---|---|---|---|---|---|---|---|---|---|---|---|---|---|---|---|---|
Admission episodes for alcohol-related conditions (Narrow) (Persons All ages) | 2023/24 | 504 | 548 | 694 | 504 | 624 | 525 | 518 | 527 | 684 | 651 | 655 | 630 | 511 | 494 | 499 | 444 | 524 |
Admission episodes for alcohol-related conditions (Narrow) (Male All ages) | 2023/24 | 686 | 723 | 930 | 657 | 845 | 727 | 782 | 627 | 905 | 828 | 820 | 809 | 670 | 673 | 688 | 620 | 704 |
Admission episodes for alcohol-related conditions (Narrow) (Female All ages) | 2023/24 | 340 | 390 | 471 | 366 | 423 | 336 | 285 | 438 | 480 | 490 | 505 | 466 | 366 | 335 | 329 | 285 | 360 |
Using this modelling and the narrow measure, there were an estimated 1,697 alcohol-related admissions for alcohol in Hull in 2023/24 (1,109 for men and 587 for women).
There has been an 11% increase in the modelled admission rate in Hull over the last year from 2022/23 to 2023/24 (6% increase in England and 8% increase across the region). The rate for 2023/24 is the highest it has been since 2016/17.
Compared with benchmark
Admission episodes for alcohol-related conditions (Narrow) (Persons All ages)
|
Period
|
Kingston upon Hull |
Yorkshire and the Humber region (statistical)
|
England
|
||||
|---|---|---|---|---|---|---|---|
|
Count
|
Value
|
95%
Lower CI |
95%
Upper CI |
||||
| 2016/17 | • | 1570 | 653 | 621 | 687 | 541 | 492 |
| 2017/18 | • | 1624 | 674 | 641 | 708 | 539 | 488 |
| 2018/19 | • | 1661 | 684 | 651 | 718 | 565 | 512 |
| 2019/20 | • | 1562 | 639 | 608 | 672 | 561 | 518 |
| 2020/21 | • | 1522 | 624 | 592 | 656 | 490 | 456 |
| 2021/22 | • | 1502 | 620 | 589 | 652 | 533 | 494 |
| 2022/23 | • | 1509 | 625 | 593 | 657 | 508 | 475 |
| 2023/24 | • | 1697 | 694 | 661 | 728 | 548 | 504 |
Source: OHID, based on NHS England and Office for National Statistics data
Among men, whilst the latest rate for 2023/24 is slightly lower than the peak in 2017/18, the rate has ben increasing since the low of 2020/21. It is likely that this relatively low admission rate for Hull for 2020/21 is associated with the COVID-19 pandemic as there were fewer hospital admissions in general during 2020/21, although the rate for 2019/20 and 2021/22 is also relatively low. The lockdowns for the pandemic commenced at the end of March 2020 so it is not expected that the rate for 2019/20 will be affected very much by the pandemic.
Compared with benchmark
Admission episodes for alcohol-related conditions (Narrow) (Male All ages)
|
Period
|
Kingston upon Hull |
Yorkshire and the Humber region (statistical)
|
England
|
||||
|---|---|---|---|---|---|---|---|
|
Count
|
Value
|
95%
Lower CI |
95%
Upper CI |
||||
| 2016/17 | • | 1064 | 914 | 858 | 972 | 711 | 663 |
| 2017/18 | • | 1125 | 962 | 905 | 1021 | 711 | 655 |
| 2018/19 | • | 1125 | 947 | 891 | 1005 | 741 | 689 |
| 2019/20 | • | 1008 | 848 | 795 | 903 | 734 | 697 |
| 2020/21 | • | 983 | 820 | 769 | 874 | 641 | 607 |
| 2021/22 | • | 1001 | 847 | 795 | 902 | 700 | 664 |
| 2022/23 | • | 1059 | 896 | 842 | 952 | 670 | 639 |
| 2023/24 | • | 1109 | 930 | 875 | 987 | 723 | 686 |
Source: OHID, based on NHS England and Office for National Statistics data
Among women, the modelled admission rate for alcohol-related conditions does not appear to be have been impacted during the pandemic with 2020/21 having a relatively high rate. Whilst the rate decreased from the high in 2019/20 with 446 admissions per 100,000 population to a new low in 2022/23 of 370 admissions per 100,000 population, the rate has substantially increased in the last year to 471 admissions per 100,000 populations which is the highest since 2016/17.
Compared with benchmark
Admission episodes for alcohol-related conditions (Narrow) (Female All ages)
|
Period
|
Kingston upon Hull |
Yorkshire and the Humber region (statistical)
|
England
|
||||
|---|---|---|---|---|---|---|---|
|
Count
|
Value
|
95%
Lower CI |
95%
Upper CI |
||||
| 2016/17 | • | 505 | 411 | 376 | 449 | 389 | 338 |
| 2017/18 | • | 499 | 404 | 369 | 442 | 385 | 337 |
| 2018/19 | • | 535 | 433 | 397 | 472 | 406 | 351 |
| 2019/20 | • | 553 | 446 | 410 | 486 | 404 | 356 |
| 2020/21 | • | 539 | 437 | 401 | 476 | 353 | 319 |
| 2021/22 | • | 500 | 407 | 372 | 445 | 381 | 341 |
| 2022/23 | • | 449 | 370 | 336 | 406 | 362 | 326 |
| 2023/24 | • | 587 | 471 | 433 | 511 | 390 | 340 |
Source: OHID, based on NHS England and Office for National Statistics data
Alcohol-Related Admissions (Broad Measure)
Using the broad measure for hospital admissions, the rate in Hull is also much higher than England, and among the highest across Yorkshire and Humber for 2023/24.
Compared with benchmark
| Indicator | Period | England | Yorkshire and the Humber region (statistical) | Kingston upon Hull | East Riding of Yorkshire | North East Lincolnshire | North Lincolnshire | York | North Yorkshire UA | Barnsley | Doncaster | Rotherham | Sheffield | Bradford | Calderdale | Kirklees | Leeds | Wakefield |
|---|---|---|---|---|---|---|---|---|---|---|---|---|---|---|---|---|---|---|
Admission episodes for alcohol-related conditions (Broad) (Persons All ages) | 2023/24 | 1824 | 1882 | 2357 | 1716 | 2077 | 1896 | 2142 | 1840 | 2606 | 2040 | 2288 | 1901 | 1926 | 1832 | 1739 | 1456 | 1632 |
Admission episodes for alcohol-related conditions (Broad) (Male All ages) | 2023/24 | 2837 | 2870 | 3474 | 2610 | 3256 | 2953 | 3401 | 2750 | 3948 | 3069 | 3347 | 2822 | 2972 | 2854 | 2732 | 2266 | 2496 |
Admission episodes for alcohol-related conditions (Broad) (Female All ages) | 2023/24 | 935 | 1010 | 1334 | 925 | 1017 | 943 | 1063 | 1039 | 1406 | 1123 | 1339 | 1090 | 1010 | 946 | 872 | 754 | 871 |
For men and women combined, the broad alcohol-related measure of hospital admissions decreased between 2016/17 and 2019/20 from 2,335 to 2,096 admissions per 100,000 population. There was a further decrease in 2020/21 to a low of 1,826 admissions per 100,000 population although it is likely that this is associated with a lower rate of hospital admissions for all conditions during the COVID-19 pandemic. The rate in Hull has increased each year subsequently to a new high of 2,357 admissions per 100,000 population in 2023/24.
Throughout the entire period 2016/17 to 2023/24, the admission rate for alcohol-related conditions (broad measure) has been statistically significantly higher than England.
There were an estimated 5,626 admissions in Hull that were alcohol-related based on this broad measure during 2023/24, although it is possible that the broader measure over-estimates the impact of alcohol on admissions.
Compared with benchmark
Admission episodes for alcohol-related conditions (Broad) (Persons All ages)
|
Period
|
Kingston upon Hull |
Yorkshire and the Humber region (statistical)
|
England
|
||||
|---|---|---|---|---|---|---|---|
|
Count
|
Value
|
95%
Lower CI |
95%
Upper CI |
||||
| 2016/17 | • | 5343 | 2335 | 2271 | 2399 | 1759 | 1625 |
| 2017/18 | • | 5294 | 2302 | 2239 | 2365 | 1772 | 1659 |
| 2018/19 | • | 5129 | 2208 | 2147 | 2270 | 1836 | 1768 |
| 2019/20 | • | 4915 | 2096 | 2037 | 2156 | 1834 | 1818 |
| 2020/21 | • | 4288 | 1826 | 1771 | 1882 | 1517 | 1504 |
| 2021/22 | • | 4697 | 1995 | 1938 | 2053 | 1760 | 1734 |
| 2022/23 | • | 5052 | 2135 | 2076 | 2195 | 1778 | 1705 |
| 2023/24 | • | 5626 | 2357 | 2295 | 2420 | 1882 | 1824 |
Source: OHID, based on NHS England and Office for National Statistics data
For men in Hull, the broad alcohol-related measure of hospital admissions decreased between 2016/17 and 2019/20 from 3,889 to 3,008 admissions per 100,000 population before increasing to 3,474 admissions per 100,000 population for 2023/24. Whilst the modelled rate has increased each year in Hull since the low of 2020/21, the latest rate is similar to or lower than pre-pandemic levels.
Among Hull men, there were an estimated 3,985 admissions in Hull that were alcohol-related based on this broad measure during 2023/24.
Compared with benchmark
Admission episodes for alcohol-related conditions (Broad) (Male All ages)
|
Period
|
Kingston upon Hull |
Yorkshire and the Humber region (statistical)
|
England
|
||||
|---|---|---|---|---|---|---|---|
|
Count
|
Value
|
95%
Lower CI |
95%
Upper CI |
||||
| 2016/17 | • | 3889 | 3605 | 3489 | 3724 | 2718 | 2534 |
| 2017/18 | • | 3877 | 3552 | 3438 | 3669 | 2731 | 2585 |
| 2018/19 | • | 3693 | 3340 | 3231 | 3453 | 2812 | 2752 |
| 2019/20 | • | 3480 | 3121 | 3015 | 3229 | 2800 | 2826 |
| 2020/21 | • | 3008 | 2671 | 2574 | 2771 | 2300 | 2309 |
| 2021/22 | • | 3369 | 2988 | 2886 | 3093 | 2678 | 2682 |
| 2022/23 | • | 3681 | 3239 | 3133 | 3347 | 2727 | 2646 |
| 2023/24 | • | 3985 | 3474 | 3365 | 3585 | 2870 | 2837 |
Source: OHID, based on NHS England and Office for National Statistics data
A reasonably similar pattern occurred for women although both the decrease between 2016/17 and 2020/21 and the increase between 2020/21 and 2022/23 was smaller than it was for Hull males. However, the increase in the last year has been much greater among Hull women compared to Hull men. Furthermore, the latest rate for 2023/24 is the highest it has been since 2016/17.
Among Hull women, there were an estimated 1,640 admissions in Hull that were alcohol-related based on this broad measure during 2023/24.
Compared with benchmark
Admission episodes for alcohol-related conditions (Broad) (Female All ages)
|
Period
|
Kingston upon Hull |
Yorkshire and the Humber region (statistical)
|
England
|
||||
|---|---|---|---|---|---|---|---|
|
Count
|
Value
|
95%
Lower CI |
95%
Upper CI |
||||
| 2016/17 | • | 1453 | 1205 | 1143 | 1269 | 932 | 837 |
| 2017/18 | • | 1416 | 1180 | 1119 | 1244 | 941 | 855 |
| 2018/19 | • | 1435 | 1182 | 1121 | 1246 | 986 | 911 |
| 2019/20 | • | 1435 | 1180 | 1119 | 1243 | 991 | 938 |
| 2020/21 | • | 1280 | 1059 | 1001 | 1119 | 831 | 801 |
| 2021/22 | • | 1328 | 1094 | 1035 | 1154 | 955 | 906 |
| 2022/23 | • | 1370 | 1126 | 1067 | 1187 | 943 | 881 |
| 2023/24 | • | 1640 | 1334 | 1270 | 1400 | 1010 | 935 |
Source: OHID, based on NHS England and Office for National Statistics data
Modelled Deaths Attributable to Alcohol
Fingertips also provides information on alcohol-specific and alcohol-related mortality using the Alcohol Attributable Fractions.
The alcohol-specific mortality counts all deaths where the underlying cause or any of the secondary causes of death are a wholly alcohol attributable condition such as alcoholic myopathy, alcoholic cardiomyopathy, alcoholic liver disease, alcohol-induced chronic pancreatitis, ethanol poisoning, etc. A full list of conditions is given under Alcohol Specific Admissions and Deaths.
The alcohol-related mortality counts all the alcohol-specific deaths but also sums the AAF values for all the other deaths based on the diagnosis code related to the underlying cause of death. Further information relating to the definition of alcohol-related mortality can be found under Alcohol Attributable Fractions.
These mortality rates are also age-standardised and presented as the estimated number of alcohol-specific or alcohol-related deaths per 100,000 population (see Directly Standardised Rates for more information about standardisation).
Alcohol-Specific Deaths / Deaths Wholly Attributable to Alcohol
The alcohol-specific mortality rate in Hull during 2024 was 16% higher than England although the difference between Hull and England was not statistically significant.
Compared with benchmark
| Indicator | Period | England | Yorkshire and the Humber region (statistical) | Kingston upon Hull | East Riding of Yorkshire | North East Lincolnshire | North Lincolnshire | York | North Yorkshire UA | Barnsley | Doncaster | Rotherham | Sheffield | Bradford | Calderdale | Kirklees | Leeds | Wakefield |
|---|---|---|---|---|---|---|---|---|---|---|---|---|---|---|---|---|---|---|
Alcohol-specific mortality (Persons All ages) | 2024 | 13.8 | 15.5 | 16.1 | 10.1 | 21.0 | 19.3 | 11.4 | 13.0 | 16.6 | 19.9 | 14.6 | 17.8 | 14.4 | 13.2 | 16.3 | 15.8 | 18.3 |
The alcohol-specific mortality rate has been quite variable in Hull between 2006 and 2018, but since 2018, there has been a consistent increasing trend in the mortality rate with the rate almost doubling from 11.4 to 20.3 deaths per 100,000 population between 2018 and 2022, although the rate has decreased in the last two years, to 16.1 deaths per 100,000 population for 2024.
Since 2019, the mortality rate across England and the region has also showed an increase, decreasing for the region in the past two years and for England in the last year..
There were 40 deaths among Hull residents in 2024 due to alcohol-specific conditions.
Compared with benchmark
Alcohol-specific mortality (Persons All ages)
|
Period
|
Kingston upon Hull |
Yorkshire and the Humber region (statistical)
|
England
|
||||
|---|---|---|---|---|---|---|---|
|
Count
|
Value
|
95%
Lower CI |
95%
Upper CI |
||||
| 2006 | • | 25 | 12.0 | 7.7 | 17.7 | 11.8 | 10.7 |
| 2007 | • | 27 | 12.0 | 7.9 | 17.5 | 11.1 | 10.8 |
| 2008 | • | 25 | 11.0 | 7.1 | 16.2 | 11.3 | 11.3 |
| 2009 | • | 40 | 17.9 | 12.8 | 24.3 | 11.2 | 10.6 |
| 2010 | • | 29 | 12.9 | 8.6 | 18.5 | 11.2 | 10.8 |
| 2011 | • | 27 | 11.6 | 7.6 | 16.9 | 12.3 | 10.9 |
| 2012 | • | 30 | 12.7 | 8.6 | 18.2 | 11.2 | 10.0 |
| 2013 | • | 29 | 12.1 | 8.1 | 17.4 | 11.9 | 10.2 |
| 2014 | • | 34 | 14.8 | 10.2 | 20.7 | 11.3 | 10.5 |
| 2015 | • | 32 | 13.8 | 9.4 | 19.5 | 11.4 | 10.3 |
| 2016 | • | 36 | 14.9 | 10.4 | 20.6 | 11.9 | 10.5 |
| 2017 | • | 39 | 16.1 | 11.4 | 22.0 | 13.6 | 11.1 |
| 2018 | • | 28 | 11.4 | 7.6 | 16.5 | 11.7 | 10.7 |
| 2019 | • | 32 | 13.2 | 9.0 | 18.6 | 13.9 | 10.8 |
| 2020 | • | 45 | 18.7 | 13.6 | 25.0 | 15.2 | 13.0 |
| 2021 | • | 44 | 18.6 | 13.5 | 25.0 | 16.6 | 13.9 |
| 2022 | • | 49 | 20.3 | 15.0 | 26.8 | 17.5 | 14.5 |
| 2023 | • | 43 | 17.7 | 12.8 | 23.8 | 16.2 | 15.0 |
| 2024 | • | 40 | 16.1 | 11.5 | 21.9 | 15.5 | 13.8 |
Source: OHID, based on Office for National Statistics data
Alcohol-Related Deaths
For 2024, the modelled alcohol-related mortality rate in Hull was higher than England and statistically significantly higher in Hull compared to England for men (30% higher for Hull), but not significantly different for women. The rate in Hull was the highest across the region for men, and the fifth highest for women in 2024.
Compared with benchmark
| Indicator | Period | England | Yorkshire and the Humber region (statistical) | Kingston upon Hull | East Riding of Yorkshire | North East Lincolnshire | North Lincolnshire | York | North Yorkshire UA | Barnsley | Doncaster | Rotherham | Sheffield | Bradford | Calderdale | Kirklees | Leeds | Wakefield |
|---|---|---|---|---|---|---|---|---|---|---|---|---|---|---|---|---|---|---|
Alcohol-related mortality (Persons All ages) | 2024 | 38.9 | 42.6 | 50.1 | 37.6 | 52.4 | 46.2 | 39.9 | 37.1 | 44.7 | 47.3 | 41.5 | 42.6 | 43.1 | 39.5 | 46.3 | 41.3 | 45.6 |
Alcohol-related mortality (Male All ages) | 2024 | 59.5 | 64.6 | 77.6 | 59.1 | 76.2 | 68.2 | 63.6 | 55.9 | 67.9 | 73.7 | 60.0 | 63.8 | 65.2 | 57.6 | 69.8 | 63.7 | 68.4 |
Alcohol-related mortality (Female All ages) | 2024 | 21.2 | 23.6 | 25.1 | 18.8 | 31.4 | 26.2 | 20.1 | 21.0 | 24.1 | 23.8 | 25.1 | 23.9 | 23.9 | 24.6 | 26.8 | 22.1 | 26.6 |
The alcohol-related mortality rate has increased between 2018 and 2024 from 41.7 to 50.1 deaths per 100,000 population, although a small decrease from the 53.3 deaths per 100,000 seen in 2023.
In 2024, there were an estimated 118 deaths among Hull men and women that were related to alcohol.
Compared with benchmark
Alcohol-related mortality (Persons All ages)
|
Period
|
Kingston upon Hull |
Yorkshire and the Humber region (statistical)
|
England
|
||||
|---|---|---|---|---|---|---|---|
|
Count
|
Value
|
95%
Lower CI |
95%
Upper CI |
||||
| 2016 | • | 103 | 46.1 | 37.5 | 56.0 | 37.8 | 36.3 |
| 2017 | • | 115 | 50.7 | 41.7 | 61.0 | 40.2 | 36.6 |
| 2018 | • | 93 | 41.7 | 33.6 | 51.2 | 38.3 | 36.6 |
| 2019 | • | 106 | 46.3 | 37.9 | 56.1 | 40.8 | 36.5 |
| 2020 | • | 115 | 50.1 | 41.3 | 60.2 | 41.3 | 37.9 |
| 2021 | • | 119 | 51.3 | 42.5 | 61.5 | 41.9 | 38.5 |
| 2022 | • | 128 | 54.3 | 45.3 | 64.7 | 43.8 | 39.7 |
| 2023 | • | 124 | 53.0 | 44.0 | 63.3 | 43.7 | 40.7 |
| 2024 | • | 118 | 50.1 | 41.4 | 60.1 | 42.6 | 38.9 |
Source: OHID, based on Office for National Statistics data
In 2024, there were an estimated 87 deaths among Hull men that were related to alcohol, almost three-quarters of all alcohol-related deaths in Hull.
Compared with benchmark
Alcohol-related mortality (Male All ages)
|
Period
|
Kingston upon Hull |
Yorkshire and the Humber region (statistical)
|
England
|
||||
|---|---|---|---|---|---|---|---|
|
Count
|
Value
|
95%
Lower CI |
95%
Upper CI |
||||
| 2016 | • | 72 | 68.8 | 53.3 | 87.2 | 58.1 | 56.0 |
| 2017 | • | 88 | 82.3 | 65.5 | 102.0 | 62.0 | 56.6 |
| 2018 | • | 67 | 63.3 | 48.7 | 80.9 | 58.9 | 56.8 |
| 2019 | • | 77 | 70.5 | 55.2 | 88.6 | 62.9 | 56.3 |
| 2020 | • | 84 | 77.7 | 61.5 | 96.8 | 62.7 | 57.8 |
| 2021 | • | 87 | 76.7 | 61.1 | 95.1 | 63.0 | 58.3 |
| 2022 | • | 94 | 81.8 | 65.8 | 100.5 | 64.7 | 60.3 |
| 2023 | • | 98 | 87.5 | 70.6 | 107.2 | 66.0 | 62.1 |
| 2024 | • | 87 | 77.6 | 61.8 | 96.2 | 64.6 | 59.5 |
Source: OHID, based on Office for National Statistics data
In 2024, there were an estimated 30 deaths among Hull women that were related to alcohol.
Compared with benchmark
Alcohol-related mortality (Female All ages)
|
Period
|
Kingston upon Hull |
Yorkshire and the Humber region (statistical)
|
England
|
||||
|---|---|---|---|---|---|---|---|
|
Count
|
Value
|
95%
Lower CI |
95%
Upper CI |
||||
| 2016 | • | 30 | 26.4 | 17.8 | 37.5 | 20.5 | 19.5 |
| 2017 | • | 26 | 22.2 | 14.5 | 32.7 | 21.4 | 19.7 |
| 2018 | • | 26 | 22.3 | 14.5 | 32.6 | 20.5 | 19.4 |
| 2019 | • | 28 | 24.7 | 16.5 | 35.5 | 21.6 | 19.5 |
| 2020 | • | 31 | 26.0 | 17.6 | 36.9 | 22.7 | 20.9 |
| 2021 | • | 32 | 28.1 | 19.2 | 39.6 | 23.4 | 21.3 |
| 2022 | • | 33 | 28.6 | 19.7 | 40.0 | 25.6 | 22.0 |
| 2023 | • | 26 | 21.8 | 14.2 | 32.0 | 24.2 | 22.1 |
| 2024 | • | 30 | 25.1 | 17.0 | 35.8 | 23.6 | 21.2 |
Source: OHID, based on Office for National Statistics data
Potential Years of Life Lost Due to Alcohol-Related Conditions
The potential years of life lost (see Glossary for more information on this measure) is also available on Fingertips for males and females separately. Briefly, the potential years of life lost measures the potential number of years lost when a person dies prematurely, with more weight given to deaths at younger ages than older ages. These ‘lost years’ are then added up and standardised to provide the potential years of life lost measure.
Fingertips uses the number of age-specific alcohol-related deaths multiplied by the national life expectancy for each age group to calculate the potential years of life lost which are then summed to give the total potential years of life lost due to alcohol-related conditions. For instance, male and female life expectancy at birth for England for 2023 were 79.3 and 83.2 years respectively. If a man and a women died of an alcohol-related condition at age 55 years then their years of life lost would be 24.3 years and 28.2 years respectively. Each early death from alcohol-related conditions for the geographical area would be summed to give a total for the year.
For alcohol-related conditions the potential total years of life lost in Hull in 2023 was significantly higher than for England for men (54% higher) but comparable for women.
Compared with benchmark
| Indicator | Period | England | Yorkshire and the Humber region (statistical) | Kingston upon Hull | East Riding of Yorkshire | North East Lincolnshire | North Lincolnshire | York | North Yorkshire UA | Barnsley | Doncaster | Rotherham | Sheffield | Bradford | Calderdale | Kirklees | Leeds | Wakefield |
|---|---|---|---|---|---|---|---|---|---|---|---|---|---|---|---|---|---|---|
Potential years of life lost (PYLL) due to alcohol-related conditions (Male All ages) | 2023 | 1246 | 1386 | 1923 | 1097 | 1451 | 1498 | 1200 | 1125 | 1718 | 1737 | 1163 | 1483 | 1375 | 1327 | 1537 | 1230 | 1537 |
Potential years of life lost (PYLL) due to alcohol-related conditions (Female All ages) | 2023 | 533 | 591 | 527 | 427 | 503 | 737 | 455 | 569 | 580 | 699 | 620 | 626 | 563 | 718 | 598 | 618 | 619 |
The years of life lost due to alcohol-specific conditions among Hull men was significantly higher than England for six of the past seven years, the exception being 2018 when it was not significantly different in Hull. The potential years of life lost has also increased consistently in Hull between 2018 and 2023.
It is estimated that there were 2,390 potential years of life lost among Hull men during 2023 for alcohol-related conditions.
Compared with benchmark
Potential years of life lost (PYLL) due to alcohol-related conditions (Male All ages)
|
Period
|
Kingston upon Hull |
Yorkshire and the Humber region (statistical)
|
England
|
||||
|---|---|---|---|---|---|---|---|
|
Count
|
Value
|
95%
Lower CI |
95%
Upper CI |
||||
| 2016 | • | 1756 | 1472 | 1131 | 1879 | 1164 | 1090 |
| 2017 | • | 2131 | 1754 | 1384 | 2187 | 1254 | 1098 |
| 2018 | • | 1514 | 1279 | 965 | 1654 | 1196 | 1106 |
| 2019 | • | 1926 | 1572 | 1213 | 1997 | 1283 | 1097 |
| 2020 | • | 2042 | 1680 | 1312 | 2112 | 1322 | 1153 |
| 2021 | • | 2252 | 1816 | 1423 | 2277 | 1348 | 1184 |
| 2022 | • | 2437 | 1957 | 1555 | 2426 | 1386 | 1212 |
| 2023 | • | 2390 | 1923 | 1530 | 2379 | 1386 | 1246 |
Source: OHID, based on Office for National Statistics data
The potential years of life lost for alcohol-specific conditions for women has been consistently higher in Hull compared to England and the region, but not statistically significantly so with the exception of 2016.
The potential years of life lost for alcohol-specific conditions has decreased in the last year.
It is estimated that there were 644 potential years of life lost among Hull women during 2023 for alcohol-related conditions.
Compared with benchmark
Potential years of life lost (PYLL) due to alcohol-related conditions (Female All ages)
|
Period
|
Kingston upon Hull |
Yorkshire and the Humber region (statistical)
|
England
|
||||
|---|---|---|---|---|---|---|---|
|
Count
|
Value
|
95%
Lower CI |
95%
Upper CI |
||||
| 2016 | • | 862 | 718 | 465 | 1048 | 500 | 459 |
| 2017 | • | 639 | 527 | 329 | 792 | 532 | 467 |
| 2018 | • | 703 | 570 | 352 | 862 | 515 | 456 |
| 2019 | • | 745 | 623 | 396 | 923 | 530 | 459 |
| 2020 | • | 899 | 744 | 483 | 1085 | 575 | 504 |
| 2021 | • | 785 | 674 | 439 | 981 | 586 | 517 |
| 2022 | • | 800 | 677 | 445 | 977 | 640 | 534 |
| 2023 | • | 644 | 527 | 324 | 800 | 591 | 533 |
Source: OHID, based on Office for National Statistics data
Projected Number of Residents at Risk of Alcohol-Related Problems
The Projecting Adult Needs and Service Information (PANSI) provides current estimates and future projections at local authority level of the number of people predicted to be at a higher risk of alcohol-related problems. The prevalence for different age groups and for males and females estimated from different surveys and research has been applied to current population estimates and population projections to provide estimates for each local authority.
The estimates do not take into account deprivation, and due to Hull’s high levels of deprivation, it is likely that the figures will underestimate the numbers in Hull.
| Age | 2025 | 2030 | 2035 | 2040 | 2045 |
| 18-24 | 1,507 | 1,646 | 1,640 | 1,541 | 1,425 |
| 25-34 | 1,537 | 1,405 | 1,432 | 1,497 | 1,482 |
| 35-44 | 1,062 | 1,126 | 1,100 | 1,047 | 1,059 |
| 45-54 | 1,775 | 1,789 | 1,971 | 2,104 | 2,075 |
| 55-64 | 2,238 | 2,193 | 2,006 | 2,040 | 2,253 |
| All 18-64 | 8,209 | 8,159 | 8,149 | 8,227 | 8,293 |
Qualitative Research in Hull
Local qualitative work revealed lack of understanding over what constituted binge drinking among women “Binge drinking is when you open a second bottle”, but particularly among men “Binge drinking is an all day session” and “Drinking all day and night and not going home”. There was also a general lack of understanding of alcohol units “I find the words unit very confusing”. Government guidelines were seen as ‘made up’, and most agreed that they did not understand them: “I haven’t got a clue”, although some did have an understanding.
Impact of COVID-19 on Alcohol Consumption
From the Office for Health Improvement & Disparities Wider Impact of COVID-19 on Health Monitoring Tool, the percentage of adults aged 18+ years who drank alcohol more than 14 units during a typical week increased during the COVID-19 pandemic compared to consumption before the first lockdown in March 2020 in England. The volume of alcohol sales also increased in Great Britain over the course of the pandemic.
Strategic Need and Service Provision
Hull’s Alcohol and Drugs Partnership Strategy 2022-25 provides key priorities and recommendations for preventing alcohol related harm. The Strategy has six priorities:
- Developing a Prevention and Early Intervention approach across the partnership;
- Implement a more targeted approach to support at-risk groups;
- Improving services to effectively support young people and adults with co-existing mental illness and substance use, and/or with multiple and complex needs;
- Tackling alcohol/drug related stigma to ensure people have equitable access to services and resources.;
- Developing community assets to achieve and sustain recovery; and
- Reducing the risks associated with alcohol/drug use by utilising a harm reduction approach.
The Strategy has been co-produced with partners and relevant stakeholders to ensure local integration and shared accountability. Its primary focus is preventing and reducing the harm that alcohol use has on children, young people and adults; however, it is well integrated with other strategies and local plans.
Further information is available in the Hull Alcohol and Drugs Partnership Strategy.
It is recognised that more work needs to be done around increasing local awareness and understanding of alcohol and drug related harm, reducing acceptability of harmful drinking, managing availability of alcohol, and commissioning services responsive to the needs of groups with multiple disadvantages.
Social return on investment tools for drugs and alcohol make the case of investing in treatment programs to reduce overall crime and anti-social behaviour to reduce costs to society and the economy. It is estimated that over 4,421 crimes (90% shoplifting) were committed by alcohol treatment clients before their entry to treatment, and with an estimated 39% reduction in the number of crimes, around 1,726 crimes were prevented after treatment. The gross benefit of alcohol treatment in 2017/18 in Hull was estimated to be over £3,280,176.
Resources
Institute of Alcohol Studies. Alcohol Knowledge Centre Briefing: The Costs of Alcohol to Society, October 2020. https://www.ias.org.uk/wp-content/uploads/2020/12/The-costs-of-alcohol-to-society.pdf
The Office for Health Improvement & Disparities (formerly Public Health England), 2016. The public health burden of alcohol: Evidence review. https://www.gov.uk/government/publications/the-public-health-burden-of-alcohol-evidence-review
Cabinet Office, 2003. Alcohol misuse: How much does it cost?
Findings, 2015. Measuring and reducing alcohol-related harm.
Home Office, 2013. A minimum unit price for alcohol impact assessment.
Burton R, Henn C, Lavoie D, O’Connor E, Perkins C, Sweeney K. A rapid evidence review of the effectiveness and cost-effectiveness of alcohol control policies: an English perspective. Lancet, 2017; 389 (10078): 1558-80.
Rehm J, Mathers C, Popova S, Thavorncharoensap M, Teerawattananon Y, Patra J. Global burden of disease and injury and economic cost attributable to alc0hol use and alcohol-use disorders. Lancet, 2009; 373 (9682): 2223-33.
Local Health and Wellbeing Surveys
The Office for Health Improvement & Disparities’ Fingertips and Local Alcohol Profiles: https://fingertips.phe.org.uk/
The Office for Health Improvement & Disparities (previously Public Health England). Alcohol-attributable fractions for England: An update, 2020. https://www.gov.uk/government/publications/alcohol-attributable-fractions-for-england-an-update
Office for Health Improvement & Disparities Wider Impact of COVID-19 on Health Monitoring Tool, 2022. https://www.gov.uk/government/statistics/wider-impacts-of-covid-19-on-health-monitoring-tool
Hull ReNew Alcohol Hub. https://www.changegrowlive.org/hull-renew/alcohol-hub
Updates
This page was last updated / checked on 3 June 2026.
This page is due to be updated / checked in March 2027.