Index
This topic area covers statistics and information relating to air pollution in Hull including local strategic need and service provision. Further information is also available about Hull and the environment can be found under Geographical Area within Place, and under Climate Change within Health and Wellbeing Influences.
This page contains information from the Office for Health Improvement & Disparities’ Fingertips. Information is taken ‘live’ from the site so uses the latest available data from Fingertips and displays it on this page. As a result, some comments on this page may relate to an earlier period of time until this page is next updated (see review dates at the end of this page).
Headlines
- Humans interact with the environment constantly. These interactions affect quality of life, years of healthy life lived, and health disparities.
- Air pollution will always be higher in cities with the much greater concentration of housing, industry, roads and traffic compared to rural areas. Furthermore, this might be exacerbated in the case of Hull with its tight geographical boundaries (most other cities have more ‘leafy suburbs’ within their boundary compared to Hull) and these areas will drag down the average levels of air pollution levels in other city local authorities. Despite this, the levels of air pollution are good in Hull relative to other cities, and have fallen in recent years.
- One measure of air pollution is particulate matter smaller than 2.5 microns (PM2.5) and this is estimated to be 7.2 µg/m3 (annual estimate) for Hull for 2023 which is not substantially different than England (7.0 µg/m3) or the region (6.8 µg/m3).
- For 2023, it is estimated that around 5.4% of all deaths among those aged 30+ years are attributable to air pollution in Hull. This is slightly higher than England (5.2%) and the region (5.1%) but similar to other cities and built up areas within the Yorkshire and Humber region.
- There is the potential for measures introduced to resolve one environmental problem to be detrimental to other strategies, so full consultation and engagement between the different areas and an assessment of the impacts of any council actions is essential to ensure strategies complement each other.
The Population Affected – Why Is It Important?
Air quality is the term used to describe how polluted the air we breathe is. When air quality is poor, pollutants in the air may be hazardous to people, particularly those with lung or heart conditions. There are a number of different components to air pollution, and monitoring of air quality involves measuring the atmospheric concentrations of a number of particulates and gases. However, people are not only exposed to air pollution outside the home but inside the home too. It is difficult to measure exposure to air pollution at an individual level as it depends on many factors as they are dependent on levels of emissions, the formation of pollutants, weather, topography and the environment. Household chemicals, pets and pests, temperatures, radon, microbes, particulate matter, humidity and ventilation can all influence indoor pollutants.
The UK’s air quality strategy details how the UK aims to achieve prescribed standards and objectives for a suite of air quality concentrations to protect health and the environment. These include nitrogen dioxide (NO2), sulphur dioxide (SO2) and particulate matter smaller than 10 microns (PM10), with an additional requirement for particulate matter smaller than 2.5 microns (PM2.5). Measurements are usually given as micrograms per cubic metre (µg/m3).
As people are generally more affected by one pollutant than another, locally it is felt that presenting the values of the individual pollutants rather than the Air Pollution Index (API) enables people to make more informed personal decisions. The NHS have summarised some research on lung cancer and heart failure in relation to air pollution. For a lung cancer study, each 10μg/m3 increase in PM10 led to a corresponding increase in the hazard ratio of lung cancer incidence of 1.22 (95% confidence interval 1.03 to 1.45) with no association found between lung cancer incidence and PM2.5, mono nitrogen oxide and nitrogen dioxide combined, or nitrogen dioxide. The heart failure study found an increased risk of heart failure hospitalisation or death for increases in carbon monoxide (3.5% increase in risk per increase of one part per million of pollutant), sulphur dioxide (2.4%), nitrogen dioxide (1.7%), PM2.5 (2.1%) and PM10 (1.6%). In both studies, some potential confounders were included in the model, but it is possible important confounders were not included.
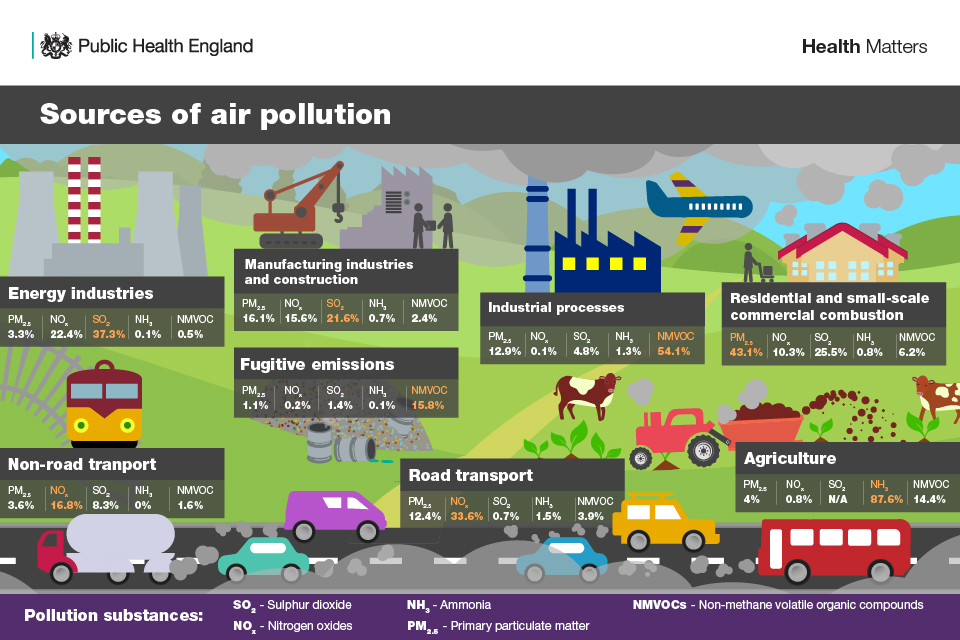
Different factors influence different pollutants in relation to air pollution as illustrate by Health Matters from the Office for Health Improvement & Disparities (formerly Public Health England).
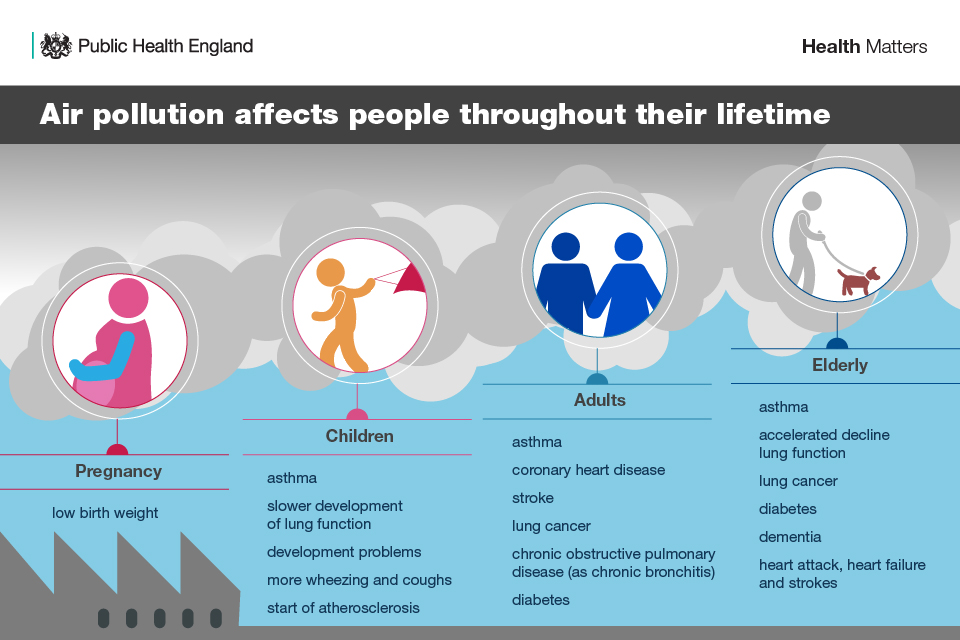
Air pollution affects individuals throughout their entire lifetime.
The Hull Picture
Air Quality Summary
Hull City Council has a very good story to tell regarding air quality so far, and it measures air quality across the city, with results used to inform planning policy and applications as well as the Action Plan Measures in the Council’s Air Quality Strategy. Further information can be found on the main Hull City Council website relating to Air quality, Atmospheric Pollution and Environmental Nuisance.
Part of the UK Strategy is for local authorities submit Annual Status Reports on air quality to the Department for Environment, Food and Rural Affairs’ (DEFRA) and for these to be reviewed by external consultants to ensure they are accurate. The contents of these reports from Hull City Council have been accepted each year and demonstrate that air quality in Hull is good, particularly in comparison to similar areas of the UK. The only exception to this has been an area around the A63 trunk road, which is the responsibility of the National Highways, a central government body. This area is currently an Air Quality Management Area (AQMA) but due to compliance with objectives for five years, to comply with guidance from DEFRA, Hull City Council must proceed to revoke the AQMA.
Changes Over Time in Hull
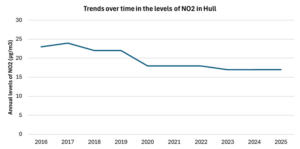
Levels of NO2 have decreased in Hull between 2016 and 2020 with a levelling off in the last five years.
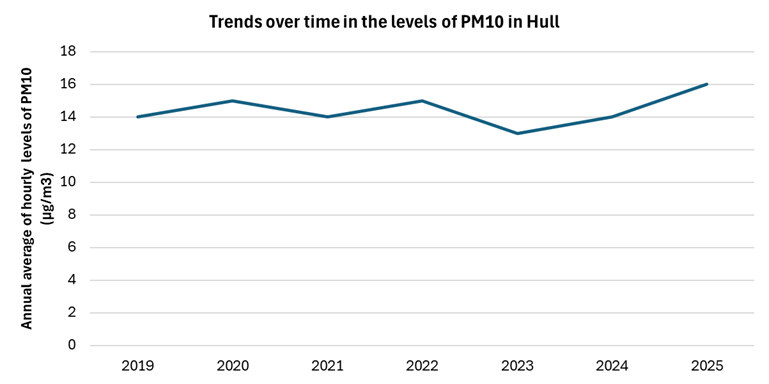
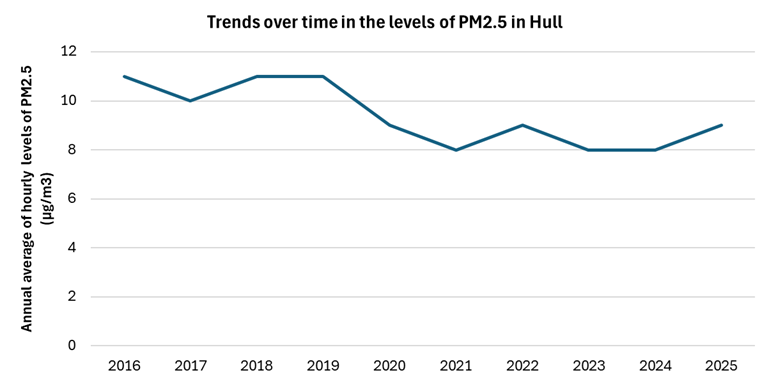
Levels of particulate matter have remained constant or have reduced in Hull over the last few years with an increase in 2024 and 2025 which can be explained by the weather. The levels are reported below for Freetown which will tend to have among the highest levels in Hull due to its location.
During the winter of 2024/2025 high pressure weather systems brought settled, calm conditions, creating ‘Anticyclonic Gloom’ phenomena and temperature inversions where cold air was trapped at the surface beneath warmer air. These inversions acted as a ‘lid’, preventing the dispersal of pollutants, leading to an increase in monitored levels. This effect was seen regionally and nationally, and was not unique to Hull.
Levels of PM2.5 have reduced in Hull since 2016 with a slight increase in 2025 due to the ‘Anticyclonic Gloom’ phenomena.
Hull Compared to Other Areas of England and Wales
The Access to Healthy Assets and Hazards which includes air pollution levels and was updated in 2024.
The Access to Healthy Assets and Hazards (AHAH) index is designed to allow policy and decision makers to understand which areas have poor environments for health, and to help move away from treating features of the environment in isolation.
The Access to Healthy Assets and Hazards index is comprised of four domains: access to retail services (fast food outlets, gambling outlets, pubs/bars/nightclubs, off licences, tobacconists), access to health services (GP surgeries, A&E hospitals, pharmacies, dentists and leisure centres), the physical environment (green and blue spaces) and levels of air pollution (nitrogen dioxide (NO2), particulate matter smaller than 10 microns (PM10) and sulphur dioxide (SO2)).
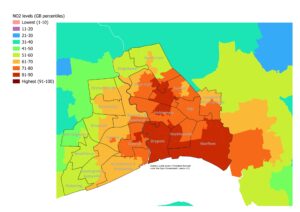
The national percentiles for England, Wales and Scotland are available for each lower layer super output areas. The percentiles range from 1 to 100 with 1 denoting the lowest levels of pollution and 100 denoting the highest levels. As previously mentioned and illustrated in the maps below for England and Wales, there are higher levels of pollution in cities.
Not surprisingly, air pollution levels are higher in cities across England and Wales, and lowest in rural areas.
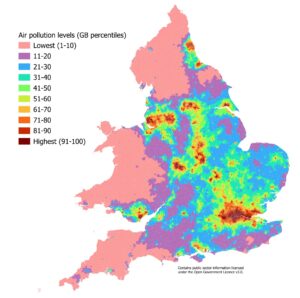
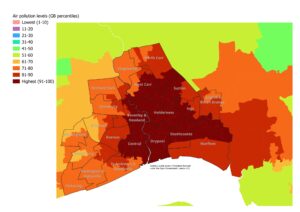
For the overall air pollution measure, 39% of Hull’s 168 lower super output areas fall within the highest tenth of area of Great Britain, 25% in the second highest tenth of areas, 32% in the third highest tenth and 4% in the fourth highest tenth of areas.
Considering the density of Hull and tight geographical boundaries, the levels are relatively low in Hull.
The levels of NO2 are also presented within the Access to Healthy Assets and Hazards index. A similar pattern is observed as the overall measure with cities having the highest pollution levels and rural areas having the lowest levels, although there are lower levels in Hull.
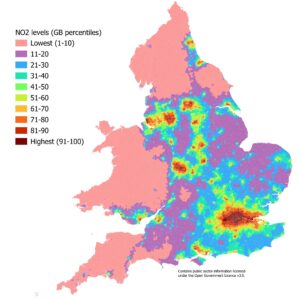
For NO2, none of Hull’s 168 lower super output areas fall within the highest tenth of area of Great Britain, 19% in the second highest tenth of areas, 24% in the third highest tenth, 29% in the fourth highest tenth of areas, 24% in the fifth highest tenth of areas and 4% in the fifth lowest tenth of areas.
Considering the density of Hull and tight geographical boundaries, the levels are low in Hull.
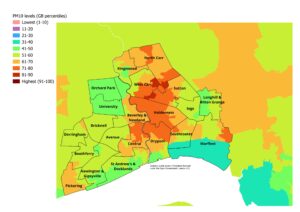
The levels of particulate matter (PM10) are also presented within the Access to Healthy Assets and Hazards index. The air pollution levels for PM10 differ slightly to the overall measure and NO2 within the AHAH index, and the levels in Hull are much lower.
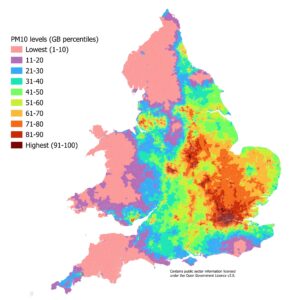
For PM10, none of Hull’s 168 lower super output areas fall within the highest tenth of area of Great Britain, 2% in the second highest tenth of areas, 16% in the third highest tenth, 22% in the fourth highest tenth of areas, 42% in the fifth highest tenth of areas, 18% in the fifth lowest tenth of areas, and 1% in the fourth lowest tenth of areas.
Considering the density of Hull and tight geographical boundaries, the levels are low in Hull.
Levels of Particulate Matter 2.5
The annual concentration of fine particulate matter (PM2.5 ) at an area level, adjusted to account for population exposure is given on the Office for Health Improvement & Disparities’ Fingertips. The estimate of PM2.5 is relatively high across the region, but this is not surprising given that the levels are higher in cities compared to more rural areas. The levels in Hull with also be impacted by Hull’s tight geographical boundaries (as discussed within Geographical Area under Place) as most other cities have ‘leafy suburbs’ within their geographical boundary which reduces their average levels.
Compared with benchmark
| Indicator | Period | England | Yorkshire and the Humber region (statistical) | Kingston upon Hull | East Riding of Yorkshire | North East Lincolnshire | North Lincolnshire | York | North Yorkshire UA | Barnsley | Doncaster | Rotherham | Sheffield | Bradford | Calderdale | Kirklees | Leeds | Wakefield |
|---|---|---|---|---|---|---|---|---|---|---|---|---|---|---|---|---|---|---|
Air pollution: fine particulate matter (new method - concentrations of total PM2.5) (Not applicable Not applicable) | 2024 | 7.1 | 6.9 | 7.4 | 6.4 | 7.3 | 7.2 | 6.0 | 5.5 | 7.1 | 7.4 | 7.5 | 7.3 | 6.9 | 6.6 | 7.0 | 7.4 | 7.1 |
The estimate of PM2.5 in Hull has decreased between 2018 and 2023 by 27% in Hull which is similar to decreases for England.
Compared with benchmark
Air pollution: fine particulate matter (new method - concentrations of total PM2.5) (Not applicable Not applicable)
|
Period
|
Kingston upon Hull |
Yorkshire and the Humber region (statistical)
|
England
|
||||
|---|---|---|---|---|---|---|---|
|
Count
|
Value
|
95%
Lower CI |
95%
Upper CI |
||||
| 2018 | • | - | 9.8 | - | - | 8.2 | 9.5 |
| 2019 | • | - | 9.6 | - | - | 8.9 | 9.6 |
| 2020 | • | - | 7.2 | - | - | 6.6 | 7.5 |
| 2021 | • | - | 7.6 | - | - | 6.7 | 7.4 |
| 2022 | • | - | 7.5 | - | - | 6.8 | 7.8 |
| 2023 | • | - | 7.2 | - | - | 6.8 | 7.0 |
| 2024 | • | - | 7.4 | - | - | 6.9 | 7.1 |
Source: Department for Environment, Food and Rural Affairs
Estimated Mortality Attributable to Air Pollution
The Committee on the Medical Effects of Air Pollutants (COMEAP) estimated that if all man-made particulate pollution were removed, this would lead to an increase in life expectancy of around 6 months although the effect could be as small as one month and as large as a year. To put this into context, the effect on life expectancy of continued smoking is seven years on average. The Office for Health Improvement & Disparities’ Fingertips previously presented the percentage of deaths among those aged 30+ years attributable to air pollution. However, DEFRA’s model for Hull was found to be inaccurate, and as a result it is possible that the percentages of deaths based on these levels of air pollution may also be inaccurate.
More recently, the Office for Health Improvement & Disparities’ have used a new method to calculate the fraction of annual all cause adult mortality attributable to particulate air pollution (PM2.5). It represents the mortality burden associated with long-term exposure to particulate air pollution at current levels, expressed as a percentage of annual deaths from all causes in those aged 30+ years.
From COMPEAP (2022), a 10 µg/m3 increased in PM2.5 equates to a relative risk of 1.08 (i.e. an 8% risk), and using this information a population weighted modelled annual average background PM2.5 concentration x, RR is calculated as (1.08)(x/10) (from Public Health England, 2014). The ‘attributable fraction’ of deaths or fraction of deaths attributable to PM2.5 is expressed as a percentage, calculated as 100*(RR-1)/RR.
Population weighted annual average concentrations of PM2.5 were provided by Ricardo Energy and Environment for all lower tier and unitary local authorities within England, as well as combined at upper tier, regional and national level.
Thus with a estimate of 7.2 µg/m3 for PM2.5 for 2023 above, the relative risk for Hull would be 1.080.72 which is 1.057, and the attributable fraction would be 100*(RR-1)/RR or 100*0.057/1.057 or 5.7, i.e. 5.4% for the fractions of deaths attributable to PM2.5 in Hull for 2023.
The fraction of deaths attributable to air pollution at 5.4% is among the highest in the region. Again, this is not surprising as it will be higher in cities especially for Hull with its relatively unique position of having tight geographical boundaries.
Compared with benchmark
| Indicator | Period | England | Yorkshire and the Humber region (statistical) | Kingston upon Hull | East Riding of Yorkshire | North East Lincolnshire | North Lincolnshire | York | North Yorkshire UA | Barnsley | Doncaster | Rotherham | Sheffield | Bradford | Calderdale | Kirklees | Leeds | Wakefield |
|---|---|---|---|---|---|---|---|---|---|---|---|---|---|---|---|---|---|---|
Air pollution: estimated fraction of mortality attributable to particulate air pollution (Persons 30+ yrs) | 2024 | 5.3 | 5.2 | 5.6 | 4.8 | 5.5 | 5.4 | 4.5 | 4.1 | 5.3 | 5.5 | 5.6 | 5.5 | 5.2 | 4.9 | 5.3 | 5.5 | 5.4 |
The percentage of deaths attributable to PM2.5 in Hull has decreased from 2018 and 2019 when it was over 7% to 5.4% in 2020. The percentage increased to 5.7% in 2021, but has subsequently fallen to 5.4% for 2023 which is the same as it was for 2020.
Compared with benchmark
Air pollution: estimated fraction of mortality attributable to particulate air pollution (Persons 30+ yrs)
|
Period
|
Kingston upon Hull |
Yorkshire and the Humber region (statistical)
|
England
|
||||
|---|---|---|---|---|---|---|---|
|
Count
|
Value
|
95%
Lower CI |
95%
Upper CI |
||||
| 2018 | • | - | 7.2% | - | - | 6.1% | 7.1% |
| 2019 | • | - | 7.1% | - | - | 6.6% | 7.1% |
| 2020 | • | - | 5.4% | - | - | 5.0% | 5.6% |
| 2021 | • | - | 5.7% | - | - | 5.0% | 5.5% |
| 2022 | • | - | 5.6% | - | - | 5.1% | 5.8% |
| 2023 | • | - | 5.4% | - | - | 5.1% | 5.2% |
| 2024 | • | - | 5.6% | - | - | 5.2% | 5.3% |
Source: Department for Environment, Food and Rural Affairs
The impact of air pollution on health will not affect everyone the same, and it is likely that people living in more deprived areas who are more likely to have more ill health and comorbidities are more likely to be affected by poor air quality compared to people living in less deprived areas. Housing conditions may also be worse in more deprived areas which could impact on indoor air pollution levels.
Strategic Need and Service Provision
Hull’s improving year on year trend relating to air quality has been maintained with the Council’s Air Quality Strategy, and an increase in background levels are prevented. Continuing to raise awareness of the health and financial benefits of good air quality is a key measure in encouraging behaviour change and less polluting lifestyle choices.
It is necessary to work together to maintain and expand an environment that promotes active travel for all ages in order to reduce the impact on air pollution from cars. Food production also has a substantial impact on air pollution, particularly meat and manufactured food products. Raising awareness of this and encouraging people to buy locally produced food could all help to reduce air pollution levels.
It is important that any measures in the proposed climate change strategy and proposed action plan consider the implications on and as far as possible complement those in the Air Quality Strategy, as some could have a detrimental impact on air quality. For example, monitoring during the COVID-19 lockdown indicates that as direct emissions from vehicles decrease (mono nitrogen oxide and nitrogen dioxide combined) it has the potential to result in an increase in the concentrations of other potentially harmful gases, such as ozone, and only a minimal reduction in the emissions of particulate matter. This has implications and will need to be considered when advocating a change to electric vehicles.
Resources
HM Government, The Clean Growth Strategy: Leading the way to a low carbon future. 2017, HM Government: London.
Office for Health Improvement & Disparities’ Fingertips. https://fingertips.phe.org.uk/
Public Health England (now Office for Health Improvement & Disparities). Estimating local mortality burdens associated with particulate air pollution, 2014. https://www.gov.uk/government/publications/particulate-air-pollution-quantifying-effects-on-mortality
Hull 2020 Carbon Neutral Strategy. Hull City Council, 2020. http://www.hull.gov.uk/environment/pollution/hull-2030-carbon-neutral-strategy
Updates
This page was last updated / checked on 30 January 2026.
This page is due to be updated / checked in November 2026.