Index
This topic area covers statistics and information relating to housing and households in Hull including local strategic need and service provision. Further information relating to Homelessness is given within Vulnerable Groups.
This page contains information from the Office for Health Improvement & Disparities’ Fingertips. Information is taken ‘live’ from the site so uses the latest available data from Fingertips and displays it on this page. As a result, some comments on this page may relate to an earlier period of time until this page is next updated (see review dates at the end of this page).
Headlines
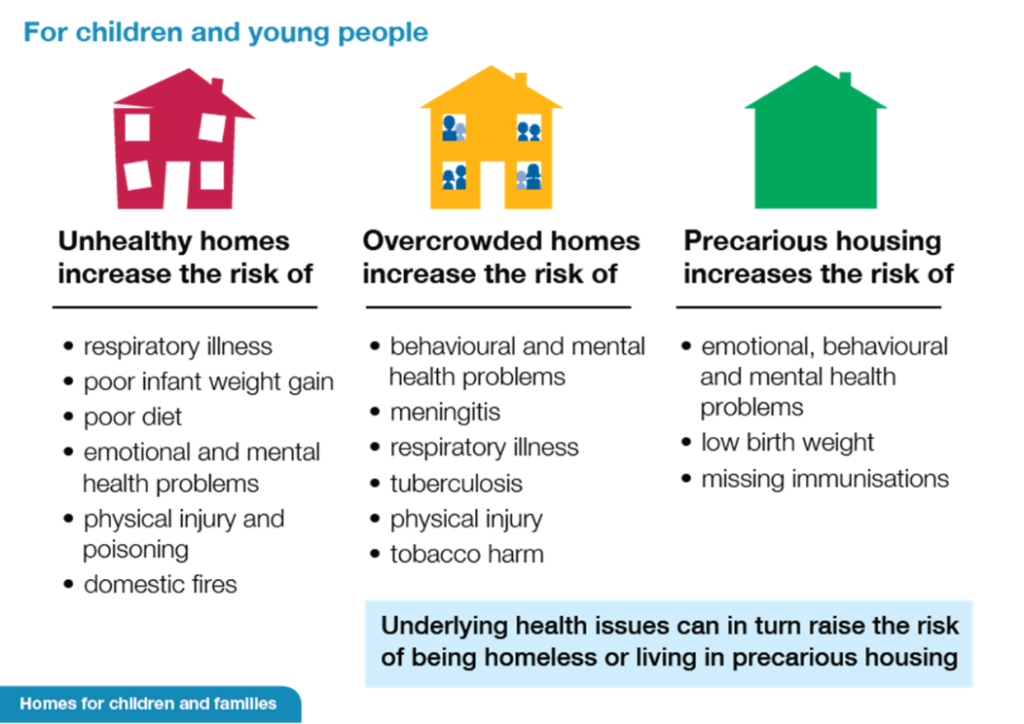
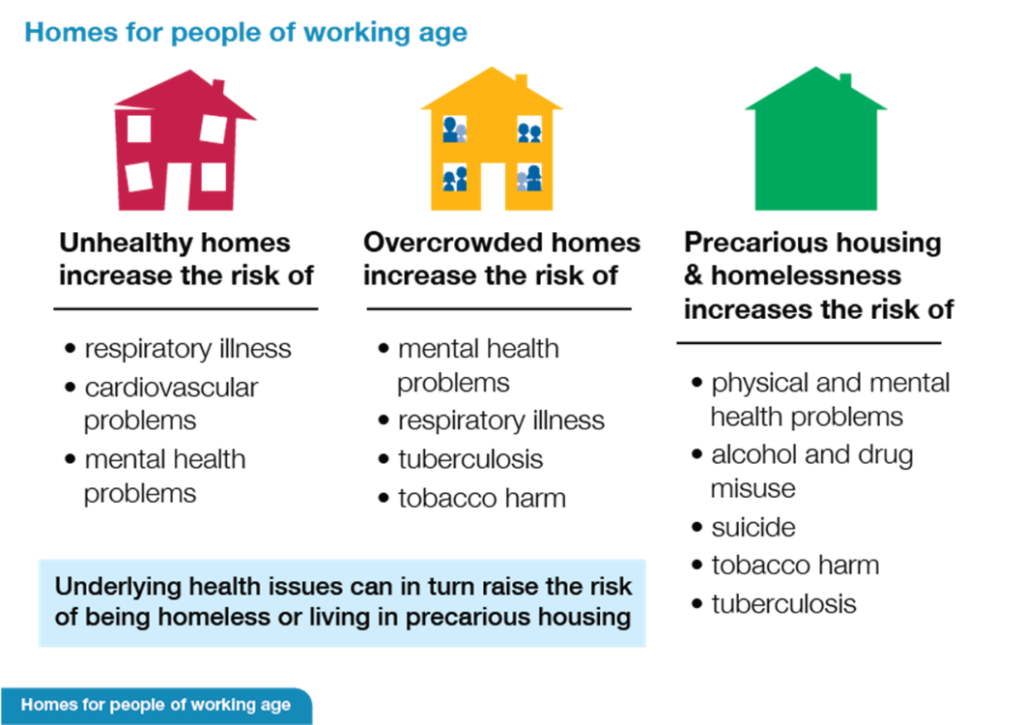
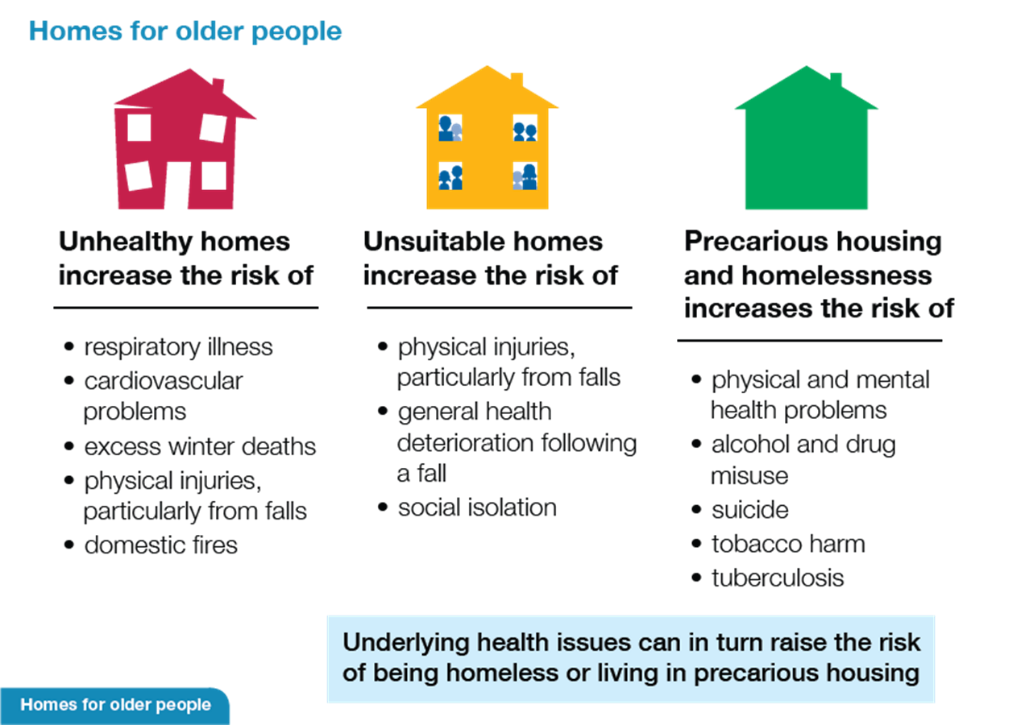
- We need warm, safe and secure homes to help us to lead healthy, independent lives and to recover from illness.
- Poor quality housing can lead to poor physical and mental health, and poverty means that people in poor housing are less able to move home.
- Throughout the life course poor quality housing can have different adverse impacts, from poor weight gain in infants to excess winter deaths in the elderly.
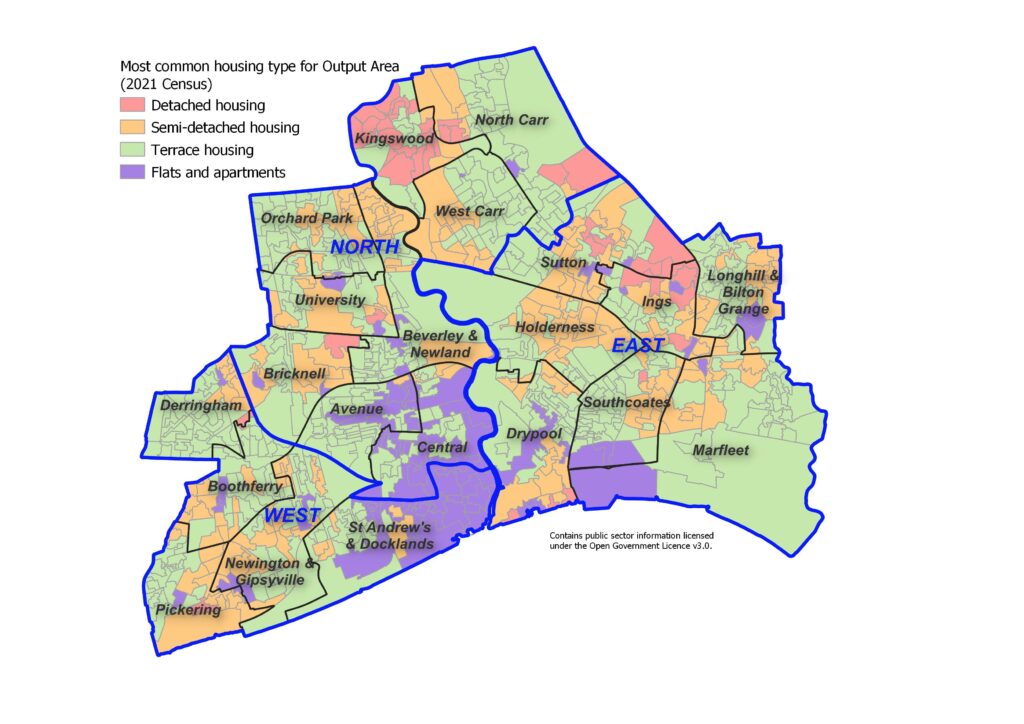
- In 2024, over half of Hull’s housing stock comprise terraced housing which is twice as much as England (53% versus 26%), and there are fewer semi-detached houses in Hull compared to England (18% versus 24%) and one-third as many detached houses (5% versus 16%) as well as fewer flats (17% versus 24%) although only a slightly lower percentage of bungalows (7% versus 9%). From the 2021 Census, the most common housing around the city centre was flats and apartments with detached housing most common in Kingswood and in a few areas to the east of the city.
- In 2024, the number of bedrooms in Hull’s houses also differ compared to England. The number of one bedroom properties is similar (12% versus 12%), but there are more two (34% versus 28%) and three (45% versus 42%) bedroom properties in Hull, and there are fewer four (6.8% versus 12.0%), five (1.1% versus 2.4%) and six or more (0.6% versus 0.9%) properties in Hull compared to England.
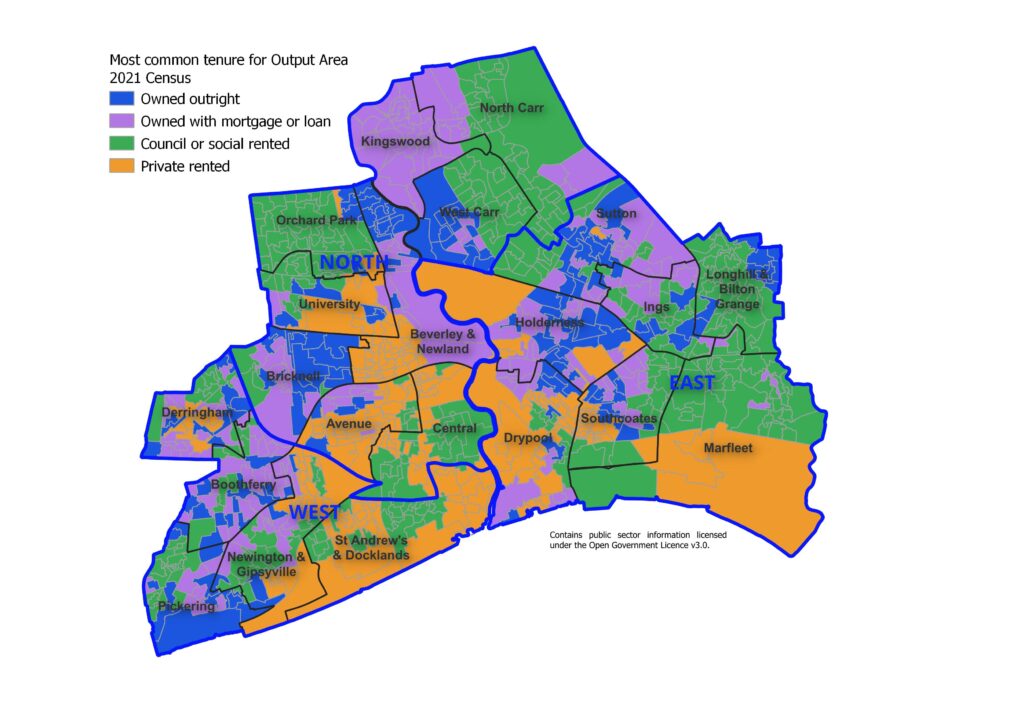
- From the 2021 Census, Hull has significantly less owner occupied housing compared to England (49% versus 62%). The percentage of owner occupied housing with a mortgage or loan was only slightly lower in Hull (25% versus 29%) with the biggest difference in the percentage of owner occupied housing that was owned outright (23% versus 33%). There were almost three times as many local authority owned dwellings in Hull compared to England (19% versus 8%), a similar percentage of dwellings socially rented (8% versus 9%) and slightly higher percentages in Hull that were privately rented (24% versus 21%), although tenure differed substantially across Hull’s wards. Council and socially rented dwellings were the most common in Orchard Park, North Carr, east parts of West Carr, Longhill & Bilton Grange and parts of Ings, Marfleet, Southcoates and Central. Privately rented accommodation was most likely within the city centre, Avenue, St Andrew’s & Docklands, parts of Marfleet and around the University, whereas dwellings that were owned outright were more likely to occur to the west of the city in Beverley & Newland, west parts of West Carr, and in Holderness, Southcoates and Sutton. These areas also had areas within the wards where properties were owner occupied with a mortgage or loan together with households in Kingswood.
- In 2023, two-thirds of homes in the city are in the lowest (cheapest) Council Tax band (A) compared to fewer than one-quarter (24%) of homes in England, and 43% across the Yorkshire and Humber region. Only 1.5% of properties in Hull fall within the highest Council Tax bandings (E to H) compared to 11% for the region and 19% for England.
- The cost of new mortgages and existing mortgages for those not on a fixed-interest mortgage deal have increased due to the continual increase in the Bank of England’s base interest rate. In 2007 and early 2008, the base rate had been over 5% but fell sharply in 2008 to a low of 0.5% in March 2009. Until February 2022, the rate had varied between 0.1% and 0.75%. In February 2022, the base rate was 0.5% but increased by 0.25 percentage points most months until reaching 5.25% in August 2023 which was the highest for 15 years. However, the rate has fallen on four separate occasions by 0.25 percentage points each time since the high of 5.25% (falling in August 2024, November 2024, February 2005 and May 2025) to reach 4.25%. Landlords often have mortgages too on their rental properties so the impact has affected rental costs too. As fewer people have been able to afford a mortgage with the higher interest rates and cost of living crisis, more people are wanting to rent which has pushed up demand for rental properties. Furthermore, the higher rents means that people are less able to save to ‘get a step on the property ladder’.
- Whilst housing is cheaper to buy and rent in Hull, there are significant numbers of households in Hull who are struggling to find quality housing they can afford. There is currently a housing crisis in Hull particularly in relation to social housing where demand appears to be outstripping supply when affordability is taken into account.
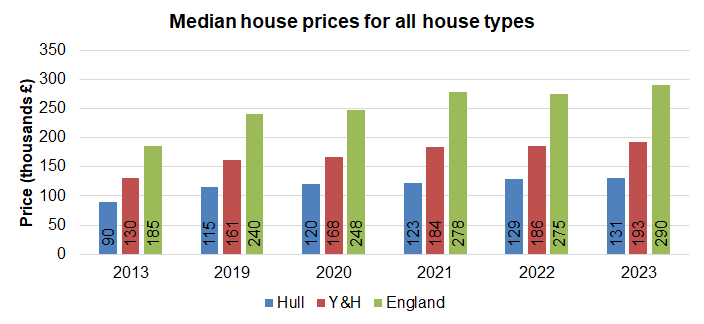
- Housing is much cheaper in Hull to buy compared to most places in England, although incomes are generally lower in Hull too. The median (‘typical’ value – middle value when sorted in order) of property in Hull is around 4.5 times the median annual salary of residents of Hull compared to 8.3 times higher for England. So house affordability is much better in Hull compared to many other places in England. However, this does not mean that access to affordable housing is not a problem in the city. With the high levels of deprivation and poverty in Hull, and the cost of living crisis, and an increasing percentage of people living with a negative budget (in that their outgoings for essentials exceeds their income), buying a home is out of the question for many people in Hull. For the year January to December 2023, the typical value (median – middle value when sorted in order) of all houses in Hull is £129,100 compared to £195,000 for the region and £290,000 for England.
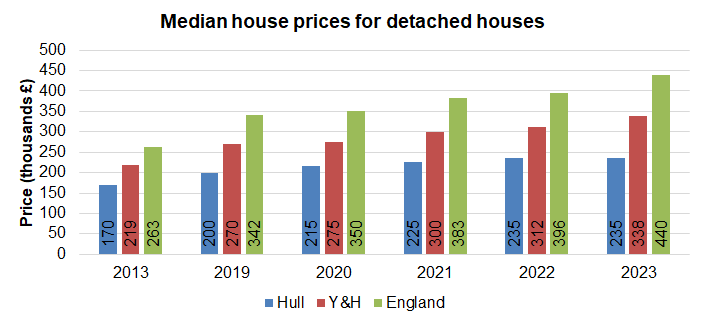
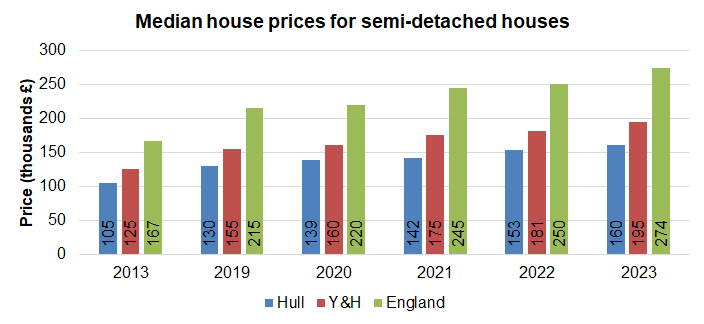
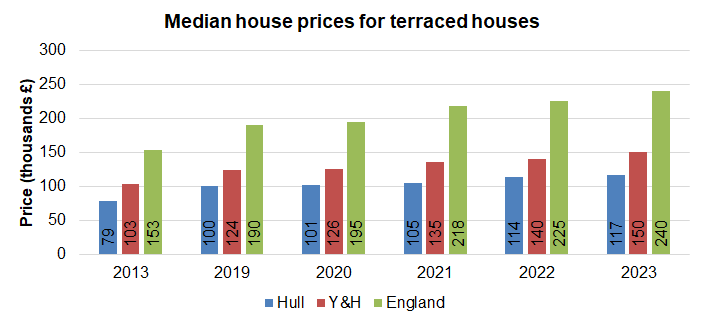
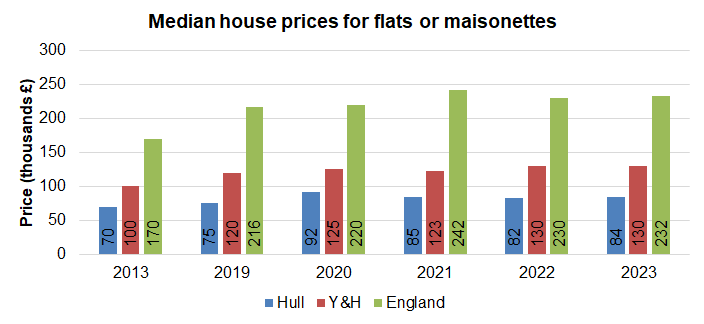
- Based on information for the period April 2022 to March 2023, the median house price in Hull compared to England is much lower for all property types: detached (£235,000 versus £440,000), semi-detached (£160,000 versus £274,000), terraced (£117,000 versus £240,000) and flats or maisonettes (£84,000 versus £232,000). Since the year ending March 2019, property prices have increased in Hull for detached, semi-detached and terraced properties with a relatively large increase between April 2020-March 2021 to April 2021-March 2022. The property prices for flats and maisonettes in Hull have been more variable (having increased substantially from £72,250 to £91,797 between April 2018-March 2019 to April 2019-March 2020 before decreasing to £84,750 for April 2020-March 2021 and to £82,000 for April 2021-March 2022, although there has been an increase to £84,000 for the latest period April 2022-March 2023.
- The median cost of privately rented accommodation per month for the period October 2022 to September 2023 was £433 for a room, £300 for a studio, £425 for a one bedroom property, £495 for a two bedroom property, £575 for a three bedroom property, and £750 for a property with four or more bedrooms in Hull. The median over all property types was £483 per month. With the exception of single rooms where the median cost in Hull was similar to other local authorities across the region, for all other property types the monthly median cost was among the lowest across the region. However, the cost has increased relatively sharply in Hull over the last 18 months, the median monthly rental costs for the period October 2022 to September 2023 were around 10% higher than the cost for the period March 2021 to April 2022 with the exception of studios where the cost had decreased by 8.5%. The cost of single rooms (12.2%) and four bedroom houses (16.6%) had increased by a slightly higher percentage.
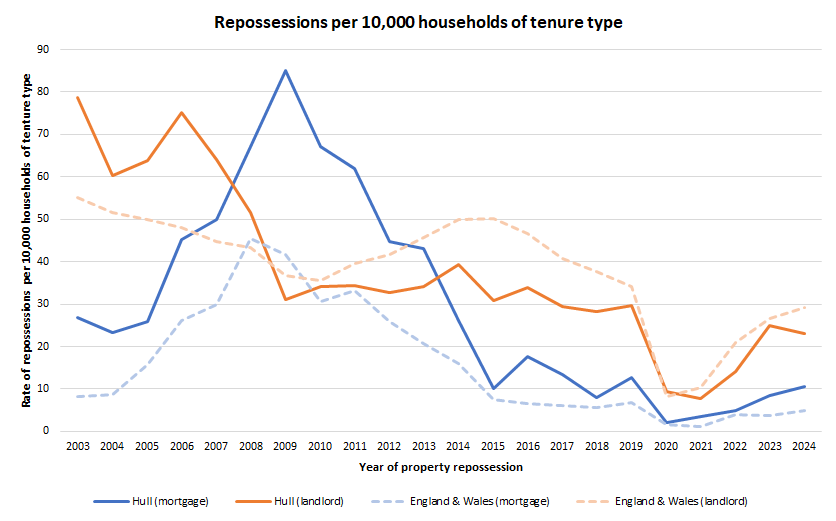
- The rate of mortgage repossessions has been was considerably higher in Hull compared to England between 2003 and 2014, but the difference has been less marked in recent years. Compared to England, the rate of landlord repossessions has generally been lower in Hull since 2011. The rate of both mortgage and landlord repossessions were low in 2020 and 2021 due to the Coronavirus Act 2020 which increased the notice required to provide tenants when seeking possession of residential property between March 2020 and September 2021. Between 2021 and 2022, the repossession rate increased slightly for mortgaged properties and doubled for landlord repossessions, but the numbers are still very small relative to earlier years. During 2024, there were 29 mortgage repossessions and 138 landlord repossessions in Hull (from 24 and 149 respectively the previous year). Between 2003 and 2019, the total number of mortgage repossessions ranged from 24 to 288 per year and the total number of landlord repossessions ranged from 163 to 378 per year. There have been far fewer repossessions since the COVID-19 pandemic, but the rate of repossessions have increased since lows during 2020 and 2021.
- From the 2021 Census, 3.6% of all households in Hull are overcrowded in relation to the number of bedrooms they need based on the number of people living within the household and their age, gender and relationships to one-another, although this is lower than England (4.3%). Overall, 3,625 households in Hull (3.1%) require one more bedroom and 521 (0.5%) require two or more bedrooms, with such households more likely in Orchard Park (6.5%), Central (5.8%) and St Andrew’s & Docklands (5.7%) wards.
- From the 2021 Census, 22.1% of households in Hull were single person households aged under 66 years, 12.1% were single person households aged 66+ years, 6.3% were single family households all aged 66+ years, 16.4% were single family households with no children (married, civil partnerships or cohabiting), 17.4% single family households with dependent children, 5.6% single family households with all non-dependent children, 9.1% were lone parent households with dependent children, 4.4% were lone parent households with all non-dependent children, 2.2% were multiple family households with children, and 3.7% were multiple family households without children including full-time students or people aged 66+ years. Single family households with or without children were more likely to be a family who were married or in a civil partnership (23.9%) compared to cohabiting (15.5%). One in eight (12.1%) households comprised of people aged 66+ years who lived in single person households or in single family households, but it is possible this percentage is higher as there could be some multiple family households containing people aged 66+ years. Single person households of people aged under 66 years were much more common around the city centre whereas single person and family households comprising people aged 66+ years were less likely to occur around the city centre and were spread out throughout other parts of Hull. High concentrations of single families with and without children occurred throughout the city but with lower concentrations around the city centre and higher concentrations in Kingswood ward. Lone parents with dependent children were more likely in Orchard Park, North Carr, Longhill & Bilton Grange, and in parts of Marfleet, Newington & Gipsyville and St Andrew’s & Docklands. There were high concentrations of multiple family households without children in University and Beverley & Newland wards where many students lived in shared accommodation.
- From the 2021 Census, 34.1% of households in Hull have one deprivation dimension, 18.9% have two dimensions, 5.6% have three dimensions and 0.3% have all four deprivation dimensions, which is higher than England (33.5%, 14.2%, 3.7% and 0.2% respectively). Overall, 1.8% of households in Hull had no central heating but this varied across different geographical areas within Hull (ranging from 0% to 17.2% across Hull’s 881 Output Areas which are geographical areas between 40 and 250 households).
The Population Affected – Why Is It Important?
Our homes are the cornerstones of our lives. Where we live and the quality of our homes has an important impact on our health and how we feel. The very fabric of our housing affects our wellbeing, risk of disease and our demands on health and care services. We need warm, safe and secure homes to help us to lead healthy, independent lives and to recover from illness.
The right home environment is essential to health and wellbeing, throughout life. There are risks to an individual’s physical and mental health associated with living in:
- a cold, damp, or otherwise hazardous home (an unhealthy home).
- a home that doesn’t meet the household’s needs due to risks such as being overcrowded or inaccessible to a disabled or older person (an unsuitable home).
- a home that does not provide a sense of safety and security including precarious living circumstances and/or homelessness (an unstable home).
The right home environment protects and improves health and wellbeing, and prevents physical and mental ill health. It also enables people to:
- manage their own health and care needs, including long term conditions.
- live independently, safely and well in their own home for as long as they choose.
- complete treatment and recover from substance use, tuberculosis or other ill-health.
- move on successfully from homelessness or other traumatic life event.
- access and sustain education, training and employment.
- participate and contribute to society.
The home or housing circumstances present a particular risk to the health and wellbeing of:
- children, and their families.
- people with long-term conditions.
- people with mental health issues.
- people with learning disabilities.
- people recovering from ill health.
- older people.
- people who spend a lot of time at home such as carers.
- low income households.
- people who experience a number of inequalities.
The Hull Picture
Housing Stock and Type of Accommodation
In 2024, there were a total of approximately 124,750 properties in Hull from the Valuation Office Agency. There had been 122,990 in 2021 so this represents an increase of 1,760 properties in three years with a relatively evenly split of around 600 new properties each year.
Compared to the region and England, Hull has twice as many terraced housing and a third as many detached houses as well as far fewer semi-detached houses.
| Type | Hull N | Hull % | Y & H % | England % | |
| Detached houses | 6,150 | 4.9 | 14.5 | 16.0 | |
| Semi-detached houses | 22,960 | 18.4 | 29.1 | 23.6 | |
| Terraced houses | 65,700 | 52.7 | 28.5 | 25.8 | |
| Flats/maisonettes | 21,450 | 17.3 | 16.0 | 24.2 | |
| Bungalow | 8,160 | 6.5 | 10.6 | 9.0 | |
| Annexe | 10 | 0.0 | 0.1 | 0.2 | |
| Caravan/Houseboat/Mobile home | 70 | 0.1 | 0.3 | 0.5 | |
| Unknown type | 150 | 0.1 | 0.8 | 0.7 | |
| All properties | 124,750 | 100.0 | 100.0 | 100.0 |
The Valuation Office Agency also provides information on the number of bedrooms of each of these property types. Perhaps not surprisingly, properties in Hull tended to have fewer bedrooms than properties in England and across the region.
| Number of bedrooms | Hull N | Hull % | Y & H % | England % | |
| One | 15,500 | 12.4 | 10.5 | 12.7 | |
| Two | 41,880 | 33.6 | 28.2 | 27.9 | |
| Three | 56,510 | 45.3 | 44.6 | 41.8 | |
| Four | 8,460 | 6.8 | 12.0 | 12.0 | |
| Five | 1,340 | 1.1 | 2.3 | 2.4 | |
| Six or more | 720 | 0.6 | 0.9 | 0.9 | |
| Unknown | 380 | 0.3 | 1.6 | 2.0 | |
| All properties | 124,750 | 100.0 | 100.0 | 100.0 |
Detailed information is available on the accommodation type from the 2021 Census which also used information from the Valuation Office Agency, although properties have been classified slightly differently in the 2021 Census in relation to the table above as there is no separate category for bungalow. Overall, there were 115,473 properties:
- 8.4% were detached houses;
- 29.4% were semi-detached houses;
- 46.7% were terraced houses;
- 11.4% were in a purpose-build block of flats or tenements;
- 2.3% were in part of a converted or shared house, including bedsits;
- 0.7% were in part of another converted building, for example, former school, church or warehouse;
- 0.9% were in a commercial building, for example, in an office building, hotel or over a shop; and
- 0.1% were in a caravan or other mobile or temporary structure.
As mentioned above, compared to England, Hull had a much higher percentage of terraced housing, and semi-detached and detached housing. There were also fewer flats and caravans, mobile or temporary structures for accommodation in 2021. Around eight in ten (79%) of all flats in Hull were in flats within purpose-built buildings.
| Accommodation type | Hull N | Hull % | Y&H % | England % |
| Detached | 9,676 | 8.4 | 21.6 | 22.9 |
| Semi-detached | 33,932 | 29.4 | 37.6 | 31.5 |
| Terraced | 53,953 | 46.7 | 26.1 | 23.0 |
| Flat in purpose-built block of flats | 13,165 | 11.4 | 11.1 | 17.1 |
| Flat in converted house | 2,681 | 2.3 | 1.7 | 3.5 |
| Flat in converted building | 831 | 0.7 | 0.9 | 0.8 |
| In commercial building | 1,071 | 0.9 | 0.7 | 0.8 |
| Caravan, mobile or temporary structure | 162 | 0.1 | 0.2 | 04 |
The type of accommodation differed greatly across Hull’s 21 electoral wards based on the 2021 Census information.
Bricknell was the smallest ward in relation to properties having 3,601 properties and St Andrew’s & Docklands had the highest number of properties at 8,262 in 2021.
St Andrew’s & Docklands had the fewest percentage of detached and terraced houses, but the highest percentage of flats (purpose-built or properties that were part of a converted house or other building) and properties that were within a commercial building.
Kingswood had the highest percentage of detached houses with almost four in ten properties being detached houses, and this was more than twice as high as the next highest ward (Ings at 16.5%).
Virtually all of Hull’s 21 wards had at least four in ten of their property types as terraced housing with the exception for Central (37%), Kingswood (29%) and St Andrew’s & Docklands (25%).
| Ward | Total | Detached | Semi-detached | Terraced | Flat or part of a building | In commercial building | Caravan or temporary |
| Avenue | 6,135 | 3.7 | 9.8 | 58.8 | 25.0 | 1.8 | 0.9 |
| Beverley & Newland | 6,736 | 6.8 | 30.2 | 49.5 | 12.5 | 1.0 | 0.0 |
| Boothferry | 5,286 | 4.9 | 28.0 | 57.6 | 8.5 | 1.0 | 0.0 |
| Bricknell | 3,601 | 9.1 | 37.2 | 45.3 | 7.9 | 0.5 | 0.0 |
| Central | 5,041 | 5.9 | 13.2 | 36.9 | 41.5 | 1.9 | 0.5 |
| Derringham | 5,642 | 5.2 | 22.7 | 65.6 | 5.9 | 0.5 | 0.0 |
| Drypool | 5,893 | 8.3 | 27.2 | 42.7 | 19.9 | 1.3 | 0.5 |
| Holderness | 5,127 | 6.2 | 41.0 | 48.8 | 3.0 | 0.9 | 0.0 |
| Ings | 4,041 | 16.5 | 32.1 | 41.1 | 10.0 | 0.2 | 0.0 |
| Kingswood | 3,833 | 39.5 | 25.8 | 29.1 | 5.0 | 0.4 | 0.1 |
| Longhill & Bilton Grange | 5,407 | 5.1 | 45.0 | 41.5 | 8.0 | 0.3 | 0.0 |
| Marfleet | 5,688 | 6.4 | 37.0 | 50.2 | 6.0 | 0.4 | 0.0 |
| Newington & Gipsyville | 7,211 | 7.7 | 31.2 | 47.7 | 11.8 | 1.3 | 0.2 |
| North Carr | 5,786 | 14.1 | 22.5 | 55.4 | 7.9 | 0.1 | 0.0 |
| Orchard Park | 6,460 | 5.6 | 33.7 | 53.2 | 7.2 | 0.3 | 0.0 |
| Pickering | 3,932 | 8.1 | 37.6 | 43.0 | 10.8 | 0.5 | 0.0 |
| St Andrew’s & Docklands | 8,262 | 3.5 | 14.1 | 24.6 | 54.6 | 2.9 | 0.4 |
| Southcoates | 6,171 | 5.0 | 30.7 | 57.1 | 6.0 | 1.1 | 0.0 |
| Sutton | 5,926 | 15.0 | 37.4 | 36.6 | 10.6 | 0.4 | 0.0 |
| University | 3,914 | 7.4 | 35.4 | 45.2 | 11.3 | 0.7 | 0.0 |
| West Carr | 5,381 | 6.6 | 39.7 | 48.2 | 5.3 | 0.2 | 0.0 |
| Hull | 115,473 | 8.4 | 29.4 | 46.7 | 14.4 | 0.9 | 0.1 |
The map shows the most common type of housing for each of the 881 Output Areas in Hull (see Glossary for more information on these geographical areas). As noted earlier, Kingswood has the most geographical areas with detached houses as the most common accommodation type. Areas around the city centre had flats – both purpose-built or part of a building – as the most common accommodation type, whereas semi-detached houses and terraced housing were more distributed throughout the city.
Hull has an estimated 1,919 long-term vacant dwellings with 42% being long-term vacant.
The housing supply in Hull has been increasing since 2002 with around 200-1,000 additional dwellings each year based on new house building completions, conversions, changes of use, demolitions and other changes to the dwelling stock.
Housing Tenure
From the 2021 Census, properties in Hull were evenly split between home ownership and renting with 23% of properties owned outright, 25% properties owned with a mortgage or loan, 0.5% with shared ownership, 27% rented from the council or other social renting, and 24% privately rented.
Whilst a reasonably similar percentage of properties in Hull were owned with a mortgage or loan compared to the region and England (25% versus 29%), properties were less likely to be owned outright (23% versus 33%). Thus a higher percentage of properties in Hull were rented in particular through the council.
| Tenure | Hull N | Hull % | Yorkshire & Humber % | England % |
| Total owned | 56,326 | 48.8 | 63.1 | 62.1 |
| Owned outright | 26,695 | 23.1 | 33.7 | 32.5 |
| Owned with mortgage/loan | 29,046 | 25.2 | 28.9 | 28.8 |
| Shared ownership | 585 | 0.5 | 0.5 | 1.0 |
| Total rented | 58,760 | 50.9 | 36.7 | 37.6 |
| Total council or social rented | 31,167 | 27.0 | 17.3 | 17.1 |
| Council rented | 21,768 | 18.9 | 11.1 | 8.3 |
| Social rented | 9,399 | 8.1 | 6.2 | 8.8 |
| Total private rented | 27,593 | 23.9 | 19.4 | 20.5 |
| Private landlord/letting agency rented | 25,419 | 22.0 | 17.2 | 18.2 |
| Other private rented | 2,174 | 1.9 | 2.3 | 2.2 |
| Total lives rent free | 389 | 0.3 | 0.2 | 0.1 |
| Lives rent free | 389 | 0.3 | 0.2 | 0.1 |
Housing tenure also differed across Hull’s 21 wards.
St Andrew’s & Docklands had the lowest percentages owned outright and owned with a mortgage or loan with fewer than one in five properties being owned.
Kingswood, Holderness and Bricknell had the highest ownership rates with a relatively evenly split between owned outright and owned with a mortgage or loan for Holderness and Bricknell, but substantially more properties owned with a mortgage or loan in Kingswood.
Orchard Park has the highest levels of council rented properties at 45% whereas North Carr has the highest levels of social renting at 18%. The highest levels of privately rented properties are within Beverley & Newland, and Avenue wards where at least four in ten properties are privately rented.
The distribution of the tenure across the city will be a reflection of the accommodation type and distribution of council and social housing throughout the city, but will also reflect the age distribution of the population. For instance, Kingswood has a relatively young populati0n and is the least deprived ward in Hull so it is not surprising that there is a high level of home ownership but that ownership is mainly through a mortgage or loan.
| Ward | Total | Owned outright | Owned mortgage | Shared ownership | Council rented | Social rented | Private rented | Rent free |
| Avenue | 6,137 | 23.6 | 23.6 | 0.7 | 4.4 | 6.1 | 41.4 | 0.1 |
| Beverley & Newland | 6,739 | 28.2 | 22.7 | 0.4 | 1.9 | 4.8 | 42.0 | 0.1 |
| Boothferry | 5,287 | 32.3 | 34.5 | 0.2 | 11.3 | 3.9 | 17.6 | 0.3 |
| Bricknell | 3,600 | 36.8 | 33.2 | 0.5 | 7.9 | 5.2 | 16.3 | 0.1 |
| Central | 5,043 | 10.7 | 10.8 | 0.3 | 28.2 | 10.0 | 39.5 | 0.6 |
| Derringham | 5,642 | 29.2 | 30.6 | 0.2 | 11.7 | 4.6 | 23.5 | 0.2 |
| Drypool | 5,896 | 22.7 | 23.5 | 0.2 | 10.2 | 7.9 | 34.7 | 0.8 |
| Holderness | 5,126 | 38.5 | 37.4 | 0.2 | 2.1 | 1.3 | 20.4 | 0.1 |
| Ings | 4,042 | 26.7 | 30.2 | 1.9 | 20.4 | 11.8 | 8.4 | 0.5 |
| Kingswood | 3,834 | 13.4 | 66.4 | 0.1 | 0.5 | 1.0 | 18.6 | 0.0 |
| Longhill & Bilton Grange | 5,406 | 25.0 | 22.3 | 0.1 | 36.5 | 2.4 | 13.3 | 0.4 |
| Marfleet | 5,681 | 13.6 | 16.5 | 0.9 | 37.3 | 16.2 | 15.1 | 0.4 |
| Newington & Gipsyville | 7,212 | 17.7 | 25.1 | 0.5 | 12.1 | 11.0 | 33.2 | 0.4 |
| North Carr | 5,785 | 16.7 | 26.7 | 0.4 | 25.2 | 18.3 | 12.6 | 0.2 |
| Orchard Park | 6,461 | 16.6 | 14.2 | 0.2 | 45.0 | 10.8 | 12.7 | 0.4 |
| Pickering | 3,931 | 27.7 | 25.0 | 2.3 | 23.8 | 6.5 | 14.2 | 0.5 |
| St Andrew’s & Docklands | 8,263 | 10.2 | 9.2 | 0.6 | 26.0 | 14.4 | 38.9 | 0.7 |
| Southcoates | 6,170 | 24.5 | 26.0 | 0.8 | 16.0 | 11.0 | 21.5 | 0.2 |
| Sutton | 5,923 | 31.2 | 30.3 | 0.3 | 19.8 | 4.5 | 13.6 | 0.3 |
| University | 3,909 | 19.1 | 19.9 | 0.4 | 22.1 | 8.8 | 29.5 | 0.2 |
| West Carr | 5,380 | 23.1 | 25.2 | 0.1 | 26.1 | 3.3 | 12.2 | 0.3 |
| Hull | 115,467 | 23.1 | 25.2 | 0.5 | 18.8 | 8.1 | 23.9 | 0.3 |
The map below also illustrates this graphically for each of Hull’s 881 Output Areas (see Glossary for more information on these geographical areas) with the most common type of tenure displayed.
Council and social housing is predominant in Orchard Park, North Carr, Longhill & Bilton Grange, Marfleet, the east part of West Carr, and parts of Central, Southcoates and Ings, although there are council and social housing elsewhere in particular areas of other wards.
Owner occupied properties are more likely in the areas encircling the city centre through Pickering, Boothferry, Bricknell, Beverley & Newland, Holderness and Sutton together with the west part of West Carr and all of Kingswood.
Large parts of University, Avenue, St Andrew’s & Docklands and Drypool are more likely to have properties that are privately rented together with parts of Marfleet ward.
Based on the number of properties by tenure from the 2001, 2011 and 2021 Census, the number of owner-occupied properties has reduced slightly with more properties owned outright and fewer properties owner-occupied with an outstanding mortgage or loan. The number of properties that are socially rented has reduced and this has been driven by a large decrease in the number of properties rented through the council (decreasing by one-third) with a slight increase in other social renting. Properties rented from a private landlord or letting agency has more than doubled between 2001 and 2021, and now accounts for two in ten properties rather than one in ten as it was in 2001. In 2021, there are a further 1.9% of all properties are rented privately but not through a landlord or letting agency and some properties in 2001 would have fallen into this category but this information was not distinguished within the 2001 Census.
| Tenure | 2001 | 2011 | 2021 | Change from 2001 to 2021 (%) |
| Owned outright | 17.6 | 19.9 | 23.1 | 31.4 |
| Owned with mortgage or loan | 34.1 | 29.7 | 25.2 | -26.2 |
| Shared ownership | 0.5 | 0.4 | 0.5 | 6.1 |
| Owned or shared ownership total | 51.7 | 49.5 | 48.3 | -6.6 |
| Rented from council | 27.9 | 21.2 | 18.9 | -32.4 |
| Other social rented | 5.4 | 6.9 | 8.1 | 52.0 |
| Social rented total | 33.2 | 28.1 | 27.0 | -18.8 |
| Rented from private landlord or letting agency | 10.8 | 19.0 | 22.0 | 103.2 |
| Other private renting | * | 1.4 | 1.9 | |
| Lives rent free | * | 1.5 | 0.3 | |
| Other (other private renting / rent free) | 3.8 | 2.9 | 2.2 | -41.5 |
| Total properties | 115,475 | 112,596 | 104,288 |
Council Tax Banding
The council tax band determines how much council tax is due for the property. It is based on the value of the property at a specific point in time (on 1 April 1991 for England).
In 2023, the significant majority (66%) of dwellings in Hull fall within the lowest Council Tax Band (A) – much higher proportion than regional (42%) and national figures (24%). Only 1.5% of all properties in Hull fall within bands E to H, compared to 11.0% for the region and 19.1% for England.
| Tax band | Hull, number | Hull, % | Y&H, % | England, % |
| Band A | 82,450 | 66.1 | 42.2 | 23.8 |
| Band B | 24,310 | 19.5 | 20.2 | 19.5 |
| Band C | 11,300 | 9.1 | 16.9 | 21.9 |
| Band D | 4,870 | 3.9 | 9.8 | 15.6 |
| Band E | 1,410 | 1.1 | 6.2 | 9.8 |
| Band F | 320 | 0.3 | 3.0 | 5.2 |
| Band G | 60 | 0.0 | 1.7 | 3.5 |
| Band H | 40 | 0.0 | 0.1 | 0.6 |
Residential Property Prices, Rental Costs and Affordability
House Prices and Affordability
From the Office for National Statistics, the median house prices are considerably lower in Hull compared to the Yorkshire and Humber region and to England (April 2022 to March 2023). The median is the ‘middle’ value when all properties are ranked in order of their price, so the median can represent the typical value for a property.
| Property type | Hull | Y&H | England |
| All house types (£) | 131,000 | 192,500 | 290,000 |
| Detached houses (£) | 235,000 | 338,000 | 440,000 |
| Semi-detached houses (£) | 160,000 | 195,000 | 274,000 |
| Terraced houses (£) | 117,000 | 150,100 | 240,000 |
| Flats or maisonettes (£) | 84,000 | 130,000 | 232,000 |
For all housing types in the last decade from the year ending March 2013 to March 2023, house prices have increased by 46% in Hull compared to 48% for the region and 57% for England. So increases in house prices have been 20% higher in England over the last decade compared to Hull. House prices have increased in Hull by 1.6% in the last year, by 6.5% in the last two years, by 9.2% in the last three years and by 13.9% in the last four years. The increases in Hull have been lower than for England with the exception of three years ago (change from 2020 to 2023) when house price increases were greater in Hull compared to England (6.5% versus 4.3%).
For detached houses, the median price has increased by 38% over the last decade from 2013 to 2023 in Hull compared to 54% across the region and 68% for England, so the increases in England have been 43% higher than in Hull. In the last year, the median house price of detached houses remained the same in Hull but has increased in the last two years (by 4.4%), in the last three years (by 9.3%) and in the last four years (by 17.5%), although the increases across England have been substantially greater for all of these periods (11.1%, 15.0%, 25.7% and 28.7% respectively).
For semi-detached houses, the median price in Hull has increased by 52% in the last decade, although this increase was lower than it was across the region (54%) and in England (64%). The median house price of semi-detached houses in Hull has increased in the last year (by 4.9%), in the last two years (by 13.1%), in the last three years (by 15.1%) and in the last four years (by 22.8%) although increases were greater across England with the exception of two years ago (between 2021 and 2023) when increases were greater in Hull compared to England (13.1% versus 11.8%).
Terraced housing is 48% higher in Hull in 2023 compared to what it was a decade ago in 2013, and whilst increases have been greater across England (57%), the median price increased by slightly more in Hull compared to the region (47%). The median house price for terraced housing in Hull has increased in the last year (by 2.6%), in the last two years (by 11.4%), in the last three years (by 15.7%) and in the last four years (by 17.0%) although on the whole prices have increased by a greater margin in England with the exception of the last two years (between 2021 and 2023) when increases were greater in Hull compared to England (11.4% versus 10.3%).
The median house price for flats or maisonettes has been more inconsistent in Hull. Over the last five years, the median house price for flats or maisonettes in Hull was highest in the year to March 2020 at £91,797, but decreased to £82,000 in 2022, although has increased in the last year to £84,000. In the last decade, the median price for flats or maisonettes in Hull has increased by 20% which is smaller than increases observed across the region (30%) and England (36%). The median house price for flats or maisonettes in Hull increased by 2.4% in the last year and by 11.6% compared to four years ago, but decreased by 0.9% from the price two years ago, and has decreased by 8.5% from the price three years ago. Unlike other housing types, there have not been year-on-year increases across the region or across England for flats and maisonettes, although reductions were quite small. In the last year, the median price for flats or maisonettes has remained the same for the Yorkshire and Humber region.
The Office for Health Improvement & Disparities’ Fingertips includes a measure relating to the affordability of housing. It is a ratio of median house prices to median gross annual residence-based earnings, and a higher ratio denotes that on average, it is less affordable for a resident to purchase a home in their local area. Whilst most people in Hull have relatively low earnings compared to other areas, the property prices are much lower in Hull, and as a result Hull rates relatively well in terms of house affordability.
The ratio for 2024 for Hull is 4.4 which is among the lowest of local authorities across the Yorkshire and Humber region, and around half the ratio for England (7.7). So the ‘typical’ house price in Hull is around four and a half times a person’s ‘typical’ annual earnings in Hull, compared to over eight times higher for England.
Whilst house affordability is much better in Hull, with Hull’s increased levels of deprivation and poverty, owning a house is not possible for many people in Hull.
Compared with benchmark
| Indicator | Period | England | Yorkshire and the Humber region (statistical) | Kingston upon Hull | East Riding of Yorkshire | North East Lincolnshire | North Lincolnshire | York | North Yorkshire UA | Barnsley | Doncaster | Rotherham | Sheffield | Bradford | Calderdale | Kirklees | Leeds | Wakefield |
|---|---|---|---|---|---|---|---|---|---|---|---|---|---|---|---|---|---|---|
Affordability of home ownership (Persons All ages) | 2024 | 7.7 | 5.8 | 4.4 | 6.0 | 4.5 | 4.9 | 8.5 | 7.3 | 4.6 | 4.7 | 5.3 | 5.6 | 5.2 | 4.6 | 5.6 | 6.5 | 5.9 |
The median house price in Hull was £39,950 in 2002 but has increased to £129,100 in 2023 (prices differ from those quoted above as are based on calendar year on Fingertips). There has been a steady increase in house prices in Hull between 2002 and 2008 with a dip subsequently due to the recession and banking crisis at the time with the median house price decreasing by 11.5% in Hull between 2008 and 2009. House prices gradually increased in Hull but it wasn’t until 2014 until the median house price was higher than it had been in 2008. Since then the median house prices has generally increased in Hull. A relatively large increase of just under 5% was observed between 2020 and 2021, and between 2021 and 2022, and it is possible that this was associated with the COVID-19 pandemic. There were relatively few property sales during 2020 and it is possible that demand was greater than supply in 2021 and 2022 increasing the price paid for house sales occurring during those two years. The median price fell between 2022 and 2023 potentially due to the continued cost of living crisis and higher interest rates for mortgages and a more stagnant housing market. However, the inflation rate and Bank of England base interest rate have both reduced recently which should improve the housing market.
The comparison median house prices are not shown in the view below, but are available on Fingertips directly for England and the region. The median house price in 2023 was £290,000 for England and £195,000 for the Yorkshire and Humber region.
The median or ‘typical’ price of a house in Hull was around 2.4 times the annual median income in 2002 but this increased relatively sharply to around 4.5 times the annual income in 2007. With the house prices decreasing slightly after this, affordability improved falling to four times the annual income for 2012 and 2013 before increasing to a high of five times the salary in 2017 and 4.9 times the salary in 2022 which was the second highest ratio since 2002. Between 2022 and 2023, the median house price decreased slightly by 0.7%, but with the high inflation rate and cost of living crisis, there have been higher salary increases which has reduced home affordability slightly. This has also happened in the last couple of years for the region and for England.
Compared with benchmark
Affordability of home ownership (Persons All ages)
|
Period
|
Kingston upon Hull |
Yorkshire and the Humber region (statistical)
|
England
|
||||
|---|---|---|---|---|---|---|---|
|
Count
|
Value
|
95%
Lower CI |
95%
Upper CI |
||||
| 2002 | • | 39950 | 2.4 | - | - | 3.5 | 5.1 |
| 2003 | • | 48500 | 2.8 | - | - | 4.2 | 5.9 |
| 2004 | • | 58950 | 3.3 | - | - | 5.1 | 6.6 |
| 2005 | • | 69000 | 3.6 | - | - | 5.5 | 6.8 |
| 2006 | • | 81995 | 4.2 | - | - | 5.7 | 7.0 |
| 2007 | • | 91000 | 4.5 | - | - | 6.0 | 7.1 |
| 2008 | • | 93750 | 4.4 | - | - | 5.7 | 7.0 |
| 2009 | • | 83000 | 4.1 | - | - | 5.3 | 6.4 |
| 2010 | • | 91000 | 4.3 | - | - | 5.6 | 6.9 |
| 2011 | • | 88500 | 4.2 | - | - | 5.4 | 6.8 |
| 2012 | • | 89000 | 4.0 | - | - | 5.4 | 6.8 |
| 2013 | • | 92000 | 4.0 | - | - | 5.3 | 6.8 |
| 2014 | • | 97000 | 4.4 | - | - | 5.5 | 7.1 |
| 2015 | • | 100000 | 4.4 | - | - | 5.7 | 7.5 |
| 2016 | • | 105000 | 4.5 | - | - | 5.8 | 7.7 |
| 2017 | • | 115000 | 5.0 | - | - | 5.9 | 7.9 |
| 2018 | • | 112500 | 4.8 | - | - | 6.0 | 8.0 |
| 2019 | • | 120000 | 4.7 | - | - | 5.9 | 7.9 |
| 2020 | • | 120000 | 4.8 | - | - | 5.9 | 7.9 |
| 2021 | • | 128000 | 4.9 | - | - | 6.6 | 9.1 |
| 2022 | • | 132000 | 5.0 | - | - | 6.2 | 8.6 |
| 2023 | • | 130000 | 4.5 | - | - | 6.3 | 8.4 |
| 2024 | • | 135000 | 4.4 | - | - | 5.8 | 7.7 |
Source: Office for National Statistics
House affordability when summarised in this way is a reflection of median household income and the median or typical price of a house, so represents a typical picture. The median is the middle value so there will be extremes at both ends of the spectrum in terms of households on high incomes and households on very low incomes, and high cost houses and low cost houses. There will be some households in Hull that are in a better position financially making buying a house easier for them, but for many others the buying a house is not possible. Furthermore, the composition of the household will be influential in terms of both household income and affordability of housing, and this is not taken into account in this measure of house affordability.
This measure of house affordability reflects house prices, but does not measure the access to housing in terms of the rental market. Rents have increased sharply – both nationally and locally – making it difficult for some households to afford to rent. This also impacts on house sales as if more people are renting at a higher cost, then the savings required to ‘get on the property ladder’ is more difficult in the first place.
Cost of Rental Properties
From the Office for National Statistics, the median monthly rental prices for private rentals – calculated from data from the Valuation Office Agency – for the period October 2022 to September 2023 were low in Hull compared to England where prices are skewed by some very high private rental costs particularly in London.
Across the 21 lower-tier local authorities across the Yorkshire and Humber region, the median rental cost of a single room in Hull is ranked 6th highest out of 17 local authorities where rental costs are available although a further four local authorities have the same rental cost of a single room as Hull. The median cost in Hull is £433 per month which is the same as for Doncaster, Rotherham, Wakefield and North East Lincolnshire, but lower than Harrogate (£615), York (£495), Craven (£475), Leeds (£440) and Kirklees (£370). The rent cost of a single room in Hull is much greater than in surrounding East Riding of Yorkshire where the median cost is £325. This could be associated with the Hull University accommodation which is just outside the Hull city boundary.
However, for all other types of accommodation, the median monthly rental cost in Hull is among the lowest across the 21 lower-tier local authorities across the Yorkshire and Humber region. The median monthly rental cost for studios is the lowest out of 15 (six local authorities have no data for studio rental costs), and lowest out of all 21 local authorities for two bedroom and four bedroom rental properties, as well as for all property types, and Hull ranks second lowest out of 21 for one bedroom rental properties and third lowest for three bedroom rental properties.
A room is defined as a non self-contained single room with shared facilities, including bedsits, single rooms in a house or flat shared with other tenants, and single rooms rented from a resident landlord. A studio is a self-contained single-roomed property with own kitchen and bath, shower or toilet facilities. One to four or more bedrooms properties are self-contained properties and include houses, bungalows, flats and maisonettes.
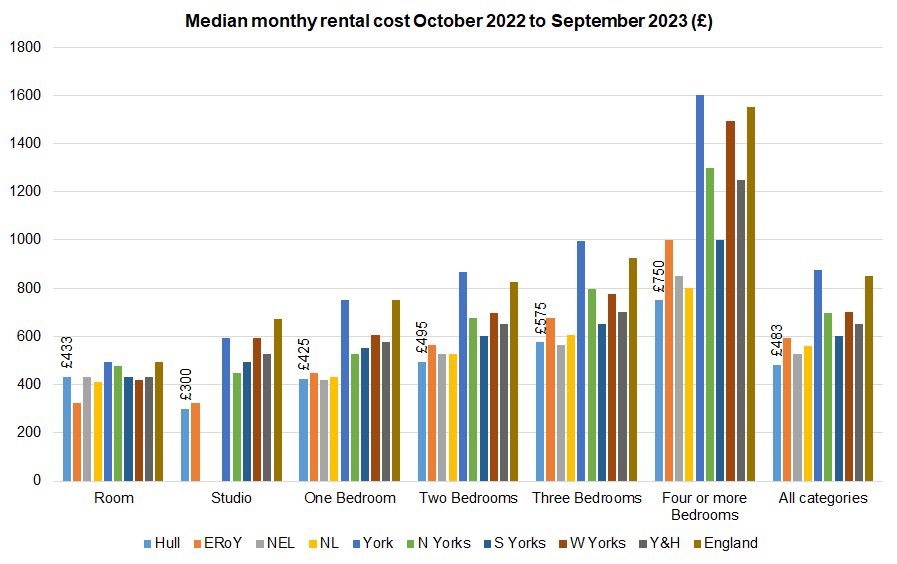
Between the period March 2021 to April 2022 and the period October 2022 to September 2023, the median rental costs had increased for all except studios generally by around 10% or just over. The rental cost of four or more bedroom rental properties has increased the most, by £107 or by 16.6%. This could be associated with supply and demand as there are fewer larger properties in Hull compared to other local authorities, although it also could be that there is more opportunity for charge a higher cost or there is a higher cost for landlords for larger properties.
With the exception of studios where median monthly rental costs have decreased (by 8.5%), these are relatively large increases over an 18 month period.
| Rental type | Median cost Mar 2021 to Apr 2022 (£) | Median cost Oct 2022 to Sep 2023 (£) | Absolute difference (£) | Relative difference (%) |
| Room | 386 | 433 | 47 | 12.2 |
| Studio | 328 | 300 | -28 | -8.5 |
| One bedroom | 385 | 425 | 40 | 10.4 |
| Two bedrooms | 450 | 495 | 45 | 10.0 |
| Three bedrooms | 525 | 575 | 50 | 9.5 |
| Four or more bedrooms | 643 | 750 | 107 | 16.6 |
| All properties | 450 | 483 | 33 | 7.3 |
However, as mentioned earlier in relation to house prices, the relatively cheap rental prices in Hull do not necessarily mean that housing is more affordable. The median represents a typical value and half private rental prices will be lower than this and half will be higher than this. Affordability of rental accommodation will be dependant on household income and family size as well as availability (supply and demand), and this is not fully reflected within the above rental cost data.
Repossessions
The number of repossessions in relation to mortgages and landlords is available in terms of the possession activity in the courts of England and Wales.
The number of properties in Hull (and England & Wales) by tenure was estimated for the period 2003 to 2010 using the estimates from the 2001 and 2011 Censuses assuming that the same proportionate change occurred each year between 2002 and 2011, and this was repeated for years 2012 to 2020 using the estimates from the 2011 and 2021 Censuses, with the change between 2021 and 2024 assumed to be the same as the change between 2020 and 2021, and subsequent years. This will not totally accurate, but will reasonably represent the approximate number of properties in Hull and England & Wales which are owner occupied with a mortgage and which are rented (council, social or private renting).
Mortgage Repossessions
There were a high number of mortgage repossessions during the financial crisis peaking in 2009, and throughout the period 2003 to 2011, the estimated rate of repossessions per 10,000 mortgaged properties was higher in Hull compared to England, although – in general – since then the rate has been higher for England. Rates were lower in Hull compared to England during and just after the pandemic, but are estimated to be higher for 2023.
The rates are given per 10,000 mortgaged properties, and as mentioned number of properties will not be totally accurate.
There were 29 mortgage repossessions in Hull during 2024 which is relatively high after four years of few repossessions, although lower than the number of repossessions prior to the pandemic.
| Year | Hull mortgage repossessions | Hull properties | Hull repossession rate per 10,000 properties | E&W repossession rate per 10,000 properties |
| 2003 | 94 | 35,120 | 26.8 | 8.1 |
| 2004 | 81 | 34,909 | 23.2 | 8.7 |
| 2005 | 90 | 34,698 | 25.9 | 15.8 |
| 2006 | 156 | 34,487 | 45.2 | 26.1 |
| 2007 | 171 | 34,275 | 49.9 | 30.0 |
| 2008 | 229 | 34,064 | 67.2 | 45.5 |
| 2009 | 288 | 33,853 | 85.1 | 41.6 |
| 2010 | 226 | 33,641 | 67.2 | 30.6 |
| 2011 | 207 | 33,430 | 61.9 | 33.3 |
| 2012 | 148 | 32,992 | 44.9 | 26.0 |
| 2013 | 140 | 32,553 | 43.0 | 20.8 |
| 2014 | 84 | 32,115 | 26.2 | 16.0 |
| 2015 | 32 | 31,676 | 10.1 | 7.5 |
| 2016 | 55 | 31,238 | 17.6 | 6.4 |
| 2017 | 41 | 30,800 | 13.3 | 6.0 |
| 2018 | 24 | 30,361 | 7.9 | 5.7 |
| 2019 | 38 | 29,923 | 12.7 | 6.8 |
| 2020 | 6 | 29,484 | 2.0 | 1.6 |
| 2021 | 10 | 29,046 | 3.4 | 1.1 |
| 2022 | 14 | 28,608 | 4.9 | 4.0 |
| 2023 | 24 | 28,170 | 8.5 | 3.7 |
| 2024 | 29 | 27,732 | 10.5 | 5.0 |
Landlord Repossessions
The rates of repossession in relation to landlords is considerably higher than for mortgages. The rates are also given per 10,000 rented properties, and as mentioned number of properties will not be totally accurate.
Between 2003 and 2008, and also in 2013 and 2014, there was a higher rate of landlord repossessions in Hull compared to England, but for 2009 to 2012 and since 2015, the rate of landlord repossessions has been higher in England compared to Hull.
| Year | Hull landlord repossessions | Hull properties | Hull repossession rate per 10,000 properties | E&W repossession rate per 10,000 properties |
| 2003 | 375 | 47,684 | 78.6 | 55.1 |
| 2004 | 293 | 48,550 | 60.4 | 51.6 |
| 2005 | 315 | 49,417 | 63.7 | 49.9 |
| 2006 | 378 | 50,284 | 75.2 | 48.1 |
| 2007 | 328 | 51,151 | 64.1 | 44.8 |
| 2008 | 268 | 52,018 | 51.5 | 43.3 |
| 2009 | 164 | 52,884 | 31.0 | 36.6 |
| 2010 | 184 | 53,751 | 34.2 | 35.6 |
| 2011 | 188 | 54,618 | 34.4 | 39.6 |
| 2012 | 180 | 55,032 | 32.7 | 41.7 |
| 2013 | 189 | 55,446 | 34.1 | 45.7 |
| 2014 | 220 | 55,861 | 39.4 | 50.0 |
| 2015 | 174 | 56,275 | 30.9 | 50.2 |
| 2016 | 192 | 56,689 | 33.9 | 46.7 |
| 2017 | 168 | 57,103 | 29.4 | 40.7 |
| 2018 | 163 | 57,517 | 28.3 | 37.8 |
| 2019 | 172 | 57,932 | 29.7 | 34.2 |
| 2020 | 55 | 58,346 | 9.4 | 8.2 |
| 2021 | 45 | 58,760 | 7.7 | 10.2 |
| 2022 | 84 | 59,174 | 14.2 | 21.0 |
| 2023 | 149 | 59,588 | 25.0 | 26.6 |
| 2024 | 138 | 60,002 | 23.0 | 29.1 |
Due to the Coronavirus Act 2020 and the increased notice required to provide to tenants when seeking possession of residential property between March 2020 and September 2021, the number of repossessions decreased significantly
During the COVID-19 pandemic, due to changes in employment circumstances, it is likely that a higher percentage of households have fallen into arrears with rent and mortgage payments or have fallen even more into arrears than they had been prior to the pandemic. Furthermore, the cost of living crisis which followed the pandemic with the increased cost of energy, food and other products is having a significant negative impact on people’s ability to maintain their accommodation. It is likely that the impact of the cost of living crisis will be felt for some time, and it is possible that the number of repossessions could increase substantially.
The rate of mortgage and landlord repossessions has increased considerably between 2022 and 2023 in Hull, although there has been a smaller increase for England for mortgage repossessions and a reduction in landlord repossessions for England.
Whilst the rates have increased in Hull since the low in 2020 with the strict conditions on repossessions during the pandemic, the rates are generally lower than pre-pandemic levels and this is particularly the case for mortgage repossessions for Hull.
Second Homes
Whether the property is a second home or if the person owns a second home is recorded as part of the Census. A second home is defined as an address (in or out of the UK) where a person stays at for more than 30 days per year that is not their place of usual residence.
The percentage of Hull residents with a second home in the UK is similar to England and across the Yorkshire and Humber region, but the percentage with a second home outside the UK is lower.
| Second home | Hull N | Hull % | Y&H % | England % |
| No second address | 253,880 | 95.1 | 94.7 | 94.6 |
| Second address in UK | 11,498 | 4.3 | 4.4 | 4.1 |
| Second address outside UK | 1,639 | 0.6 | 0.9 | 1.3 |
There is a relatively large difference across Hull’s wards with a higher percentage of residents with second homes in geographical areas close to the University and the city centre, in particular the University ward stands out with one-quarter of its residents having a second address in the UK or outside the UK. One in eight residents of Beverley & Newland ward also have a second address elsewhere.
| Ward | Second address in UK | Second address outside UK |
| Avenue | 4.5 | 0.9 |
| Beverley & Newland | 10.1 | 2.1 |
| Boothferry | 2.6 | 0.3 |
| Bricknell | 5.2 | 0.8 |
| Central | 2.1 | 1.5 |
| Derringham | 3.3 | 0.1 |
| Drypool | 3.0 | 0.7 |
| Holderness | 2.8 | 0.5 |
| Ings | 2.1 | 0.2 |
| Kingswood | 4.1 | 0.3 |
| Longhill & Bilton Grange | 2.5 | 0.1 |
| Marfleet | 2.8 | 0.2 |
| Newington & Gipsyville | 2.6 | 0.6 |
| North Carr | 2.7 | 0.1 |
| Orchard Park | 2.6 | 0.2 |
| Pickering | 2.3 | 0.3 |
| St Andrew’s & Docklands | 2.9 | 1.2 |
| Southcoates | 3.2 | 0.2 |
| Sutton | 2.5 | 0.4 |
| University | 24.0 | 1.6 |
| West Carr | 3.0 | 1.6 |
| Hull | 3.0 | 0.2 |
The main purpose of second homes for Hull residents relate to students and different addresses for parents. Overall, 28% of all second homes relate to students and 39% relate to another parent or guardian’s address.
Compared to the region and England, a higher percentage of residents in Hull have second homes that are another parent or guardian’s address and relate to students, and there is a slightly higher percentage of residents in Hull that have second homes that are armed forces base addresses.
There are fewer residents in Hull who have second homes for when they are working away from home compared to the region and England, and fewer residents of Hull have second homes that are holiday homes.
| Purpose of second home | Hull N | Hull % | Y&H % | England % |
| Armed forces base address | 196 | 1.5 | 1.2 | 1.0 |
| Another address when working away from home | 580 | 4.4 | 4.8 | 5.9 |
| Holiday home | 927 | 7.1 | 13.5 | 14.2 |
| Student’s term-time address | 109 | 0.8 | 0.5 | 0.5 |
| Student’s home address | 3,603 | 27.4 | 24.6 | 20.4 |
| Another parent or guardian’s address | 5,068 | 38.6 | 34.9 | 33.0 |
| Partner’s address | 1,122 | 8.5 | 8.5 | 9.3 |
| Other | 1,527 | 11.6 | 12.1 | 15.8 |
There were differences across the wards which reflect a number of factors in relation to the demographics of the wards. Residents of University and Beverley & Newland wards are more likely to be students and have a second address elsewhere, and specific areas of the city such as St Andrew’s & Docklands and Beverley & Newland are also more likely to have temporary migrant workers and other short-term residents from abroad. Wards with younger populations also might be more likely to have second homes where they live for 30 or more days a year which are parental homes or the homes of partners, whereas residents of less deprived wards or wards with an older population might be more likely to have holiday homes such as caravans where they live for 30 or more days a year.
The wards with the highest and lowest rates of residents with second homes per 1,000 residents is given below:
- Residents of Kingswood (2.3), Marfleet (1.0) and Newington & Gipsyville (0.9) had the highest rates per 1,000 residents who had an armed forces based address elsewhere where they lived for 30 or more days a year whereas University (0.42), St Andrew’s & Docklands (0.36) and Central (0.28) had the lowest rates per 1,000 residents.
- Kingswood (4.4), Avenue (4.0) and Beverley & Newland (3.7) had the highest rates per 1,000 residents who had another address when working away from home, and North Carr (1.28), Longhill & Bilton Grange (0.86) and Marfleet (0.66) had the lowest rates.
- Residents of West Carr (6.0), Beverley & Newland (5.9) and Bricknell (5.4) were the most likely (per 1,000 residents) to have a holiday home where they stayed for 30 or more days a year whereas residents of Central (1.9), Marfleet (1.7) and Orchard Park (1.6) were the least likely to have such a holiday home.
- Residents of Orchard Park (1.4), Marfleet (0.7) and University (0.6) were the most likely to have a student’s term-time address elsewhere (per 1,000 residents) whereas residents of Holderness (0.17), Drypool (0.17) and Kingswood (0.10) were the least likely to have a student’s term-time address elsewhere.
- Residents of University (180), Beverley & Newland (60) and Bricknell (18) were the most likely (per 1,000 residents) to have a student’s home address elsewhere, whereas residents of Sutton (0.37), Boothferry (0.34) and Ings (0.21) were the least likely.
- Residents of University (50), Beverley & Newland (31) and Kingswood (25) were the most likely (per 1,000 residents) to have another parent or guardian’s address elsewhere whereas residents of Central (13.4), Pickering (12.9) and Ings (12.7) were the least likely to have another parent or guardian’s address elsewhere.
- Residents of University (9.2), Avenue (8.3) and Beverley & Newland (7.8) were the most likely (per 1,000 residents) to have a second address of a partner’s where they stayed 30 or more days a year whereas residents of Longhill & Bilton Grange (2.3), North Carr (2.1) and Ings (1.7) were the least likely.
- Residents of Beverley & Newland (12.8), St Andrew’s & Docklands (11.6) and University (9.8) were the most likely (per 1,000 residents) to have a second address elsewhere for other reasons where they lived for 30 or more days a year whereas residents of Orchard Park (2.4), North Carr (2.2) and Ings (2.0) were the least likely to have a second address for other reasons.
Dwellings that are Houses of Multiple Occupancy
Houses of multiple occupation or occupancy (HMOs) are dwellings where unrelated tenants rent their home from a private landlord if at least three unrelated individuals live there, forming one household and the toilet, bathroom or kitchen facilities are shared with other tenants. A HMO is classified as small if three or four unrelated tenants live there, and as large if five or more unrelated tenants live there.
The private rented sector is an important part of the housing market and has undergone rapid growth over the last decade. HMOs form a vital part of this sector, often providing cheaper accommodation for people whose housing options are limited. HMOs are known to be commonly occupied by students but there are also a growing number of young professionals and migrant workers sharing houses and flats. Some HMOs are occupied by the most vulnerable people in our society, and some HMOs were not build for multiple occupancy with an increased risk of overcrowding and fire compared to other households. Initial mandatory licensing of HMOs came into force in 2006, and this has been expanded since then with the aim of improving standards and safety for occupants.
Based on the 2021 Census, there were 918 HMOs in total in Hull representing 0.75% of all dwellings in Hull. Almost seven in ten of these were small HMOs with three or four unrelated individuals living there with 628 households in total representing 0.51% of all households, and there were 290 (0.24%) large HMOs in Hull. There was a very similar percentage of small and large HMOs in England (0.51% and 0.18% respectively).
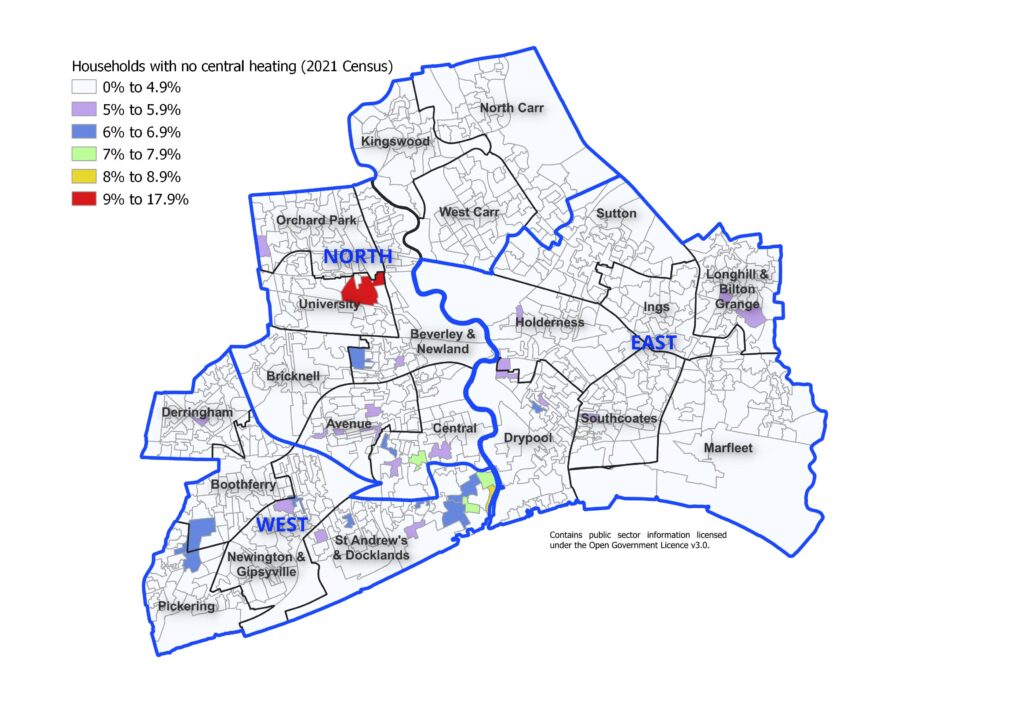
Households With No Central Heating
From the 2021 Census, eight in ten of Hull’s households had mains gas central heating and a further 7.1% had electric central heating and 8.5% had two or more types of central heating (not including renewable energy). This comprised 95.6% of all households. A total of 267 (0.2%) of homes in Hull had two or more types of central heating which included renewable energy.
Overall, 2,093 (1.8%) of households in Hull did not have central heating, and this was slightly higher than both the Yorkshire & Humber region and England (both 1.5%). However, there was considerable variation across Hull. The map below illustrates the percentage of households with no central heating across Hull’s 881 Output Areas (see Glossary for more information on these geographical areas).
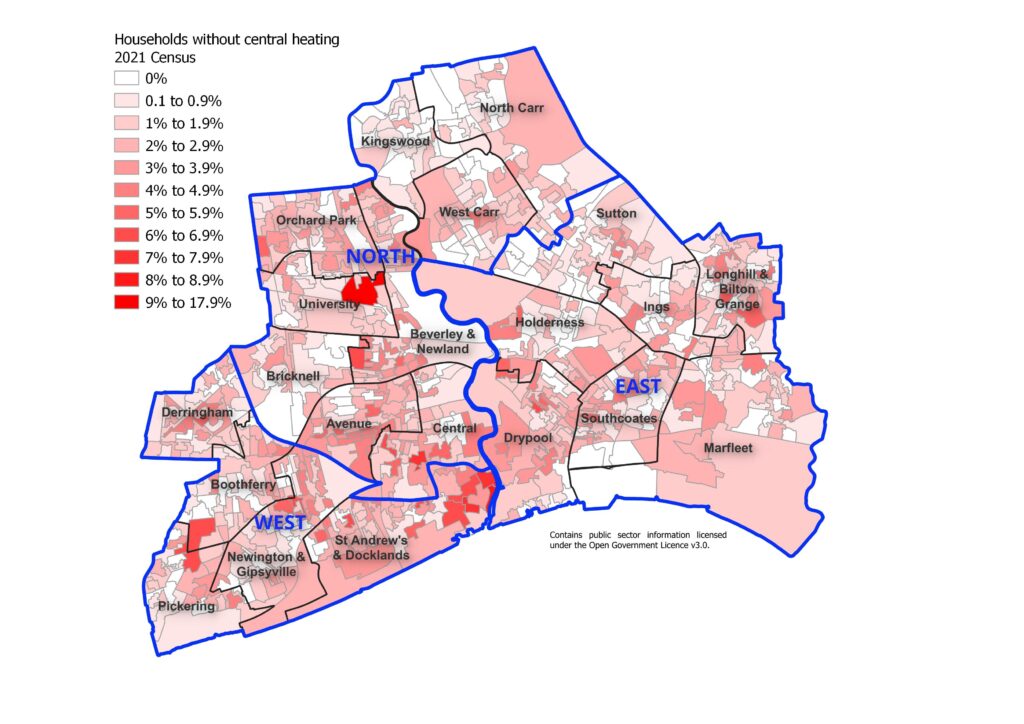
Overall, 18 out of 881 (2.0%) Output Areas had between 5% and 5.9% of households without central heating which included homes within Avenue, Beverley & Newland, Central, Derringham, Drypool, Holderness, Longhill & Bilton Grange, Newington & Gipsyville, Orchard Park, St Andrew’s & Docklands, and Southcoates.
A further nine (1.0%) Output Areas had between 6% and 6.9% of households without central heating which included homes within Beverley & Newland, Boothferry, Central, Pickering, St Andrew’s & Docklands, and Southcoates.
A further three (0.3%) Output Areas had between 7% and 7.9% of households with no central heating and these were located in Central and St Andrew’s & Docklands wards. There was a further 8.7% of households with no central heating in one Output Area within St Andrew’s & Docklands ward.
From Hull’s Output Areas, the highest percentage of households with no central heating occurred in one Output Area located in in University ward where 17.2% of households had no central heating.
Number of Rooms and Overcrowding
The 2021 Census used information on the number of rooms in properties as well as the number of bedrooms in a property. The information was from administrative data from the Valuation Office Agency. As the Census collects information on the number of individuals living in a household and the relationships between those individuals it is possible to ascertain if a household is over-crowded or not.
Definitions
A room was defined as any room in a dwelling apart from bathrooms, toilets, halls or landings, kitchens, conservatories or utility rooms. All other rooms, for example, living rooms, studies, bedrooms, separate dining rooms and rooms that can only be used for storage are including. If two rooms had been converted into one room, then they counted as one room. The number of rooms were recorded by address, and this means that for households living in a shared dwelling the number of rooms are counted for the whole dwelling and not the individual household. The definition is based on the Valuation Office Agency’s definition.
In the 2021 Census, an occupancy rating was given for rooms to classify a household’s accommodation was overcrowded, ideally occupied or under-occupied. It was calculated from comparing the number of rooms the household requires to the number of available rooms. The number of rooms that one-person household requires comprises of two common rooms and one bedroom, and a two-or-more person household requires a minimum of two common rooms and a bedroom for each person inline with the Bedroom Standard.
People should have their own bedroom room according to the Bedroom Standard if they are:
- married or cohabiting couple;
- single parent;
- person aged 16+ years;
- pair of same-sex persons aged 10-15 years;
- persons aged 10-15 years with a person under 10 years of the same sex;
- pair of children aged under 10 years, regardless of their sex;
- persons aged 16+ years who cannot share a room with someone in 4, 5 or 6 above.
There were some adjustments to the information collected within the 2021 Census in relation to the number of rooms as the definitions of a room differed between the Census questionnaire and the Valuation Office Agency’s. The previous Census in 2011 did not use the Valuation Office Agency’s administrative data to define the number or rooms so the results from the 2011 Census are not comparable to the 2021 Census. However, the number of bedrooms used the same definition and the bedroom occupancy rating can be compared between the 2011 and 2021 Censuses.
An occupancy rating is given as follows:
- -1 or less implies that household’s accommodation has one (or more) fewer rooms than required (overcrowded);
- +1 or more implies that the household’s accommodation has one (or more) additional rooms than required (under-occupied); and
- 0 suggests that a household’s accommodation has an ideal number of rooms.
The bedroom occupancy rating is similar but refers to bedrooms rather than all rooms.
Number of Rooms
The number of rooms from the 2021 Census has been grouped into ‘nine or more’ if the property had nine or more rooms, it is not possible to calculate the average number of rooms accurately. However, it is assumed that the average number of rooms for this final category was 10, then it is possible to get an indication of the average number of rooms. If this was undertaken, then the average number of rooms in Hull was 3.9 compared to 4.2 for both the Yorkshire and Humber region and England. The majority of properties in Hull had three or four rooms. As mentioned above, this excludes bathrooms, toilets, halls or landings, kitchens, conservatories and utility rooms
| Number of rooms | Hull N | Hull % | Y&H % | England % |
| 1 | 506 | 0.4 | 0.6 | 1.1 |
| 2 | 11,868 | 10.3 | 8.5 | 10.0 |
| 3 | 32,887 | 28.5 | 24.3 | 23.3 |
| 4 | 39,785 | 34.5 | 31.3 | 27.8 |
| 5 | 22,398 | 19.4 | 21.9 | 22.8 |
| 6 | 5,583 | 4.8 | 8.2 | 8.6 |
| 7 | 1,611 | 1.4 | 3.2 | 3.7 |
| 8 | 497 | 0.4 | 1.2 | 1.5 |
| 9+ | 338 | 0.3 | 0.9 | 1.1 |
Across Hull’s 21 wards, the average number of rooms was between 3.7 and 4.1 (assuming properties with ‘nine or more’ rooms had 10 rooms) for all wards except St Andrew’s & Docklands (3.2), Central (3.4) and Marfleet (3.6) which had slightly fewer rooms per property and University (4.3), Kingswood (4.4) and Bricknell (4.4) which had slightly more rooms per property.
Central areas and more deprived areas of the city (such as St Andrew’s & Docklands, Central and Marfleet) are likely to have smaller households whereas less deprived areas of the city are more likely to have larger households (such as Kingswood and Bricknell) as well as households around the University where students frequently rent single rooms in households often in a house of multiple occupancy (HMO).
Properties in Kingswood (19.2%), Avenue (16.9%) and Bricknell (10.3%) were the most likely to have six or more rooms whereas properties in St Andrew’s & Docklands (32.1%), Central (26.3%) and Avenue (16.9%) were the most likely to have properties with one or two rooms only.
Overcrowded or Under-Occupied in Relation to the Number of Rooms
Compared to England, Hull has fewer overcrowded households but also fewer under-occupied households, and thus a higher percentage of households that have the optimum capacity for the number of rooms.
| Occupancy rating for rooms | Hull N | Hull % | Y&H % | England % |
| +2 (under-occupied) | 42,912 | 37.2 | 46.2 | 45.2 |
| +1 (under-occupied) | 38,182 | 33.1 | 29.2 | 26.8 |
| o (ideal number of rooms) | 28,710 | 24.9 | 19.8 | 21.5 |
| -1 (overcrowded) | 4,857 | 4.2 | 4.0 | 5.3 |
| -2 (overcrowded) | 811 | 0.7 | 0.8 | 1.1 |
Households in Kingswood, Holderness and Bricknell were the most likely to be under-occupied in relation to the number of rooms, and Central, St Andrew’s & Docklands and University were the most likely to be overcrowded. Households in University, Orchard Park and Central were the most likely to be overcrowded with two or more fewer rooms than required.
| Ward | Under occupied | Ideal number of rooms | Overcrowded (-1) | Overcrowded (-2) |
| Avenue | 72.3 | 23.2 | 3.8 | 0.7 |
| Beverley & Newland | 75.5 | 19.0 | 4.6 | 0.8 |
| Boothferry | 78.0 | 19.1 | 2.5 | 0.3 |
| Bricknell | 81.6 | 15.1 | 2.5 | 0.7 |
| Central | 52.9 | 38.7 | 7.0 | 1.4 |
| Derringham | 74.6 | 21.6 | 3.4 | 0.4 |
| Drypool | 74.0 | 22.4 | 3.1 | 0.5 |
| Holderness | 82.5 | 14.5 | 2.6 | 0.4 |
| Ings | 73.2 | 23.7 | 2.8 | 0.3 |
| Kingswood | 85.3 | 12.9 | 1.6 | 0.2 |
| Longhill & Bilton Grange | 65.2 | 29.3 | 4.9 | 0.7 |
| Marfleet | 59.4 | 33.4 | 6.5 | 0.7 |
| Newington & Gipsyville | 71.6 | 22.8 | 4.8 | 0.8 |
| North Carr | 68.0 | 27.1 | 4.5 | 0.4 |
| Orchard Park | 62.0 | 31.5 | 5.0 | 1.6 |
| Pickering | 71.3 | 24.9 | 3.1 | 0.7 |
| St Andrew’s & Docklands | 48.8 | 43.0 | 7.1 | 1.1 |
| Southcoates | 79.1 | 17.6 | 3.0 | 0.3 |
| Sutton | 74.5 | 22.6 | 2.7 | 0.2 |
| University | 71.7 | 20.7 | 5.8 | 1.9 |
| West Carr | 72.0 | 23.5 | 4.0 | 0.5 |
Number of Bedroom Rooms
Compared to England, a similar percentage of households in Hull had one bedroom, but fewer had two bedrooms, and more households in England had four or more bedrooms compared to three for Hull.
| Number of bedrooms | Hull N | Hull % | Y&H % | England % |
| 1 | 13,631 | 11.8 | 9.7 | 11.6 |
| 2 | 38,702 | 33.5 | 27.4 | 27.3 |
| 3 | 50,467 | 43.7 | 43.1 | 40.0 |
| 4+ | 12,672 | 11.0 | 19.7 | 21.7 |
It is not possible to calculate the average number of bedrooms rooms as the ‘four or more’ category has been grouped, however, if it is assumed that the average number of bedrooms for this category is five, then the average number of bedrooms would be 2.6 for Hull compared to 2.9 for both the region and England.
Kingswood had households with the largest average number of bedrooms – again assuming five for the category ‘four or more’ – at 3.7 bedrooms, followed by Bricknell (3.2) and University (3.1). Derringham (2.5), Central (2.4) and St Andrew’s & Docklands (2.1) had the lowest average number of bedrooms.
- Households in St Andrew’s & Docklands (32.6%), Central (29.1%) and Avenue (18.9%) were the most likely to have one bedroom whereas households in Southcoates (5.2%), Kingswood (3.6) and Holderness (3.2) were the least likely to have one bedroom.
- Households in Derringham (47.0%), Drypool (46.5%) and Marfleet (44.4%) were the most likely to have two bedrooms and households in Sutton (23.7%), Kingswood (19.0%) and Bricknell (15.2%) were the least likely to have two bedrooms.
- Households in Bricknell (63.3%), Holderness (56.6%) and West Carr (54.1%) were the most likely to have three bedrooms whereas households in Avenue (29.1%), Central (26.4%) and St Andrew’s & Docklands (20.1%) were the least likely.
- Households in Kingswood (32.3%), Avenue (17.7%) and Ings (16.2%) were the most likely to have four or more bedrooms and households in St Andrew’s & Docklands (5.9%), Southcoates (5.1%) and Derringham (4.9%) were the least likely to have four or more bedrooms.
Overcrowded or Under-Occupied in Relation to the Number of Bedrooms
A higher percentage of households in Hull have the right number of bedrooms based on the relationships, gender and ages of the occupants compared to England, and there are also fewer households in Hull where one additional or two or more additional bedrooms are required.
Of the 309 lower-tier local authorities in England, Hull is ranked 99 in terms of the percentage of household that require more bedrooms. Property prices in Hull are lower than many areas in the country and this will help ensure that residents can afford properties suitable for their household members. With property so much higher, many of the local authorities in London have smaller rankings with a higher percentage of households which require more bedrooms for their household with Newham (21.5%) and Barking & Dagenham (17.8%) having the highest percentages of households in this situation.
A higher percentage of households in Hull require more bedrooms based on the relationship, gender and age of the household members compared to the Yorkshire and Humber region.
| Occupancy rating for bedrooms | Hull N | Hull % | Y&H % | England % |
| +2 (under-occupied) | 31,467 | 27.3 | 37.3 | 35.6 |
| +1 (under-occupied) | 44,889 | 38.9 | 35.7 | 33.2 |
| o (ideal number of rooms) | 34,970 | 30.3 | 24.0 | 26.8 |
| -1 (overcrowded) | 3,625 | 3.1 | 2.5 | 3.6 |
| -2 (overcrowded) | 521 | 0.5 | 0.4 | 0.7 |
There is a considerable difference across Hull’s 21 electoral wards.
Households in University (1.6%), Orchard Park (1.1%) and St Andrew’s & Docklands (0.7%) were the most likely to require two or more bedrooms based on the household occupants, and overall, households in Orchard Park (6.5%), Central (5.8%) and St Andrew’s & Docklands (5.7%) were the most likely to require one or more bedrooms.
| Ward | Excess bedrooms | Ideal number | One more bedroom needed | Two or more bedrooms needed |
| Avenue | 65.3 | 32.9 | 2.3 | 0.6 |
| Beverley & Newland | 70.5 | 25.9 | 3.0 | 0.6 |
| Boothferry | 73.0 | 25.1 | 1.7 | 0.2 |
| Bricknell | 77.6 | 20.5 | 1.2 | 0.6 |
| Central | 46.8 | 47.4 | 5.1 | 0.7 |
| Derringham | 71.8 | 25.8 | 2.3 | 0.1 |
| Drypool | 68.2 | 28.7 | 2.8 | 0.4 |
| Holderness | 79.3 | 19.0 | 1.6 | 0.1 |
| Ings | 72.4 | 25.4 | 2.0 | 0.2 |
| Kingswood | 84.9 | 14.1 | 0.9 | 0.1 |
| Longhill & Bilton Grange | 64.2 | 32.3 | 3.2 | 0.2 |
| Marfleet | 58.3 | 36.5 | 4.9 | 0.3 |
| Newington & Gipsyville | 65.1 | 30.2 | 4.3 | 0.5 |
| North Carr | 62.5 | 33.1 | 4.1 | 0.3 |
| Orchard Park | 58.1 | 35.4 | 5.4 | 1.1 |
| Pickering | 69.1 | 28.3 | 2.2 | 0.4 |
| St Andrew’s & Docklands | 44.3 | 50.1 | 4.9 | 0.7 |
| Southcoates | 70.7 | 26.1 | 2.8 | 0.4 |
| Sutton | 73.1 | 24.9 | 1.9 | 0.1 |
| University | 66.0 | 28.7 | 3.6 | 1.6 |
| West Carr | 71.1 | 26.1 | 2.6 | 0.2 |
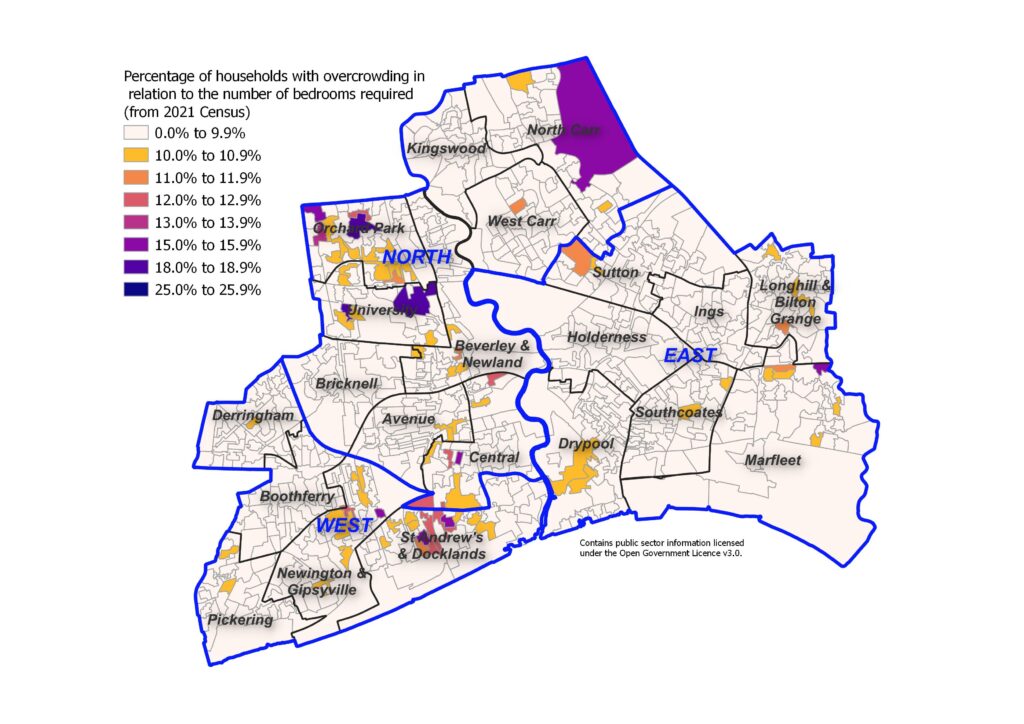
The map illustrates the distribution of the percentage of households in Hull that require one or more bedrooms for their household members based on the relationship, gender and age of those household occupants. The information is given for each of the 881 Output Areas in Hull (see Glossary for more information on these geographical areas).
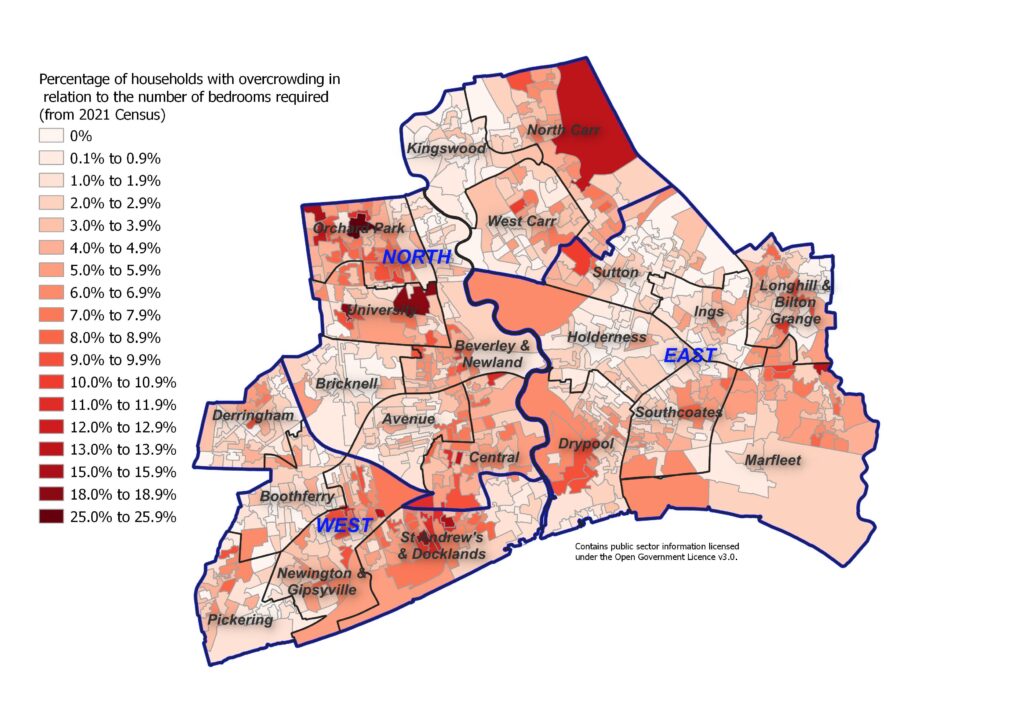
The following map presents the same information but for fewer classifications with Output Areas where fewer than 10% of households require extra bedrooms grouped together. The main areas of the city where a high percentage of households are require one or more extra bedrooms are in Orchard Park, St Andrew’s & Docklands, North Carr and University wards. One Output Area in Orchard Park ward has more than one-quarter of households which require one or more additional bedroom based on the members of the household. Two Output Areas in University and one Output Area in St Andrew’s & Docklands have 18% of households that require one or more extra bedrooms. St Andrew’s & Docklands is the most deprived ward in Hull so – from an initial viewp0int – it is not surprising that there are areas within the wards where there is overcrowded accommodation, however, the most common type of household composition for the majority of Output Areas in St Andrew’s & Docklands is single person households (see below). In a similar way, many of the Output Areas of Orchard Park that have overcrowding levels (less than 10% of households) are in areas where the most common household composition is single person households.
Dimensions of Deprivation
The 2021 Census classified as households as having between zero and four dimensions of deprivation based on education, employment and health status of the household members and housing characteristics such as the household being overcrowded, in a shared dwelling or having no central heating.
On this basis, 34.1% of Hull’s households were classified as having one dimension of deprivation, 18.9% had two dimensions, 5.6% had three dimensions and 0.3% had all four dimensions of deprivation which was higher than England (33.5%, 14.2%, 3.7% and 0.2% respectively).
Overall, 6,452 households had three dimensions of deprivation and 301 had all four dimensions of deprivation, but the distribution differed across the city. Further information can be found within Deprivation and Poverty under Health and Wellbeing Influences.
Household Composition
In the 2021 Census, just over one-third of household were one person households (34.2%) in Hull with around one-third of these people aged 66+ years. Just under one-quarter of households comprised of a married couple or a couple in a civil partnership with or without children (23.9%) which was lower than England (30.4%), with more couples in Hull cohabiting (15.5%) compared to England (11.6%).
Overall, 16.4% of households in Hull comprised single family households (married, civil partnership and cohabiting combined) with no children, 17.4% with dependent children and 5.6% with all non-dependent children.
One in eleven households in Hull (9%) comprised lone parents with dependent children which was higher than England (7%) although there was a similar percentage of households in Hull which comprised lone parents with all non-dependent children (4.4% versus 4.2%).
Around 6% of households in Hull were multiple family households which included households with dependent children, households with full-time students and households where all the people were aged 66+ years.
| Household composition | Hull N | Hull % | Y&H % | England % |
| Single person (66+ years) | 13,982 | 12.1 | 13.3 | 12.8 |
| Single person (<66 years) | 25,464 | 22.1 | 18.2 | 17.3 |
| Single family household all aged 66+ years | 7,294 | 6.3 | 9.5 | 9.2 |
| Married/civil partnership with no children | 10,551 | 9.1 | 11.1 | 10.4 |
| Married/civil partnership with dependent children | 11,915 | 10.3 | 13.1 | 14.4 |
| Married/civil partnership with all non-dependent children | 5,184 | 4.5 | 5.2 | 5.6 |
| Cohabiting with no children | 8,421 | 7.3 | 6.6 | 6.3 |
| Cohabiting with dependent children | 8,224 | 7.1 | 5.1 | 4.5 |
| Cohabiting with all non-dependent children | 1,279 | 1.1 | 0.8 | 0.7 |
| Lone parents with dependent children | 10,460 | 9.1 | 7.2 | 6.9 |
| Lone parents with all non-dependent children | 5,031 | 4.4 | 3.8 | 4.2 |
| Other single family household | 905 | 0.8 | 0.6 | 0.8 |
| Multiple family household with dependent children | 2,529 | 2.2 | 2.2 | 2.7 |
| Multiple family household incl students and aged 66+ years | 4,233 | 3.7 | 3.2 | 4.2 |
| Total | 115,472 | 100 | 100 | 100 |
| All single person households | 39,446 | 34.2 | 31.5 | 30.1 |
| Single or couple households (all 66+ years) | 13,982 | 12.1 | 13.3 | 12.8 |
| Single family households – married / civil partnerships | 27,650 | 23.9 | 29.5 | 30.4 |
| Single family households – cohabiting | 17,924 | 15.5 | 12.5 | 11.6 |
| Single family with no children | 18,972 | 16.4 | 17.7 | 16.8 |
| Single family with dependent children | 20,139 | 17.4 | 18.2 | 18.9 |
| Single family with all non-dependent children | 6,463 | 5.6 | 6.0 | 6.3 |
| Lone parents | 15,491 | 13.4 | 11.0 | 11.1 |
| Other single family households | 905 | 0.8 | 0.6 | 0.8 |
| Multiple family households | 6,762 | 5.9 | 5.4 | 6.9 |
The most common household type is illustrated below for each of Hull’s 881 Output Areas (see Glossary for more information on these geographical areas).
Around the city centre, the most common type of accommodation is households containing one person aged under 66 years with 360 of the 881 (41%) of Output Areas having a higher percentage of single person households aged under 66 years compared to any other household type. This is the case in most Output Areas in St Andrew’s & Docklands, Avenue, Central, Drypool and southern Marfleet, as well as the north-west corner of Beverley & Newland, north and east of Newington & Gipsyville, north Holderness, although there are parts of Pickering, Boothferry, Derringham, Orchard Park, West Carr, Sutton and Longhill & Bilton Grange where single person households (aged under 66 years) is the most common household type.
The student accommodation around the University is evident with the most common type being multiple family households with no children, and there are 14 out of 881 (1.6%) of Output Areas of this type all within University and Beverley & Newland wards.
In the north of the city, in particular in Kingswood and North Carr, the most common household types are single family households with no children or dependent children, although this is also the case in large areas of Holderness, Ings and Sutton to the west, and Bricknell to the west. Overall, 138 (16%) Output Areas had single family households without children as the most common type, and 239 (275) Output Areas had single family households with dependent children as the most common type with only one Output Area had single family households with all non-dependent children as the most common type.
Single person households containing one person aged 66+ years are more scattered throughout the city, and overall there were 88 (10%) Output Areas of this type. They were predominantly in the west of the city in Pickering, Boothferry and Derringham wards, parts of West Carr and in northern Beverley & Newland, and in parts of the east of the city in Sutton, Ings, Southcoates, Marfleet and Longhill & Bilton Grange wards.
There were eight (0.9%) of Output Areas where the most common household composition was single family households containing only people aged 66+ years, and these were in Bricknell, Beverley & Newland, West Carr, Sutton, Drypool and Longhill & Bilton Grange wards.
There were 33 (3.7%) out of 881 Output Areas where lone parents with dependent children was the most common household composition. These were in Pickering, St Andrew’s & Docklands, University, Orchard Park, North Carr, West Carr Ings, Southcoates, Marfleet and Longhill & Bilton Grange wards.
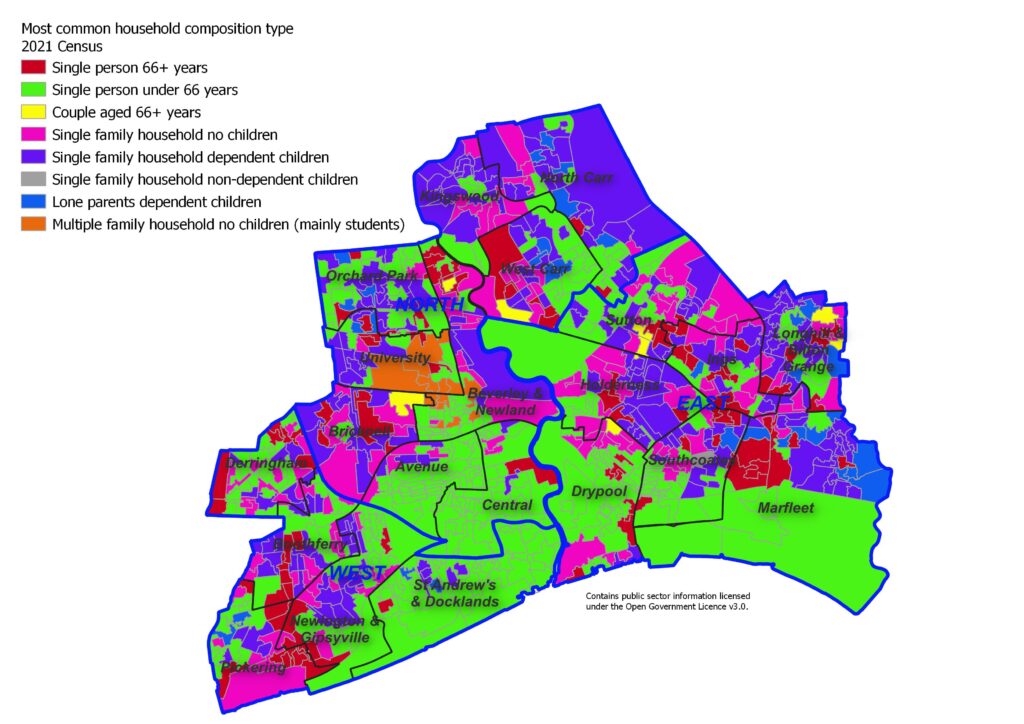
The following map illustrates the areas with the highest concentrations of single person households where the person is aged under 66 years occur are around the city centre in St Andrew’s & Drypool ward although there are also high percentages in parts of Avenue, Central, Drypool, Southcoates, Marfleet and Longhill & Bilton Grange. There are 66 (7.5%) Output Areas where 60% or more of households comprise single person households of people aged under 66 years, and a further 14 (1.6%) households where the percentage of households in the Output Area is 50% to 59.9%.
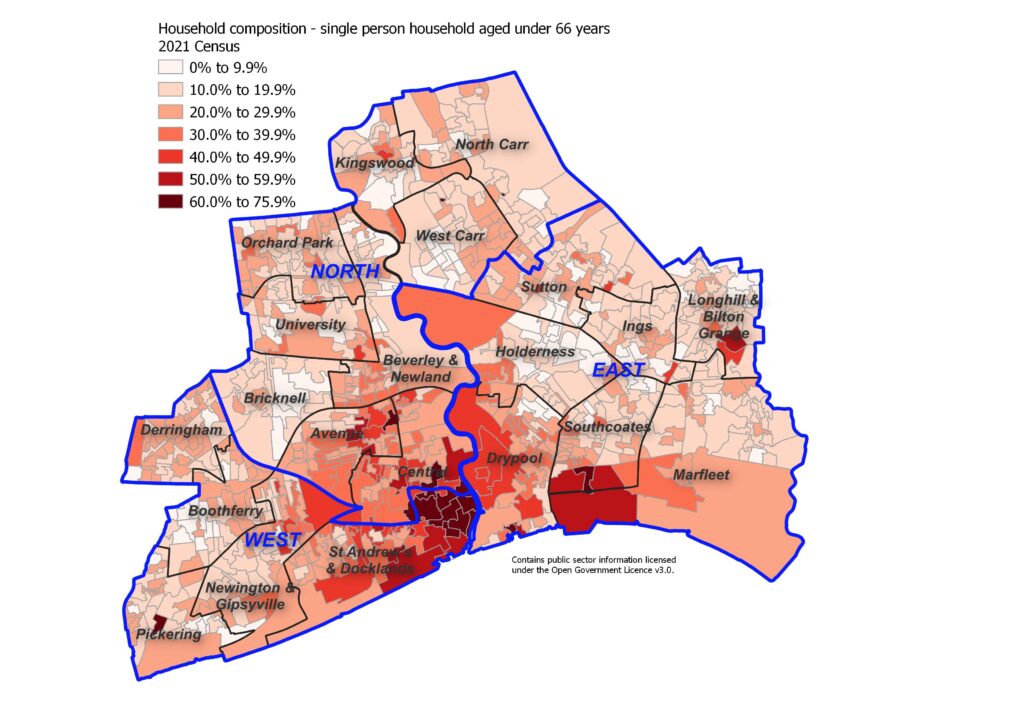
The highest concentrations of single person households where the person is aged 66+ years occur in Boothferry and Derringham wards, around the ward boundary between Pickering and Newington & Gipsyville, and around the ward boundary between Southcoates and Ings. There are six (0.7%) Output Areas where 50% or more of the households in that Output Area comprise single person households of a person aged 66+ years, and a further seven (0.8%) where the percentage is between 40% and 49.9%.
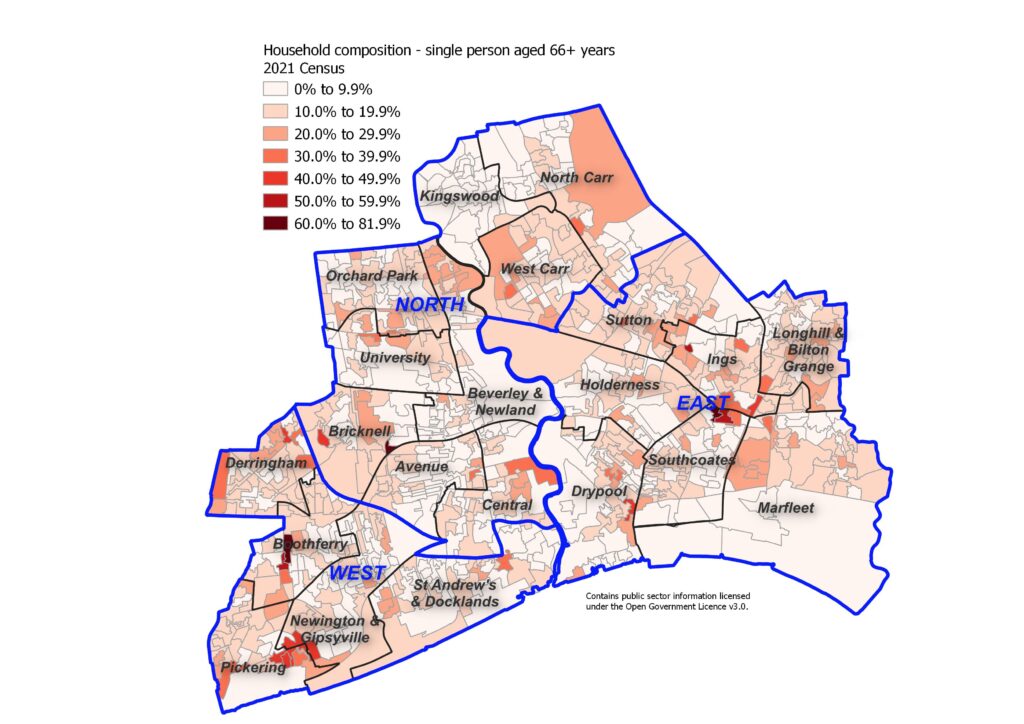
The highest concentrations of single person households where all individuals are aged 66+ years occur in Bricknell, northern Beverley & Newland, west West Carr, Sutton, and parts of Boothferry, Holderness, Pickering, Newington & Gipsyville, and Longhill & Bilton Grange. There are five (0.6%) Output Areas where 25% or more of the households in that Output Area comprise single person households where all individuals are aged 66+ years, and a further 15 (1.7%) where the percentage is between 20% and 24.9%.
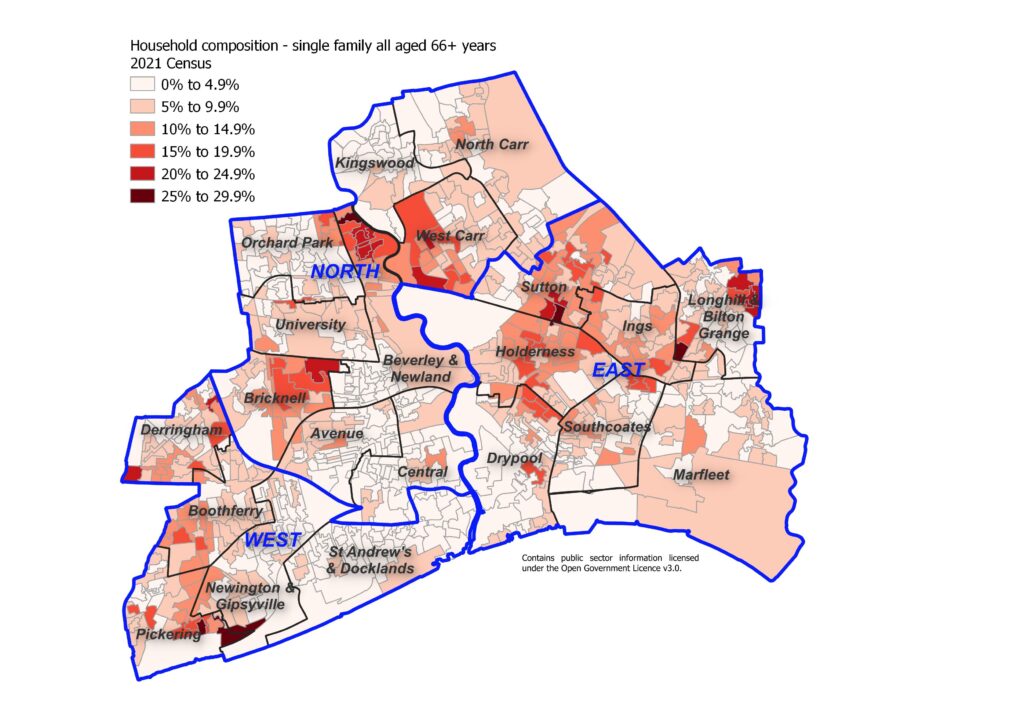
The highest concentrations of people who are married, in civil partnerships or who are cohabiting who have no children occur in Kingswood, Sutton and Holderness, although most areas of the city have relatively high percentages of such households with only Orchard Park, University, Central and parts of St Andrew’s & Docklands having slightly lower concentrations of households. In 16 (1.8%) Output Areas, 30% or more of households comprise single family households with no children, and a further 70 (7.9%) Output Areas have between 25% and 29.9% of this household type.
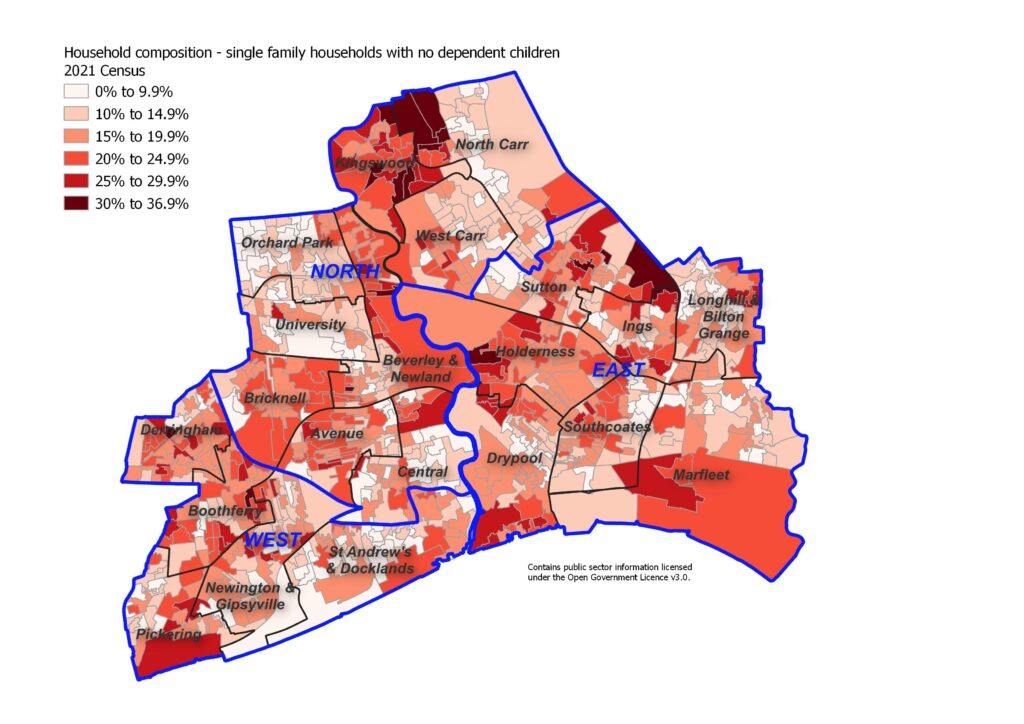
The highest percentage of households with people who are married, in civil partnerships or who are cohabiting who have dependent children occur in Kingswood, North Carr, Orchard Park, Newington & Gipsyville and Longhill & Bilton Grange, although most areas with the exception of the city centre have relatively high concentrations of families with dependent children. Nine (1.0%) Output Areas have 40% or more of the households making up single family households with dependent children, a further 15 (1.7%) where the percentage is between 35% and 39.9% and a further 24 (2.7%) where the percentage of such households is between 30% and 34.9%.
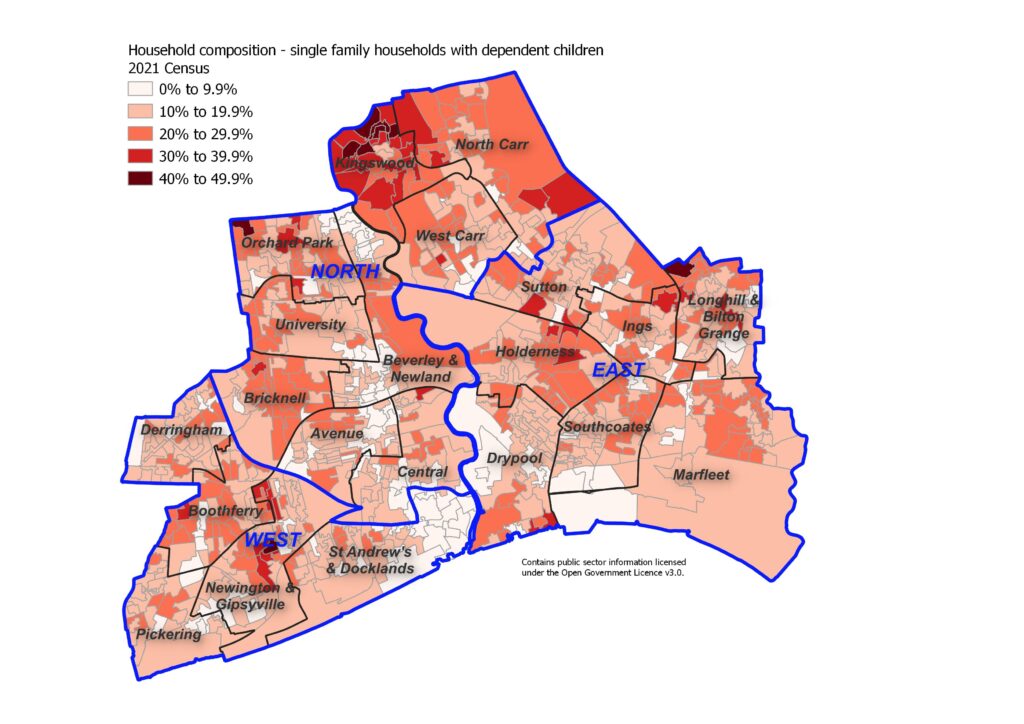
There is less of a difference in the percentage of households with people who are married, in civil partnerships or who are cohabiting who are living with children who are all non-dependent across the city with the highest percentage of 20%. These households are spread throughout the city, but wards nearer the city centre (Central, Drypool, St Andrew’s & Docklands and Avenue) together with Marfleet and Kingswood less likely to have relatively high concentrations of such households.
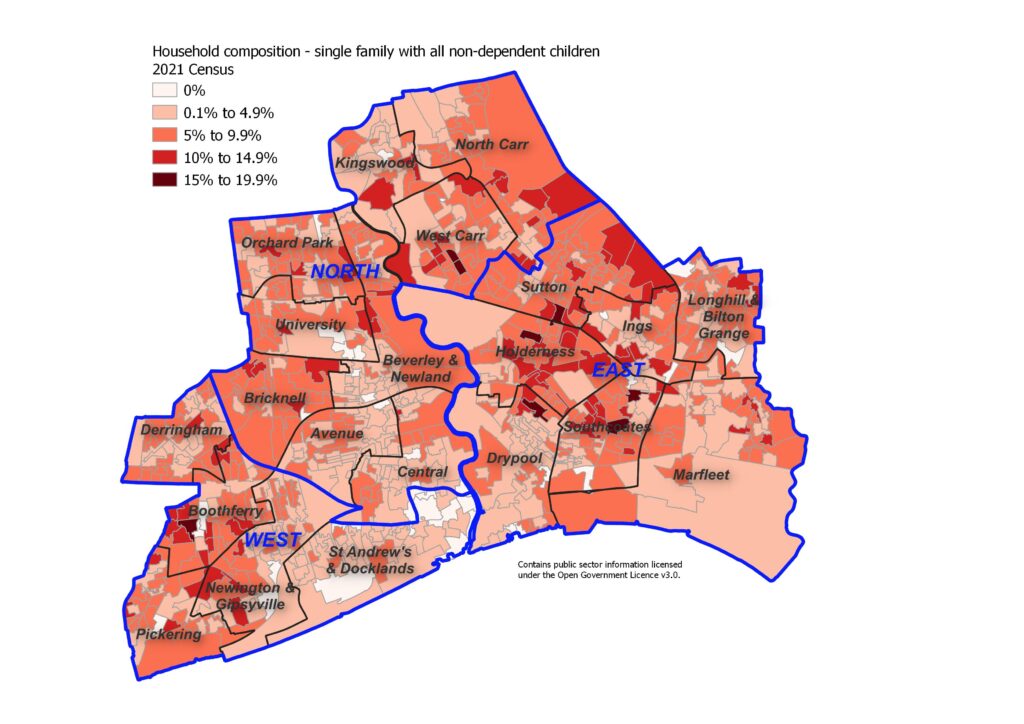
The highest concentrations of lone parents with dependent children occur in Orchard Park, North Carr, Longhill & Bilton Grange and parts of Marfleet and Southcoates wards. There are three (0.3%) Output Areas where 30% or more of all households in the area are lone parent households with dependent children, 10 (1.1%) Output Areas where the percentage of such households is between 25% and 29.9%, and 43 (4.9%) Output Areas where the percentage is between 20% and 24.9%.
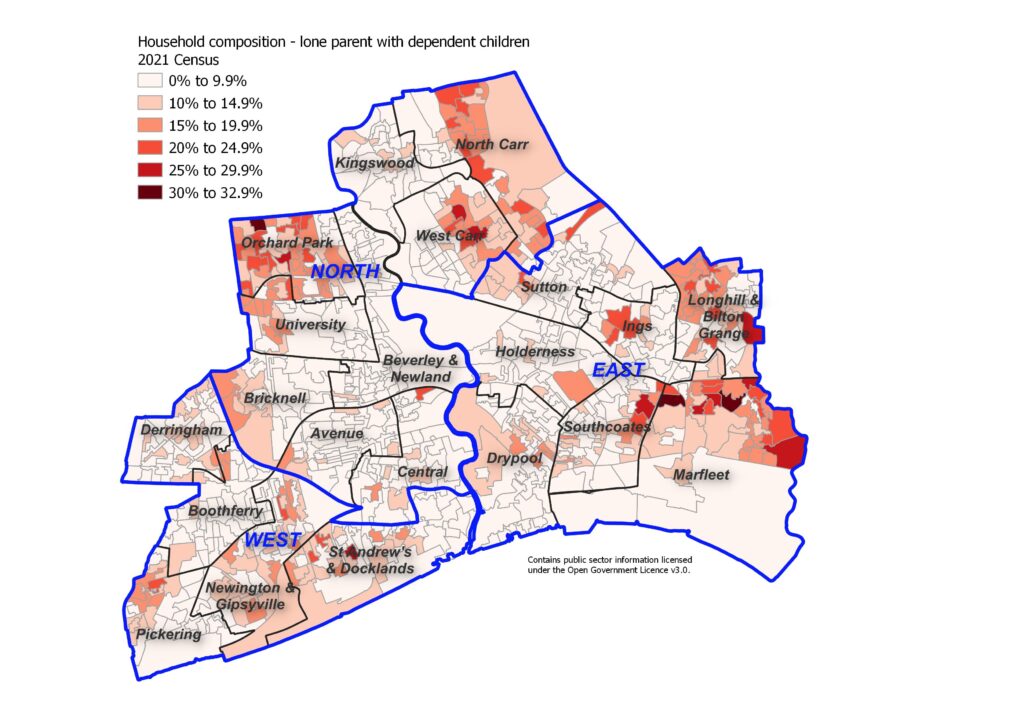
The highest concentrations of multiple family households without children occur around the University with a smaller percentage occurring around the city centre and to the west of the city centre. One Output Area has almost three quarters (74%) of all households of this type, and another has 59% of households of this type with a further three Output Areas having between 40% and 49.9% of households of this type.
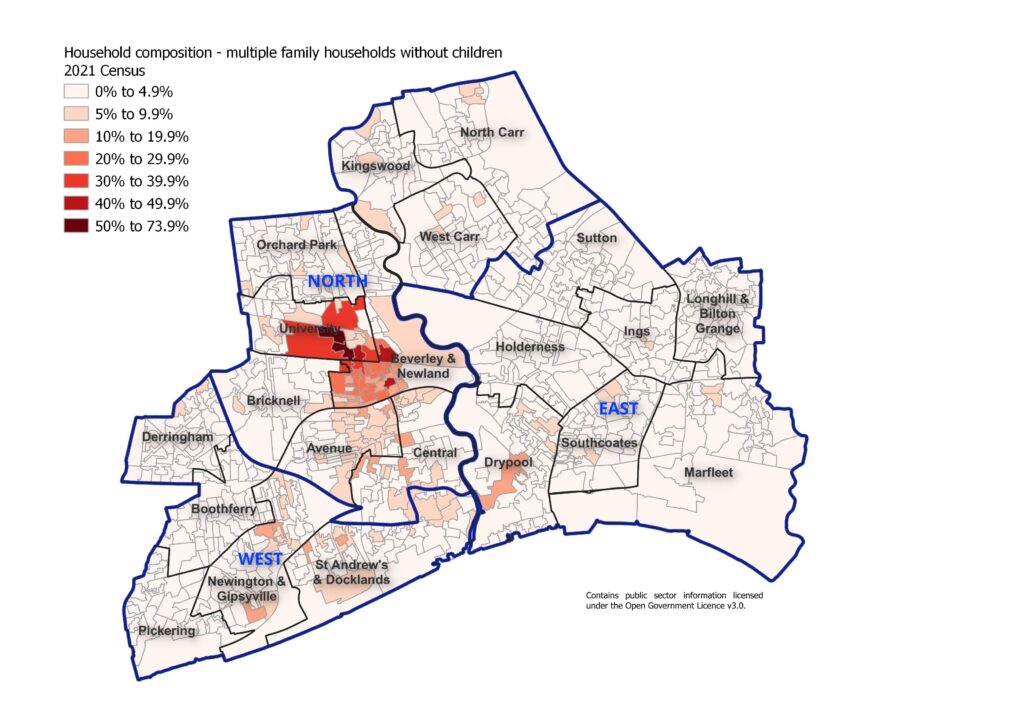
Household Access to Car or Van
The Census also asked how many cars or vans there were in the household. There were fewer households who had access to a car or van in Hull compared to England and the Yorkshire and Humber region, but this is not particularly surprising as there is often less need of a car or van in cities which have better public transport and access to services within walking or cycling distance compared to rural areas.
| Household access to | Hull N | Hull % | Y&H % | England % |
| No cars/vans | 40,476 | 35.1 | 24.2 | 23.5 |
| One car/van | 49,284 | 42.7 | 42.1 | 41.3 |
| Two cars/vans | 21,034 | 18.2 | 25.7 | 26.1 |
| Three or more cars/vans | 4,678 | 4.1 | 8.0 | 9.1 |
There are considerable differences across Hull’s 21 electoral wards with regard to access to a car or van. Over 40% of households in St Andrew’s & Docklands (56%), Central (55%), Orchard Park (44%) and Marfleet (43%) had no access to a car or van whereas fewer than 20% of households had no access to a car or van in Holderness (19%) and Kingswood (6%).
| Ward | No cars/vans | One car/van | Two cars/vans | Thee or more cars/vans |
| Avenue | 37.5 | 44.7 | 14.7 | 3.1 |
| Beverley & Newland | 34.4 | 43.8 | 17.7 | 4.1 |
| Boothferry | 24.7 | 44.9 | 24.3 | 6.2 |
| Bricknell | 21.7 | 45.2 | 26.1 | 7.1 |
| Central | 55.2 | 34.7 | 8.2 | 1.9 |
| Derringham | 25.6 | 48.4 | 21.7 | 4.3 |
| Drypool | 38.4 | 42.5 | 15.7 | 3.4 |
| Holderness | 19.1 | 48.4 | 25.7 | 6.9 |
| Ings | 29.2 | 41.2 | 24.0 | 5.6 |
| Kingswood | 6.0 | 42.3 | 44.0 | 7.8 |
| Longhill & Bilton Grange | 37.2 | 41.0 | 17.6 | 4.1 |
| Marfleet | 43.3 | 41.4 | 12.5 | 2.8 |
| Newington & Gipsyville | 38.4 | 42.6 | 16.0 | 3.0 |
| North Carr | 35.0 | 42.2 | 18.6 | 4.2 |
| Orchard Park | 44.4 | 39.9 | 12.8 | 2.9 |
| Pickering | 33.9 | 43.9 | 18.3 | 3.9 |
| St Andrew’s & Docklands | 56.0 | 35.4 | 7.4 | 1.3 |
| Southcoates | 36.0 | 45.1 | 15.6 | 3.3 |
| Sutton | 27.1 | 42.9 | 24.2 | 5.9 |
| University | 34.0 | 43.3 | 17.9 | 4.7 |
| West Carr | 30.6 | 46.3 | 19.4 | 3.7 |
There is more variation – as expected – when examining smaller geographical areas, but with the same conclusions, in that households in St Andrew’s & Docklands and Central are most likely not to have access to a car or van.
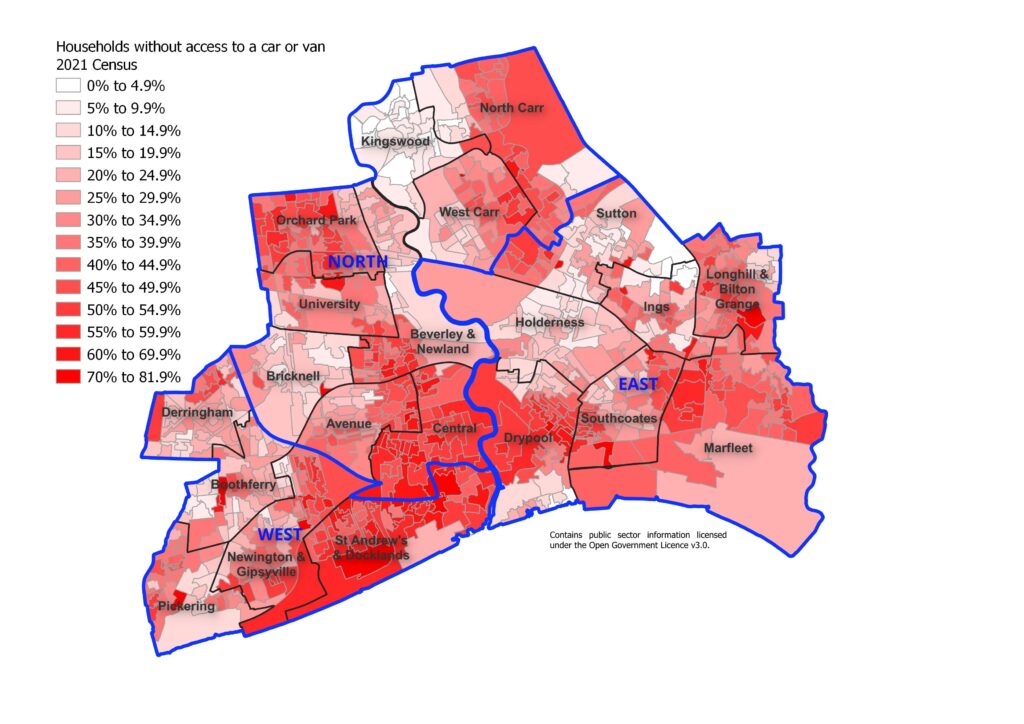
Strategic Need and Service Provision
There is a need to improve the quality and energy efficient status in homes across the city, promote the availability of affordable homes, ensure there is stability in the housing market so people are not forced to move frequently, and reduce overcrowding. There needs to be adequate provision of specialist and adapted housing that is fit for purpose.
The Hull Housing Strategy sets out a three year plan to invest in new homes, improve existing homes and neighbourhoods and sets new priorities. A key part of the strategy is supporting the delivery of new and improved housing as well as working to prevent people becoming homeless and provide support and advice to meet individual needs. The five themes are: (i) housing need; (ii) access to housing; (iii) housing quality; (iv) neighbourhood quality; and (v) neighbourhood renewal and growth.
A Future Housing Needs Strategy is currently underway to inform the refreshed Housing Strategy for 2021-24 and guide investment and set priorities for the future.
In addition, a new ‘Access and Wellbeing’ function within the Housing Directorate from 2020 will place renewed emphasis on health and housing as a strategic priority.
Due to the Coronavirus Act 2020 and the increased notice required to provide to tenants when seeking possession of residential property between March 2020 and September 2021, the number of homeless households in Hull decreased between 2019/20 and 2020/21 as did the number of landlord and mortgage repossessions. However, it is likely due to changes in employment circumstances, that many households have fallen into arrears with rent and mortgage payments or have fallen even more into arrears than they had been prior to the pandemic. Following on from the pandemic, the increased cost of energy, food and other products are having a significant negative impact on people’s ability to maintain their accommodation. Thus the impact of the pandemic and the cost of living crisis are likely to be felt in relation to housing and the security of housing for a considerable time.
Resources
The Office for Health Improvement & Disparities (formerly Public Health England). Homes for Health: Strategies, plans, advice and guidance about the relationship between health and the home. https://www.gov.uk/government/collections/housing-for-health
Hull’s Data Observatory. Housing. https://data.hull.gov.uk/housing
Hull City Council. Housing Strategies and Policies. https://www.hull.gov.uk/housing/housing-regeneration-and-development/housing-strategies-and-policies
Office for National Statistics. Census 2021: Housing. https://census.gov.uk/census-2021-results/phase-one-topic-summaries/housing
Office for National Statistics nomis. 2021 Census topic summaries. https://www.nomisweb.co.uk/sources/census_2021_ts
Private Rental Market Summary Statistics in England: October 2022 to September 2023. https://www.ons.gov.uk/peoplepopulationandcommunity/housing/bulletins/privaterentalmarketsummarystatisticsinengland/october2022toseptember2023
Mortgage and Landlord Possession Statistics. https://mlp-app.apps.alpha.mojanalytics.xyz
Updates
This page was last updated / checked on 2 February 2026.
This page is due to be updated / checked in January 2027.