Index
This topic area covers statistics and information relating to diabetes in Hull including local strategic need and service provision.
This page contains information from the Office for Health Improvement & Disparities’ Fingertips. Information is taken ‘live’ from the site so uses the latest available data from Fingertips and displays it on this page. As a result, some comments on this page may relate to an earlier period of time until this page is next updated (see review dates at the end of this page).
Headlines
- Diabetes is a lifelong condition that causes a person’s blood sugar level to become too high which can have severe detrimental effects on health. There are two main types of diabetes. Type 1 is often diagnosed in childhood and type 2 often diagnosed at older ages. A substantial risk factor for developing type 2 diabetes is obesity. Rates of obesity and type 2 diabetes are increasing in Hull as they are nationally.
- In 2024/25 there were 22,937 patients aged 17+ years registered with Hull GPs who were diagnosed with (type 1 or 2) diabetes representing 9.1% of Hull’s registered population (higher than England at 7.9%), although there could be more people with diabetes but who have not been yet diagnosed, particularly among people from ethnic minorities. There are also significant numbers of people who have pre-diabetes where their blood glucose levels are too high and who are at risk of developing diabetes. In 2024/25, there were 29,591 patients registered with Hull GPs who had non-diabetic hyperglycaemic representing 11.9% of the registered population which is higher than England at 9.2%.
- Over the three year period, 2018/19 to 2020/21, there were 145 minor lower limb amputations (involving toes or foot) and 70 major lower limb amputations (above the foot) in Hull. The rates were both higher in Hull compared to England, and statistically significantly higher for major limb amputations. Furthermore, the rate of major limb amputations has increased over the last couple of years, and combined with a decrease in minor limb amputations may suggest that the severity of the cases of lower limb amputation have increased recently.
- Mortality rates for deaths where diabetes is the underlying cause of death or a secondary or contributory cause of death are very high in Hull. For deaths registered during 2022-24, the rates are not only statistically significantly higher than England but also all other local authorities in the region. Mortality rates have tripled in Hull over the last 20 years compared to rates doubling for England, although it is possible that some of the increase could be related to better recording on the death certificate. There were 314 deaths involving diabetes in Hull that were registered during 2001-03, but this has increased to 1,187 for 2022-24. There were 7,975 deaths in total among Hull residents that were registered during 2022-24, so around 15% of them have diabetes mentioned on the death certificate.
- Diabetes UK estimated that the NHS spend £10 billion a year on diabetes which is 10% of its entire budget, and that one in six people in a hospital bed has diabetes.
The Population Affected – Why Is It Important?
Diabetes is a lifelong condition that causes a person’s blood sugar level to become too high which can have severe detrimental effects on health. What all types of diabetes have in common is that they cause people to have too much glucose (sugar) in their blood. But we all need some glucose. It is what gives us our energy. If you don’t have diabetes, your pancreas senses when glucose has entered your bloodstream and releases the right amount of insulin, so the glucose can get into your cells. But if you have diabetes, this system doesn’t work.
There are two main types of diabetes – type 1 diabetes and type 2 diabetes. The charity Diabetes UK states that there are 3.9 million people who have been diagnosed with diabetes in the UK and in addition there are almost a million people living with type 2 diabetes who don’t know they have it because they haven’t been diagnosed yet, bringing the total number up to more than 4.8 million people (around one in fifteen people). Numbers have doubled in the last 20 years. Additionally, many more people have blood sugar levels above the normal range, but not high enough to be diagnosed as having diabetes. This is sometimes known as pre-diabetes. If blood sugar level is above the normal range, the risk of developing full-blown diabetes is increased. It is very important for diabetes to be diagnosed as early as possible because it will get progressively worse if left untreated. In type 1 diabetes, the body’s immune system attacks and destroys the cells that produce insulin. As no insulin is produced, the glucose levels in the body increase, which can seriously damage the body’s organs. People with diabetes have an increased risk of cardiovascular disease (heart attacks, heart failure and strokes), kidney disease, sight loss, and lower limb amputations. As well as increased death through an increased risk of cardiovascular and kidney disease, there is a more direct risk through diabetic ketoacidosis.
Diabetes UK state that people with diabetes when compared with people without diabetes are nearly 2.5 times more likely to have a heart attack, more than 2.5 times likely to experience heart failure, and twice as likely to have a stroke, 20 times more likely to suffer an amputation, 1.5 times more likely to get glaucoma, twice as likely to get cataracts (both of which can lead to sight loss), and five times more likely to need either kidney dialysis or a kidney transplant. Having diabetes can also adversely affect mental health and emotional wellbeing.
Type 1 diabetes is often known as insulin-dependent diabetes. It’s also sometimes known as juvenile diabetes or early-onset diabetes because it usually develops before the age of 40, often during the teenage years. Type 2 diabetes is where the body doesn’t produce enough insulin, or the body’s cells don’t react to insulin. This is known as insulin resistance. In the UK, around 90% of all adults with diabetes have type 2 diabetes. Control of symptoms may be managed through healthy eating, exercising regularly, and monitoring blood glucose levels, although eventually medication may be required. During pregnancy, some women develop gestational diabetes (affecting up to 18% of women during pregnancy). People with pre-diabetes have an increased risk of developing type 2 diabetes.
Early diagnosis is essential. Diabetes UK estimated that complications can begin five or six years before some people actually find out they have type 2 diabetes, and that six in ten people have no symptoms when they are diagnosed with diabetes. They estimate that one in three people diagnosed with type 2 diabetes will have complications with their eyes, feet, kidneys or nerves by the time they are diagnosed with type 2 diabetes.
Obesity, family history, ethnicity, high blood pressure, poor diet and lack of physical activity are the main key risk factors for type 2 diabetes. For women, having had gestational diabetes in pregnancy also increases the risk of type 2 diabetes (to about 30% versus 10% for the general population). The effects of diabetes can be made worse by smoking. With the ageing population and the increasing trends in the prevalence of obesity, it is anticipated that the number of people with diabetes will increase. People from south Asian and people from black backgrounds are two to four times more likely to develop type 2 diabetes compared to people from white backgrounds.
Diabetes UK estimates that the NHS spend £10 billion a year on diabetes which is 10% of its entire budget, and that one in six people in a hospital bed has diabetes. They estimate that people with diabetes are twice as likely to be admitted to hospital then people without diabetes.
The diagnosed prevalence of diabetes can be examined from data collected as part of the Quality and Outcomes Framework within primary care. Quality of care indicators are also included, and it means that high percentage of the patients diagnosed with diabetes have annual reviews which gives medical staff the opportunity to provide information and encourage their patients to improve their lifestyle behaviours to improve their health, and lower their risk of morbidity and mortality from their condition. Local analysis of the QOF data has been completed with prevalence calculated for each GP practice and Primary Care Network group.
The Hull Picture
Number of People With Diabetes
The percentage of people from minority ethnic groups is relatively low in Hull compared to England, and Hull’s population is relatively young compared to the England average so the prevalence of diabetes would be expected to be lower, but this is counter-balanced by Hull’s high levels of deprivation and higher levels of unhealthy lifestyle behaviours and obesity which increase the risk of developing diabetes.
The Office for Health Improvement & Disparities’ Fingertips gives the percentage of patients registered with Hull GPs who are diagnosed with diabetes among those aged 17+ years. In 2024/25, there were 22,937 patients aged 17+ years registered with Hull GPs (03F) who had been diagnosed with diabetes representing 9.1% of the registered population aged 17+ years. This was higher than England at 7.9% and the average across the Humber and North Yorkshire Integrated Care Board (ICB) at 8.2%. In 2024/25, there were 29,591 patients registered with Hull GPs who had non-diabetic hyperglycaemic representing 11.9% of the registered population which was higher than England (9.2%), and higher than the Humber and North Yorkshire ICB (10.8%).
Compared with benchmark
| Indicator | Period | England | NHS Humber and North Yorkshire Integrated Care Board - QOQ | Humber and North Yorkshire ICB - 02Y | Humber and North Yorkshire ICB - 03F | Humber and North Yorkshire ICB - 03H | Humber and North Yorkshire ICB - 03K | Humber and North Yorkshire ICB - 03Q | Humber and North Yorkshire ICB - 42D |
|---|---|---|---|---|---|---|---|---|---|
Diabetes: QOF prevalence (Persons 17+ yrs) | 2024/25 | 7.9 | 8.2 | 9.3 | 9.1 | 8.8 | 9.0 | 5.8 | 7.8 |
Non-Diabetic Hyperglycaemia (NDH): QOF prevalence (Persons 18+ yrs) | 2024/25 | 9.2 | 10.8 | 14.4 | 11.9 | 8.1 | 7.9 | 6.4 | 11.9 |
The prevalence of diabetes among those aged 17+ years has progressively increased over time. Between 2012/13 and 2014/15, the increases were at a similar rate in Hull as those for England, but between 2014/15 and 2017/18 the increases were slightly larger in Hull. As a result, the diagnosed prevalence in Hull has been consistently higher than England since 2015/16.
Compared with benchmark
Diabetes: QOF prevalence (Persons 17+ yrs)
|
Period
|
Humber and North Yorkshire ICB - 03F |
NHS Humber and North Yorkshire Integrated Care Board - QOQ
|
England
|
||||
|---|---|---|---|---|---|---|---|
|
Count
|
Value
|
95%
Lower CI |
95%
Upper CI |
||||
| 2012/13 | • | 14122 | 6.1% | 6.0% | 6.2% | - | 6.0% |
| 2013/14 | • | 14403 | 6.2% | 6.1% | 6.3% | - | 6.2% |
| 2014/15 | • | 14749 | 6.3% | 6.2% | 6.4% | - | 6.4% |
| 2015/16 | • | 15817 | 6.7% | 6.6% | 6.8% | - | 6.5% |
| 2016/17 | • | 16717 | 6.8% | 6.7% | 6.9% | - | 6.7% |
| 2017/18 | • | 17189 | 7.2% | 7.1% | 7.3% | - | 6.8% |
| 2018/19 | • | 17814 | 7.4% | 7.3% | 7.5% | - | 6.9% |
| 2019/20 | • | 18308 | 7.6% | 7.5% | 7.7% | 7.1% | 7.1% |
| 2020/21 | • | 18596 | 7.7% | 7.6% | 7.8% | 7.1% | 7.1% |
| 2021/22 | • | 19384 | 7.9% | 7.8% | 8.0% | 7.3% | 7.3% |
| 2022/23 | • | 20187 | 8.1% | 8.0% | 8.2% | 7.6% | 7.5% |
| 2023/24 | • | 21228 | 8.4% | 8.3% | 8.6% | 7.9% | 7.7% |
| 2024/25 | • | 22937 | 9.1% | 9.0% | 9.2% | 8.2% | 7.9% |
Source: NHS England
Non-diabetic hyperglycaemic was measured for the first time in 2020/21, and as it is a relatively new indicator, it is anticipated that the numbers will increase over time as practices go through their patient records and update the indicator. This appears to have occurred for both Hull and England, with the rates in Hull more than tripling between 2020/21 and 2024/25.
Compared with benchmark
Non-Diabetic Hyperglycaemia (NDH): QOF prevalence (Persons 18+ yrs)
|
Period
|
Humber and North Yorkshire ICB - 03F |
NHS Humber and North Yorkshire Integrated Care Board - QOQ
|
England
|
||||
|---|---|---|---|---|---|---|---|
|
Count
|
Value
|
95%
Lower CI |
95%
Upper CI |
||||
| 2020/21 | • | 7847 | 3.3% | 3.2% | 3.4% | 5.1% | 5.3% |
| 2021/22 | • | 13901 | 5.7% | 5.7% | 5.8% | 6.2% | 6.1% |
| 2022/23 | • | 18818 | 7.7% | 7.6% | 7.8% | 7.7% | 7.1% |
| 2023/24 | • | 22765 | 9.2% | 9.1% | 9.3% | 9.2% | 8.2% |
| 2024/25 | • | 29591 | 11.9% | 11.8% | 12.0% | 10.8% | 9.2% |
Source: NHS England
From the local analysis of the national Quality and Outcomes Framework datasets, there was a statistically significant association between average age of the practice patients and the prevalence of diagnosed diabetes across the 25 practices in Hull for 2024/25. If the practices were divided into five approximately equal sized groups based on average age of patients (with each fifth having approximately one-fifth of the total registered patients in Hull) then the prevalence increased from 7.0% for the practices serving the youngest practice patients to 10.3% for the practices serving the oldest practice patients. For every increase in the average age of the patients of 10 years, the prevalence of diabetes increased by 3.6 percentage points. Further analysis of diagnosed disease by the average age of practice patients is within the file above and within Local Analysis of Quality and Outcomes Framework Data.
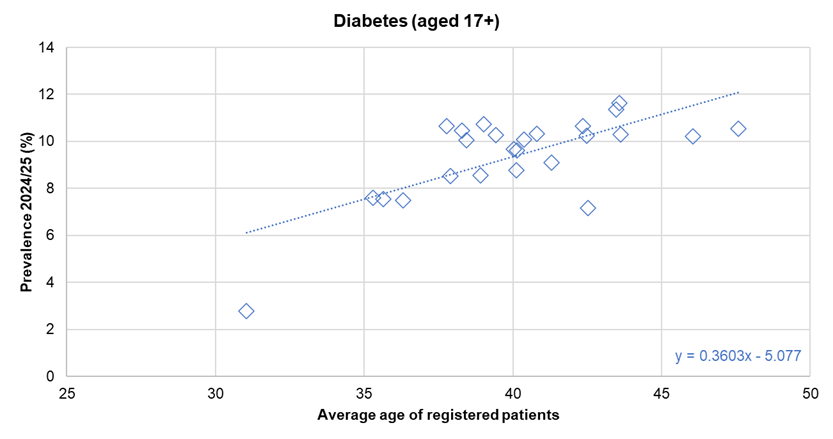
There was no statistically significant association between the prevalence of diagnosed diabetes and the average deprivation score of registered patients (using the Index of Multiple Deprivation 2025) across the 25 practices.
Projected Numbers With Diabetes
The Projecting Adult Needs and Service Information (PANSI) and the Projecting Older People Population Information Service (POPPI) provide current estimates and future projections at local authority level of the number of people with different health needs for those aged 16-64 and 65+ years respectively.
They use estimates for the estimated prevalence from different surveys and research which have generally been derived at a national level (generally different prevalence estimates for different age groups for men and women separately). They then apply these prevalence figures to Hull’s population. For instance, if the prevalence among males in England in a specific age group is 5% and there are an estimated 500 men living in Hull in that age groups, they would estimate there were 25 men in that age group living in Hull with that condition. For many conditions, there is an increased prevalence in populations with higher levels of deprivation, and in most cases, deprivation is not taken into consideration. Thus in many cases, these estimates for Hull are likely to underestimate the numbers in Hull due to the high levels of deprivation in Hull.
Further definitions are available from www.pansi.org.uk and www.poppi.org.uk.
Combining the information from these sources, it is estimated that almost 14,000 people have type 1 or type 2 diabetes who are aged 18+ years, and this is projected to increase by 12% to more than 15,000 people by 2045.
| Age | 2025 | 2030 | 2035 | 2040 | 2045 |
| 18-24 | 250 | 273 | 272 | 256 | 236 |
| 25-34 | 519 | 473 | 480 | 502 | 497 |
| 35-44 | 1,023 | 1,087 | 1,066 | 1,020 | 1,034 |
| 45-54 | 1,862 | 1,878 | 2,071 | 2,209 | 2,177 |
| 55-64 | 3,508 | 3,304 | 3,022 | 3,074 | 3,399 |
| 18-64 | 7,163 | 7,015 | 6,912 | 7,060 | 7,344 |
| 65-74 | 3,279 | 3,593 | 3,702 | 3,501 | 3,245 |
| 75+ | 3,331 | 3,634 | 4,014 | 4,528 | 4,803 |
| 65+ | 6,610 | 7,227 | 7,716 | 8,029 | 8,048 |
| All 18+ | 13,773 | 14,242 | 14,628 | 15,089 | 15,392 |
Quality of Care Indicators Among People With Diabetes
There are also quality of care measures which are part of the Quality and Outcomes Framework, and the percentage of registered patients receiving eight of these health checks and the clinical levels achieved were previously available on on Fingertips at sub Integrated Care Board level. However, this is no longer the case.
Patients should have a blood glucose check (all ages), and those aged 12+ years should also have a cholesterol check, blood pressure check, serum creatinine test, urinary albumin test, and an annual foot check as well as having their body mass index and smoking status recorded. The percentage of patients recorded as having all eight checks undertaken (all ages) is also recorded (“all checks” among those aged under 12 years denotes having their blood glucose check only as the others are not recommended for under 12s).
When the information was available on Fingertips at sub-ICB level for 2021/22, a statistically significantly lower percentage of patients in Hull with diabetes had all eight tests compared to England for patients with type 1 diabetes (32.6% versus 35.2%) and patients with type 2 diabetes (44.3% versus 47.9%). The percentage had also been statistically significantly lower in Hull compared to England between 2018/19 and 2021/22 for people with type 1 diabetes and the entire period between 2014/15 and 2021/22 for people with type 2 diabetes. So significantly numbers of patients with diabetes are not having all of their reviews and checks which could impact on their health outcomes.
Foot Disease and Lower Limb Amputations
Lower limb amputation is a serious potential consequence of diabetes, and Fingertips gives information on the number of hospital stays for diabetic foot disease (per 10,000 patients with diabetes), and the rate of lower limb amputations per 10,000 patients with diabetes.
Over the three year period 2018/19 to 2020/21, Hull had a slightly higher rate of hospital spells for diabetic foot disease per 10,000 diabetic patients compared to England, but the difference was not significantly higher (03F).
However, the rate of minor diabetic lower limb amputations involving toes, the foot and up to the ankle was higher in Hull compared to England (23.1 versus 20.9 per 10,000 diabetic patients), and the rate of major diabetic lower limb amputations involving the hip to below the knee in Hull was statistically significantly higher than England (10.5 versus 7.7 per 10,000 diabetic patients).
Compared with benchmark
| Indicator | Period | England | NHS Humber and North Yorkshire Integrated Care Board - QOQ | Humber and North Yorkshire ICB - 02Y | Humber and North Yorkshire ICB - 03F | Humber and North Yorkshire ICB - 03H | Humber and North Yorkshire ICB - 03K | Humber and North Yorkshire ICB - 03Q | Humber and North Yorkshire ICB - 42D |
|---|---|---|---|---|---|---|---|---|---|
Hospital spells for foot disease for people with diabetes (Persons 17+ yrs) | 2018/19 - 20/21 | 161.9 | 179.8 | 179.3 | 164.5 | 135.3 | 172.6 | 210.2 | 193.6 |
Minor lower-limb amputation procedures for people with diabetes (Persons 17+ yrs) | 2018/19 - 20/21 | 20.9 | 23.3 | 25.5 | 23.1 | 20.1 | 29.0 | 19.4 | 21.1 |
Major lower-limb amputation procedures for people with diabetes (Persons 17+ yrs) | 2018/19 - 20/21 | 7.7 | 7.8 | 7.9 | 10.5 | 7.5 | 8.2 | 6.2 | 6.2 |
Since 2013/14-2015/16, the rate of hospital spells for diabetic foot disease among people aged 17+ years has been increasing in Hull with the exception of the most recent period (perhaps due to the pandemic), with the increases, and most recent decrease, in line with those observed for England and the local ICB.
There are around 900 hospitals spells for diabetic foot disease each financial year among patients registered with Hull GPs.
Compared with benchmark
Hospital spells for foot disease for people with diabetes (Persons 17+ yrs)
|
Period
|
Humber and North Yorkshire ICB - 03F |
NHS Humber and North Yorkshire Integrated Care Board - QOQ
|
England
|
||||
|---|---|---|---|---|---|---|---|
|
Count
|
Value
|
95%
Lower CI |
95%
Upper CI |
||||
| 2010/11 - 12/13 | • | 626 | 154.4 | 142.5 | 167.0 | - | 122.7 |
| 2011/12 - 13/14 | • | 621 | 147.1 | 135.7 | 159.1 | - | 126.1 |
| 2012/13 - 14/15 | • | 636 | 147.0 | 135.8 | 158.9 | - | 129.5 |
| 2013/14 - 15/16 | • | 613 | 136.3 | 125.7 | 147.5 | - | 138.2 |
| 2014/15 - 16/17 | • | 686 | 145.1 | 134.4 | 156.4 | - | 145.5 |
| 2015/16 - 17/18 | • | 812 | 163.3 | 152.3 | 174.9 | - | 156.6 |
| 2016/17 - 18/19 | • | 935 | 180.8 | 169.6 | 192.9 | - | 163.2 |
| 2017/18 - 19/20 | • | 980 | 183.8 | 172.7 | 195.9 | 185.4 | 171.8 |
| 2018/19 - 20/21 | • | 900 | 164.5 | 154.1 | 175.8 | 179.8 | 161.9 |
Source: NHS England, multiple sources
There were 145 minor diabetic lower limb amputations in Hull in the three year period 2018/19 to 2020/21, and the rate has increased slightly between 2013/14-2015/16 to 2016/17-2018/19, although has decreased over the last two years.
Compared with benchmark
Minor lower-limb amputation procedures for people with diabetes (Persons 17+ yrs)
|
Period
|
Humber and North Yorkshire ICB - 03F |
NHS Humber and North Yorkshire Integrated Care Board - QOQ
|
England
|
||||
|---|---|---|---|---|---|---|---|
|
Count
|
Value
|
95%
Lower CI |
95%
Upper CI |
||||
| 2010/11 - 12/13 | • | 126 | 25.4 | 20.9 | 30.5 | - | 19.5 |
| 2011/12 - 13/14 | • | 128 | 25.1 | 20.6 | 30.1 | - | 20.1 |
| 2012/13 - 14/15 | • | 124 | 23.2 | 19.3 | 27.7 | - | 20.4 |
| 2013/14 - 15/16 | • | 113 | 20.7 | 17.0 | 25.0 | - | 21.0 |
| 2014/15 - 16/17 | • | 131 | 22.6 | 18.8 | 26.9 | - | 21.2 |
| 2015/16 - 17/18 | • | 152 | 24.6 | 20.8 | 29.0 | - | 21.5 |
| 2016/17 - 18/19 | • | 165 | 26.4 | 22.3 | 30.9 | - | 22.0 |
| 2017/18 - 19/20 | • | 160 | 25.6 | 21.5 | 30.2 | 24.8 | 22.1 |
| 2018/19 - 20/21 | • | 145 | 23.1 | 19.2 | 27.5 | 23.3 | 20.9 |
Source: NHS England, multiple sources
There were 70 major diabetic lower limb amputations in Hull in the three year period 2018/19 to 2020/21.
In contrast to minor diabetic lower limb amputations, the rate of major diabetic lower limb amputations has decreased in Hull since 2014/15-2016/17, but increased in the last two years. From this, there is a suggestion that the severity of lower limb disease has increased with patients requiring major lower limb amputation rather than minor lower limb amputation.
Compared with benchmark
Major lower-limb amputation procedures for people with diabetes (Persons 17+ yrs)
|
Period
|
Humber and North Yorkshire ICB - 03F |
NHS Humber and North Yorkshire Integrated Care Board - QOQ
|
England
|
||||
|---|---|---|---|---|---|---|---|
|
Count
|
Value
|
95%
Lower CI |
95%
Upper CI |
||||
| 2010/11 - 12/13 | • | 58 | 12.0 | 9.0 | 15.5 | - | 9.1 |
| 2011/12 - 13/14 | • | 52 | 11.9 | 7.7 | 17.0 | - | 8.6 |
| 2012/13 - 14/15 | • | 54 | 12.1 | 8.0 | 17.1 | - | 8.3 |
| 2013/14 - 15/16 | • | 58 | 12.8 | 8.5 | 18.0 | - | 8.1 |
| 2014/15 - 16/17 | • | 64 | 13.0 | 9.1 | 17.6 | - | 8.2 |
| 2015/16 - 17/18 | • | 66 | 12.2 | 8.7 | 16.3 | - | 8.2 |
| 2016/17 - 18/19 | • | 55 | 9.2 | 6.4 | 12.7 | - | 8.2 |
| 2017/18 - 19/20 | • | 65 | 10.0 | 7.7 | 12.7 | 7.5 | 8.1 |
| 2018/19 - 20/21 | • | 70 | 10.5 | 8.1 | 13.4 | 7.8 | 7.7 |
Source: NHS England, multiple sources
Mortality
The directly standardised mortality rate for deaths involving diabetes is 70% higher in Hull compared to England for deaths registered during 2022-24. The rate is statistically significantly higher than England.
Among men, the mortality rate is 62% higher in Hull compared to England, while among women, the mortality rate in Hull is 83% higher than for England.
The rate is given as the number of deaths per 100,000 population (in the European Standard Population) where diabetes is the underlying cause of death or a contributory or secondary cause of death.
Compared with benchmark
| Indicator | Period | England | Yorkshire and the Humber region (statistical) | Kingston upon Hull | East Riding of Yorkshire | North East Lincolnshire | North Lincolnshire | York | North Yorkshire UA | Barnsley | Doncaster | Rotherham | Sheffield | Bradford | Calderdale | Kirklees | Leeds | Wakefield |
|---|---|---|---|---|---|---|---|---|---|---|---|---|---|---|---|---|---|---|
Mortality rate for deaths involving diabetes, all ages (Persons All ages) | 2022 - 24 | 109.6 | 116.6 | 186.3 | 121.6 | 149.1 | 129.1 | 68.7 | 70.5 | 127.2 | 98.8 | 86.7 | 106.6 | 145.7 | 134.7 | 143.2 | 112.3 | 157.1 |
Mortality rate for deaths involving diabetes, all ages (Male All ages) | 2022 - 24 | 144.2 | 151.7 | 233.1 | 163.3 | 189.3 | 168.3 | 86.1 | 96.0 | 159.7 | 130.6 | 106.9 | 141.2 | 187.4 | 185.3 | 188.8 | 145.4 | 198.0 |
Mortality rate for deaths involving diabetes, all ages (Female All ages) | 2022 - 24 | 82.4 | 89.1 | 151.1 | 89.2 | 114.4 | 96.0 | 54.6 | 50.6 | 101.6 | 72.5 | 68.1 | 79.4 | 114.6 | 99.6 | 108.2 | 87.8 | 125.8 |
The rate is also the highest in the region for 2022-24, and by some considerable margin higher. In fact, the mortality rates are statistically significantly higher than all other local authorities in the region, with this the case for men and for women.
Compared with benchmark
Mortality rate for deaths involving diabetes, all ages (Persons All ages) 2022 - 24
| Area |
Recent
Trend |
Count
|
Value
|
95%
Lower CI |
95%
Upper CI |
|
|---|---|---|---|---|---|---|
| England | 186922 | 109.6 | 109.1 | 110.1 | ||
| Yorkshire and the Humber region (statistical) | 19481 | 116.6 | 114.9 | 118.2 | ||
| Kingston upon Hull | 1187 | 186.3 | 175.8 | 197.3 | ||
| East Riding of Yorkshire | 1780 | 121.6 | 115.9 | 127.4 | ||
| North East Lincolnshire | 790 | 149.1 | 138.8 | 159.9 | ||
| North Lincolnshire | 763 | 129.1 | 120.1 | 138.6 | ||
| York | 445 | 68.7 | 62.4 | 75.4 | ||
| North Yorkshire UA | 1758 | 70.5 | 67.3 | 73.9 | ||
| Barnsley | 957 | 127.2 | 119.2 | 135.6 | ||
| Doncaster | 929 | 98.8 | 92.6 | 105.4 | ||
| Rotherham | 719 | 86.7 | 80.4 | 93.3 | ||
| Sheffield | 1645 | 106.6 | 101.5 | 111.9 | ||
| Bradford | 1957 | 145.7 | 139.3 | 152.3 | ||
| Calderdale | 825 | 134.7 | 125.6 | 144.3 | ||
| Kirklees | 1757 | 143.2 | 136.5 | 150.1 | ||
| Leeds | 2323 | 112.3 | 107.7 | 117.0 | ||
| Wakefield | 1646 | 157.1 | 149.6 | 164.9 |
Source: OHID, based on Office for National Statistics data
Mortality rate for deaths involving diabetes, all ages (Male All ages) 2022 - 24
| Area |
Recent
Trend |
Count
|
Value
|
95%
Lower CI |
95%
Upper CI |
|
|---|---|---|---|---|---|---|
| England | 107031 | 144.2 | 143.3 | 145.1 | ||
| Yorkshire and the Humber region (statistical) | 11036 | 151.7 | 148.9 | 154.7 | ||
| Kingston upon Hull | 648 | 233.1 | 214.8 | 252.6 | ||
| East Riding of Yorkshire | 1045 | 163.3 | 153.4 | 173.7 | ||
| North East Lincolnshire | 448 | 189.3 | 172.0 | 207.9 | ||
| North Lincolnshire | 444 | 168.3 | 152.7 | 185.0 | ||
| York | 236 | 86.1 | 75.4 | 98.0 | ||
| North Yorkshire UA | 1041 | 96.0 | 90.1 | 102.1 | ||
| Barnsley | 533 | 159.7 | 146.0 | 174.4 | ||
| Doncaster | 550 | 130.6 | 119.7 | 142.2 | ||
| Rotherham | 407 | 106.9 | 96.6 | 118.0 | ||
| Sheffield | 953 | 141.2 | 132.2 | 150.5 | ||
| Bradford | 1076 | 187.4 | 176.2 | 199.1 | ||
| Calderdale | 476 | 185.3 | 168.4 | 203.5 | ||
| Kirklees | 1000 | 188.8 | 177.0 | 201.2 | ||
| Leeds | 1277 | 145.4 | 137.4 | 153.7 | ||
| Wakefield | 902 | 198.0 | 184.8 | 211.9 |
Source: OHID, based on Office for National Statistics data
Mortality rate for deaths involving diabetes, all ages (Female All ages) 2022 - 24
| Area |
Recent
Trend |
Count
|
Value
|
95%
Lower CI |
95%
Upper CI |
|
|---|---|---|---|---|---|---|
| England | 79891 | 82.4 | 81.8 | 82.9 | ||
| Yorkshire and the Humber region (statistical) | 8445 | 89.1 | 87.2 | 91.1 | ||
| Kingston upon Hull | 539 | 151.1 | 138.6 | 164.4 | ||
| East Riding of Yorkshire | 735 | 89.2 | 82.8 | 95.9 | ||
| North East Lincolnshire | 342 | 114.4 | 102.5 | 127.4 | ||
| North Lincolnshire | 319 | 96.0 | 85.7 | 107.2 | ||
| York | 209 | 54.6 | 47.4 | 62.7 | ||
| North Yorkshire UA | 717 | 50.6 | 46.9 | 54.4 | ||
| Barnsley | 424 | 101.6 | 92.1 | 111.8 | ||
| Doncaster | 379 | 72.5 | 65.3 | 80.2 | ||
| Rotherham | 312 | 68.1 | 60.7 | 76.1 | ||
| Sheffield | 692 | 79.4 | 73.5 | 85.6 | ||
| Bradford | 881 | 114.6 | 107.1 | 122.5 | ||
| Calderdale | 349 | 99.6 | 89.4 | 110.6 | ||
| Kirklees | 757 | 108.2 | 100.6 | 116.2 | ||
| Leeds | 1046 | 87.8 | 82.6 | 93.4 | ||
| Wakefield | 744 | 125.8 | 116.9 | 135.2 |
Source: OHID, based on Office for National Statistics data
For deaths registered between 2001-03 and 2003-05, the mortality rate for deaths involving diabetes was lower than England. Since then the mortality rates have increased in Hull, in England and across the region, but the increase in the mortality rates have been substantially higher in Hull.
Over the entire period 2001-03 to 2022-24, the mortality rate has more than tripled in Hull compared to the rate doubling in England.
It is likely that over the last 20 years the diagnosis of diabetes and the recording of diabetes on deaths certificates has improved so this may account for some of the increase, but it is also anticipated that the mortality rates have substantially increased over time with an increased prevalence of diabetes across the country.
On average each year, there were just over 100 people who died whose deaths were registered during 2001-03 in Hull who had diabetes as their underlying cause of death or as a contributing or secondary cause of death, but this has increased to almost 400 for deaths registered during 2022-24. The relative increase in the rate is not as high as the relative increase in the numbers, as the rate takes into account increases in the population and the ageing population, and the age at death.
Compared with benchmark
Mortality rate for deaths involving diabetes, all ages (Persons All ages)
|
Period
|
Kingston upon Hull |
Yorkshire and the Humber region (statistical)
|
England
|
||||
|---|---|---|---|---|---|---|---|
|
Count
|
Value
|
95%
Lower CI |
95%
Upper CI |
||||
| 2001 - 03 | • | 314 | 55.0 | 49.0 | 61.5 | 60.5 | 59.1 |
| 2002 - 04 | • | 320 | 56.4 | 50.3 | 63.0 | 61.4 | 59.8 |
| 2003 - 05 | • | 332 | 58.6 | 52.4 | 65.3 | 61.8 | 60.7 |
| 2004 - 06 | • | 397 | 70.2 | 63.4 | 77.5 | 63.0 | 61.3 |
| 2005 - 07 | • | 415 | 73.7 | 66.7 | 81.3 | 65.4 | 63.4 |
| 2006 - 08 | • | 417 | 74.3 | 67.2 | 81.9 | 68.8 | 65.5 |
| 2007 - 09 | • | 418 | 73.6 | 66.6 | 81.0 | 70.5 | 67.7 |
| 2008 - 10 | • | 457 | 79.2 | 72.0 | 86.9 | 71.6 | 69.8 |
| 2009 - 11 | • | 477 | 82.1 | 74.8 | 89.8 | 72.9 | 71.8 |
| 2010 - 12 | • | 534 | 91.7 | 84.0 | 99.9 | 75.8 | 74.6 |
| 2011 - 13 | • | 583 | 99.1 | 91.2 | 107.6 | 78.9 | 77.9 |
| 2012 - 14 | • | 696 | 117.8 | 109.1 | 126.9 | 82.5 | 81.1 |
| 2013 - 15 | • | 740 | 125.0 | 116.1 | 134.4 | 86.8 | 85.4 |
| 2014 - 16 | • | 811 | 137.2 | 127.8 | 147.1 | 90.6 | 88.7 |
| 2015 - 17 | • | 830 | 139.1 | 129.7 | 149.0 | 93.5 | 92.3 |
| 2016 - 18 | • | 843 | 139.9 | 130.5 | 149.8 | 93.9 | 94.0 |
| 2017 - 19 | • | 895 | 146.8 | 137.3 | 156.9 | 96.0 | 94.9 |
| 2018 - 20 | • | 1003 | 163.0 | 152.9 | 173.5 | 110.2 | 107.6 |
| 2019 - 21 | • | 1145 | 184.2 | 173.6 | 195.3 | 122.7 | 119.3 |
| 2020 - 22 | • | 1178 | 188.0 | 177.3 | 199.1 | 129.5 | 125.6 |
| 2021 - 23 | • | 1197 | 189.0 | 178.4 | 200.1 | 122.6 | 118.1 |
| 2022 - 24 | • | 1187 | 186.3 | 175.8 | 197.3 | 116.6 | 109.6 |
Source: OHID, based on Office for National Statistics data
There were 648 deaths among Hull men where diabetes was mentioned on the death certificate that were registered during 2022-24.
Compared with benchmark
Mortality rate for deaths involving diabetes, all ages (Male All ages)
|
Period
|
Kingston upon Hull |
Yorkshire and the Humber region (statistical)
|
England
|
||||
|---|---|---|---|---|---|---|---|
|
Count
|
Value
|
95%
Lower CI |
95%
Upper CI |
||||
| 2001 - 03 | • | 129 | 61.0 | 50.0 | 73.6 | 76.6 | 75.0 |
| 2002 - 04 | • | 142 | 68.1 | 56.4 | 81.3 | 78.3 | 75.6 |
| 2003 - 05 | • | 162 | 74.4 | 62.4 | 87.7 | 78.0 | 76.9 |
| 2004 - 06 | • | 202 | 91.6 | 78.5 | 106.3 | 80.4 | 77.7 |
| 2005 - 07 | • | 217 | 94.0 | 81.2 | 108.1 | 82.4 | 80.2 |
| 2006 - 08 | • | 217 | 95.5 | 82.5 | 109.8 | 87.9 | 82.9 |
| 2007 - 09 | • | 220 | 91.6 | 79.5 | 104.9 | 89.4 | 85.5 |
| 2008 - 10 | • | 223 | 92.9 | 80.6 | 106.5 | 91.3 | 88.2 |
| 2009 - 11 | • | 241 | 98.2 | 85.8 | 112.0 | 93.2 | 91.1 |
| 2010 - 12 | • | 268 | 113.0 | 99.3 | 128.0 | 97.6 | 94.7 |
| 2011 - 13 | • | 297 | 121.6 | 107.6 | 136.7 | 101.8 | 99.1 |
| 2012 - 14 | • | 361 | 147.7 | 132.3 | 164.3 | 105.2 | 102.9 |
| 2013 - 15 | • | 387 | 157.9 | 142.0 | 175.1 | 109.5 | 108.7 |
| 2014 - 16 | • | 414 | 167.2 | 150.9 | 184.7 | 114.9 | 113.6 |
| 2015 - 17 | • | 427 | 167.1 | 151.1 | 184.4 | 118.8 | 118.8 |
| 2016 - 18 | • | 440 | 167.1 | 151.4 | 184.0 | 120.0 | 121.5 |
| 2017 - 19 | • | 479 | 181.5 | 165.1 | 199.1 | 122.5 | 122.5 |
| 2018 - 20 | • | 521 | 195.4 | 178.4 | 213.5 | 142.7 | 140.7 |
| 2019 - 21 | • | 609 | 224.1 | 206.1 | 243.2 | 159.5 | 156.3 |
| 2020 - 22 | • | 622 | 226.0 | 208.0 | 245.1 | 168.6 | 165.1 |
| 2021 - 23 | • | 654 | 236.8 | 218.3 | 256.4 | 160.0 | 155.0 |
| 2022 - 24 | • | 648 | 233.1 | 214.8 | 252.6 | 151.7 | 144.2 |
Source: OHID, based on Office for National Statistics data
There were 539 deaths among Hull men where diabetes was mentioned on the death certificate that were registered during 2022-24.
Compared with benchmark
Mortality rate for deaths involving diabetes, all ages (Female All ages)
|
Period
|
Kingston upon Hull |
Yorkshire and the Humber region (statistical)
|
England
|
||||
|---|---|---|---|---|---|---|---|
|
Count
|
Value
|
95%
Lower CI |
95%
Upper CI |
||||
| 2001 - 03 | • | 185 | 53.8 | 46.2 | 62.1 | 50.2 | 48.4 |
| 2002 - 04 | • | 178 | 51.9 | 44.5 | 60.2 | 50.6 | 49.0 |
| 2003 - 05 | • | 170 | 50.2 | 42.9 | 58.5 | 51.0 | 49.6 |
| 2004 - 06 | • | 195 | 57.9 | 50.0 | 66.7 | 51.7 | 49.9 |
| 2005 - 07 | • | 198 | 59.4 | 51.4 | 68.4 | 53.9 | 51.6 |
| 2006 - 08 | • | 200 | 60.2 | 52.1 | 69.3 | 56.0 | 53.1 |
| 2007 - 09 | • | 198 | 59.6 | 51.5 | 68.6 | 57.4 | 54.8 |
| 2008 - 10 | • | 234 | 69.0 | 60.4 | 78.6 | 58.0 | 56.4 |
| 2009 - 11 | • | 236 | 68.9 | 60.3 | 78.4 | 58.5 | 57.7 |
| 2010 - 12 | • | 266 | 77.3 | 68.2 | 87.2 | 60.0 | 60.0 |
| 2011 - 13 | • | 286 | 82.6 | 73.2 | 92.9 | 62.4 | 62.3 |
| 2012 - 14 | • | 335 | 96.9 | 86.7 | 108.0 | 65.8 | 64.8 |
| 2013 - 15 | • | 353 | 101.8 | 91.4 | 113.1 | 70.1 | 68.0 |
| 2014 - 16 | • | 397 | 116.0 | 104.7 | 128.1 | 72.7 | 70.1 |
| 2015 - 17 | • | 403 | 118.4 | 107.0 | 130.7 | 74.8 | 72.5 |
| 2016 - 18 | • | 403 | 118.0 | 106.7 | 130.2 | 74.2 | 73.2 |
| 2017 - 19 | • | 416 | 120.1 | 108.7 | 132.3 | 75.8 | 73.9 |
| 2018 - 20 | • | 482 | 137.3 | 125.3 | 150.2 | 85.4 | 82.1 |
| 2019 - 21 | • | 536 | 152.8 | 140.0 | 166.3 | 94.3 | 90.6 |
| 2020 - 22 | • | 556 | 158.3 | 145.3 | 172.1 | 99.4 | 94.7 |
| 2021 - 23 | • | 543 | 153.0 | 140.4 | 166.5 | 93.7 | 89.3 |
| 2022 - 24 | • | 539 | 151.1 | 138.6 | 164.4 | 89.1 | 82.4 |
Source: OHID, based on Office for National Statistics data
There were 7,975 deaths in total among Hull residents that were registered during 2022-24, so around 15% of them have diabetes mentioned on the death certificate.
Compared with benchmark
Mortality rate from all causes, all ages (Persons All ages)
|
Period
|
Kingston upon Hull |
Yorkshire and the Humber region (statistical)
|
England
|
||||
|---|---|---|---|---|---|---|---|
|
Count
|
Value
|
95%
Lower CI |
95%
Upper CI |
||||
| 2001 - 03 | • | 7928 | 1408 | 1377 | 1440 | 1269 | 1226 |
| 2002 - 04 | • | 7894 | 1404 | 1373 | 1436 | 1251 | 1202 |
| 2003 - 05 | • | 7843 | 1392 | 1361 | 1423 | 1222 | 1173 |
| 2004 - 06 | • | 7695 | 1359 | 1329 | 1391 | 1183 | 1131 |
| 2005 - 07 | • | 7714 | 1359 | 1329 | 1391 | 1164 | 1107 |
| 2006 - 08 | • | 7590 | 1334 | 1303 | 1364 | 1152 | 1090 |
| 2007 - 09 | • | 7453 | 1305 | 1275 | 1336 | 1132 | 1066 |
| 2008 - 10 | • | 7208 | 1251 | 1222 | 1281 | 1103 | 1041 |
| 2009 - 11 | • | 7113 | 1229 | 1200 | 1258 | 1069 | 1004 |
| 2010 - 12 | • | 7038 | 1205 | 1177 | 1234 | 1058 | 989 |
| 2011 - 13 | • | 7132 | 1212 | 1184 | 1241 | 1053 | 979 |
| 2012 - 14 | • | 7250 | 1222 | 1193 | 1250 | 1041 | 971 |
| 2013 - 15 | • | 7385 | 1242 | 1213 | 1271 | 1041 | 974 |
| 2014 - 16 | • | 7468 | 1250 | 1221 | 1279 | 1034 | 970 |
| 2015 - 17 | • | 7648 | 1276 | 1247 | 1305 | 1041 | 975 |
| 2016 - 18 | • | 7649 | 1265 | 1236 | 1294 | 1036 | 967 |
| 2017 - 19 | • | 7701 | 1262 | 1233 | 1290 | 1027 | 955 |
| 2018 - 20 | • | 7911 | 1284 | 1256 | 1313 | 1065 | 986 |
| 2019 - 21 | • | 8125 | 1302 | 1274 | 1331 | 1070 | 999 |
| 2020 - 22 | • | 8278 | 1313 | 1285 | 1342 | 1085 | 1012 |
| 2021 - 23 | • | 8063 | 1265 | 1237 | 1293 | 1047 | 981 |
| 2022 - 24 | • | 7976 | 1241 | 1213 | 1268 | 1031 | 952 |
| 2023 - 25 | • | 7885 | 1216 | 1189 | 1243 | 1009 | 933 |
Source: OHID, based on Office for National Statistics data
Strategic Need and Service Provision
People aged 40-79 years who are eligible for the NHS Health Check should be encouraged to attend. People already diagnosed with diabetes should attend their annual reviews so that they get the best on-going treatment for their condition.
Pre-diabetes is poorly understood across the medical profession, therefore education amongst health professionals is an essential focus. The screening, treatment and appropriate management of pre-diabetes are essential for the prevention of diabetes in later life.
The NHS Diabetes Prevention Programme was implemented locally in 2018, and therefore it is essential that those at risk are referred in appropriately. Individuals who have been told that they are at risk of diabetes are referred to the programme either by their GP or by a Health Check professional.
The following video from the Office for Health Improvement & Disparities (previously Public Health England) outlines the roll-out of the NHS Diabetes Prevention Programme and how it is reaching those most at risk.
Diabetes management is challenging as it fits within a wide spectrum of long term conditions care. The overarching need is to ensure that diabetes care is managed in an integrated fashion, adequately resourced, with appropriate governance and staff who have the necessary competencies to deliver care.
People who have diabetes and who are at risk of familial hypercholesterolemia should be identified so that they can commence treatment and/or be referred for specialist care for familial hypercholesterolemia as their risk of coronary heart disease will be high.
Resources
Diabetes UK. Number of people with diabetes reaches 5.6 million: https://www.diabetes.org.uk/about-us/about-the-charity/our-strategy/statistics
NHS Digital. Quality and Outcomes Framework. https://qof.digital.nhs.uk/
The Office for Health Improvement & Disparities’ Fingertips: https://fingertips.phe.org.uk/
Updates
This page was last updated / checked on 17 February 2026.
This page is due to be updated / checked in November 2026.