Index
This topic area covers statistics and information relating to stillbirths and infant mortality in Hull including local strategic need and service provision. Further information relating to Causes of Death among all age groups is available within Population.
This page contains information from the Office for Health Improvement & Disparities’ Fingertips. Information is taken ‘live’ from the site so uses the latest available data from Fingertips and displays it on this page. As a result, some comments on this page may relate to an earlier period of time until this page is next updated (see review dates at the end of this page).
Summary Infographic
Headlines
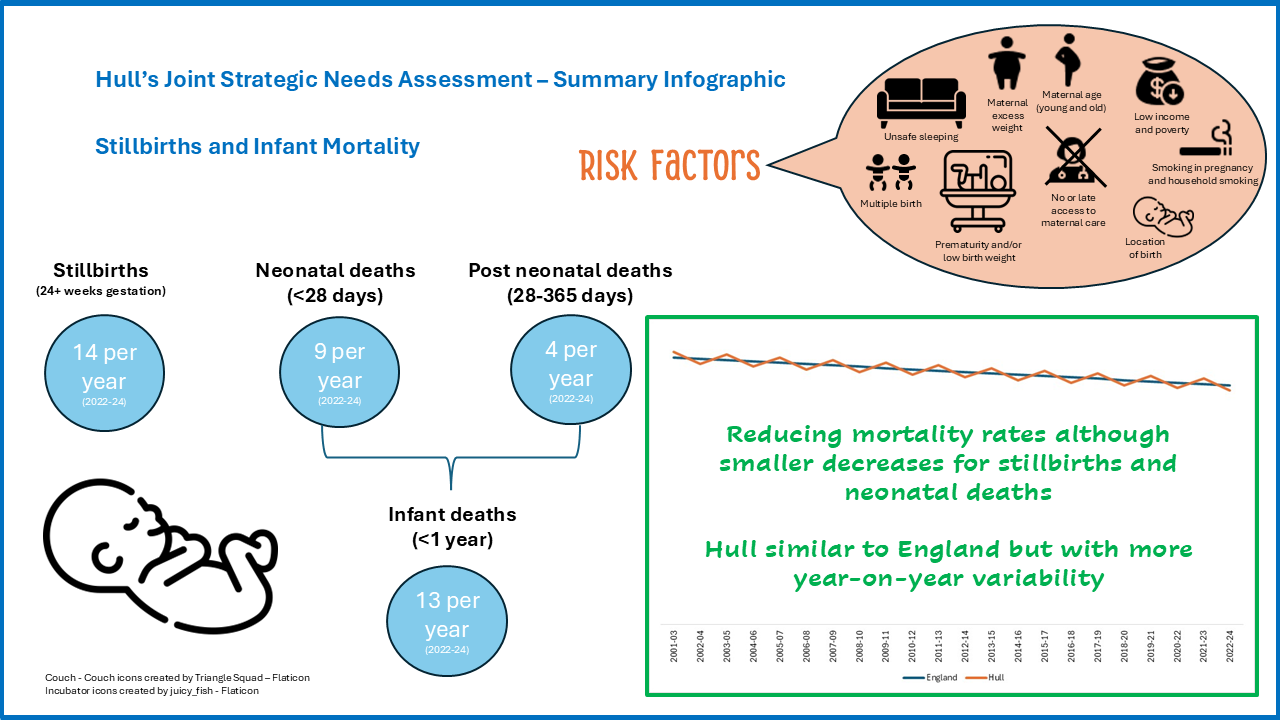
- The following factors are risk factors for infant mortality: child poverty; low birth weight; maternal age; access to antenatal care; smoking in pregnancy; maternal weight; socioeconomic position; multiple birth; premature birth; and location of birth. There is a higher prevalence of child poverty, smoking in pregnancy, maternal weight and premature births in Hull which increases the risk of infant deaths.
- There were 41 stillbirths in Hull that occurred during the three year period 2022-24 giving a rate of 4.4 stillbirths per 1,000 births. The rate of stillbirths in Hull was higher than for England (3.9 stillbirths per 1,000 births) although the difference was not statistically significant. The rate in Hull has fallen from a high of 6.8 deaths per 1,000 live births for both 2013-15 and 2014-16.
- There were 26 neonatal deaths (within first 28 days of life) in Hull that occurred within the three year period 2022-24. Since 2010-12, the rate of neonatal deaths in Hull has been comparable to the rate in England (or lower) with the exception of 2013-15, 2017-19 and 2019-21, although for the entire period 2010-12 and 2021-23 there has been no statistically significant difference in the rate between Hull and England. The rate in Hull for 2022-24 is slightly lower than England (2.8 versus 3.1 per 1,000 live births).
- There were 11 post-neonatal deaths (28 days up to one year of age) and the mortality rate for 2022-24 was comparable in Hull when compared to England (1.2 versus 1.1 per 1,000 live births). Between 2001-03 and 2014-16, the post-neonatal mortality rate in Hull had been comparable to England but increased between 2014-16 and 2015-17 from 1.2 to 1.9 deaths per 1,000 live births. The mortality rate remained relatively high until 2019-21, and has recently fallen relatively sharply in Hull over the last three years.
- Between 2001-03 and 2022-24, there has been no statistically significant difference in the infant mortality rate between Hull and England, although there has been a handful of years where the mortality rate was noticeably higher in Hull. There were 37 deaths among babies under one year that were registered during the three year period 2022-24 giving a mortality rate of 4.0 per 1,000 live births which was slightly lower than England (4.2). The infant mortality rate in Hull has decreased in the last few years compared to increases across the region and a small increase for England.
The Population Affected – Why Is It Important?
Infant mortality is an indicator of the general health of an entire population. It reflects the relationship between causes of infant mortality and upstream determinants of population health such as economic, social and environmental conditions. Deaths occurring during the first 28 days of life (the neonatal period) in particular, are considered to reflect the health and care of both mother and newborn.
Good antenatal care and support can identify potential problems early, and provide information to aid informed choice. Poor care during the birth can increase the risks to both mother and baby. Good maternity services should respond to the physical, psychological, emotional and social needs of women and their family in a structured and systematic way.
Infant mortality rates are higher among babies that are sole registered than for other registration types.
There is a higher risk of adverse events in pregnancy and during the birth for women who are teenagers, who are older, who smoke, who are overweight and who have other risk factors such as diabetes. The proportion of births to older women and women who are overweight has increased giving rise to an increase in the likelihood of adverse events.
The numbers are relatively small so some year-on-year variability would be expected in Hull when examining the mortality rates over time due to the Small Numbers.
The Hull Picture
For 2022-24, the rate of stillbirths in Hull was higher than England as was the post neonatal mortality rate (deaths within 28-365 days of life), but the neonatal mortality rate was lower than England. For deaths registered during 2021-24, the infant mortality rate in Hull was lower than England. None of the differences in Hull were statistically significant from England.
Stillbirths are classified as fetal deaths occurring after 24 weeks of gestation. Neonatal deaths are those that occur under 28 days, and post-neonatal deaths are those that occur aged 28 days or older but less than one year. Infant deaths are those that occur within the first year of life. The numbers given below are given as rates. The number of stillbirths is given as a rate per 1,000 live births and stillbirths. The number of neonatal, post-neonatal and infant deaths the rates presented per 1,000 live births.
For stillbirths, neonatal and post-neonatal deaths, the rate is derived from the number of deaths that occurred within the specified calendar years, but for infant deaths under the age of one year the rate is derived from the number of deaths that were registered in the specified calendar period. It can take some time for a death to be registered especially if the death is unexpected and unexplained and further investigation is required to establish the cause of death. Thus the number of deaths based on occurrence during a period are likely to differ slightly from the number of deaths that are registered during that same time period.
Compared with benchmark
| Indicator | Period | England | Yorkshire and the Humber region (statistical) | Kingston upon Hull | East Riding of Yorkshire | North East Lincolnshire | North Lincolnshire | York | North Yorkshire UA | Barnsley | Doncaster | Rotherham | Sheffield | Bradford | Calderdale | Kirklees | Leeds | Wakefield |
|---|---|---|---|---|---|---|---|---|---|---|---|---|---|---|---|---|---|---|
Stillbirth rate (Persons 0 yrs) | 2022 - 24 | 3.9 | 3.9 | 4.4 | 1.7 | 3.0 | 3.3 | 2.6 | 3.1 | 3.7 | 4.0 | 4.0 | 4.4 | 5.7 | 4.3 | 4.0 | 3.5 | 3.9 |
Neonatal mortality rate (Persons <28 days) | 2022 - 24 | 3.1 | 3.6 | 2.8 | 1.8 | 2.1 | 5.3 | 2.6 | 2.9 | 2.7 | 3.5 | 3.2 | 3.8 | 4.9 | 1.9 | 4.9 | 3.8 | 3.7 |
Post-neonatal mortality rate (Persons 28 days - 1 yr) | 2022 - 24 | 1.1 | 1.5 | 1.2 | 1.3 | 0.7 | 1.3 | 1.1 | 0.8 | 1.0 | 1.5 | 0.6 | 1.9 | 2.3 | 1.4 | 1.7 | 1.4 | 1.8 |
Infant mortality rate (Persons <1 yr) | 2022 - 24 | 4.2 | 5.1 | 4.0 | 3.1 | 2.7 | 6.6 | 3.7 | 3.7 | 3.7 | 5.0 | 3.9 | 5.7 | 7.2 | 3.3 | 6.6 | 5.2 | 5.5 |
There were 41 stillbirths over the three year period 2022-24 in Hull giving an average of 14 per year.
The rate of stillbirths in Hull was statistically significantly higher than England for the three year periods 2013-15 to 2015-17, but has steadily decreased since then. The rates in Hull for 2020-22 and 2021-23 are both below that of England and that has not previously occurred since 2011-13, although the latest rate for 2022-24 is slightly higher than England.
Compared with benchmark
Stillbirth rate (Persons 0 yrs)
|
Period
|
Kingston upon Hull |
Yorkshire and the Humber region (statistical)
|
England
|
||||
|---|---|---|---|---|---|---|---|
|
Count
|
Value
|
95%
Lower CI |
95%
Upper CI |
||||
| 2001 - 03 | • | 40 | 4.6 | 3.3 | 6.3 | 5.7 | 5.6 |
| 2002 - 04 | • | 53 | 5.9 | 4.4 | 7.7 | 6.1 | 5.7 |
| 2003 - 05 | • | 54 | 5.7 | 4.3 | 7.5 | 6.2 | 5.6 |
| 2004 - 06 | • | 63 | 6.3 | 4.9 | 8.1 | 6.0 | 5.5 |
| 2005 - 07 | • | 51 | 5.0 | 3.7 | 6.6 | 5.8 | 5.3 |
| 2006 - 08 | • | 56 | 5.2 | 3.9 | 6.8 | 5.6 | 5.2 |
| 2007 - 09 | • | 61 | 5.7 | 4.3 | 7.3 | 5.6 | 5.1 |
| 2008 - 10 | • | 67 | 6.1 | 4.7 | 7.7 | 5.6 | 5.1 |
| 2009 - 11 | • | 59 | 5.3 | 4.0 | 6.8 | 5.6 | 5.2 |
| 2010 - 12 | • | 49 | 4.3 | 3.2 | 5.6 | 5.4 | 5.0 |
| 2011 - 13 | • | 54 | 4.7 | 3.6 | 6.2 | 5.3 | 4.9 |
| 2012 - 14 | • | 65 | 5.8 | 4.5 | 7.4 | 5.1 | 4.7 |
| 2013 - 15 | • | 74 | 6.8 | 5.3 | 8.5 | 4.9 | 4.6 |
| 2014 - 16 | • | 73 | 6.8 | 5.3 | 8.5 | 4.9 | 4.5 |
| 2015 - 17 | • | 62 | 5.8 | 4.5 | 7.5 | 4.6 | 4.3 |
| 2016 - 18 | • | 55 | 5.3 | 4.0 | 6.9 | 4.5 | 4.2 |
| 2017 - 19 | • | 48 | 4.8 | 3.6 | 6.4 | 4.1 | 4.0 |
| 2018 - 20 | • | 45 | 4.7 | 3.4 | 6.2 | 4.0 | 3.9 |
| 2019 - 21 | • | 38 | 4.0 | 2.9 | 5.5 | 4.1 | 3.9 |
| 2020 - 22 | • | 33 | 3.5 | 2.4 | 5.0 | 4.1 | 3.9 |
| 2021 - 23 | • | 36 | 3.9 | 2.7 | 5.3 | 4.1 | 4.0 |
| 2022 - 24 | • | 41 | 4.4 | 3.2 | 6.0 | 3.9 | 3.9 |
Source: OHID, based on Office for National Statistics data
There were 26 neonatal deaths in Hull over the three year period 2022-24 giving an average of around nine per year. The rate in Hull has been comparable to the rate in England over the period 2010-12 to 2022-24.
Compared with benchmark
Neonatal mortality rate (Persons <28 days)
|
Period
|
Kingston upon Hull |
Yorkshire and the Humber region (statistical)
|
England
|
||||
|---|---|---|---|---|---|---|---|
|
Count
|
Value
|
95%
Lower CI |
95%
Upper CI |
||||
| 2010 - 12 | • | 31 | 2.7 | 1.8 | 3.9 | 3.2 | 3.0 |
| 2011 - 13 | • | 26 | 2.3 | 1.5 | 3.4 | 3.0 | 2.9 |
| 2012 - 14 | • | 29 | 2.6 | 1.7 | 3.8 | 2.8 | 2.8 |
| 2013 - 15 | • | 30 | 2.8 | 1.9 | 4.0 | 2.8 | 2.7 |
| 2014 - 16 | • | 27 | 2.5 | 1.7 | 3.7 | 2.6 | 2.7 |
| 2015 - 17 | • | 30 | 2.8 | 1.9 | 4.1 | 2.7 | 2.8 |
| 2016 - 18 | • | 29 | 2.8 | 1.9 | 4.1 | 2.7 | 2.8 |
| 2017 - 19 | • | 33 | 3.3 | 2.3 | 4.7 | 2.9 | 2.9 |
| 2018 - 20 | • | 27 | 2.8 | 1.9 | 4.1 | 2.8 | 2.8 |
| 2019 - 21 | • | 28 | 3.0 | 2.0 | 4.3 | 3.0 | 2.8 |
| 2020 - 22 | • | 24 | 2.6 | 1.7 | 3.8 | 3.3 | 2.9 |
| 2021 - 23 | • | 25 | 2.7 | 1.7 | 4.0 | 3.6 | 3.0 |
| 2022 - 24 | • | 26 | 2.8 | 1.8 | 4.1 | 3.6 | 3.1 |
Source: OHID, based on Office for National Statistics data
The rate of post-neonatal deaths in Hull has been comparable to England between 2001-03 and 2014-16. The rate increased in Hull between 2014-16 and 2015-17 from 1.2 to 1.9 deaths per 1,000 live births. The rate continued to be relatively high until 2019-21 when it was 1.8 deaths per 1,000 live births. The rate decreased to 1.6 deaths per 1,000 live births for 2020-22 and has continued to decrease to a low of 1.2 deaths per 1,000 live births for 2022-24.
In the last three years 2022-24, there has been an average of around four deaths per year among infants aged 28 days or older but younger than one year.
Compared with benchmark
Post-neonatal mortality rate (Persons 28 days - 1 yr)
|
Period
|
Kingston upon Hull |
Yorkshire and the Humber region (statistical)
|
England
|
||||
|---|---|---|---|---|---|---|---|
|
Count
|
Value
|
95%
Lower CI |
95%
Upper CI |
||||
| 2001 - 03 | • | 14 | 1.6 | 0.9 | 2.7 | 2.2 | 1.7 |
| 2002 - 04 | • | 15 | 1.7 | 0.9 | 2.8 | 2.0 | 1.7 |
| 2003 - 05 | • | 14 | 1.5 | 0.8 | 2.5 | 1.9 | 1.6 |
| 2004 - 06 | • | 18 | 1.8 | 1.1 | 2.9 | 1.9 | 1.5 |
| 2005 - 07 | • | 17 | 1.7 | 1.0 | 2.7 | 1.8 | 1.5 |
| 2006 - 08 | • | 20 | 1.9 | 1.1 | 2.9 | 1.8 | 1.5 |
| 2007 - 09 | • | 17 | 1.6 | 0.9 | 2.5 | 1.8 | 1.5 |
| 2008 - 10 | • | 15 | 1.4 | 0.8 | 2.3 | 1.8 | 1.4 |
| 2009 - 11 | • | 14 | 1.3 | 0.7 | 2.1 | 1.7 | 1.4 |
| 2010 - 12 | • | 16 | 1.4 | 0.8 | 2.3 | 1.6 | 1.3 |
| 2011 - 13 | • | 16 | 1.4 | 0.8 | 2.3 | 1.5 | 1.3 |
| 2012 - 14 | • | 14 | 1.3 | 0.7 | 2.1 | 1.4 | 1.2 |
| 2013 - 15 | • | 14 | 1.3 | 0.7 | 2.2 | 1.5 | 1.2 |
| 2014 - 16 | • | 13 | 1.2 | 0.6 | 2.1 | 1.4 | 1.1 |
| 2015 - 17 | • | 20 | 1.9 | 1.2 | 2.9 | 1.4 | 1.1 |
| 2016 - 18 | • | 18 | 1.8 | 1.0 | 2.8 | 1.3 | 1.1 |
| 2017 - 19 | • | 17 | 1.7 | 1.0 | 2.7 | 1.3 | 1.1 |
| 2018 - 20 | • | 13 | 1.4 | 0.7 | 2.3 | 1.4 | 1.1 |
| 2019 - 21 | • | 17 | 1.8 | 1.1 | 2.9 | 1.4 | 1.1 |
| 2020 - 22 | • | 15 | 1.6 | 0.9 | 2.7 | 1.4 | 1.1 |
| 2021 - 23 | • | 14 | 1.5 | 0.8 | 2.5 | 1.4 | 1.1 |
| 2022 - 24 | • | 11 | 1.2 | 0.6 | 2.1 | 1.5 | 1.1 |
Source: OHID, based on Office for National Statistics data
The rate of infant deaths in Hull has been relatively comparable to England since 2001-03, although the rate was noticeably higher in Hull for 2008-10, 2009-11, 2015-17 to 2017-19 and 2019-21. Throughout the entire period, due to small numbers, the rate in Hull has not been statistically significantly higher than England.
Whilst there has been some year-on-year variability in Hull, the infant mortality rate has decreased from 5.0 to 4.0 deaths per 100,000 live births between 2001-03 and 2022-24.
The infant mortality rate for 2022-24 is the lowest it has been since 2001-03 in Hull. In contrast, the rates have increased in the last two years for England and for the last six years for the region.
There were 37 infant deaths that were registered within the three year period 2022-24 in Hull equating to an average of around 12 per year.
Compared with benchmark
Infant mortality rate (Persons <1 yr)
|
Period
|
Kingston upon Hull |
Yorkshire and the Humber region (statistical)
|
England
|
||||
|---|---|---|---|---|---|---|---|
|
Count
|
Value
|
95%
Lower CI |
95%
Upper CI |
||||
| 2001 - 03 | • | 43 | 5.0 | 3.6 | 6.7 | 5.9 | 5.4 |
| 2002 - 04 | • | 43 | 4.8 | 3.5 | 6.5 | 5.9 | 5.2 |
| 2003 - 05 | • | 46 | 4.9 | 3.6 | 6.5 | 5.8 | 5.1 |
| 2004 - 06 | • | 53 | 5.3 | 4.0 | 7.0 | 5.8 | 5.0 |
| 2005 - 07 | • | 50 | 4.9 | 3.6 | 6.5 | 5.8 | 4.9 |
| 2006 - 08 | • | 54 | 5.1 | 3.8 | 6.6 | 5.6 | 4.8 |
| 2007 - 09 | • | 53 | 4.9 | 3.7 | 6.5 | 5.5 | 4.7 |
| 2008 - 10 | • | 61 | 5.5 | 4.2 | 7.1 | 5.4 | 4.6 |
| 2009 - 11 | • | 56 | 5.0 | 3.8 | 6.5 | 5.2 | 4.4 |
| 2010 - 12 | • | 47 | 4.1 | 3.0 | 5.5 | 4.8 | 4.3 |
| 2011 - 13 | • | 42 | 3.7 | 2.7 | 5.0 | 4.5 | 4.1 |
| 2012 - 14 | • | 43 | 3.9 | 2.8 | 5.2 | 4.2 | 4.0 |
| 2013 - 15 | • | 44 | 4.1 | 3.0 | 5.5 | 4.3 | 3.9 |
| 2014 - 16 | • | 40 | 3.8 | 2.7 | 5.1 | 4.1 | 3.9 |
| 2015 - 17 | • | 50 | 4.7 | 3.5 | 6.2 | 4.1 | 3.9 |
| 2016 - 18 | • | 47 | 4.6 | 3.4 | 6.1 | 4.0 | 3.9 |
| 2017 - 19 | • | 50 | 5.0 | 3.7 | 6.7 | 4.2 | 3.9 |
| 2018 - 20 | • | 40 | 4.2 | 3.0 | 5.7 | 4.2 | 3.9 |
| 2019 - 21 | • | 45 | 4.8 | 3.5 | 6.4 | 4.4 | 3.9 |
| 2020 - 22 | • | 39 | 4.2 | 3.0 | 5.7 | 4.6 | 3.9 |
| 2021 - 23 | • | 39 | 4.2 | 3.0 | 5.7 | 5.0 | 4.1 |
| 2022 - 24 | • | 37 | 4.0 | 2.8 | 5.5 | 5.1 | 4.2 |
Source: OHID, based on Office for National Statistics data
Strategic Need and Service Provision
There are a number of risk factors related to infant mortality and interventions must start before birth and continue post-natally. These include:
- child poverty
- low birth weight
- maternal age
- access to antenatal care
- smoking in pregnancy
- maternal weight
- socioeconomic position
- multiple birth
- premature birth
- location of birth
The Better Births national maternity review states that “every woman, every pregnancy, every baby and every family is different. Therefore, quality services (by which we mean safe, clinically effective and providing a good experience) must be personalised”. The vision for maternity services across England is “for them to become safer, more personalised, kinder, professional and more family friendly; where every woman has access to information to enable her to make decisions about her care; and where she and her baby can access support that is centred around their individual needs and circumstances. And for all staff to be supported to deliver care which is women centred, working in high performing teams, in organisations which are well led and in cultures that promote innovation, continuous learning, and break down organisational and professional boundaries”. The national Maternity Transformation Programme seeks to achieve the vision set out in Better Births vision working across nine work streams: (1) transforming the workforce; (2) sharing data and information; (3) harnessing digital technology; (4) reforming the payment system; (5) promoting good practice for safer care; (6) improving prevention; (7) improving access to perinatal mental health services; (8) supporting local transformation; (9) increasing choice and personalisation.
Work needs to continue to reduce the under 18 conception rate, as well as reduce the number of women who are obese or who smoke, with a need to provide help and advice prior to pregnancy to attempt to reduce these risks (although recognising that not all pregnancies are planned). Identifying risks and intervening early to improve maternal health and wellbeing, improving birth preparation, promoting positive parenting skills, and creating an environment for children and young people that builds self-esteem and resilience, with good emotional health. Early help and intervention for all families should be timely, accessible and appropriate for their circumstances. Hull’s Early Help and Prevention offer is focused on a whole family approach which aims to identify individuals and families with problems and brings together different services and agencies to collectively look at what support is needed and then work together to deliver the required support in a coordinated way. The framework outlines the approach to ensure that collaboration and alignment of services, and that early help may be ‘early in life or at the earliest opportunity’ which is also part of the day job, helpful, non-stigmatising, preventative, targeted and tailored. There are four thresholds of need: (i) no additional needs which is the universal response to build resilience in children and young people; (ii) additional needs involving prevention and early help; (iii) complex needs involving a targeted response of early help and interventions; and (iv) risk of significant harm which includes child protection procedures and safeguarding services.
Deaths can also occur among infants due to accidents and there are various programmes in place across Hull to reduce accidents among children, although many of these are focused on slightly older children who are more mobile. Nevertheless some of these programmes apply to infants, such as car safety, promoting safer sleeping habits for babies, and the prevention of accidents. More information is available within Accidents and Injuries Among Children and Young People under Health Factors under Children and Young People.
Resources
The Office for Health Improvement & Disparities’ Fingertips: https://fingertips.phe.org.uk/
Maternity Services Liaison Committees, An introduction to maternity services in the NHS, 2014, Public Health England: London.
Cumberlege, J. and National Maternity Review, Better Births: Improving outcomes of maternity services in England. A Five Year Forward View for maternity care. 2016, National Maternity Review: London.
NHS England, Maternity Transformation Programme. 2016, NHS England: London.
Early Help. Service Guide and Performance Review 2019/20.
Hull’s Early Help and Prevention Strategy 2021-25. https://www.hull.gov.uk/downloads/file/1726/Hull_Early_Help_and_Prevention_Strategy_2021_25.pdf
NHS Improving Care. Improving Access to Perinatal Mental Health Services in England – A Review, 2017.
Updates
This page was last updated / checked on 18 March 2026.
This page is due to be updated / checked in September 2026.