Index
This topic area covers statistics and information relating to the labour market, employment, economy and healthy workplaces in Hull including local strategic need and service provision.
This page contains information from the Office for Health Improvement & Disparities’ Fingertips. Information is taken ‘live’ from the site so uses the latest available data from Fingertips and displays it on this page. As a result, some comments on this page may relate to an earlier period of time until this page is next updated (see review dates at the end of this page).
Headlines
- Being in good work is better for your health than being out of work. ‘Good work’ is defined as having a safe and secure job with good working hours and conditions, supportive management and opportunities for training and development.
- Unemployment and poor quality employment increases stress, lowers self-esteem, increases the risk of benefit dependence, and increases the likelihood of poverty and financial insecurity. This can impact greatly not just on mental health and emotional health, but can influence physical health with an increased risk of morbidity and mortality. This not only affects individuals but has a great impact on families, the community and Hull’s overall economy.
- In the year from October 2024 to September 2025, 72.7% of Hull’s population aged 16-64 years was economically active (76.7% for men and 68.8% for women) with 67.2% in employment.
- For the year from October 2024 to September 2025, among the working-age population who were economically inactive, there were fewer full-time students which suggests that students in Hull are more likely to work. People in Hull were more likely to be not working because of long-term illness or disability (49.6%) compared to Yorkshire and Humber (29.4%) and Great Britain (27.8%).
- In the year from October 2024 to September 2025, the model-based unemployment rate in Hull was estimated to be 7.5%, which was higher than the region (4.2%) and Great Britain (4.3%). It was estimated that there were 9,500 people in Hull who were unemployed.
- In the year from October 2024 to September 2025, the employment profile was also much lower in Hull with far fewer managers, directors and professional occupations (33.8%) compared to the region (48.5%) or Great Britain (53.5%) and – at the other end of the scale – more process plant and machine operatives and people in elementary occupations (25.3%) compared to the region (18.1%) and Great Britain (14.5%). Highest educational attainment among adults and earnings were also lower in Hull. This is reflected in the median gross weekly earnings for 2025 which are lower in Hull compared than England (£645.10 versus £766.00).
- The rates of absence from work are higher in Hull.
- For 2022/23, the overall employment rate was 71.5% in Hull, but was only 63.2% among people with a physical or mental health long-term condition, and hardly anyone worked in Hull who were in receipt of long-term support for a learning disability (0.4%). For 2020/21, the overall employment rate was 73.2% in Hull, but only 11.0% for people in contact with secondary mental health services who were on a Care Plan Approach.
- The employment circumstances for residents of Hull and labour market situation in Hull is worse than many other places due to Hull’s high levels of deprivation, and the impact of the COVID-19 pandemic and the cost of living crisis has had a greater impact in Hull.
The Population Affected – Why Is It Important?
Being in good work is better for your health than being out of work. ‘Good work’ is defined as having a safe and secure job with good working hours and conditions, supportive management and opportunities for training and development. There is clear evidence that good work improves health and wellbeing across people’s lives and protects against social exclusion. Conversely, unemployment is bad for health and wellbeing, as it is associated with an increased risk of mortality and morbidity.
Long-term unemployment can have a very high negative influence on both physical and mental health. People who are long-term unemployed or are in short-term or low paid jobs with little stability including those on zero-hour contracts, have increased stress levels, lower self-esteem, and have a much higher risk of benefit dependence. This not only affects the individuals, their families and communities, but influences the entire local economy. Entrenched worklessness affects the entire family, and children living in families where parents are not working are more likely to live in poverty, leave school with no qualifications or low levels of qualifications, and be unemployed themselves or have low paid employment.
The life chances of young people who are not in education, employment and training (NEET) when they leave school are adversely affected over the long-term. Among those who do enter into education, employment or training at a later stage in their lives, their life chances are still poorer than those who were in education, employment or training throughout. Further information is given under Young People Not in Education, Employment or Training within Health and Wellbeing Influences.
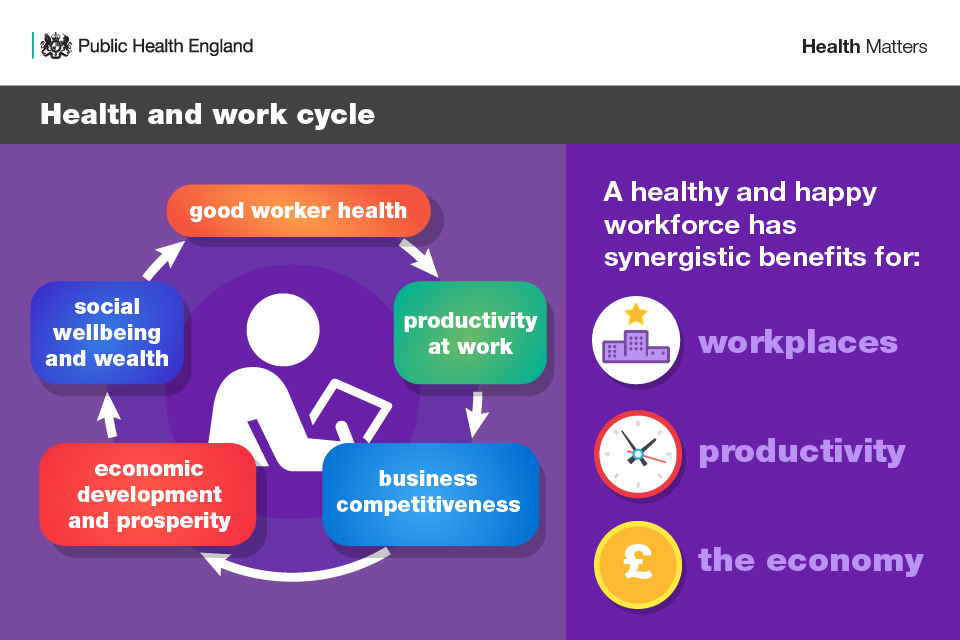
The Office for Health Improvement & Disparities (formerly Public Health England) Health Matters presents the health and work cycle.
The Hull Picture
Levels of unemployment, low quality employment and economic inactivity are generally higher in Hull, and salaries are generally lower due to Hull’s increased deprivation, and as a result the benefit claimant rate is high. A much higher percentage of Hull’s working-age population are not working due to long-term illness and disability compared to the region and to England.
The data included here represents a snapshot in time in relation to the labour market. People’s circumstances can change markedly in a short period of time as illustrated by the COVID-19 pandemic. More recent information relating to employment, unemployment and benefit claimants can be found on Hull’s Data Observatory which is updated more regularly.
Work and Health Regional Data Explorer
The Office for Health Improvement & Disparities’ Local Knowledge and Information team have produced a Work and Heath Regional Data Explorer which summaries employment data and associated health data for the different regions in England. The link is as follows, but they have given us permission to display their dashboard on our JSNA website.
Work and Health Regional Data Explorer
You will need to select “Yorkshire and the Humber” from the drop down box. On later screens as you click through the pages at the bottom of the screen, you can also choose to show the data for each local authority in your selected region by clicking on ‘Switch to local authority’.
Hull’s Data Observatory
Hull’s Data Observatory presents the following information:
- The percentage of people in Hull aged 16-64 years who are economically active and compared to England and the region.
- The trends in the percentage who are employed and who are unemployed.
- The percentages working full-time and part-time, and by gender compared to England and the region.
- The percentages who are economically active and the reasons why people are not economically active.
- The main occupational groups of employment in Hull compared to England.
- The percentages of the people in Hull by highest educational attainment compared to England and the region.
- The percentages working in the public and private sector in Hull compared to the England and the region.
- The percentages who are employees or self-employed in Hull compared to the England and the region.
- The percentages working under 10 hours, 10-34 hours, 35-44 hours and 45+ hours per week, overall and by gender.
- Information is also included on out-of-work benefits.
- The employment rates for people with work-limiting disability is also given as well as the differences in the employment rate between all the working-age population and people with a learning disability, people with a long-term health condition, and people in contact with secondary mental health services.
- From the 2021 Census, the percentages working from home are presented as well as distance travelled to work and method of travel to work, although the Census occurred in March 2021 and a relatively high percentage were working from home due to the COVID-19 pandemic (first lockdown commenced one year prior in March 2020, but in March 2021 there were a high number of cases).
- Percentage of businesses in Hull by size, as well as the total number of active enterprises, and the number of new enterprises and enterprises that closed in the latest period. The percentage of businesses in Hull that are still active one, two, three, four and five or more years after they were set up (‘survival rate’) is also presented.
- Information is also included on the gross value added for Hull by industry type.
Hull’s Data Observatory also gives an employment profile for each of the 21 wards in Hull within their Local Area Profiles. These include the percentages of people aged 16-64 years who are economically active as well as information on their activity type (full-time employee, part-time employee, full-time student, self-employed, unemployed or retired) and their occupational group. The percentage of people who are economically inactive is given as well as the percentages on out-of-work benefits.
Local Authority Labour Market Profiles
Local authority labour market profiles are available from Official Labour Market Statistics (nomis) presenting information mainly from the Annual Population Survey. The profiles provide information on numbers economically active and inactive, reasons for inactivity, workless households, types of employment, earnings and out-of-work benefits as summarised below for the year October 2024 to September 2025.
Information relating to the work and the labour market are also available on The Office for Health Improvement & Disparities’ Fingertips and some of this information also comes from the Annual Population Survey.
Economically Active and Inactive
From the Office for National Statistics Annual Population Survey, almost three-quarters (72.7%) of working-age people in Hull were economically active with 67.2% in employment (62.4% employees and 4.7% self-employed) and a model-based unemployment rate of 7.5% during the year from October 2024 to September 2025. The model-based unemployment rate for Yorkshire and Humber region is 4.2% whilst it is 4.3% in Great Britain as a whole. It is estimated that 9,500 people are unemployed in Hull.
The employment rates differ for males and females with 70.8% of males in employment compared to 63.6% of females.
| Gender | Measure | Hull (N) | Hull (%) | Y&H (%) | GB (%) |
| Persons | Economically active | 126,500 | 72.7 | 76.4 | 79.0 |
| Persons | In employment | 117,000 | 67.2 | 73.2 | 75.6 |
| Persons | Employees | 108,400 | 62.4 | 64.0 | 65.8 |
| Persons | Self-employed | 8,100 | 4.7 | 9.0 | 9.5 |
| Persons | Unemployed (model-based) | 9,500 | 7.5 | 4.2 | 4.3 |
| Males | Economically active | 66,800 | 76.7 | 79.8 | 82.4 |
| Males | In employment | 61,700 | 70.8 | 76.4 | 78.6 |
| Males | Employees | 55,700 | 63.7 | 64.3 | 66.1 |
| Males | Self-employed | 6,000 | 7.1 | 11.8 | 12.2 |
| Females | Economically active | 59,700 | 68.8 | 73.1 | 75.7 |
| Females | In employment | 55,200 | 63.6 | 69.9 | 72.5 |
| Females | Employees | 52,700 | 61.0 | 63.7 | 65.4 |
| Females | Self-employed | # | # | 6.1 | 6.8 |
The percentage of people aged 16-64 years in employment in Hull is among the lowest across the region for 2024/25 at 72.9%, from 69.0% in 2023/24%.
Compared with benchmark
| Indicator | Period | England | Yorkshire and the Humber region (statistical) | Kingston upon Hull | East Riding of Yorkshire | North East Lincolnshire | North Lincolnshire | York | North Yorkshire UA | Barnsley | Doncaster | Rotherham | Sheffield | Bradford | Calderdale | Kirklees | Leeds | Wakefield |
|---|---|---|---|---|---|---|---|---|---|---|---|---|---|---|---|---|---|---|
Percentage of people in employment (Persons 16-64 yrs) | 2024/25 | 75.7 | 73.5 | 72.9 | 79.3 | 73.5 | 66.6 | 77.9 | 78.9 | 75.6 | 72.8 | 71.2 | 74.1 | 69.1 | 72.8 | 77.1 | 69.3 | 72.9 |
The trends over time illustrate the improving percentage of Hull’s working-age population who are in employment, and the reducing inequalities gap between Hull and England until 2020/21.
The percentage of people in Hull in employment fell slightly between 2019/20 and 2020/21, although it is likely that the employment rate differed throughout 2020/21 with the COVID-19 pandemic but the figure below represents a summary of the entire year.
There has been a larger decrease in the employment rate between 2020/21 and 2021/22 falling from 73.2% to 70.5% in Hull which was not been reflected across England or the region as their employment rates increased over the that time period, and whilst the employment rate did increase slightly in Hull to 71.5% for 2022/23, it decreased to 69.3% for 2023/24, before increasing again to 72.9% in 2024/25.
Compared with benchmark
Percentage of people in employment (Persons 16-64 yrs)
|
Period
|
Kingston upon Hull |
Yorkshire and the Humber region (statistical)
|
England
|
||||
|---|---|---|---|---|---|---|---|
|
Count
|
Value
|
95%
Lower CI |
95%
Upper CI |
||||
| 2011/12 | • | 104100 | 60.8% | 58.0% | 63.6% | 67.5% | 70.2% |
| 2012/13 | • | 105800 | 62.1% | 59.3% | 64.9% | 69.6% | 71.0% |
| 2013/14 | • | 106300 | 63.1% | 60.1% | 66.1% | 69.9% | 71.7% |
| 2014/15 | • | 109600 | 65.3% | 62.4% | 68.2% | 71.0% | 72.9% |
| 2015/16 | • | 112500 | 66.9% | 63.9% | 69.9% | 72.2% | 73.9% |
| 2016/17 | • | 115600 | 68.8% | 65.5% | 72.1% | 72.8% | 74.4% |
| 2017/18 | • | 118400 | 70.8% | 67.7% | 73.9% | 73.5% | 75.2% |
| 2018/19 | • | 120100 | 71.1% | 67.9% | 74.3% | 73.7% | 75.6% |
| 2019/20 | • | 124700 | 74.0% | 70.5% | 77.5% | 74.0% | 76.2% |
| 2020/21 | • | 123500 | 73.2% | 69.3% | 77.1% | 73.8% | 75.1% |
| 2021/22 | • | 118700 | 70.5% | 66.5% | 74.5% | 74.3% | 75.4% |
| 2022/23 | • | 120800 | 71.5% | 67.1% | 75.9% | 74.4% | 75.7% |
| 2023/24 | • | 117500 | 69.3% | 63.9% | 74.7% | 73.1% | 75.7% |
| 2024/25 | • | 122600 | 72.9% | 68.6% | 77.2% | 73.5% | 75.7% |
Source: NOMIS, Official Census and Labour Market Statistics
The percentage of those people aged 16-64 years who are economic inactive comprise those who are neither employed nor unemployed, and at 22.4% for Hull for 2024/25 which is slightly higher than England at 21.2%.
This group mainly consists of people who are not working due to long-term illness or disability, people who are temporarily sick (with no employment), people looking after the family/home, students (who are not working) and people who are retired prior to the age of 64 years.
Compared with benchmark
| Indicator | Period | England | Yorkshire and the Humber region (statistical) | Kingston upon Hull | East Riding of Yorkshire | North East Lincolnshire | North Lincolnshire | York | North Yorkshire UA | Barnsley | Doncaster | Rotherham | Sheffield | Bradford | Calderdale | Kirklees | Leeds | Wakefield |
|---|---|---|---|---|---|---|---|---|---|---|---|---|---|---|---|---|---|---|
Economic inactivity rate (Persons 16-64 yrs) | 2024/25 | 21.2 | 24.0 | 22.4 | 17.5 | 23.4 | 29.1 | 20.0 | 20.0 | 22.8 | 24.4 | 25.6 | 24.1 | 28.6 | 25.1 | 19.4 | 28.0 | 25.2 |
The percentage of working-age people who are economically inactive decreased in Hull from 28.8% in 2011/12 to a low of 21.1% in 2019/20 prior to the COVID-19, although increased between 2019/20 and 2021/22 to almost 25% with a relatively large increase to 29% for 2023/24 although this appears to have been a ‘blip’ as the rate has decreased to 22% for 2024/25 which is similar to what it was 5-6 years ago.
For 2023/24, it was estimated that 49,600 people in Hull are economically inactive, but this has decreased sharply for 2024/25 to an estimated 37,700 people in Hull.
Compared with benchmark
Economic inactivity rate (Persons 16-64 yrs)
|
Period
|
Kingston upon Hull |
Yorkshire and the Humber region (statistical)
|
England
|
||||
|---|---|---|---|---|---|---|---|
|
Count
|
Value
|
95%
Lower CI |
95%
Upper CI |
||||
| 2011/12 | • | 49400 | 28.8% | 26.2% | 31.4% | 25.2% | 23.6% |
| 2012/13 | • | 44900 | 26.3% | 23.7% | 28.9% | 23.2% | 22.9% |
| 2013/14 | • | 44700 | 26.6% | 23.9% | 29.3% | 23.4% | 22.6% |
| 2014/15 | • | 45400 | 27.1% | 24.4% | 29.8% | 23.5% | 22.4% |
| 2015/16 | • | 44300 | 26.4% | 23.6% | 29.2% | 23.0% | 22.0% |
| 2016/17 | • | 42700 | 25.2% | 22.1% | 28.3% | 23.3% | 21.8% |
| 2017/18 | • | 40200 | 23.9% | 21.0% | 26.8% | 22.7% | 21.4% |
| 2018/19 | • | 39100 | 23.1% | 20.1% | 26.1% | 22.7% | 21.1% |
| 2019/20 | • | 35500 | 21.1% | 17.9% | 24.3% | 22.8% | 20.6% |
| 2020/21 | • | 37500 | 22.3% | 18.7% | 25.9% | 22.4% | 20.9% |
| 2021/22 | • | 41900 | 24.9% | 21.1% | 28.7% | 22.2% | 21.2% |
| 2022/23 | • | 42000 | 24.8% | 20.6% | 29.0% | 22.8% | 21.4% |
| 2023/24 | • | 49600 | 29.3% | 24.0% | 34.6% | 24.3% | 21.2% |
| 2024/25 | • | 37700 | 22.4% | 18.3% | 26.5% | 24.0% | 21.2% |
Source: NOMIS, Official Census and Labour Market Statistics
The percentage of Young People Not in Education, Employment or Training (NEETs) within Health and Wellbeing Influences.
Reasons for Economic Inactivity
From the Annual Population Survey, of those who were economically inactive, 16.8% were students, 16.7% were looking after the family or home and 49.6% were long-term sick during the year from October 2024 to September 2025. The percentage of people who were long-term sick was substantially higher in Hull compared to the Yorkshire and Humber, and Great Britain. The percentage in Hull has increased from 34.7% from the year October 2022 to September 2023 which is a large increase. This could be due to a real increase, but it is also possible that this increase or part of this increase could be associated with some administrative process if there was a backlog of reviews, or as the percentages are from a survey it is also possible that the change is due to random variation.
As Hull is a city with more than one further education establishment, one might have expected that the percentage of students to be higher. However, the percentage relates to those who are economically inactive. Any full-time (or part-time) student who is working as well as studying will be classified as economically active as they are working (and will not be included in the 16.8% figure). So this percentage only relates to those students who are not working.
Overall, 21.7% of those who were economically inactive wanted a job which was on a par with levels seen in the region (22.2%) and Great Britain (20.5%), for the year October 2024 to September 2025.
| Type of economic inactivity | Hull (N) | Hull (%) | Y&H (%) | GB (%) |
| Student | 7,800 | 16.8 | 24.6 | 26.5 |
| Looking after family/home | 7,700 | 16.7 | 18.1 | 18.2 |
| Long-term sick | 23,000 | 49.6 | 29.4 | 27.8 |
| Discouraged | ! | ! | 0.6 | 0.3 |
| Retired | # | # | 12.7 | 13.0 |
| Other | 4,600 | 9.9 | 11.6 | 11.9 |
| Total | 46,400 | 27.3 | 23.6 | 21.0 |
| Wants a job | 10,100 | 21.7 | 22.2 | 20.5 |
| Does not want a job | 36,300 | 78.3 | 77.8 | 79.5 |
Employment Rate Among People with Long-Term Health Problems
Fingertips also presents the percentage points gap between the overall employment rate and the employment rate among those who have a long-term physical or mental health problem, have learning disabilities and those in contact with secondary mental health services. As well as the overall employment rates among people with a physical or mental long-term health problem, and in receipt of long-term support for a learning disability.
People With Long-Term Health Conditions
For 2022/23, employment rates were 9.1 percentage points lower among those with long-term physical or mental health problems giving an overall employment rate of 62.4% among people aged 16-64 years who had long-term physical or mental health problems compared to 71.5% among all people aged 16-64 years.
Compared with benchmark
| Indicator | Period | England | Yorkshire and the Humber region (statistical) | Kingston upon Hull | East Riding of Yorkshire | North East Lincolnshire | North Lincolnshire | York | North Yorkshire UA | Barnsley | Doncaster | Rotherham | Sheffield | Bradford | Calderdale | Kirklees | Leeds | Wakefield |
|---|---|---|---|---|---|---|---|---|---|---|---|---|---|---|---|---|---|---|
Percentage of people in employment (Persons 16-64 yrs) | 2024/25 | 75.7 | 73.5 | 72.9 | 79.3 | 73.5 | 66.6 | 77.9 | 78.9 | 75.6 | 72.8 | 71.2 | 74.1 | 69.1 | 72.8 | 77.1 | 69.3 | 72.9 |
Gap in the employment rate between those with a physical or mental long term health condition (aged 16 to 64) and the overall employment rate (Persons 16-64 yrs) | 2022/23 | 10.4 | 11.2 | 9.1 | 12.0 | 12.7 | 15.4 | 6.3 | - | 10.0 | 4.4 | 14.6 | 11.3 | 10.0 | 9.7 | 12.4 | 11.1 | 15.2 |
The percentage of the population with a physical or mental long term health condition in employment (aged 16 to 64) (Persons 16-64 yrs) | 2022/23 | 65.3 | 63.2 | 62.4 | 65.6 | 60.2 | 61.4 | 77.3 | - | 62.4 | 69.0 | 58.0 | 60.5 | 59.3 | 64.3 | 58.5 | 65.3 | 59.7 |
With the exception of the high gap for 2020/21 – likely associated with the COVID-19 pandemic – the gap has been reduced over the last six years. The employment rate increased among people with a physical or mental long-term health problem between 57.7% in 2020/21 and 62.4% in 2022/23.
Compared with benchmark
Percentage of people in employment (Persons 16-64 yrs)
|
Period
|
Kingston upon Hull |
Yorkshire and the Humber region (statistical)
|
England
|
||||
|---|---|---|---|---|---|---|---|
|
Count
|
Value
|
95%
Lower CI |
95%
Upper CI |
||||
| 2011/12 | • | 104100 | 60.8% | 58.0% | 63.6% | 67.5% | 70.2% |
| 2012/13 | • | 105800 | 62.1% | 59.3% | 64.9% | 69.6% | 71.0% |
| 2013/14 | • | 106300 | 63.1% | 60.1% | 66.1% | 69.9% | 71.7% |
| 2014/15 | • | 109600 | 65.3% | 62.4% | 68.2% | 71.0% | 72.9% |
| 2015/16 | • | 112500 | 66.9% | 63.9% | 69.9% | 72.2% | 73.9% |
| 2016/17 | • | 115600 | 68.8% | 65.5% | 72.1% | 72.8% | 74.4% |
| 2017/18 | • | 118400 | 70.8% | 67.7% | 73.9% | 73.5% | 75.2% |
| 2018/19 | • | 120100 | 71.1% | 67.9% | 74.3% | 73.7% | 75.6% |
| 2019/20 | • | 124700 | 74.0% | 70.5% | 77.5% | 74.0% | 76.2% |
| 2020/21 | • | 123500 | 73.2% | 69.3% | 77.1% | 73.8% | 75.1% |
| 2021/22 | • | 118700 | 70.5% | 66.5% | 74.5% | 74.3% | 75.4% |
| 2022/23 | • | 120800 | 71.5% | 67.1% | 75.9% | 74.4% | 75.7% |
| 2023/24 | • | 117500 | 69.3% | 63.9% | 74.7% | 73.1% | 75.7% |
| 2024/25 | • | 122600 | 72.9% | 68.6% | 77.2% | 73.5% | 75.7% |
Source: NOMIS, Official Census and Labour Market Statistics
Gap in the employment rate between those with a physical or mental long term health condition (aged 16 to 64) and the overall employment rate (Persons 16-64 yrs)
|
Period
|
Kingston upon Hull |
Yorkshire and the Humber region (statistical)
|
England
|
||||
|---|---|---|---|---|---|---|---|
|
Count
|
Value
|
95%
Lower CI |
95%
Upper CI |
||||
| 2013/14 | • | - | 15.7 | 12.7 | 18.7 | 12.9 | 13.1 |
| 2014/15 | • | - | 18.4 | 15.5 | 21.3 | 13.2 | 12.8 |
| 2015/16 | • | - | 18.2 | 15.2 | 21.2 | 12.7 | 12.9 |
| 2016/17 | • | - | 13.8 | 10.5 | 17.1 | 13.0 | 12.1 |
| 2017/18 | • | - | 14.6 | 11.5 | 17.7 | 12.0 | 11.5 |
| 2018/19 | • | - | 14.0 | 10.8 | 17.2 | 11.0 | 11.5 |
| 2019/20 | • | - | 11.6 | 8.1 | 15.1 | 10.9 | 10.6 |
| 2020/21 | • | - | 15.5 | 11.6 | 19.4 | 11.4 | 10.7 |
| 2021/22 | • | - | 8.4 | 2.6 | 14.3 | 10.1 | 9.9 |
| 2022/23 | • | - | 9.1 | 1.6 | 16.6 | 11.2 | 10.4 |
Source: OHID, based on Office for National Statistics data
The percentage of the population with a physical or mental long term health condition in employment (aged 16 to 64) (Persons 16-64 yrs)
|
Period
|
Kingston upon Hull |
Yorkshire and the Humber region (statistical)
|
England
|
||||
|---|---|---|---|---|---|---|---|
|
Count
|
Value
|
95%
Lower CI |
95%
Upper CI |
||||
| 2020/21 | • | - | 57.7% | 49.1% | 66.3% | 62.4% | 64.4% |
| 2021/22 | • | - | 62.1% | 55.0% | 69.1% | 64.2% | 65.5% |
| 2022/23 | • | - | 62.4% | 54.1% | 70.7% | 63.2% | 65.3% |
Source: OHID, based on Office for National Statistics data
People With Learning Disabilities
There is a very large gap between the employment rate among those with a learning disability and the overall employment rate at 71.1 percentage points. The overall employment rate for 2022/23 was 71.5%, so this means that only 0.4% of people with a learning disability were in employment in Hull.
Compared with benchmark
| Indicator | Period | England | Yorkshire and the Humber region (statistical) | Kingston upon Hull | East Riding of Yorkshire | North East Lincolnshire | North Lincolnshire | York | North Yorkshire UA | Barnsley | Doncaster | Rotherham | Sheffield | Bradford | Calderdale | Kirklees | Leeds | Wakefield |
|---|---|---|---|---|---|---|---|---|---|---|---|---|---|---|---|---|---|---|
Percentage of people in employment (Persons 16-64 yrs) | 2024/25 | 75.7 | 73.5 | 72.9 | 79.3 | 73.5 | 66.6 | 77.9 | 78.9 | 75.6 | 72.8 | 71.2 | 74.1 | 69.1 | 72.8 | 77.1 | 69.3 | 72.9 |
Gap in the employment rate between those who are in receipt of long term support for a learning disability (aged 18 to 64) and the overall employment rate (Persons 18-64 yrs) | 2022/23 | 70.9 | 69.6 | 71.1 | 73.1 | 60.1 | 74.6 | 76.3 | 75.1 | 66.7 | 69.3 | 70.3 | 68.5 | 65.1 | 68.5 | 64.7 | 70.9 | 69.5 |
The percentage of the population who are in receipt of long term support for a learning disability that are in paid employment (aged 18 to 64) (Persons 18-64 yrs) | 2022/23 | 4.8 | 4.8 | 0.4 | 4.5 | 12.8 | 2.2 | 7.3 | 5.0 | 5.7 | 4.1 | 2.3 | 3.3 | 4.2 | 5.5 | 6.2 | 5.5 | 5.4 |
The inequalities gap in the employment rates has generally been increasing in Hull over time among people with learning disabilities. The number of people in Hull aged 18-64 years with a learning disability who are employed is very low in Hull with only three individuals recorded as being in employment during 2022/23.
Compared with benchmark
Percentage of people in employment (Persons 16-64 yrs)
|
Period
|
Kingston upon Hull |
Yorkshire and the Humber region (statistical)
|
England
|
||||
|---|---|---|---|---|---|---|---|
|
Count
|
Value
|
95%
Lower CI |
95%
Upper CI |
||||
| 2011/12 | • | 104100 | 60.8% | 58.0% | 63.6% | 67.5% | 70.2% |
| 2012/13 | • | 105800 | 62.1% | 59.3% | 64.9% | 69.6% | 71.0% |
| 2013/14 | • | 106300 | 63.1% | 60.1% | 66.1% | 69.9% | 71.7% |
| 2014/15 | • | 109600 | 65.3% | 62.4% | 68.2% | 71.0% | 72.9% |
| 2015/16 | • | 112500 | 66.9% | 63.9% | 69.9% | 72.2% | 73.9% |
| 2016/17 | • | 115600 | 68.8% | 65.5% | 72.1% | 72.8% | 74.4% |
| 2017/18 | • | 118400 | 70.8% | 67.7% | 73.9% | 73.5% | 75.2% |
| 2018/19 | • | 120100 | 71.1% | 67.9% | 74.3% | 73.7% | 75.6% |
| 2019/20 | • | 124700 | 74.0% | 70.5% | 77.5% | 74.0% | 76.2% |
| 2020/21 | • | 123500 | 73.2% | 69.3% | 77.1% | 73.8% | 75.1% |
| 2021/22 | • | 118700 | 70.5% | 66.5% | 74.5% | 74.3% | 75.4% |
| 2022/23 | • | 120800 | 71.5% | 67.1% | 75.9% | 74.4% | 75.7% |
| 2023/24 | • | 117500 | 69.3% | 63.9% | 74.7% | 73.1% | 75.7% |
| 2024/25 | • | 122600 | 72.9% | 68.6% | 77.2% | 73.5% | 75.7% |
Source: NOMIS, Official Census and Labour Market Statistics
Gap in the employment rate between those who are in receipt of long term support for a learning disability (aged 18 to 64) and the overall employment rate (Persons 18-64 yrs)
|
Period
|
Kingston upon Hull |
Yorkshire and the Humber region (statistical)
|
England
|
||||
|---|---|---|---|---|---|---|---|
|
Count
|
Value
|
95%
Lower CI |
95%
Upper CI |
||||
| 2014/15 | • | - | 64.5 | 61.5 | 67.5 | 64.3 | 66.9 |
| 2015/16 | • | - | 66.0 | 62.9 | 69.1 | 65.9 | 68.1 |
| 2016/17 | • | - | 67.9 | 64.5 | 71.3 | 66.1 | 68.7 |
| 2017/18 | • | - | 70.2 | 67.1 | 73.4 | 66.1 | 69.2 |
| 2018/19 | • | - | 70.5 | 67.3 | 73.8 | 68.0 | 69.7 |
| 2019/20 | • | - | 73.5 | 69.9 | 77.0 | 67.7 | 70.6 |
| 2020/21 | • | - | 72.9 | 69.0 | 76.8 | 67.8 | 70.0 |
| 2021/22 | • | - | 70.2 | 66.2 | 74.2 | 69.4 | 70.6 |
| 2022/23 | • | - | 71.1 | 66.7 | 75.5 | 69.6 | 70.9 |
Source: OHID, based on NHS England and Office for National Statistics data
The percentage of the population who are in receipt of long term support for a learning disability that are in paid employment (aged 18 to 64) (Persons 18-64 yrs)
|
Period
|
Kingston upon Hull |
Yorkshire and the Humber region (statistical)
|
England
|
||||
|---|---|---|---|---|---|---|---|
|
Count
|
Value
|
95%
Lower CI |
95%
Upper CI |
||||
| 2016/17 | • | 6 | 0.9% | 0.4% | 2.0% | 6.7% | 5.7% |
| 2017/18 | • | 4 | 0.6% | 0.2% | 1.5% | 7.4% | 6.0% |
| 2018/19 | • | 4 | 0.6% | 0.2% | 1.5% | 5.7% | 5.9% |
| 2019/20 | • | 3 | 0.4% | 0.1% | 1.3% | 6.3% | 5.6% |
| 2020/21 | • | 2 | 0.3% | 0.1% | 1.1% | 6.0% | 5.1% |
| 2021/22 | • | 2 | 0.3% | 0.1% | 1.0% | 4.9% | 4.8% |
| 2022/23 | • | 3 | 0.4% | 0.1% | 1.2% | 4.8% | 4.8% |
Source: OHID, based on NHS England data
People in Contact With Secondary Mental Health Services
The inequalities gap in the employment rate among people in contact with secondary mental health services and who are on a Care Plan Approach is also high in Hull at 62.2 percentage points. During 2020/21, the overall employment rate was 73.2% and it was only 11.0% for people in contact with secondary mental health services.
Compared with benchmark
| Indicator | Period | England | Yorkshire and the Humber region (statistical) | Kingston upon Hull | East Riding of Yorkshire | North East Lincolnshire | North Lincolnshire | York | North Yorkshire UA | Barnsley | Doncaster | Rotherham | Sheffield | Bradford | Calderdale | Kirklees | Leeds | Wakefield |
|---|---|---|---|---|---|---|---|---|---|---|---|---|---|---|---|---|---|---|
Percentage of people in employment (Persons 16-64 yrs) | 2024/25 | 75.7 | 73.5 | 72.9 | 79.3 | 73.5 | 66.6 | 77.9 | 78.9 | 75.6 | 72.8 | 71.2 | 74.1 | 69.1 | 72.8 | 77.1 | 69.3 | 72.9 |
Gap in the employment rate for those who are in contact with secondary mental health services (aged 18 to 69) and on the Care Plan Approach, and the overall employment rate (Persons 18-69 yrs) | 2020/21 | 66.1 | 62.8 | 62.2 | 55.8 | 60.5 | 68.5 | 56.6 | 56.2 | 62.5 | 67.6 | 68.9 | 63.3 | 62.0 | 63.5 | 59.9 | 69.2 | 66.6 |
The percentage of the population who are in contact with secondary mental health services and on the Care Plan Approach, that are in paid employment (aged 18 to 69) (Persons 18-69 yrs) | 2020/21 | 9.0 | 11.0 | 11.0 | 19.0 | 13.0 | 5.0 | 20.0 | 20.0 | 10.0 | 4.0 | 8.0 | 6.0 | 8.0 | 12.0 | 11.0 | 9.0 | 8.0 |
The inequalities gap has also been increasing for people in contact with secondary mental health services in relation to employment with the latest year 2020/21 having the highest gap of 62.2 percentage points.
Overall, 56 people aged 18-69 years in contact with secondary mental health services and on the Care Plan Approach in Hull are in paid employment for 2020/21.
Compared with benchmark
Percentage of people in employment (Persons 16-64 yrs)
|
Period
|
Kingston upon Hull |
Yorkshire and the Humber region (statistical)
|
England
|
||||
|---|---|---|---|---|---|---|---|
|
Count
|
Value
|
95%
Lower CI |
95%
Upper CI |
||||
| 2011/12 | • | 104100 | 60.8% | 58.0% | 63.6% | 67.5% | 70.2% |
| 2012/13 | • | 105800 | 62.1% | 59.3% | 64.9% | 69.6% | 71.0% |
| 2013/14 | • | 106300 | 63.1% | 60.1% | 66.1% | 69.9% | 71.7% |
| 2014/15 | • | 109600 | 65.3% | 62.4% | 68.2% | 71.0% | 72.9% |
| 2015/16 | • | 112500 | 66.9% | 63.9% | 69.9% | 72.2% | 73.9% |
| 2016/17 | • | 115600 | 68.8% | 65.5% | 72.1% | 72.8% | 74.4% |
| 2017/18 | • | 118400 | 70.8% | 67.7% | 73.9% | 73.5% | 75.2% |
| 2018/19 | • | 120100 | 71.1% | 67.9% | 74.3% | 73.7% | 75.6% |
| 2019/20 | • | 124700 | 74.0% | 70.5% | 77.5% | 74.0% | 76.2% |
| 2020/21 | • | 123500 | 73.2% | 69.3% | 77.1% | 73.8% | 75.1% |
| 2021/22 | • | 118700 | 70.5% | 66.5% | 74.5% | 74.3% | 75.4% |
| 2022/23 | • | 120800 | 71.5% | 67.1% | 75.9% | 74.4% | 75.7% |
| 2023/24 | • | 117500 | 69.3% | 63.9% | 74.7% | 73.1% | 75.7% |
| 2024/25 | • | 122600 | 72.9% | 68.6% | 77.2% | 73.5% | 75.7% |
Source: NOMIS, Official Census and Labour Market Statistics
Gap in the employment rate for those who are in contact with secondary mental health services (aged 18 to 69) and on the Care Plan Approach, and the overall employment rate (Persons 18-69 yrs)
|
Period
|
Kingston upon Hull |
Yorkshire and the Humber region (statistical)
|
England
|
||||
|---|---|---|---|---|---|---|---|
|
Count
|
Value
|
95%
Lower CI |
95%
Upper CI |
||||
| 2011/12 | • | - | 56.0 | 52.9 | 59.1 | 57.9 | 61.3 |
| 2012/13 | • | - | 54.7 | 51.4 | 58.0 | 59.6 | 62.2 |
| 2013/14 | • | - | 58.4 | 55.0 | 61.8 | 62.2 | 64.7 |
| 2014/15 | • | - | 60.3 | 56.9 | 63.7 | 62.6 | 66.1 |
| 2015/16 | • | - | 60.1 | 56.6 | 63.6 | 64.0 | 67.2 |
| 2016/17 | • | - | 59.8 | 56.0 | 63.6 | 63.8 | 67.4 |
| 2017/18 | • | - | 60.8 | 57.1 | 64.5 | 64.5 | 68.2 |
| 2018/19 | • | - | 61.1 | 57.3 | 64.9 | 63.7 | 67.6 |
| 2019/20 | • | - | 61.9 | 57.6 | 66.2 | 63.0 | 67.2 |
| 2020/21 | • | - | 62.2 | 57.5 | 66.9 | 62.8 | 66.1 |
Source: OHID, based on NHS England and Office for National Statistics data
The percentage of the population who are in contact with secondary mental health services and on the Care Plan Approach, that are in paid employment (aged 18 to 69) (Persons 18-69 yrs)
|
Period
|
Kingston upon Hull |
Yorkshire and the Humber region (statistical)
|
England
|
||||
|---|---|---|---|---|---|---|---|
|
Count
|
Value
|
95%
Lower CI |
95%
Upper CI |
||||
| 2017/18 | • | 91 | 10.0% | 8.2% | 12.1% | 9.0% | 7.0% |
| 2018/19 | • | 82 | 10.0% | 8.1% | 12.2% | 10.0% | 8.0% |
| 2019/20 | • | 74 | 12.0% | 9.7% | 14.8% | 11.0% | 9.0% |
| 2020/21 | • | 56 | 11.0% | 8.6% | 14.0% | 11.0% | 9.0% |
Source: OHID, based on NHS England data
Unemployment and Workless Households
The model-based unemployment rate has already been presented above from the local authority labour market profiles and was estimated to be 3.3% for Hull during the 12-month period from October 2023 to September 2024.
From the Annual Population Survey, in 2023, there were around 84,800 households in Hull of which 16,700 (19.7%) were workless households.
From Fingertips, in 2023, the average modelled unemployment rate among those aged 16+ years in Hull was estimated to be 3.0% which was actually lower than for England (3.7%).
Compared with benchmark
| Indicator | Period | England | Yorkshire and the Humber region (statistical) | Kingston upon Hull | East Riding of Yorkshire | North East Lincolnshire | North Lincolnshire | York | North Yorkshire UA | Barnsley | Doncaster | Rotherham | Sheffield | Bradford | Calderdale | Kirklees | Leeds | Wakefield |
|---|---|---|---|---|---|---|---|---|---|---|---|---|---|---|---|---|---|---|
Unemployment (model-based) (Persons 16+ yrs) | 2023 | 3.7 | 3.4 | 3.0 | 2.6 | 3.1 | 2.8 | 2.5 | - | 2.9 | 3.2 | 3.3 | 3.9 | 5.0 | 3.3 | 3.9 | 4.1 | 2.9 |
The unemployment rate had been decreasing in Hull, but the rate increased in 2019, although based on these modelled figures decreased in 2020 and again in 2021. The unemployment rate in Hull is the lowest it has been in 2023 over the last decade.
In 2023, it is estimated that 3,900 people in Hull are unemployed.
Compared with benchmark
Unemployment (model-based) (Persons 16+ yrs)
|
Period
|
Kingston upon Hull |
Yorkshire and the Humber region (statistical)
|
England
|
||||
|---|---|---|---|---|---|---|---|
|
Count
|
Value
|
95%
Lower CI |
95%
Upper CI |
||||
| 2013 | • | 17600 | 13.9% | 11.9% | 15.9% | 8.9% | 7.5% |
| 2014 | • | 14600 | 11.6% | 9.9% | 13.3% | 7.4% | 6.2% |
| 2015 | • | 10900 | 8.7% | 7.2% | 10.2% | 6.0% | 5.1% |
| 2016 | • | 9300 | 7.3% | 5.9% | 8.7% | 5.2% | 4.8% |
| 2017 | • | 9300 | 7.2% | 5.7% | 8.7% | 5.0% | 4.4% |
| 2018 | • | 7800 | 5.8% | 4.4% | 7.2% | 4.5% | 4.1% |
| 2019 | • | 10300 | 7.8% | 5.6% | 10.0% | 4.4% | 3.9% |
| 2020 | • | 7200 | 5.4% | 4.2% | 6.6% | 4.5% | 4.7% |
| 2021 | • | 6300 | 4.9% | 3.8% | 6.0% | 4.5% | 4.5% |
| 2022 | • | 6600 | 5.0% | 3.6% | 6.4% | 3.6% | 3.6% |
| 2023 | • | 3900 | 3.0% | 1.9% | 4.1% | 3.4% | 3.7% |
Source: Office for National Statistics
The percentage of the working-age population who were long-term unemployed is more than twice as high in Hull than every other local authority in the Yorkshire and Humber region for 2024/25 at 1.5 per 1,000 population (ranging from 0.13% to 1.05% for the other 14 local authorities in the region).
The rate is the average monthly claimants of Jobseeker’s Allowance who have been claiming for more than 12 months, expressed as a rate per 1,000 of the working age population.
Compared with benchmark
| Indicator | Period | England | Yorkshire and the Humber region (statistical) | Kingston upon Hull | East Riding of Yorkshire | North East Lincolnshire | North Lincolnshire | York | North Yorkshire UA | Barnsley | Doncaster | Rotherham | Sheffield | Bradford | Calderdale | Kirklees | Leeds | Wakefield |
|---|---|---|---|---|---|---|---|---|---|---|---|---|---|---|---|---|---|---|
Long-term unemployment: people claiming out of work benefit for over 12 months (aged 16 to 64) (Persons 16-64 yrs) | 2024/25 | 0.51 | 0.65 | 1.50 | 0.57 | 0.27 | 0.72 | 0.13 | 0.24 | 0.32 | 0.40 | 0.80 | 1.05 | 0.78 | 0.35 | 0.60 | 0.79 | 0.58 |
It was estimated that there were 262 residents of Hull in 2024/25 aged 16-64 years who were long-term unemployed.
Compared with benchmark
Long-term unemployment: people claiming out of work benefit for over 12 months (aged 16 to 64) (Persons 16-64 yrs)
|
Period
|
Kingston upon Hull |
Yorkshire and the Humber region (statistical)
|
England
|
||||
|---|---|---|---|---|---|---|---|
|
Count
|
Value
|
95%
Lower CI |
95%
Upper CI |
||||
| 2024/25 | • | 262 | 1.50 | 1.32 | 1.69 | 0.65 | 0.51 |
Source: NOMIS, Official Census and Labour Market Statistics
Another measure of long-term unemployment is long-term claimants of Job Seekers Allowance. In 2023, the number of people aged 16+ per 1,000 population aged 16-64 years who were long-term (more than 12 months) claimants of Job Seekers Allowance was three and a half times higher in Hull than the percentage for England
Compared with benchmark
| Indicator | Period | England | Yorkshire and the Humber region (statistical) | Kingston upon Hull | East Riding of Yorkshire | North East Lincolnshire | North Lincolnshire | York | North Yorkshire UA | Barnsley | Doncaster | Rotherham | Sheffield | Bradford | Calderdale | Kirklees | Leeds | Wakefield |
|---|---|---|---|---|---|---|---|---|---|---|---|---|---|---|---|---|---|---|
Long term claimants of Jobseeker's Allowance (Persons 16-64 yrs) | 2023 | 0.9 | 1.1 | 3.0 | 0.9 | 0.6 | 1.2 | 0.2 | 0.3 | 0.7 | 0.7 | 1.4 | 1.7 | 1.4 | 0.5 | 1.0 | 1.3 | 1.1 |
The claimants rate of Job Seekers Allowance in Hull was higher than for all other local authorities across the region.
Compared with benchmark
Long term claimants of Jobseeker's Allowance (Persons 16-64 yrs) 2023
| Area |
Recent
Trend |
Count
|
Value
|
95%
Lower CI |
95%
Upper CI |
|
|---|---|---|---|---|---|---|
| England | 31750 | 0.9 | 0.9 | 0.9 | ||
| Yorkshire and the Humber region (statistical) | 3933 | 1.1 | 1.1 | 1.2 | ||
| Kingston upon Hull | 518 | 3.0 | 2.7 | 3.2 | ||
| East Riding of Yorkshire | 187 | 0.9 | 0.8 | 1.1 | ||
| North East Lincolnshire | 53 | 0.6 | 0.4 | 0.7 | ||
| North Lincolnshire | 126 | 1.2 | 1.0 | 1.5 | ||
| York | 24 | 0.2 | 0.1 | 0.3 | ||
| North Yorkshire UA | 115 | 0.3 | 0.3 | 0.4 | ||
| Barnsley | 102 | 0.7 | 0.5 | 0.8 | ||
| Doncaster | 128 | 0.7 | 0.6 | 0.8 | ||
| Rotherham | 230 | 1.4 | 1.2 | 1.6 | ||
| Sheffield | 648 | 1.7 | 1.6 | 1.9 | ||
| Bradford | 480 | 1.4 | 1.3 | 1.5 | ||
| Calderdale | 61 | 0.5 | 0.4 | 0.6 | ||
| Kirklees | 275 | 1.0 | 0.9 | 1.1 | ||
| Leeds | 728 | 1.3 | 1.2 | 1.4 | ||
| Wakefield | 248 | 1.1 | 1.0 | 1.3 |
Source: NOMIS, Official Census and Labour Market Statistics
There has been a dramatic decrease in the rate of long-term claimants of Job Seekers Allowance in Hull having fallen from over 30 per 1,000 population aged 16-64 years in 2012 and 2013 to 9.0 per 1,000 population in 2017. The rate has increased slightly for 2019, but has decreased since then.
The more recent decreases could be due to people in Hull transferring to Universal Credit.
In 2023, there were 518 long-term claimants of Job Seekers Allowance in Hull.
Compared with benchmark
Long term claimants of Jobseeker's Allowance (Persons 16-64 yrs)
|
Period
|
Kingston upon Hull |
Yorkshire and the Humber region (statistical)
|
England
|
||||
|---|---|---|---|---|---|---|---|
|
Count
|
Value
|
95%
Lower CI |
95%
Upper CI |
||||
| 2016 | • | 1807 | 10.4 | 9.9 | 10.8 | 5.3 | 3.7 |
| 2017 | • | 1585 | 9.0 | 8.6 | 9.5 | 4.7 | 3.5 |
| 2018 | • | 1634 | 9.3 | 8.9 | 9.8 | 4.7 | 3.6 |
| 2019 | • | 2036 | 11.6 | 11.1 | 12.2 | 4.5 | 3.3 |
| 2020 | • | 1957 | 11.3 | 10.8 | 11.8 | 3.7 | 2.6 |
| 2021 | • | 1408 | 8.2 | 7.7 | 8.6 | 2.9 | 2.1 |
| 2022 | • | 871 | 5.0 | 4.7 | 5.4 | 1.9 | 1.4 |
| 2023 | • | 518 | 3.0 | 2.7 | 3.2 | 1.1 | 0.9 |
Source: NOMIS, Official Census and Labour Market Statistics
Occupational Profile
For April 2024 to March 2025, the occupational profile was considerably different in Hull compared to the region or Great Britain. In Hull, 36.0% of the workforce were in employment groups 1-3 equating to mangers, directors, senior officials, professional occupations, and associate professional and technical compared to 47.9% for Yorkshire and Humber and 53.0% for Great Britain. At the other end of the scale, 26.7% of Hull’s workforce in employment groups 8-9 equating to process plant and machine operative, and elementary occupations compared to 18.5% for Yorkshire and Humber and 14.7% for Great Britain.
From the Office for National Statistics Business Register and Employment Survey 2023, 69.4% of employee jobs in Hull were full-time and 30.6% were part-time. There were higher proportions of employees in manufacturing, construction, administrative and support service activities, and in human health and social work activities in Hull compared to the region and Great Britain. In Hull, there were lower proportions of employees in mining and quarrying (as there were no workers in this industry), electricity, gas, steam and air conditioning supply, transportation and storage, accommodation and food service activities, information and communication, and financial and insurance activities, real estate activities, professional, scientific and technical activities, public administration and defence, and in arts, entertainment and recreation compared to the region and Great Britain.
Qualifications
For 2024, according to the Office for National Statistics Annual Population Survey, the highest educational attainment among adults in Hull remained lower than regional and national averages.
In Hull, 33.2% of the working-age population had qualifications at NVQ Level 4 or above (such as degrees, full technical certificates, and Higher National Certificates), compared to 41.9% in Yorkshire and The Humber and 47.6% across Great Britain.
The proportion of adults with no qualifications in Hull was 6.9%, which is broadly similar to the national figure of 6.5%.
Further information relating to qualifications is given within Schools, Education and Qualifications within Health and Wellbeing Influences.
Earnings
From nomis, the median earnings were by place of residence for 2025 were also lower in Hull with full-time workers earning £645 as a gross weekly wage compared to £712 across Yorkshire and Humber and £767 for Great Britain, and this was the case for both men (£700, £760 and £819 respectively) and women (£601, £645 and £711 respectively).
Hourly pay excluding overtime was £16.19 per hour among Hull workers compared to £18.06 across the region and £19.74 for Great Britain with rates lower for Hull women (£16.64) compared to Hull men (£15.36).
However, from nomis, the median earnings were by place of work for 2025 in Hull (£693) were higher than median earnings by place of residence (£645) and more comparable to earnings by place of work for the region (£708). This illustrates that those who come into Hull to work who live outside Hull tend to have higher earnings than those people who live in Hull.
The figures from nomis show the median earnings in pounds for employees living in the area who are on adults rates of pay and whose pay was not affected by absence. Figures for earnings come from the Annual Survey of Hours and Earnings which is based on a 1% sample of employees (it does not cover self-employed workers). The figures refer to gross pay before tax, national insurance or other deductions. It excludes any backdated pay.
The median gross weekly earnings among people aged 16+ years is also given on Fingertips. The definition used is very similar but the data on Fingertips relates to full-time employees and part-time employees, so the median gross weekly earnings are lower with the inclusion of part-time workers. It also excludes overtime.
The median gross weekly earnings for full-time and part-time workers living in Hull was £554 for 2025 which was among the lowest across the region.
Compared with benchmark
| Indicator | Period | England | Yorkshire and the Humber region (statistical) | Kingston upon Hull | East Riding of Yorkshire | North East Lincolnshire | North Lincolnshire | York | North Yorkshire UA | Barnsley | Doncaster | Rotherham | Sheffield | Bradford | Calderdale | Kirklees | Leeds | Wakefield |
|---|---|---|---|---|---|---|---|---|---|---|---|---|---|---|---|---|---|---|
Average weekly earnings (Persons 16+ yrs) | 2025 | 632.5 | 584.9 | 553.6 | 602.0 | 557.0 | 585.4 | 611.1 | 597.0 | 590.0 | 572.7 | 565.5 | 594.8 | 549.6 | 597.9 | 586.3 | 603.3 | 584.0 |
The average weekly earnings has been increasing in Hull in line with increases observed nationally and locally, but the earnings have been statistically significantly lower in Hull compared to England for the entire period 2011 to 2025.
Compared with benchmark
Average weekly earnings (Persons 16+ yrs)
|
Period
|
Kingston upon Hull |
Yorkshire and the Humber region (statistical)
|
England
|
||||
|---|---|---|---|---|---|---|---|
|
Count
|
Value
|
95%
Lower CI |
95%
Upper CI |
||||
| 2011 | • | - | 306.5 | 284.9 | 328.1 | 355.3 | 390.0 |
| 2012 | • | - | 303.5 | 279.1 | 327.9 | 360.6 | 398.0 |
| 2013 | • | - | 316.6 | 288.7 | 344.5 | 366.6 | 406.4 |
| 2014 | • | - | 321.7 | 300.3 | 343.1 | 367.8 | 408.2 |
| 2015 | • | - | 328.8 | 303.7 | 353.9 | 374.8 | 415.8 |
| 2016 | • | - | 343.9 | 315.6 | 372.2 | 388.1 | 429.4 |
| 2017 | • | - | 355.3 | 333.7 | 376.9 | 396.0 | 440.2 |
| 2018 | • | - | 362.5 | 339.1 | 385.9 | 408.3 | 451.2 |
| 2019 | • | - | 392.6 | 368.0 | 417.2 | 429.4 | 469.5 |
| 2020 | • | - | 385.7 | 359.2 | 412.2 | 433.5 | 475.6 |
| 2021 | • | - | 424.6 | 403.0 | 446.2 | 455.2 | 496.7 |
| 2022 | • | - | 448.4 | 420.3 | 476.5 | 484.5 | 523.7 |
| 2023 | • | - | 479.6 | 446.7 | 512.5 | 523.2 | 566.7 |
| 2024 | • | - | 519.9 | 495.4 | 544.4 | 565.4 | 603.7 |
| 2025 | • | - | 553.6 | 522.1 | 585.1 | 584.9 | 632.5 |
Source: Office for National Statistics
Benefit Claimants
From Hull’s Data Observatory, there were 9,255 claimants of out of work benefits (Universal Credit or Job Seekers Allowance) in Hull among people aged 16+ years in December 2025 (5,600 men and 3,655 women) representing 5.2% of the population (6.2% for men and 4.2% for women). In December 2025, 4.0% of people aged 16+ years were claiming these benefits across the Yorkshire and Humber region and 3.9% were doing so across England.
The COVID-19 pandemic had a dramatic effect on the numbers claiming these benefits in Hull. In March 2019, there were 7,600 people (4.5%) in Hull aged 16+ years claiming these out-of-work benefits, but this steadily increased to around 9,600 (5.7%) in February 2020. The COVID-19 lockdown started at the end of March 2020, and in April 2020 the number of benefit claimants jumped to over 14,600, increasing further to 16,300 in May 2020. The numbers fell slightly but remained around 16,000 for the rest of 2020. With the national lockdown which commenced early January 2021, the numbers increased further in February and remained high in March 2021. Since then, the numbers gradually fell to just over 12,000 in January 2022. Over the course of the pandemic, the percentage claiming these benefits in Hull was significantly higher than across the region and England, but there tended to be a relatively consistent difference between Hull and these areas with the percentage in Hull being around 3.0 to 3.2 percentage points higher. The percentage claiming out of work benefits in Hull was higher after COVID restrictions ended in March 2022 (7.2%) than it was prior to the pandemic in February 2020 (5.7%), although the percentage has returned to similar levels in 2023 and 2024.
Sickness Absence From Work
The percentage of employees who had at least one day off in the previous week and the percentage of working days lost due to sickness absence in the previous week is higher in Hull compared to England for 2021-23.
Over the three year period, 2.6% of employees had at least day off in the previous week in Hull compared to 2.2% for England, and 1.8% of all working days were lost in Hull due to sickness absence compared to 1.2% for England. It is possible that there are a higher rate of minimum wage, zero hour contracts and other more unstable employment where sick pay is not as generous as more well-paid jobs in Hull, and this is likely to impact on sickness absence in Hull.
Compared with benchmark
| Indicator | Period | England | Yorkshire and the Humber region (statistical) | Kingston upon Hull | East Riding of Yorkshire | North East Lincolnshire | North Lincolnshire | York | North Yorkshire UA | Barnsley | Doncaster | Rotherham | Sheffield | Bradford | Calderdale | Kirklees | Leeds | Wakefield |
|---|---|---|---|---|---|---|---|---|---|---|---|---|---|---|---|---|---|---|
Sickness absence: the percentage of employees who had at least one day off in the previous week (Persons 16+ yrs) | 2021 - 23 | 2.2 | 1.9 | 2.6 | 1.9 | 3.3 | 0.7 | 2.2 | 1.9 | 1.4 | 1.3 | 1.9 | 2.8 | 2.4 | 1.7 | 1.4 | 1.0 | 2.3 |
Sickness absence: the percentage of working days lost due to sickness absence (Persons 16+ yrs) | 2021 - 23 | 1.2 | 1.1 | 1.8 | 1.8 | 2.5 | 0.4 | 0.9 | 1.0 | 0.8 | 0.8 | 0.9 | 2.1 | 1.1 | 1.3 | 0.7 | 0.4 | 0.7 |
Between 2013-15 and 2015-17, sickness rates in Hull were higher than England, but since then rates of sickness has reduced in Hull and are now lower than England, up until 2021-23 when rates in Hull surpassed those in England.
Compared with benchmark
Sickness absence: the percentage of employees who had at least one day off in the previous week (Persons 16+ yrs)
|
Period
|
Kingston upon Hull |
Yorkshire and the Humber region (statistical)
|
England
|
||||
|---|---|---|---|---|---|---|---|
|
Count
|
Value
|
95%
Lower CI |
95%
Upper CI |
||||
| 2013 - 15 | • | - | 3.1% | 2.1% | 4.2% | 2.4% | 2.2% |
| 2014 - 16 | • | - | 3.7% | 2.4% | 4.9% | 2.3% | 2.2% |
| 2015 - 17 | • | - | 2.6% | 1.5% | 3.6% | 2.3% | 2.1% |
| 2016 - 18 | • | - | 2.1% | 1.1% | 3.0% | 2.2% | 2.1% |
| 2017 - 19 | • | - | 1.5% | 0.7% | 2.4% | 2.1% | 2.1% |
| 2018 - 20 | • | - | 1.4% | 0.6% | 2.1% | 1.7% | 1.9% |
| 2019 - 21 | • | - | 1.4% | 0.3% | 2.4% | 1.7% | 1.8% |
| 2020 - 22 | • | - | 1.1% | 0.2% | 2.0% | 1.7% | 2.0% |
| 2021 - 23 | • | - | 2.6% | 0.9% | 4.3% | 1.9% | 2.2% |
Source: Office for National Statistics
Sickness absence: the percentage of working days lost due to sickness absence (Persons 16+ yrs)
|
Period
|
Kingston upon Hull |
Yorkshire and the Humber region (statistical)
|
England
|
||||
|---|---|---|---|---|---|---|---|
|
Count
|
Value
|
95%
Lower CI |
95%
Upper CI |
||||
| 2013 - 15 | • | - | 2.1% | 1.3% | 2.6% | 1.5% | 1.3% |
| 2014 - 16 | • | - | 2.2% | 1.5% | 2.9% | 1.4% | 1.2% |
| 2015 - 17 | • | - | 1.5% | 0.8% | 2.0% | 1.3% | 1.1% |
| 2016 - 18 | • | - | 1.1% | 0.6% | 1.6% | 1.2% | 1.1% |
| 2017 - 19 | • | - | 0.7% | 0.3% | 1.1% | 1.2% | 1.1% |
| 2018 - 20 | • | - | 0.8% | 0.3% | 0.9% | 1.0% | 1.0% |
| 2019 - 21 | • | - | 0.9% | 0.2% | 1.7% | 1.0% | 1.0% |
| 2020 - 22 | • | - | 0.9% | 0.1% | 1.2% | 1.0% | 1.1% |
| 2021 - 23 | • | - | 1.8% | 0.6% | 2.7% | 1.1% | 1.2% |
Source: Office for National Statistics
Strategic Need and Service Provision
Children should be given the best start in life to give them the opportunity to enjoy good employment prospects. All adults especially those who are long-term unemployed should be given good, appropriate, timely advice, help and support, and additional training to improve their resilience, wellbeing and confidence so that they can achieve good future employment, and improve their health and wellbeing. Everybody should have the opportunity to improve their employment and life choices through increased good quality and appropriate education and training. There needs to be good quality, affordable childcare available to maximise parental choice in employment.
People’s circumstances can often be improved by early help, and any early help and intervention for all families should be timely, accessible and appropriate for their circumstances. Hull’s Early Help and Prevention offer is focused on a whole family approach which aims to identify individuals and families with problems and brings together different services and agencies to collectively look at what support is needed and then work together to deliver the required support in a coordinated way. The framework outlines the approach to ensure that collaboration and alignment of services, and that early help may be ‘early in life or at the earliest opportunity’ which is also part of the day job, helpful, non-stigmatising, preventative, targeted and tailored.
Over the past decade Hull has had a significant increase in the number of people in work coupled with a similar reduction in those who were economic inactive. Providing opportunities for access to employment opportunities for those with barriers due to skills, caring responsibilities, or other reasons will help improve a wide range of health, economic, and social outcomes including reducing food, fuel, and child poverty across the city. Positive and deliberate action to target under-represented groups in the workforce are important to ensure that everyone has the ability to participate in the economy.
Over 20% of Hull’s workforce, 26,000 people, is employed in the manufacturing and transportation and storage sectors. Since 2015, Hull has seen the largest growth in employment within the medical, construction, and manufacturing sectors. Creating a recognisable enterprise culture in the city is vital to establishing a vibrant, sustainable and inclusive economy. This will involve encouraging entrepreneurial skills and attitudes and recognising the contribution that enterprise activity can make to people’s lives, particularly amongst young people.
A ‘health first’ approach should be used to tackle worklessness by promoting opportunities for people to be fit for work and fit in work. There also needs to be support for initiatives that create and provide access to quality sustainable jobs. It is necessary to ensure that local residents have the good health, fitness, skills, education and training required to take up employment opportunities.
For many individuals, in particular those with long-term conditions such as mental health problems, musculoskeletal conditions and disabilities, health issues can be a barrier to gaining and retaining employment.
Nationally, combined costs from worklessness and sickness absence amount to around £100 billion annually, so there is also a strong economic case for action. Addressing and removing health-related barriers requires collaborative work between partners from across the private, public and third sectors at both national and local level.
Creating Healthy Workplaces
Creating healthy workplaces entails supporting disabled people and people with long-term health conditions. It is also important to ensure the health and wellbeing of healthy employees who do not have existing health conditions is maintained, as work and the workplace also play a pivotal role in this.
Jobs need to be sustainable and offer a minimum level of quality, which should include:
- a decent living wage;
- opportunities for in-work development;
- flexibility to enable people to balance work and family life; and
- protection from adverse working conditions that can damage health.
The Health, Work and Health Related Worklessness report, published by The Office for Health Improvement & Disparities (formerly Public Health England) and the Local Government Association, can be used by local authorities as a guide to inform decisions around improving health and work outcomes in their communities.
Effect of the COVID-19 Pandemic and Cost of Living Crisis
The COVID-19 pandemic has had a profound impact on employment prospects in our area, particularly for young people affecting the poorest, most deprived areas the most.
In March 2020, Hull’s employment figures were the highest recorded levels since the last great recession and increased by over 15% to an overall rate of 75.3% which was only marginally behind national levels. By May 2020, the impacts of the pandemic had immediately been seen in the labour market with out of work claimant rates increasing by 65% to 9.7% of the working age population with a disproportionate effect on particular groups of people. Young people, women, and those from minority ethnic communities all saw greater impacts in the number of job losses, unemployment claimants, and those furloughed. These challenges confirmed the structural issues that existed before the pandemic, and which still requires addressing.
Analysis has also shown that while cities based solely on service sectors were severely affected by the pandemic, Hull’s economy based on the producer and foundational sectors of manufacturing, transportation and storage and health and social care, placed it in a strong position for growth.
However, the ‘cost of living crisis’ and the threat of further economic impacts, especially with regards to domestic fuel costs and changes in interest rates have had particular adverse impacts on Hull with already high levels of poverty, debt and financial insecurity.
Resources
The Office for Health Improvement & Disparities (formerly Public Health England). Health Matters infographics.
The Office for Health Improvement & Disparities’ Fingertips. https://fingertips.phe.org.uk
Official Labour Market Statistics (nomis). Labour Market Profile for Hull. https://www.nomisweb.co.uk/reports/lmp/la/1946157109/report.aspx#tabempunemp
Official Labour Market Statistics (nomis). Annual Population Survey – Households by combined economic activity status. https://www.nomisweb.co.uk/
Hull Data Observatory. https://data.hull.gov.uk/economy-and-employment/
The Office for Health Improvement & Disparities (formerly Public Health England) and the Local Government Association. Health, Work and Health Related Worklessness. https://www.local.gov.uk/health-work-and-health-related-worklessness-guide-local-authorities
Hull’s Economic Strategy 2021-2026. https://www.hull.gov.uk/downloads/file/3244/economic-strategy-2011-to-2026
Hull’s Early Help and Prevention Strategy 2021-25. https://www.hull.gov.uk/downloads/file/1726/Hull_Early_Help_and_Prevention_Strategy_2021_25.pdf
Updates
This page was last updated / checked on 29 June 2026.
This page is due to be updated / checked in September 2026.