Index
This topic area covers statistics and information relating to cardiovascular disease in Hull including local strategic need and service provision. Cardiovascular disease is also called circulatory disease. It is an umbrella name for conditions that affect the heart or circulation system. These conditions includes coronary heart disease or ischaemic heart disease, stroke and transient ischaemic attack (‘mini stroke’), atrial fibrillation, heart failure, hypertension (high blood pressure), and peripheral arterial disease as well as other heart and circulatory system conditions.
This page contains information from the Office for Health Improvement & Disparities’ Fingertips. Information is taken ‘live’ from the site so uses the latest available data from Fingertips and displays it on this page. As a result, some comments on this page may relate to an earlier period of time until this page is next updated (see review dates at the end of this page).
Local mortality data is available before national data is published. Because of this, the local analysis of mortality comparing areas within Hull may be for a more recent period than the nationally produced comparisons of mortality.
Headlines
- Cardiovascular disease (also called circulatory disease) is caused by atherosclerosis (furring or stiffening of the walls of arteries). Although it may manifest itself differently in individual patients, in practice represents a single family of diseases and conditions linked by common risk factors and the direct effect they have on mortality and morbidity. These include coronary heart disease, stroke, hypertension, hypercholesterolemia, diabetes, chronic kidney disease, peripheral arterial disease and vascular dementia. Cardiovascular disease affects the lives of millions of people and is one of the largest causes of death and disability in England.
- The premature (under 75 years) mortality rates from cardiovascular disease and from cardiovascular diseases considered to be preventable are statistically significantly higher in Hull compared to England, and are the highest in the region. Whilst mortality rates declined sharply in Hull from 176 to 102 deaths per 100,000 population between 2001-03 and 2011-13, the mortality rate has gradually increased since then, albeit with a small decrease in 2023-25 to 125 deaths per 100,000. There were on average 272 deaths a year in Hull among those aged under 75 years where the underlying cause was cardiovascular disease that were registered during 2023-25. Just over four in ten of these premature deaths were from causes considered to be preventable.
- It is anticipated that the number of people aged 65+ years with cardiovascular disease in Hull will increase by around 22% in the next 20 years due to the ageing population.
- The prevalence of diagnosed coronary heart disease in 204/25 in Hull is 7% higher in Hull compared to England (3.2% versus 3.0%), hospital admissions were 8% higher than England in 2024/25, but premature mortality rates for 2023-25 were 90% higher. The discrepancies suggest that there might be higher rates of undiagnosed CHD in Hull and/or it is less well managed among patients in Hull. There are 10,209 (3.2%) patients registered with Hull GPs who have been diagnosed with CHD in 2024/25, 965 hospital admissions in 2024/25, and around 166 premature (under 75 years) deaths from CHD each year (registered during 2023-25). The premature CHD mortality rate had decreased sharply earlier in the century but has remained relatively unchanged between 2010-12 and 2019-21 with small increases each year since.
- There were 5,093 (1.6%) patients diagnosed with stroke or a transient ischaemic attack (‘mini’ stroke) in 2024/25 among those registered with Hull GPs which was lower than England (1.9%) likely associated with Hull’s younger population. There were 375 hospital admissions for stroke among Hull patients in 2024/25, and an average of 35 premature deaths from stroke per year during 2022-24. Hospital admission rates were similar to England (3% lower in Hull), while premature deaths from stroke were statistically significantly higher in Hull compared to England, 30% higher in Hull. The premature stroke mortality rate had decreased sharply earlier in the century but has remained relatively unchanged between 2007-09 and 2022-24
- In 2024/25, among patients registered with Hull GPs, 5,717 (1.8%) were diagnosed with atrial fibrillation and 2,399 (0.8%) were diagnosed with heart failure. Compared to England, fewer people in Hull were diagnosed with atrial fibrillation (2.2%) and heart failure (1.1%). There were 48,675 (15.5%) Hull patients had diagnosed hypertension (high blood pressure) which was similar to England (15.2%) and 2,329 (0.7%) Hull patients were diagnosed with peripheral arterial disease which was higher than England (0.6%). Consistently nine in ten patients aged 45+ years in Hull also had a record of having had their blood pressure measured within the last five years between 2014/15 and 2019/20, but the percentage has fallen in 2020/21 and 2021/22 likely due to the COVID-19 pandemic, but the percentage only increased marginally in subsequent years to reach 87.9% in 2024/24.
- Perhaps unsurprisingly, practices whose patients had a higher average age tended to have a higher prevalence of diagnosed cardiovascular disease.
- Hull’s population tends to be younger than England, so in some cases, it is not surprising if the prevalence is lower than England. However, to counter this, the increased levels of deprivation in Hull increases the risk of cardiovascular disease. Thus there is generally a mixed picture in relation to diagnosed prevalence when comparing Hull with England. However, it is likely that more people in Hull have undiagnosed cardiovascular disease. Furthermore, despite generally comparable rates of diagnosed disease, admission rates and mortality rates for cardiovascular disease are generally much higher in Hull which highlights the inequalities present.
The Population Affected – Why Is It Important?
All Cardiovascular Disease
Cardiovascular disease (CVD) is also known as circulatory disease. It is a common condition caused by atherosclerosis (furring or stiffening of the walls of arteries). Although CVD may manifest itself differently in individual patients, CVD in practice represents a single family of diseases and conditions linked by common risk factors and the direct effect they have on CVD mortality and morbidity. These include coronary heart disease, stroke, hypertension, hypercholesterolemia, diabetes, chronic kidney disease, peripheral arterial disease and vascular dementia. Many people who have one CVD condition commonly suffer from another and yet opportunities to identify and manage these are often missed. Cardiovascular disease (CVD) affects the lives of millions of people and is one of the largest causes of death and disability in England. Significant improvements have been made in the prevention and treatment of CVD in the past ten to fifteen years following the publication of the National Service Frameworks for coronary heart disease, diabetes and renal services, and the National Stroke Strategy, with mortality rates in under 75 year olds falling by 40%.
In some people, a high cholesterol concentration in the blood is caused by an inherited genetic defect known as familial hypercholesterolaemia (FH). Siblings and children of a person with FH have a 50% risk of inheriting the condition, and those with heterozygous (defective gene from one parent only) FH have a 50% risk of coronary heart disease in men by the age of 50 years and at least 30% in women by the age of 60 years. The prevalence of heterozygous FH is estimated to be 1 in 500. Homozygous (defective gene from both parents) FH is rare with around one case per million, but symptoms appear in childhood and is associated with early death from coronary heart disease. FH also increases the risk of other CVD.
The diagnosed prevalence of a number of CVD diseases and medical conditions can be examined from data collected as part of the Quality and Outcomes Framework within primary care. Quality of care indicators are also included, and it means that high percentage of the patients diagnosed with these specific diseases and medical conditions have annual reviews which gives medical staff the opportunity to provide information and encourage their patients to improve their lifestyle behaviours to improve their health, and lower their risk of morbidity and mortality from their condition. Local analysis of the QOF data has been completed with the prevalence calculated for each GP practice and Primary Care Network group.
Coronary Heart Disease
Coronary heart disease (CHD) is the term that describes what happens when your heart’s blood supply is blocked or interrupted by a build-up of fatty substances in the coronary arteries. The main causes are smoking, high cholesterol, high blood pressure and diabetes. CHD is a leading cause of death both in the UK and worldwide. It is responsible for more than 73,000 deaths in the UK each year. About one in six men and one in ten women die from CHD. In the UK, there are an estimated 2.3 million people living with CHD. CHD generally affects more men than women, although from the age of 50 the chances of developing the condition are similar for both sexes. As well as angina (chest pain), the main symptoms of CHD are heart attacks and heart failure. However, not everyone has the same symptoms and some people may not have any symptoms before CHD is diagnosed. Nationally, CHD has the second highest disability adjusted life years and thus has a substantial impact on the quality of people’s lives.
Stroke
A stroke is a serious, life-threatening medical condition that occurs when the blood supply to part of the brain is cut off. Strokes are a medical emergency and urgent treatment is essential because the sooner a person receives treatment for a stroke, the less damage is likely to happen. A transient ischaemic attack (TIA) is caused by a temporary disruption in the blood supply to part of the brain, causing sudden symptoms similar to those of a stroke. However, a TIA does not last as long as a stroke. The effects often only last for a few minutes or hours and fully resolve within 24 hours. A TIA can be a precursor to a stroke. The two major types of strokes are ischaemic strokes resulting from a blood clot reducing the blood supply to the brain (85%) and haemorrhagic strokes resulting from a bleed on the brain (15%).
A national campaign Stroke ACT FAST has improved awareness of treating stroke as a medical emergency. Face: “has their face fallen on one side?” – Arms: “can they raise both arms and keep them there?” – Speech: “is their speech slurred?” – Time: “time to call 999 if you see any single one of these signs”.
Strokes can cause lasting damage, affecting mobility, cognition, sight, movement of the upper limb or communication. Thus strokes can have a major impact upon individual lives and their families, and is the one of the largest causes of adult disability in the UK. Nationally, stroke has the third highest disability adjusted life years. There is also a high social and economic cost to the community. Stroke is often preventable and there are more treatment options than ever before. After stroke individual recovery can be enhanced through specialist therapy and wider social support.
One survey, by examining the population attributable risk (PAR), found that history of hypertension (PAR 35%), current smoking (19%), waist-to-hip ratio (27%), diet risk score (19%), regular physical activity (29%), diabetes (5%), alcohol intake (4%), psychosocial stress (7%), depression (5%), cardiac causes (7%) and the ratio of apolipoproteins B to A1 (25%) collectively accounted for 88% of the PAR for all stroke. Atrial fibrillation is also a risk factor for stroke.
Apoliopoprotein B is the main apolipoprotein of chylomicrons and low density lipoproteins (LDL) “bad cholesterol” and apoliopoprotin A1 is the major protein component of high density lipoproteins (HDL) “good cholesterol”.
Atrial Fibrillation
Atrial fibrillation is a heart condition that causes an irregular and often abnormally fast heart rate. A normal heart rate should be between 60 and 100 beats a minute when resting, and is regular. In atrial fibrillation, the heart rate may be over 140 beats a minute, although it can be any speed.
If left untreated atrial fibrillation is a significant risk factor for stroke and other morbidities. Men are more commonly affected than women and the prevalence increases with age. The increase with age is relatively marked; the prevalence is estimated to be less than 2% for men aged under 65 years and around 1% or lower for women aged 65 years, but is estimated to be around 5% for men and 3% for women aged 65-74 years, then doubling to around 9% for men and 7% for women aged 75-84 years and 11% for men and women aged 85+ years.
Heart Failure
Heart failure occurs when the heart is unable to pump blood at a rate sufficient for metabolic requirements. It is caused by structural or functional abnormalities of the heart. The most common causes of heart failure in the UK are coronary artery disease and hypertension. It has a poor prognosis with 30-40% of patients diagnosed with heart failure dying within a year; thereafter mortality is less than 10% per year.
Hypertension (High Blood Pressure)
Blood pressure is measured in millimetres of mercury (mmHg) and is recorded as two numbers: the first is systolic pressure (pressure of the blood when the heart beats to pump blood out) and the second is diastolic pressure (pressure when heart rests between beats). People with hypertension (high blood pressure) rarely have noticeable symptoms. Around 30% of people in England have high blood pressure but many don’t know it. If left untreated, high blood pressure increases the risk of a heart attack or stroke. It is often referred to as a “silent killer”. The only way of knowing there is a problem is to have blood pressure measured. All adults should have their blood pressure checked at least every five years. As well as having trained staff who have periodic review of their performance, and properly validated and calibrated equipment, guidelines recommend that hypertension should be diagnosed using (24 hour) ambulatory blood pressure monitoring. The chances of having high blood pressure increase with age. Whilst there is often no clear cause, the following increase the risk of high blood pressure: obesity; family history; smoking; African or Caribbean descent; eating too much salt; not eating enough fruit and vegetables; lack of physical activity; drinking too much coffee or caffeine-based drinks; and drinking too much alcohol. Just a 2mmHg increase in systolic blood pressure increases the risk of cardiac death by 7% and stroke by 10%. Given the high prevalence of risk factors for hypertension in Hull, this puts a large proportion of Hull patients at an avoidable risk of stroke, other serious cardiac events, diabetes and chronic kidney disease.
Peripheral Arterial Disease
Peripheral arterial disease (PAD) is a common condition, in which a build-up of fatty deposits in the arteries (a process called atherosclerosis) restricts blood supply to leg muscles. It is also known as peripheral vascular disease (PVD). Many people with PAD have no symptoms. However, some develop a painful ache in their legs when they walk, which usually disappears after a few minutes’ rest. The medical term for this is “intermittent claudication”. The risk of developing PAD increases with age. It is estimated that around one in every five people over the age of 60 are affected by the condition to some degree. Men tend to develop the condition more often than women. Smoking is the most significant risk factor for PAD as well as diabetes, high blood pressure and high cholesterol. Exercising regularly and stopping smoking can ease the symptoms of PAD and reduce the chances of the condition getting worse. If applicable, treating the underlying conditions of high blood pressure, high cholesterol and diabetes and surgery can improve blood flow in the legs. Whilst not immediately life-threatening, the process of atherosclerosis can lead to serious and potentially fatal problems such as heart attack and stroke. There is also the risk that leg tissue will begin to die (gangrene) and in severe cases this can lead to amputation of the lower leg.
Within a systematic review examining global prevalence estimates and risk factors for peripheral arterial disease, it states that about 10–20% of people with peripheral artery disease have intermittent claudication, another 50% have atypical leg symptoms, and those without exertional leg pain have poor mobility compared with individuals without peripheral artery disease. Patients with and without leg ischaemic symptoms have roughly a three-fold increase in risk of mortality and major cardiovascular events (heart attack and stroke) compared with those without peripheral artery disease.
The Hull Picture
Cardiovascular Disease
Some information is available on cardiovascular disease as a whole, such as hospital admission and mortality data. However, the majority of the information available and presented below is for specific cardiovascular diseases.
Number of People with Cardiovascular Disease
A Local Analysis of the Quality and Outcomes Framework Data (see Quality and Outcomes Framework in the Glossary for more information) has been completed for 2024/25. The diagnosed prevalence and screening measures are presented for the 28 practices in Hull, each Primary Care Network in Hull and for five deprivation and age groups, as well as for comparator geographical areas. As the file includes a number of indicators related to cardiovascular disease, the file is also included below. This includes diagnosed prevalence for coronary heart disease, stroke and transient ischaemic attack, atrial fibrillation, heart failure, left ventricular systolic dysfunction, hypertension (high blood pressure) and peripheral arterial disease as well as the percentage of the population aged 45+ years who have had their blood pressure measured within the last five years.
Further information from the Quality and Outcomes Framework, such as trends over time, are presented below for each specific cardiovascular disease.
Emergency Hospital Admissions for Cardiovascular Disease by Area Committee Areas in Hull
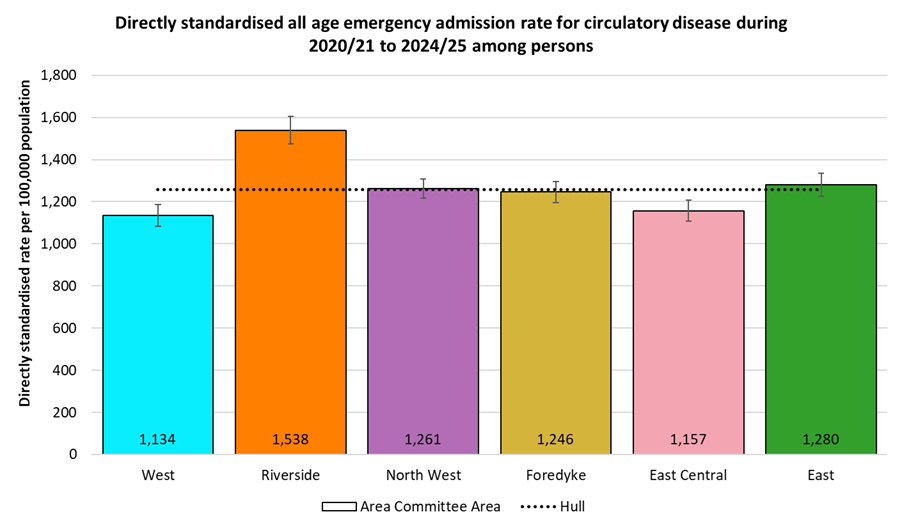
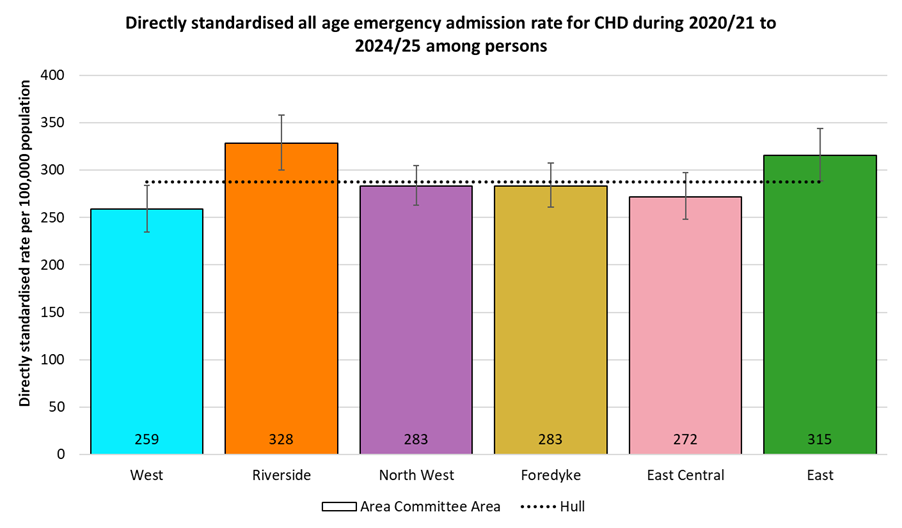
Directly age-standardised emergency admission rates can be produced for areas within Hull using data extracted from Hospital Episode Statistics. For the 5-year period 2020/21 to 2024/25 there was an average of 2,830 emergency hospital admissions for cardiovascular disease each year, giving a rate of 1,134 emergency admissions per 100,000 population. Cardiovascular disease emergency admission rates were statistically significantly higher than the Hull average for Riverside Area Committee Area, and statistically significantly lower for West and East Central Area Committee Areas.
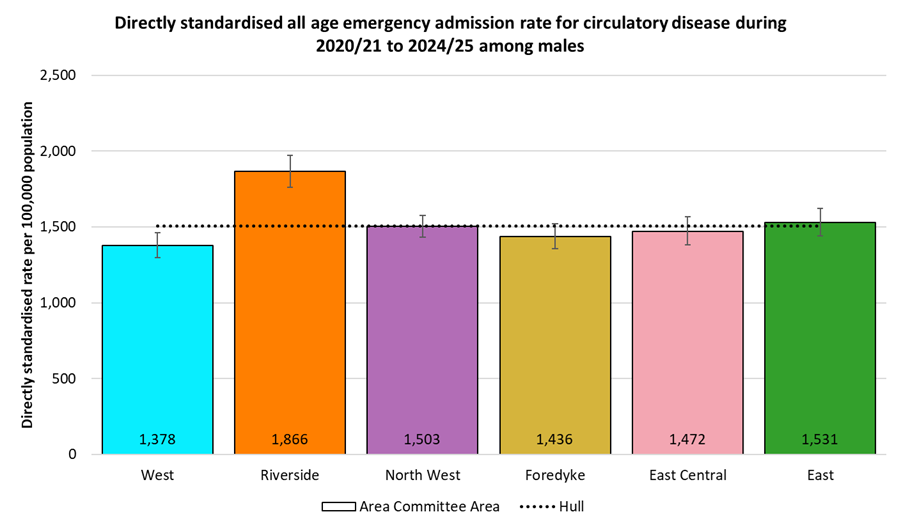
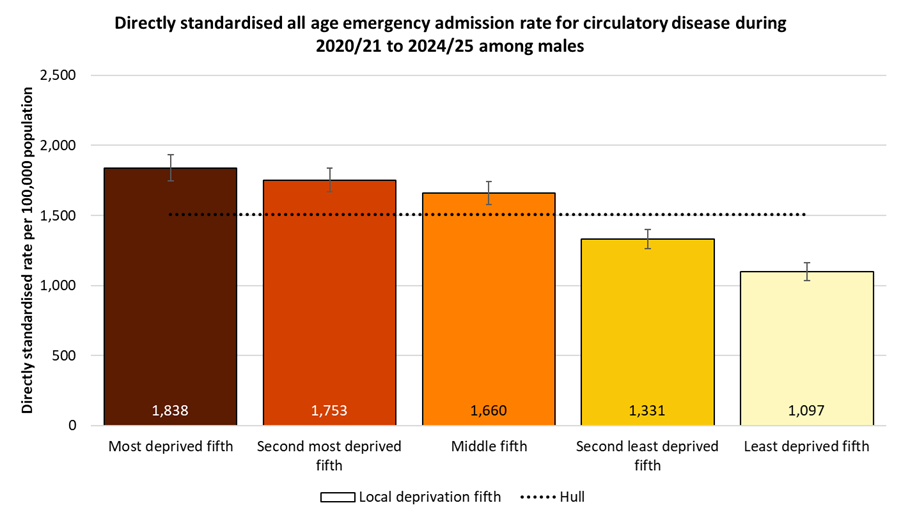
Emergency admission rates were highest among men. The rate for Riverside Area Committee Area was statistically significantly higher (by 24%) than the Hull average of 1,506 per 100,000 males, with only West Area Committee Area having a statistically significantly lower rate.
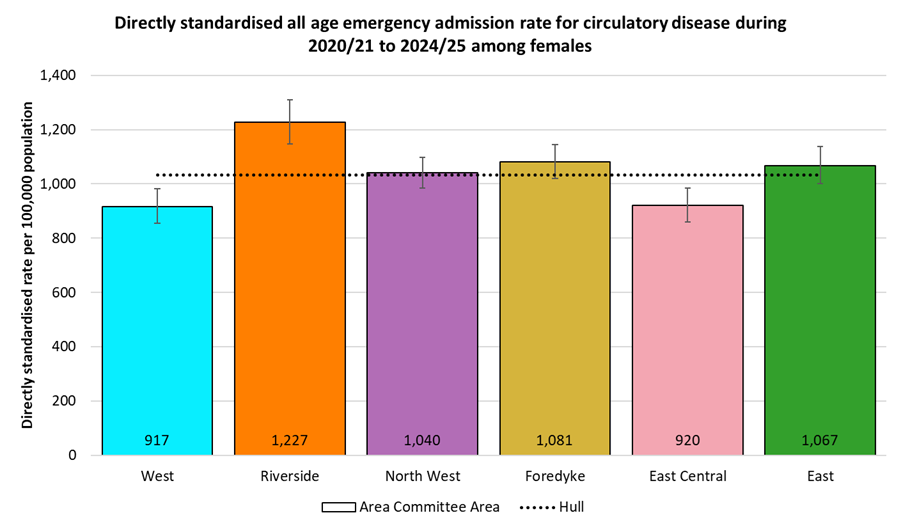
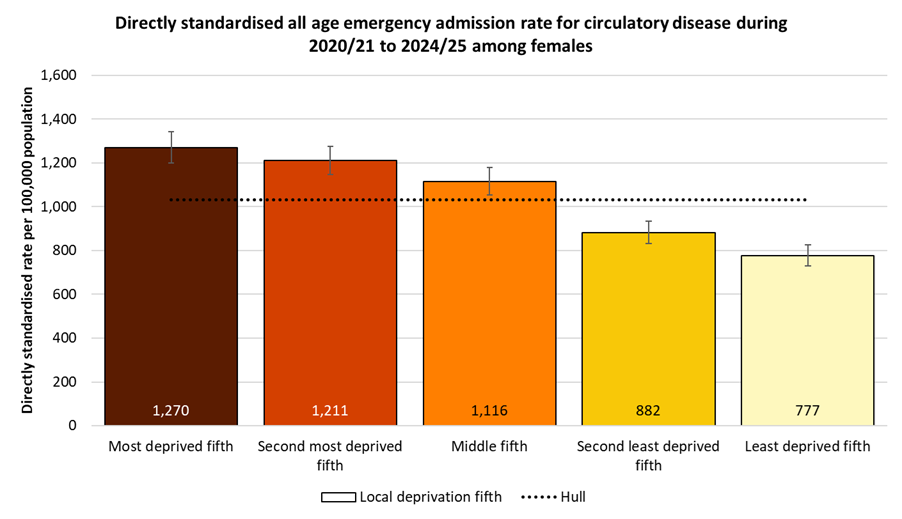
The pattern for women was similar, although the rates were around one third lower than for men. Again the rate of cardiovascular disease emergency admissions was statistically significantly higher in Riverside Area Committee Area than the Hull average of 1,033 per 100,000 females, with both West and East central Area Committee Areas having statistically significantly lower rates.
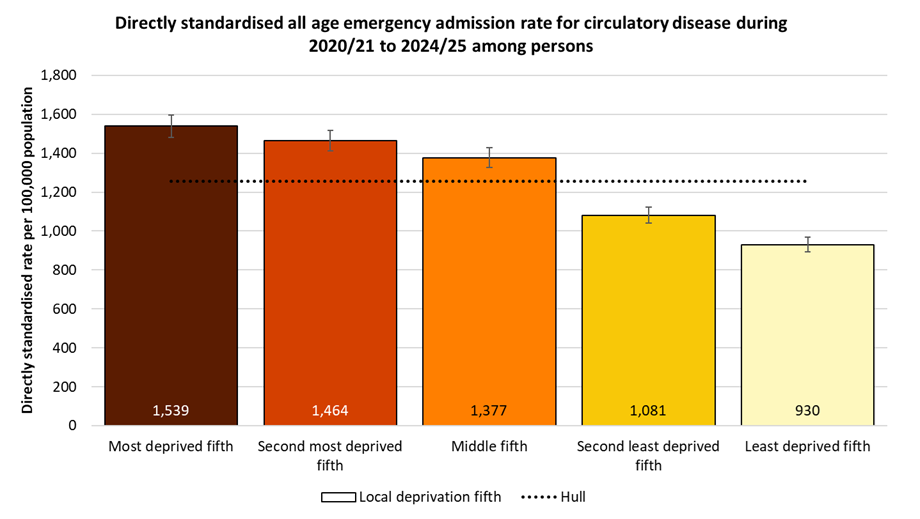
Emergency Hospital Admissions for Cardiovascular Disease by Local Deprivation Fifths
There was a clear deprivation gradient in cardiovascular disease emergency admissions, with the admission rate two thirds higher among residents of the most deprived fifth of areas of Hull, compared with those in the least deprived fifth of areas.
The deprivation gradient was also seen for emergency hospital admissions due to cardiovascular disease among men, with rates 68% higher among men living in the most deprived fifth of areas of Hull compared to those living in the least deprived fifth of areas.
The pattern was again similar for women, with those living in the most deprived fifth of areas having emergency admission rates due to cardiovascular disease 63% higher compared with women living in the least deprived fifth of areas of the city.
Premature Mortality Rates From Cardiovascular Disease
For deaths registered during 2023-25, the under 75 directly standardised mortality rate per 100,000 population from cardiovascular diseases in Hull were significantly higher than England, and were the highest rates amongst local authorities in the Yorkshire and Humber region.
Compared with benchmark
| Indicator | Period | England | Yorkshire and the Humber region (statistical) | Kingston upon Hull | East Riding of Yorkshire | North East Lincolnshire | North Lincolnshire | York | North Yorkshire UA | Barnsley | Doncaster | Rotherham | Sheffield | Bradford | Calderdale | Kirklees | Leeds | Wakefield |
|---|---|---|---|---|---|---|---|---|---|---|---|---|---|---|---|---|---|---|
Under 75 mortality rate from cardiovascular disease (Persons <75 yrs) | 2023 - 25 | 74.4 | 86.1 | 124.8 | 72.5 | 103.8 | 87.6 | 60.0 | 60.1 | 86.2 | 106.5 | 88.5 | 85.0 | 109.5 | 82.0 | 98.3 | 80.3 | 86.7 |
Under 75 mortality rate from cardiovascular disease (Male <75 yrs) | 2023 - 25 | 105.4 | 121.8 | 174.1 | 102.3 | 153.1 | 132.5 | 86.9 | 84.0 | 118.8 | 146.8 | 126.3 | 117.6 | 156.3 | 118.2 | 138.5 | 113.0 | 123.4 |
Under 75 mortality rate from cardiovascular disease (Female <75 yrs) | 2023 - 25 | 45.2 | 52.1 | 75.7 | 44.1 | 56.7 | 44.5 | 34.8 | 37.7 | 54.9 | 67.7 | 52.5 | 53.6 | 64.4 | 47.8 | 60.0 | 49.7 | 51.7 |
There were 816 premature deaths from cardiovascular diseases among Hull residents that were registered during the three year period 2023-25. the rate for Hull was 68% higher than England, 45% higher than the Yorkshire and Humber regional average and significantly higher than any other local authority in the region, and the second highest in England.
Compared with benchmark
Under 75 mortality rate from cardiovascular disease (Persons <75 yrs) 2023 - 25
| Area |
Recent
Trend |
Count
|
Value
|
95%
Lower CI |
95%
Upper CI |
|
|---|---|---|---|---|---|---|
| England | 110772 | 74.4 | 73.9 | 74.8 | ||
| Yorkshire and the Humber region (statistical) | 12717 | 86.1 | 84.6 | 87.6 | ||
| Kingston upon Hull | 816 | 124.8 | 116.3 | 133.7 | ||
| East Riding of Yorkshire | 838 | 72.5 | 67.6 | 77.6 | ||
| North East Lincolnshire | 472 | 103.8 | 94.6 | 113.6 | ||
| North Lincolnshire | 444 | 87.6 | 79.6 | 96.2 | ||
| York | 306 | 60.0 | 53.4 | 67.1 | ||
| North Yorkshire UA | 1220 | 60.1 | 56.7 | 63.6 | ||
| Barnsley | 602 | 86.2 | 79.4 | 93.4 | ||
| Doncaster | 918 | 106.5 | 99.7 | 113.6 | ||
| Rotherham | 648 | 88.5 | 81.8 | 95.7 | ||
| Sheffield | 1126 | 85.0 | 80.1 | 90.1 | ||
| Bradford | 1411 | 109.5 | 103.9 | 115.4 | ||
| Calderdale | 471 | 82.0 | 74.7 | 89.7 | ||
| Kirklees | 1106 | 98.3 | 92.6 | 104.3 | ||
| Leeds | 1491 | 80.3 | 76.3 | 84.5 | ||
| Wakefield | 848 | 86.7 | 81.0 | 92.8 |
Source: OHID, based on Office for National Statistics data
For men, there were 567 premature deaths from cardiovascular diseases among Hull residents that were registered during the three year period 2023-25. The rate for Hull males was statistically significantly higher than for England (65% higher) and the Yorkshire and Humber region (43% higher), and was considerably higher than all other local authorities in the region for 2023-25, and the second highest in England.
Compared with benchmark
Under 75 mortality rate from cardiovascular disease (Male <75 yrs) 2023 - 25
| Area |
Recent
Trend |
Count
|
Value
|
95%
Lower CI |
95%
Upper CI |
|
|---|---|---|---|---|---|---|
| England | 76154 | 105.4 | 104.7 | 106.2 | ||
| Yorkshire and the Humber region (statistical) | 8776 | 121.8 | 119.3 | 124.4 | ||
| Kingston upon Hull | 567 | 174.1 | 160.0 | 189.1 | ||
| East Riding of Yorkshire | 578 | 102.3 | 94.0 | 111.1 | ||
| North East Lincolnshire | 340 | 153.1 | 137.2 | 170.4 | ||
| North Lincolnshire | 325 | 132.5 | 118.4 | 147.8 | ||
| York | 214 | 86.9 | 75.6 | 99.3 | ||
| North Yorkshire UA | 825 | 84.0 | 78.3 | 90.0 | ||
| Barnsley | 407 | 118.8 | 107.5 | 130.9 | ||
| Doncaster | 619 | 146.8 | 135.4 | 158.9 | ||
| Rotherham | 452 | 126.3 | 114.9 | 138.6 | ||
| Sheffield | 764 | 117.6 | 109.4 | 126.3 | ||
| Bradford | 988 | 156.3 | 146.7 | 166.4 | ||
| Calderdale | 330 | 118.2 | 105.7 | 131.7 | ||
| Kirklees | 762 | 138.5 | 128.8 | 148.7 | ||
| Leeds | 1015 | 113.0 | 106.1 | 120.2 | ||
| Wakefield | 590 | 123.4 | 113.6 | 133.8 |
Source: OHID, based on Office for National Statistics data
Among women, there were 249 premature deaths from cardiovascular diseases among Hull residents that were registered during the three year period 2023-25. As with men, the rate for Hull females was statistically significantly higher than for England (67% higher) and the Yorkshire and Humber region (45% higher), and was considerably higher than all other local authorities in the region for 2023-25, and the second highest in England.
Compared with benchmark
Under 75 mortality rate from cardiovascular disease (Female <75 yrs) 2023 - 25
| Area |
Recent
Trend |
Count
|
Value
|
95%
Lower CI |
95%
Upper CI |
|
|---|---|---|---|---|---|---|
| England | 34618 | 45.2 | 44.7 | 45.7 | ||
| Yorkshire and the Humber region (statistical) | 3941 | 52.1 | 50.4 | 53.7 | ||
| Kingston upon Hull | 249 | 75.7 | 66.5 | 85.7 | ||
| East Riding of Yorkshire | 260 | 44.1 | 38.8 | 49.9 | ||
| North East Lincolnshire | 132 | 56.7 | 47.4 | 67.4 | ||
| North Lincolnshire | 119 | 44.5 | 36.9 | 53.3 | ||
| York | 92 | 34.8 | 28.0 | 42.7 | ||
| North Yorkshire UA | 395 | 37.7 | 34.0 | 41.7 | ||
| Barnsley | 195 | 54.9 | 47.4 | 63.2 | ||
| Doncaster | 299 | 67.7 | 60.2 | 75.8 | ||
| Rotherham | 196 | 52.5 | 45.4 | 60.4 | ||
| Sheffield | 362 | 53.6 | 48.2 | 59.4 | ||
| Bradford | 423 | 64.4 | 58.4 | 70.9 | ||
| Calderdale | 141 | 47.8 | 40.3 | 56.4 | ||
| Kirklees | 344 | 60.0 | 53.8 | 66.7 | ||
| Leeds | 476 | 49.7 | 45.3 | 54.4 | ||
| Wakefield | 258 | 51.7 | 45.6 | 58.4 |
Source: OHID, based on Office for National Statistics data
The premature mortality rate from cardiovascular disease in Hull decreased relatively sharply between 2001-03 to 2011-13 falling from 176 to 101 deaths per 100,000 population. However, since then the mortality has increased slightly from 102 to 108 deaths per 100,000 population between 2011-13 and 2018-20 with a slightly greater increase between 2018-20 and 2022-24, although a small decrease in 2023-25, with the latest mortality rate being 125 per 100,000 population. The last time the mortality rates were this high in Hull was 2008-10.
In contrast, whilst the mortality rate for the region and England also showed a decrease between 2001-03 to 2011-13, the decreases in the region and England continued beyond 2011-13, albeit at a reduced rate of decrease. The premature mortality rate from cardiovascular disease also increased for the region and England between 2018-20 and 2022-24, but at a smaller rate than for Hull, and the decreased in 2024-25, but by more than Hull.
As a result, the inequalities gap between Hull and England has increased since 2011-13.
For the latest three year period 2023-25, there were 816 deaths registered among Hull residents aged under 75 years from cardiovascular disease which is an average of 272 deaths per year.
Compared with benchmark
Under 75 mortality rate from cardiovascular disease (Persons <75 yrs)
|
Period
|
Kingston upon Hull |
Yorkshire and the Humber region (statistical)
|
England
|
||||
|---|---|---|---|---|---|---|---|
|
Count
|
Value
|
95%
Lower CI |
95%
Upper CI |
||||
| 2001 - 03 | • | 941 | 176.4 | 165.3 | 188.1 | 147.6 | 138.0 |
| 2002 - 04 | • | 892 | 167.4 | 156.6 | 178.8 | 136.3 | 129.5 |
| 2003 - 05 | • | 849 | 159.7 | 149.1 | 170.9 | 127.7 | 120.9 |
| 2004 - 06 | • | 811 | 152.7 | 142.3 | 163.6 | 120.4 | 112.3 |
| 2005 - 07 | • | 762 | 142.9 | 132.9 | 153.5 | 113.9 | 105.1 |
| 2006 - 08 | • | 743 | 139.8 | 129.9 | 150.3 | 109.3 | 99.0 |
| 2007 - 09 | • | 705 | 132.1 | 122.4 | 142.3 | 103.0 | 93.1 |
| 2008 - 10 | • | 690 | 128.9 | 119.4 | 139.0 | 99.4 | 88.6 |
| 2009 - 11 | • | 639 | 118.0 | 108.9 | 127.6 | 94.3 | 84.0 |
| 2010 - 12 | • | 584 | 107.1 | 98.5 | 116.2 | 91.0 | 80.8 |
| 2011 - 13 | • | 564 | 102.1 | 93.7 | 110.9 | 86.9 | 77.8 |
| 2012 - 14 | • | 587 | 105.2 | 96.8 | 114.2 | 84.7 | 75.8 |
| 2013 - 15 | • | 603 | 106.8 | 98.3 | 115.7 | 83.6 | 74.7 |
| 2014 - 16 | • | 618 | 107.6 | 99.2 | 116.6 | 83.4 | 73.6 |
| 2015 - 17 | • | 621 | 104.9 | 96.8 | 113.6 | 82.7 | 72.7 |
| 2016 - 18 | • | 639 | 105.0 | 96.9 | 113.5 | 82.2 | 71.9 |
| 2017 - 19 | • | 659 | 106.0 | 98.0 | 114.4 | 80.4 | 70.7 |
| 2018 - 20 | • | 685 | 108.3 | 100.4 | 116.8 | 80.4 | 71.7 |
| 2019 - 21 | • | 713 | 111.3 | 103.3 | 119.8 | 82.2 | 73.1 |
| 2020 - 22 | • | 760 | 118.2 | 110.0 | 127.0 | 86.4 | 76.0 |
| 2021 - 23 | • | 774 | 119.8 | 111.5 | 128.5 | 88.1 | 77.0 |
| 2022 - 24 | • | 811 | 125.3 | 116.8 | 134.2 | 88.3 | 76.5 |
| 2023 - 25 | • | 816 | 124.8 | 116.3 | 133.7 | 86.1 | 74.4 |
Source: OHID, based on Office for National Statistics data
The trend over time for males is similar with a relatively sharp decrease in the premature mortality rate from cardiovascular disease between 2001-03 and 2011-13 from 248 to 145 deaths per 100,000 population followed by a gradual increase to 151 deaths per 100,000 population prior to the pandemic in 2017-19, with a slightly greater increase between 2018-20 and 2022-24, before a small decrease in 2023-25 to 174 deaths per 100,000 population.
Again, in contrast, the mortality rate for the region and England declined the whole period prior to the pandemic, increased at a smaller rate between 2018-20 and 2022-24 and decreased more sharply in 2023-25.
The premature mortality rate for males for 2023-25 is similar to the rate in 2008-10 in Hull.
Among men, there were 567 premature deaths from cardiovascular disease over the three year period 2023-25 which equates to an average of 189 per year.
Seven in ten of all the premature deaths from cardiovascular disease in Hull were among men.
Compared with benchmark
Under 75 mortality rate from cardiovascular disease (Male <75 yrs)
|
Period
|
Kingston upon Hull |
Yorkshire and the Humber region (statistical)
|
England
|
||||
|---|---|---|---|---|---|---|---|
|
Count
|
Value
|
95%
Lower CI |
95%
Upper CI |
||||
| 2001 - 03 | • | 640 | 248.4 | 229.4 | 268.6 | 206.8 | 193.8 |
| 2002 - 04 | • | 580 | 224.7 | 206.6 | 243.8 | 191.7 | 182.3 |
| 2003 - 05 | • | 548 | 211.8 | 194.3 | 230.5 | 179.7 | 170.3 |
| 2004 - 06 | • | 512 | 197.0 | 180.1 | 214.9 | 169.4 | 158.2 |
| 2005 - 07 | • | 495 | 189.2 | 172.8 | 206.8 | 159.6 | 147.9 |
| 2006 - 08 | • | 489 | 186.7 | 170.3 | 204.1 | 152.7 | 139.3 |
| 2007 - 09 | • | 474 | 179.8 | 163.8 | 196.9 | 144.7 | 131.4 |
| 2008 - 10 | • | 471 | 178.2 | 162.2 | 195.2 | 139.5 | 125.5 |
| 2009 - 11 | • | 439 | 164.6 | 149.4 | 181.0 | 133.4 | 119.4 |
| 2010 - 12 | • | 402 | 149.2 | 134.7 | 164.7 | 128.4 | 114.0 |
| 2011 - 13 | • | 397 | 144.6 | 130.5 | 159.8 | 122.9 | 109.6 |
| 2012 - 14 | • | 412 | 148.2 | 134.0 | 163.5 | 119.5 | 106.2 |
| 2013 - 15 | • | 419 | 149.1 | 134.9 | 164.3 | 117.5 | 104.8 |
| 2014 - 16 | • | 413 | 144.3 | 130.5 | 159.2 | 116.2 | 102.8 |
| 2015 - 17 | • | 426 | 144.3 | 130.7 | 158.8 | 113.8 | 101.5 |
| 2016 - 18 | • | 445 | 146.1 | 132.7 | 160.4 | 112.7 | 100.7 |
| 2017 - 19 | • | 472 | 151.6 | 138.2 | 166.0 | 110.8 | 99.3 |
| 2018 - 20 | • | 486 | 153.3 | 139.9 | 167.6 | 111.7 | 101.2 |
| 2019 - 21 | • | 512 | 159.9 | 146.3 | 174.4 | 115.2 | 103.4 |
| 2020 - 22 | • | 538 | 167.7 | 153.8 | 182.6 | 121.0 | 107.7 |
| 2021 - 23 | • | 544 | 169.1 | 155.1 | 184.0 | 123.7 | 109.0 |
| 2022 - 24 | • | 565 | 175.4 | 161.1 | 190.5 | 124.3 | 108.3 |
| 2023 - 25 | • | 567 | 174.1 | 160.0 | 189.1 | 121.8 | 105.4 |
Source: OHID, based on Office for National Statistics data
A reasonably similar pattern in the trends over time occurred for Hull women, although there were slight differences. The mortality rate decreased between 2004-06 and 2011-13 from 110 to 61 deaths per 100,000 population, then increased to a peak of 72 death per 100,000 population for 2014-16. The mortality rate then declined to a low of 60 per 100,000 population in 2017-19 but has increased since the pandemic with 76 deaths per 100,000 population for 2023-25. Again, for the region and for England, the premature deaths from cardiovascular disease had reduced for almost 20 years, and only increased very marginally in the last 3-4 years.
Among women living in Hull, there were 249 premature deaths from cardiovascular disease over the three year period 2023-25 which equates to an average of 83 per year.
Three in ten of all the premature deaths from cardiovascular disease in Hull were among women.
Compared with benchmark
Under 75 mortality rate from cardiovascular disease (Female <75 yrs)
|
Period
|
Kingston upon Hull |
Yorkshire and the Humber region (statistical)
|
England
|
||||
|---|---|---|---|---|---|---|---|
|
Count
|
Value
|
95%
Lower CI |
95%
Upper CI |
||||
| 2001 - 03 | • | 301 | 108.3 | 96.4 | 121.2 | 93.7 | 86.7 |
| 2002 - 04 | • | 312 | 112.8 | 100.6 | 126.1 | 85.7 | 80.8 |
| 2003 - 05 | • | 301 | 109.7 | 97.7 | 122.9 | 79.9 | 75.1 |
| 2004 - 06 | • | 298 | 109.9 | 97.8 | 123.2 | 75.2 | 69.5 |
| 2005 - 07 | • | 266 | 98.2 | 86.7 | 110.7 | 71.5 | 65.1 |
| 2006 - 08 | • | 253 | 94.2 | 82.9 | 106.6 | 68.7 | 61.2 |
| 2007 - 09 | • | 230 | 85.7 | 74.9 | 97.5 | 64.0 | 57.0 |
| 2008 - 10 | • | 219 | 81.1 | 70.6 | 92.6 | 61.7 | 53.8 |
| 2009 - 11 | • | 200 | 73.0 | 63.2 | 83.9 | 57.5 | 50.7 |
| 2010 - 12 | • | 182 | 66.2 | 56.9 | 76.7 | 55.6 | 49.4 |
| 2011 - 13 | • | 167 | 60.6 | 51.7 | 70.5 | 52.9 | 47.9 |
| 2012 - 14 | • | 175 | 63.1 | 54.1 | 73.3 | 51.7 | 46.9 |
| 2013 - 15 | • | 184 | 65.3 | 56.2 | 75.6 | 51.3 | 46.3 |
| 2014 - 16 | • | 205 | 71.5 | 61.9 | 82.1 | 52.0 | 45.9 |
| 2015 - 17 | • | 195 | 66.0 | 57.0 | 76.0 | 52.9 | 45.3 |
| 2016 - 18 | • | 194 | 64.0 | 55.3 | 73.7 | 52.9 | 44.6 |
| 2017 - 19 | • | 187 | 60.3 | 52.0 | 69.7 | 51.1 | 43.6 |
| 2018 - 20 | • | 199 | 63.2 | 54.7 | 72.6 | 50.4 | 43.9 |
| 2019 - 21 | • | 201 | 62.9 | 54.5 | 72.2 | 50.7 | 44.5 |
| 2020 - 22 | • | 222 | 69.0 | 60.2 | 78.7 | 53.3 | 46.1 |
| 2021 - 23 | • | 230 | 70.8 | 61.9 | 80.6 | 54.1 | 46.9 |
| 2022 - 24 | • | 246 | 75.4 | 66.2 | 85.4 | 53.9 | 46.5 |
| 2023 - 25 | • | 249 | 75.7 | 66.5 | 85.7 | 52.1 | 45.2 |
Source: OHID, based on Office for National Statistics data
Premature Mortality Rates Across Hull’s Electoral Wards
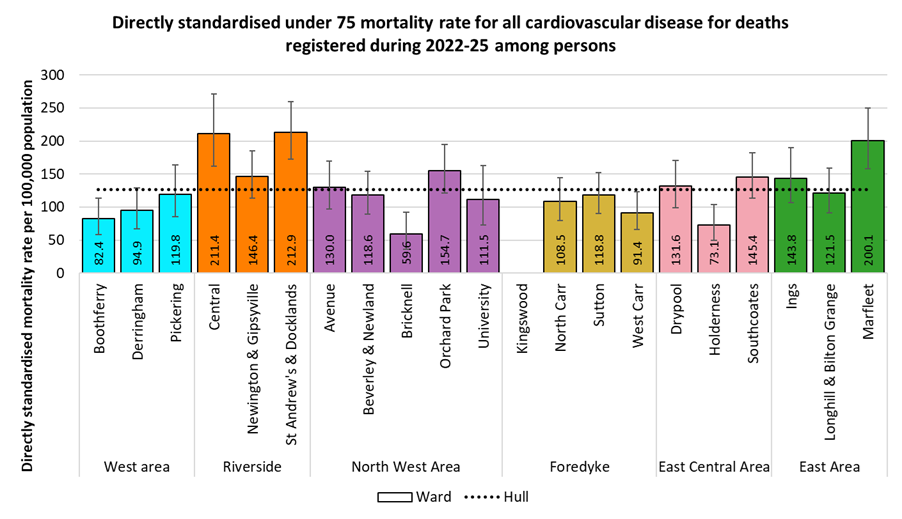
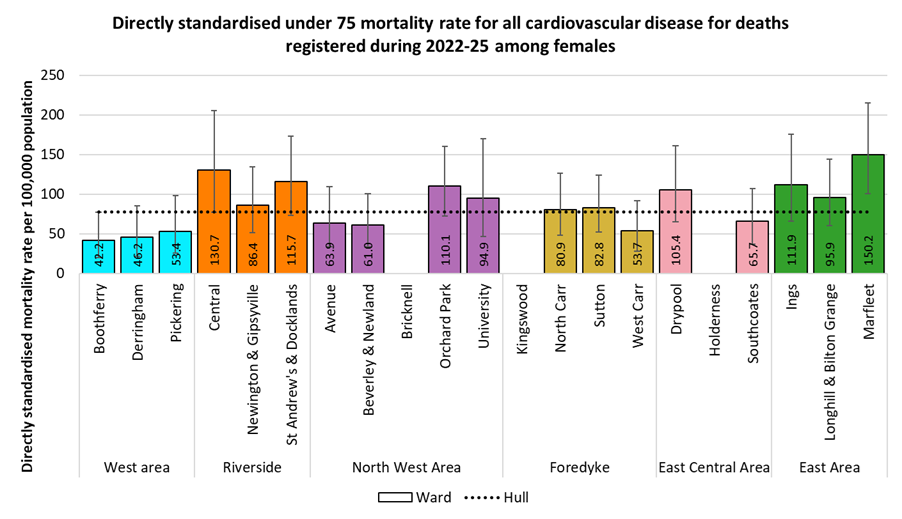
Mortality rates from cardiovascular disease display a large variation between the 21 wards in Hull.
For deaths registered during 2022-25, the directly standardised mortality rates per 100,000 persons (standardised to the European Standard Population) for deaths from cardiovascular diseases under the age of 75 years varies between 60 and 211 deaths per 100,000 population across the wards. The under 75 age-standardised mortality rate for 2022-25 is 3.5 times higher in Central ward than in Bricknell ward.
Age-standardised cardiovascular disease mortality rates are associated with deprivation, with rates highest in the most deprived wards and lowest in the least deprived wards. The mortality rates for Central, St Andrew’s & Docklands and Marfleet were each statistically higher than the Hull average, while rates in Bricknell, Holderness, Boothferry and West Carr were all significantly lower than the Hull average.
There were fewer than 10 premature deaths from cardiovascular diseases in Kingswood ward, so it is not possible to produce a statistically robust mortality rate for this ward.
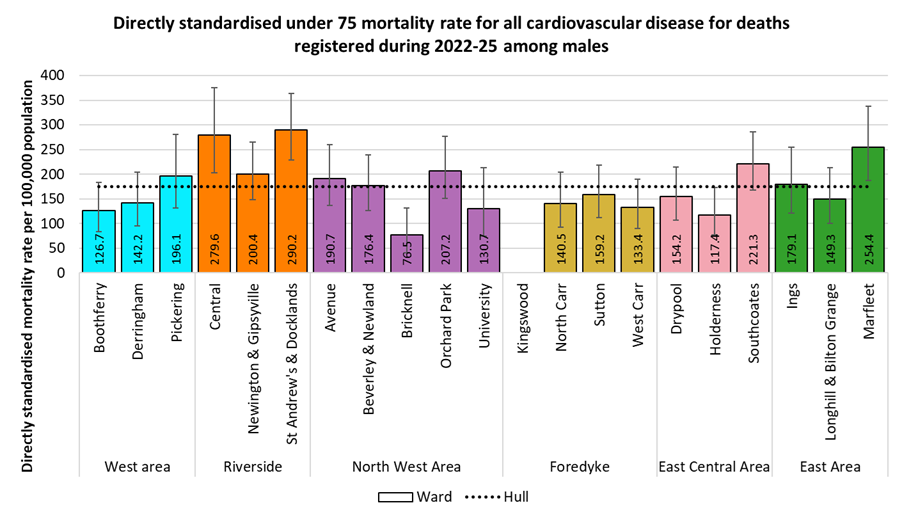
The pattern by ward was similar for men, with premature age-standardised cardiovascular disease mortality rates ranging from 77 to 290 deaths per 100,000 population across Hull wards for deaths occurring during 2022-25. The premature cardiovascular disease mortality rate for men in St Andrew’s & Docklands ward was 3.8 times higher than in Bricknell ward.
Men living in St Andrew’s & Docklands, Central and Marfleet wards had premature cardiovascular disease mortality rates that were statistically significantly higher than the Hull average, while men in Bricknell and Holderness wards had significantly lower rates.
A similar pattern by ward was also seen for women, although it should be noted that three wards, Bricknell, Kingswood and Holderness had fewer than 10 deaths each, so a mortality rate could not be produced for these wards, and these three ward being the least deprived in Hull often have the lowest premature mortality rates.
Among wards with at least 10 deaths occurring during 2022-25 among women aged under 75 , the age-standardised cardiovascular disease mortality rates ranged between 42 and 150 deaths per 100,000 population. The premature cardiovascular disease mortality rate for women in Marfleet ward was 3.6 times higher than in Boothferry ward.
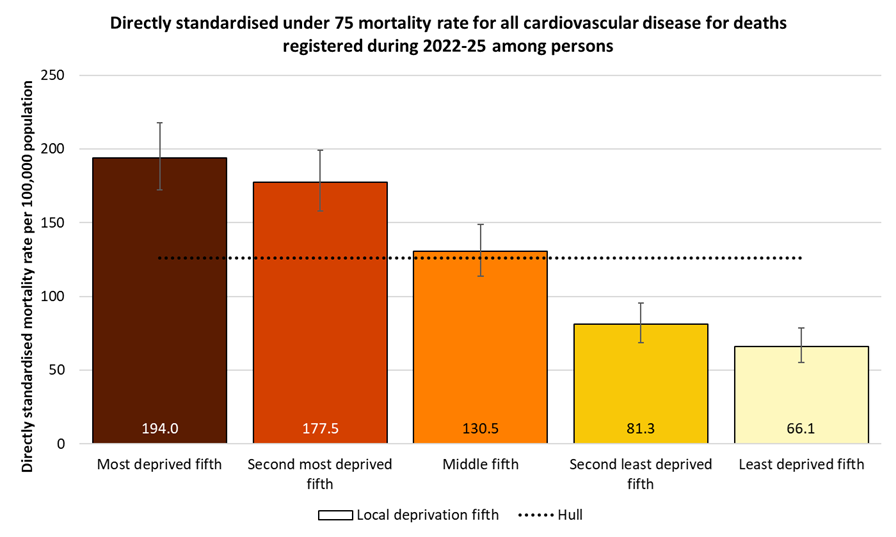
Premature Mortality Rates by Local Deprivation Fifths
As noted above, there is a strong association between premature mortality from cardiovascular disease and deprivation.
For deaths registered during 2022-25, the directly age-standardised under 75 cardiovascular disease mortality rates per 100,000 population (standardised to the European Standard Population) ranged from 66 deaths per 100,000 population living in the least deprived fifth of areas of Hull to 194 deaths per 100,000 population living in the most deprived fifth of areas of the city. The mortality rate in the most deprived fifth of areas was almost three times higher than in the least deprived fifth of areas.
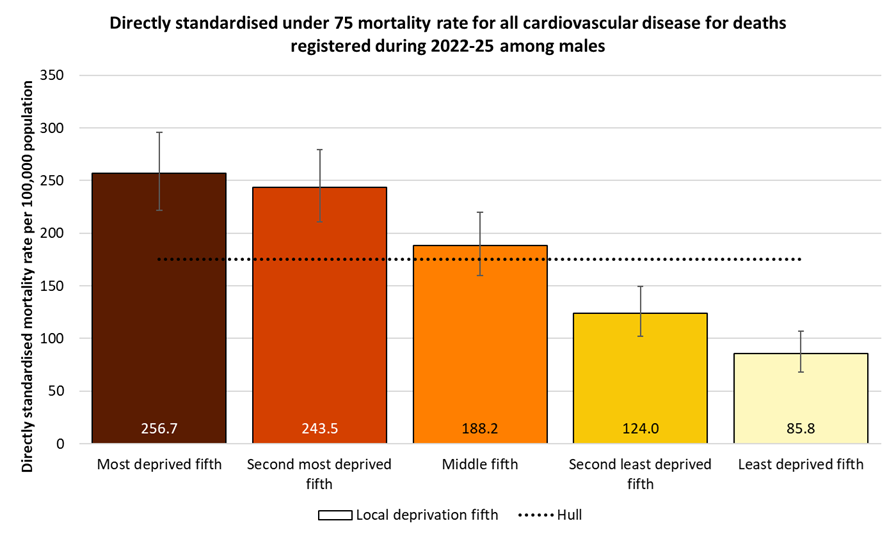
A similar pattern by deprivation fifths occurs among men, although with higher rates. The premature cardiovascular disease mortality rate ranges from 86 deaths per 100,000 men living in the least deprived fifth of areas of Hull to 257 deaths per 100,000 men living in the most deprived fifth of areas of the city, so three times higher among men in the most deprived parts of the city compared to those in the least deprived parts.
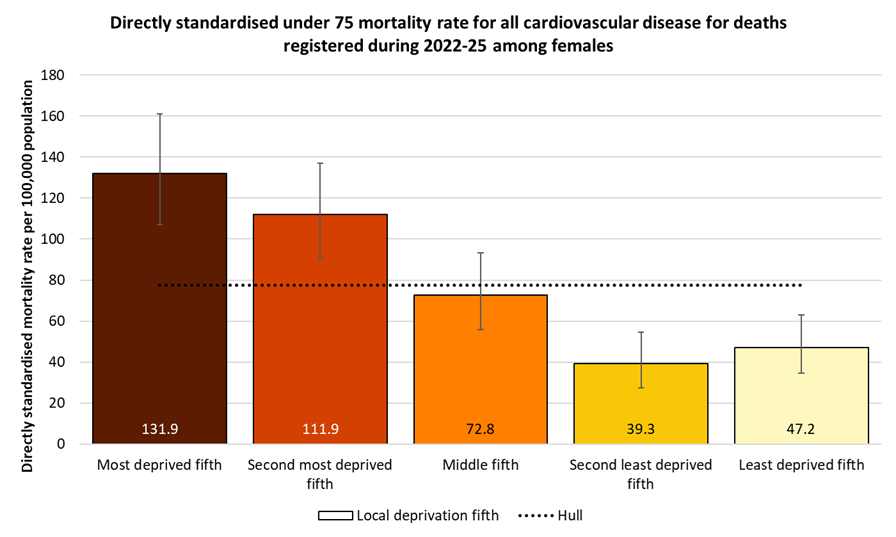
A similar pattern by deprivation is seen among women, although the mortality rates among women are around half of those for men. The premature cardiovascular disease mortality rate ranges from 39 deaths per 100,000 women living in the second least deprived fifth of areas of Hull (women in the least deprived fifth had a slightly higher rate of 47 deaths per 100,000 women) to 132 deaths per 100,000 women living in the most deprived fifth of areas of the city, so 3.4 and 2.8 times higher among women in the most deprived fifth of the city compared to those in the second least deprived and least deprived fifths.
Premature Cardiovascular Disease Mortality from Causes Considered Preventable
The Office for Health Improvement & Disparities’ Fingertips tool also gives the mortality rates for cardiovascular disease that occur prior to the age of 75 years that are considered to be preventable.
For 2022-24, the under 75 standardised mortality rate for cardiovascular diseases was 64% higher in Hull than England, but the under 75 mortality rate from causes considered preventable is 69% higher in Hull. Thus, a higher proportion of the premature cardiovascular disease deaths in Hull are considered to be preventable than for England.
The premature mortality rates from cardiovascular diseases considered preventable in Hull were the highest in the region for men and the third highest for women for deaths registered during 2022-24.
Compared with benchmark
| Indicator | Period | England | Yorkshire and the Humber region (statistical) | Kingston upon Hull | East Riding of Yorkshire | North East Lincolnshire | North Lincolnshire | York | North Yorkshire UA | Barnsley | Doncaster | Rotherham | Sheffield | Bradford | Calderdale | Kirklees | Leeds | Wakefield |
|---|---|---|---|---|---|---|---|---|---|---|---|---|---|---|---|---|---|---|
Under 75 mortality rate from cardiovascular disease considered preventable (Persons <75 yrs) | 2022 - 24 | 30.2 | 35.6 | 50.9 | 29.4 | 44.9 | 38.7 | 26.2 | 26.4 | 35.7 | 44.3 | 40.8 | 33.4 | 47.7 | 32.4 | 38.6 | 30.5 | 35.1 |
Under 75 mortality rate from cardiovascular disease considered preventable (Male <75 yrs) | 2022 - 24 | 44.2 | 51.6 | 75.3 | 43.3 | 67.5 | 59.0 | 41.6 | 37.8 | 49.8 | 60.9 | 56.7 | 48.8 | 68.3 | 48.2 | 56.8 | 43.8 | 51.3 |
Under 75 mortality rate from cardiovascular disease considered preventable (Female <75 yrs) | 2022 - 24 | 17.1 | 20.3 | 26.5 | 16.2 | 23.4 | 19.2 | 11.9 | 15.8 | 22.2 | 28.5 | 25.6 | 18.7 | 27.8 | 17.5 | 21.2 | 18.1 | 19.7 |
The trend in the premature mortality rate from cardiovascular diseases considered to be preventable follows a similar pattern to that for the premature mortality rate from all cardiovascular diseases, with the rate almost halving between 2001-03 and 2011-13 before small annual increases since.
There were 328 deaths during 2022-2024 from cardiovascular diseases among Hull residents under the age of 75 years which were considered to be preventable. This represented 40% of all premature cariovascular deaths.
Compared with benchmark
Under 75 mortality rate from cardiovascular disease considered preventable (Persons <75 yrs)
|
Period
|
Kingston upon Hull |
Yorkshire and the Humber region (statistical)
|
England
|
||||
|---|---|---|---|---|---|---|---|
|
Count
|
Value
|
95%
Lower CI |
95%
Upper CI |
||||
| 2001 - 03 | • | 423 | 79.7 | 72.3 | 87.7 | 66.2 | 60.8 |
| 2002 - 04 | • | 396 | 74.6 | 67.4 | 82.3 | 60.5 | 56.7 |
| 2003 - 05 | • | 371 | 70.2 | 63.2 | 77.8 | 56.2 | 52.5 |
| 2004 - 06 | • | 357 | 67.7 | 60.8 | 75.1 | 52.7 | 48.5 |
| 2005 - 07 | • | 335 | 63.4 | 56.8 | 70.6 | 49.8 | 45.1 |
| 2006 - 08 | • | 325 | 61.4 | 54.9 | 68.5 | 47.4 | 42.2 |
| 2007 - 09 | • | 305 | 57.3 | 51.0 | 64.1 | 44.4 | 39.3 |
| 2008 - 10 | • | 292 | 54.9 | 48.7 | 61.6 | 42.4 | 37.2 |
| 2009 - 11 | • | 268 | 49.8 | 44.0 | 56.2 | 39.9 | 35.0 |
| 2010 - 12 | • | 244 | 45.2 | 39.7 | 51.3 | 38.2 | 33.4 |
| 2011 - 13 | • | 234 | 42.7 | 37.3 | 48.6 | 36.2 | 32.0 |
| 2012 - 14 | • | 244 | 44.2 | 38.8 | 50.1 | 35.0 | 31.0 |
| 2013 - 15 | • | 247 | 44.0 | 38.6 | 49.9 | 34.2 | 30.3 |
| 2014 - 16 | • | 252 | 44.2 | 38.8 | 50.1 | 33.8 | 29.7 |
| 2015 - 17 | • | 258 | 43.8 | 38.6 | 49.6 | 33.4 | 29.1 |
| 2016 - 18 | • | 264 | 43.7 | 38.6 | 49.4 | 33.1 | 28.7 |
| 2017 - 19 | • | 278 | 45.1 | 39.9 | 50.7 | 32.6 | 28.2 |
| 2018 - 20 | • | 281 | 44.7 | 39.6 | 50.3 | 32.5 | 28.5 |
| 2019 - 21 | • | 294 | 46.1 | 41.0 | 51.7 | 33.3 | 29.0 |
| 2020 - 22 | • | 310 | 48.3 | 43.1 | 54.0 | 35.0 | 30.1 |
| 2021 - 23 | • | 321 | 49.8 | 44.4 | 55.5 | 35.7 | 30.5 |
| 2022 - 24 | • | 328 | 50.9 | 45.5 | 56.7 | 35.6 | 30.2 |
Source: OHID, based on Office for National Statistics data
A similar pattern was seen among men, with premature deaths from cardiovascular disease that were considered preventable almost halving between 2001-03 and 2014-16, before increasing slowly since then. Although similar trends were seen for the Yorkshire and Humber region and for England, the increases in Hull were larger, so the inequalities gap has increased since 2001-03.
There were 242 male premature deaths from cardiovascular diseases considered to be preventable over the three year period 2022-24 which equates to an average of 81 deaths per year, and is 43% of all premature cardiovascular disease deaths among men.
Compared with benchmark
Under 75 mortality rate from cardiovascular disease considered preventable (Male <75 yrs)
|
Period
|
Kingston upon Hull |
Yorkshire and the Humber region (statistical)
|
England
|
||||
|---|---|---|---|---|---|---|---|
|
Count
|
Value
|
95%
Lower CI |
95%
Upper CI |
||||
| 2001 - 03 | • | 291 | 113.9 | 101.1 | 127.8 | 94.8 | 87.4 |
| 2002 - 04 | • | 259 | 101.1 | 89.1 | 114.2 | 86.7 | 81.7 |
| 2003 - 05 | • | 238 | 92.6 | 81.1 | 105.2 | 80.7 | 75.9 |
| 2004 - 06 | • | 223 | 86.6 | 75.5 | 98.8 | 75.7 | 70.0 |
| 2005 - 07 | • | 217 | 83.9 | 73.1 | 95.9 | 71.5 | 65.1 |
| 2006 - 08 | • | 216 | 83.1 | 72.3 | 95.1 | 68.0 | 60.9 |
| 2007 - 09 | • | 208 | 79.4 | 68.9 | 91.1 | 63.9 | 57.1 |
| 2008 - 10 | • | 207 | 78.8 | 68.3 | 90.4 | 61.2 | 54.1 |
| 2009 - 11 | • | 190 | 72.0 | 62.0 | 83.2 | 58.1 | 51.0 |
| 2010 - 12 | • | 173 | 65.2 | 55.7 | 75.8 | 55.5 | 48.4 |
| 2011 - 13 | • | 169 | 62.4 | 53.2 | 72.6 | 52.6 | 46.3 |
| 2012 - 14 | • | 173 | 63.2 | 54.0 | 73.5 | 50.7 | 44.8 |
| 2013 - 15 | • | 175 | 63.0 | 53.8 | 73.2 | 49.6 | 43.9 |
| 2014 - 16 | • | 171 | 60.7 | 51.8 | 70.6 | 48.6 | 42.9 |
| 2015 - 17 | • | 184 | 62.8 | 53.9 | 72.7 | 47.5 | 42.1 |
| 2016 - 18 | • | 190 | 62.8 | 54.2 | 72.5 | 47.0 | 41.7 |
| 2017 - 19 | • | 206 | 66.4 | 57.6 | 76.2 | 46.4 | 41.0 |
| 2018 - 20 | • | 205 | 64.9 | 56.3 | 74.5 | 46.4 | 41.5 |
| 2019 - 21 | • | 218 | 68.5 | 59.7 | 78.2 | 47.9 | 42.4 |
| 2020 - 22 | • | 227 | 71.1 | 62.1 | 80.9 | 50.3 | 44.0 |
| 2021 - 23 | • | 234 | 73.1 | 64.0 | 83.1 | 51.6 | 44.5 |
| 2022 - 24 | • | 242 | 75.3 | 66.0 | 85.4 | 51.6 | 44.2 |
Source: OHID, based on Office for National Statistics data
A slightly different trend was seen for women, with premature deaths from cardiovascular disease that were considered preventable not starting to decrease until after 2004-06, but they then decreased by half by 2011-13. Since then, despite a bit of annual variation, there has been little change in the rate for women in Hull. Similar trends were seen for both the Yorkshire and Humber region and England, although rates in these two areas deceased from 2001-03 onwards. The inequalities gap among women has halved since 2004-06.
There were 86 female premature deaths from cardiovascular diseases considered to be preventable over the three year period 2022-24 which equates to an average of 29 deaths per year, and is 35% of all premature cardiovascular disease deaths among women.
Compared with benchmark
Under 75 mortality rate from cardiovascular disease considered preventable (Female <75 yrs)
|
Period
|
Kingston upon Hull |
Yorkshire and the Humber region (statistical)
|
England
|
||||
|---|---|---|---|---|---|---|---|
|
Count
|
Value
|
95%
Lower CI |
95%
Upper CI |
||||
| 2001 - 03 | • | 132 | 47.5 | 39.8 | 56.4 | 40.3 | 36.4 |
| 2002 - 04 | • | 136 | 49.3 | 41.4 | 58.4 | 36.6 | 33.6 |
| 2003 - 05 | • | 132 | 48.7 | 40.8 | 57.8 | 33.8 | 31.0 |
| 2004 - 06 | • | 133 | 49.4 | 41.4 | 58.6 | 31.5 | 28.4 |
| 2005 - 07 | • | 117 | 43.6 | 36.0 | 52.2 | 29.6 | 26.4 |
| 2006 - 08 | • | 108 | 40.4 | 33.1 | 48.8 | 28.2 | 24.6 |
| 2007 - 09 | • | 96 | 35.8 | 29.0 | 43.8 | 26.1 | 22.7 |
| 2008 - 10 | • | 85 | 31.7 | 25.3 | 39.2 | 24.9 | 21.2 |
| 2009 - 11 | • | 77 | 28.5 | 22.5 | 35.6 | 22.9 | 19.8 |
| 2010 - 12 | • | 70 | 26.0 | 20.2 | 32.8 | 22.0 | 19.2 |
| 2011 - 13 | • | 64 | 23.6 | 18.1 | 30.1 | 20.7 | 18.4 |
| 2012 - 14 | • | 71 | 25.6 | 20.0 | 32.4 | 20.1 | 17.9 |
| 2013 - 15 | • | 72 | 25.5 | 19.9 | 32.2 | 19.7 | 17.5 |
| 2014 - 16 | • | 80 | 28.1 | 22.2 | 35.0 | 19.6 | 17.2 |
| 2015 - 17 | • | 74 | 25.1 | 19.7 | 31.6 | 19.9 | 16.8 |
| 2016 - 18 | • | 74 | 24.7 | 19.4 | 31.1 | 19.9 | 16.4 |
| 2017 - 19 | • | 72 | 23.7 | 18.5 | 29.8 | 19.4 | 16.0 |
| 2018 - 20 | • | 76 | 24.5 | 19.3 | 30.6 | 19.3 | 16.1 |
| 2019 - 21 | • | 75 | 23.7 | 18.7 | 29.7 | 19.3 | 16.4 |
| 2020 - 22 | • | 82 | 25.7 | 20.5 | 31.9 | 20.4 | 17.0 |
| 2021 - 23 | • | 86 | 26.5 | 21.2 | 32.8 | 20.5 | 17.3 |
| 2022 - 24 | • | 86 | 26.5 | 21.2 | 32.8 | 20.3 | 17.1 |
Source: OHID, based on Office for National Statistics data
Premature Cardiovascular Disease Mortality from Causes Considered Preventable Across Wards and Area Committee Areas in Hull
There was ab almost three-fold difference in the directly standardised mortality rate for cardiovascular diseases considered preventable that occurred under the age of 75 years in Hull for deaths registered during 2022-25.
The highest rates occurred in Central (89 deaths per 100,000 population), St Andrew’s & Docklands (88), Marfleet (79), Orchard Park (64) and Southcoates (64), with the rate statistically significantly higher than the Hull average (51 deaths per 100,000 population) for Central, St Andrew’s & Docklands and Marfleet wards.
There were fewer than 10 deaths in Bricknell and Kingswood wards from cardiovascular diseases considered preventable, so no rates could be produced for these wards.
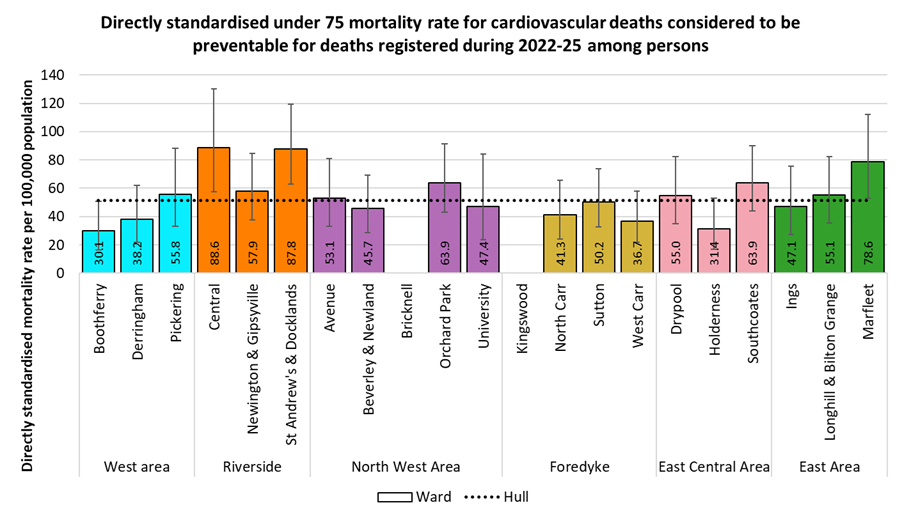
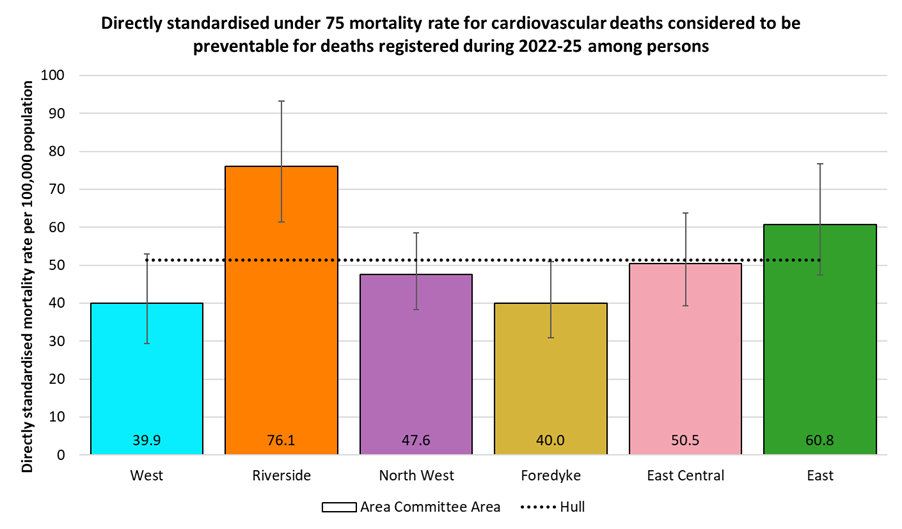
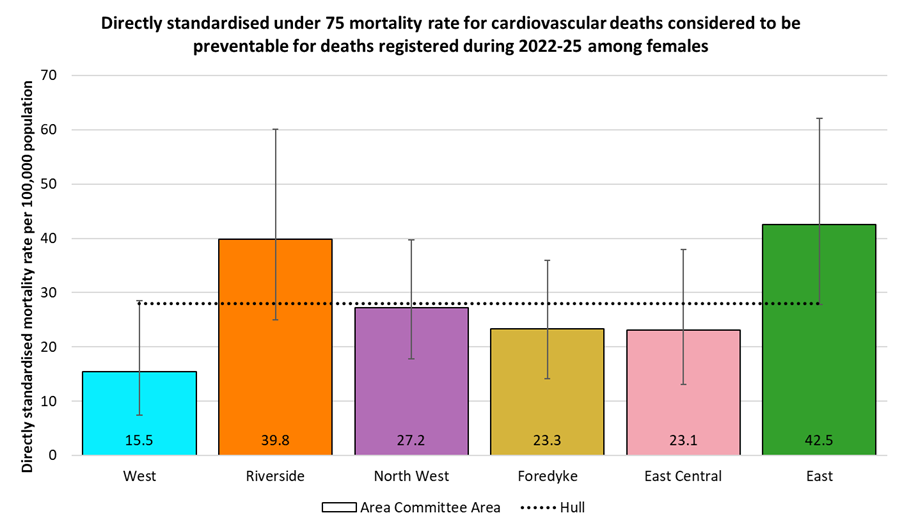
Differences between Area Committee Areas were not as large as between wards, but there was still an almost two-fold difference between the highest rate found for Riverside (76 per 100,000 population) and the rates for West (40) and Foredyke (40) Area Committee Areas. The rate for Riverside was statistically significantly higher than the Hull average, while the rate for Foredyke was statistically significantly lower.
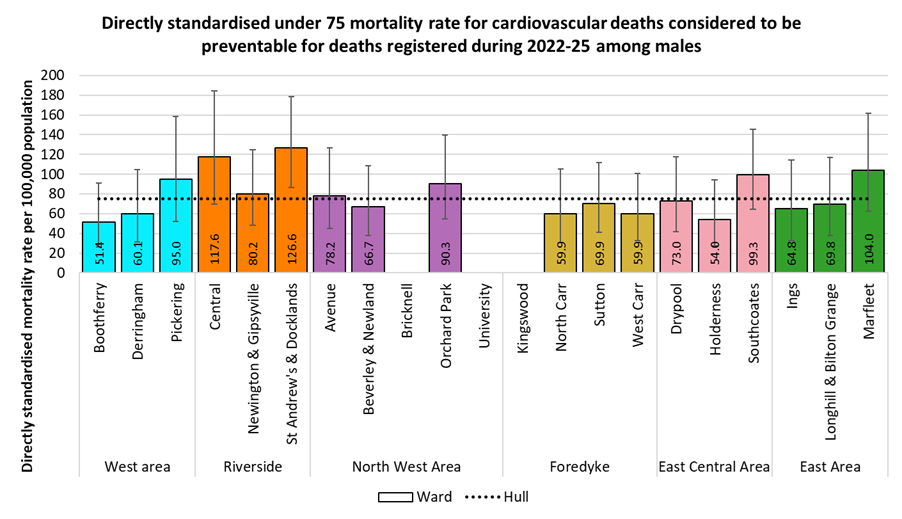
Among males, the highest mortality rates were found in St Andrew’s & Docklands (127 per 100,000 population), Central (118), Marfleet (104) and Southcoates (99), although only the rate for St Andrew’s & Docklands ward was statistically significantly higher than the Hull average (75deaths per 100,000 population). There were fewer than 10 male deaths in Bricknell, Kingswood and University wards from cardiovascular diseases considered preventable, so no rates could be produced for these wards.
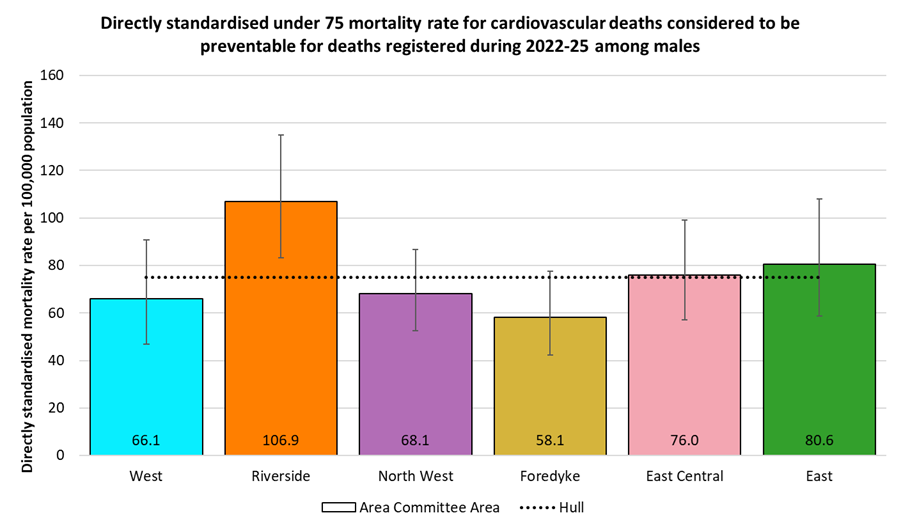
There was an almost two-fold difference between the highest rate found for Riverside (107 per 100,000 population) and the rate for Foredyke (58) Area Committee Area. The rate for Riverside was statistically significantly higher than the Hull average.
There were fewer than 10 under 75 deaths from cardiovascular diseases considered preventable among women in all but three wards, so a ward comparison is not shown. The highest rates by Area Committee Area were found for East (43 per 100,000 population) and Riverside (40), more than double the rate for West (16). because there were far fewer deaths among women (122) than among men (322) the confidence intervals are very wide, and all overlap with the Hull rate (28 per 100,000 population).
Premature Cardiovascular Disease Mortality from Causes Considered Preventable by Local Deprivation Fifths
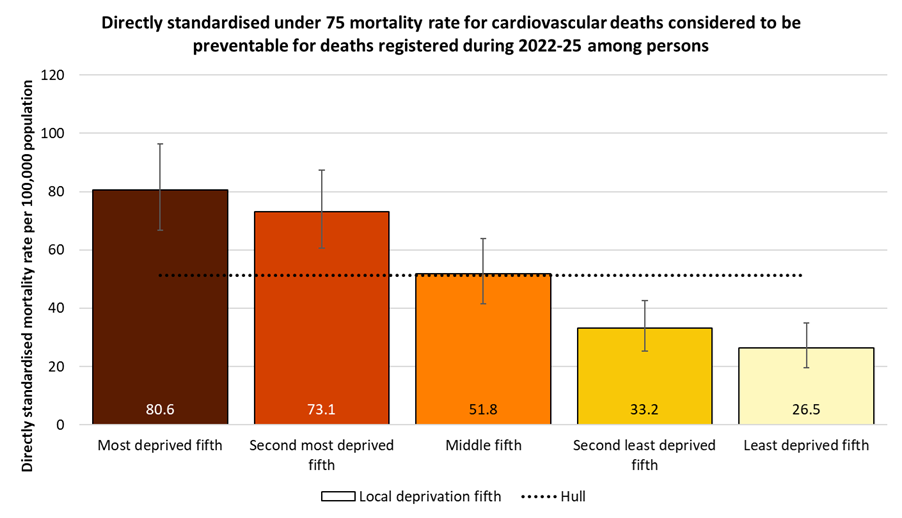
Across the different areas of Hull based on deprivation, there were large differences in the directly standardised mortality rate for deaths from cardiovascular diseases considered preventable that occurred under the age of 75 years and registered during 2022-25. At 81 deaths per 100,000 population among people who lived in the most deprived fifth of areas of Hull, compared to 27 deaths per 100,000 population among people who lived in the least deprived fifth of areas of Hull, the mortality rate was three times higher among people living in the most deprived fifth of areas of Hull.
The relative difference between the most and least deprived areas of Hull was slightly higher for deaths from cardiovascular diseases considered preventable than it was for all cardiovascular disease deaths under the age of 75 years.
A similar pattern of mortality across the local deprivation fifths occurred for males with a wide difference in the mortality rates between the most and least deprived fifth of areas of Hull (81 versus 27 per 100,000 population). The mortality rate was three times higher among males living in the most deprived fifth of areas of Hull.
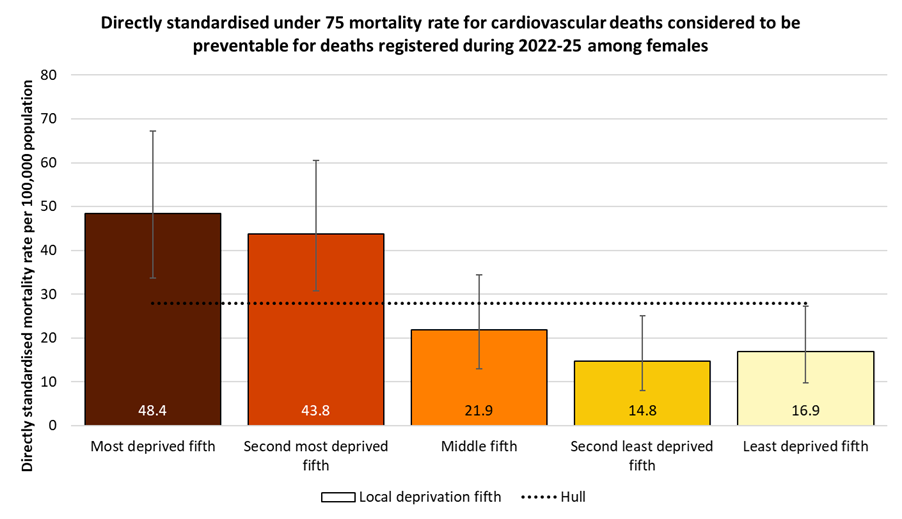
Although the rates were lower than for males, the pattern for females was similar. There was a wide difference in the mortality rates between the most and least deprived fifth of areas of Hull (48 versus 17 per 100,000 population). The mortality rate was almost three times higher among females living in the most deprived fifth of areas of Hull.
Estimated Number of People in the Future Who Will Have Cardiovascular Disease
The Projecting Older People Population Information Service (POPPI) provide current estimates and future projections at local authority level of the number of people with cardiovascular disease.
They use estimates for the prevalence of cardiovascular disease for different age groups for men and women separately, and apply those prevalence estimates to Hull’s population. It is likely that this will represent an underestimate for Hull due to Hull’s high levels of deprivation.
They estimate that there are almost 14,000 residents of Hull aged 65+ years who are living with cardiovascular disease, but due to the ageing population this is anticipated to increase by 22% to almost 17,000 by 2045.
| Gender | Age | 2025 | 2030 | 2035 | 2040 | 2045 |
| Males | 65-74 | 4,046 | 4,386 | 4,522 | 4,284 | 3,978 |
| Males | 75+ | 3,570 | 3,990 | 4,368 | 4,872 | 5,208 |
| Males | Total 65+ | 7,616 | 8,376 | 8.890 | 9,156 | 9,186 |
| Females | 65-74 | 2,562 | 2,856 | 2,940 | 2,772 | 2,562 |
| Females | 75+ | 3,597 | 3,861 | 4,257 | 4,818 | 5,115 |
| Females | Total 65+ | 6,159 | 6,717 | 7,197 | 7,590 | 7,677 |
| Persons | Total 65+ | 13,775 | 15,093 | 16,087 | 16,746 | 16,863 |
Coronary Heart Disease
Number of People with Coronary Heart Disease
The Office for Health Improvement & Disparities’ Fingertips gives the percentage of patients registered with Hull GPs who are diagnosed with coronary heart disease (CHD). The sub Integrated Care Board areas which include Hull are within the Humber and North Yorkshire Integrated Care Board. In Fingertips, the sub-ICB area referenced by 03F relates to Hull (see Integrated Care Board for the codes relating to the other local sub-ICB areas).
In 2024/25, there were 10,209 patients registered with Hull GPs who had been diagnosed with CHD. The percentage was higher in Hull compared to England (3.2% versus 3.0%).
Compared with benchmark
| Indicator | Period | England | NHS Humber and North Yorkshire Integrated Care Board - QOQ | Humber and North Yorkshire ICB - 02Y | Humber and North Yorkshire ICB - 03F | Humber and North Yorkshire ICB - 03H | Humber and North Yorkshire ICB - 03K | Humber and North Yorkshire ICB - 03Q | Humber and North Yorkshire ICB - 42D |
|---|---|---|---|---|---|---|---|---|---|
CHD: QOF prevalence (Persons All ages) | 2024/25 | 3.0 | 3.8 | 4.6 | 3.2 | 3.6 | 4.0 | 2.9 | 4.0 |
The prevalence of CHD among patients registered with Hull GPs has been steadily and gradually decreasing since 2014/15. The prevalence for England has also decreased over the same time period, but at a much slower rate of change.
Compared with benchmark
CHD: QOF prevalence (Persons All ages)
|
Period
|
Humber and North Yorkshire ICB - 03F |
NHS Humber and North Yorkshire Integrated Care Board - QOQ
|
England
|
||||
|---|---|---|---|---|---|---|---|
|
Count
|
Value
|
95%
Lower CI |
95%
Upper CI |
||||
| 2012/13 | • | 11368 | 3.9% | 3.8% | 4.0% | - | 3.3% |
| 2013/14 | • | 11346 | 3.9% | 3.9% | 4.0% | - | 3.3% |
| 2014/15 | • | 11235 | 3.9% | 3.8% | 3.9% | - | 3.2% |
| 2015/16 | • | 11111 | 3.8% | 3.7% | 3.8% | - | 3.2% |
| 2016/17 | • | 11073 | 3.6% | 3.5% | 3.7% | - | 3.2% |
| 2017/18 | • | 11122 | 3.7% | 3.7% | 3.8% | - | 3.1% |
| 2018/19 | • | 11108 | 3.7% | 3.6% | 3.8% | - | 3.1% |
| 2019/20 | • | 10941 | 3.6% | 3.5% | 3.7% | 4.0% | 3.1% |
| 2020/21 | • | 10730 | 3.5% | 3.5% | 3.6% | 3.9% | 3.0% |
| 2021/22 | • | 10643 | 3.5% | 3.4% | 3.5% | 3.9% | 3.0% |
| 2022/23 | • | 10538 | 3.4% | 3.3% | 3.5% | 3.9% | 3.0% |
| 2023/24 | • | 10314 | 3.3% | 3.2% | 3.3% | 3.8% | 3.0% |
| 2024/25 | • | 10209 | 3.2% | 3.2% | 3.3% | 3.8% | 3.0% |
Source: NHS England
From the local analysis of the national Quality and Outcomes Framework datasets, there was a statistically significant association between average age of the practice patients and the prevalence of diagnosed CHD across the 25 practices in Hull for 2024/25. If the practices were divided into five approximately equal sized groups based on average age of patients (with each fifth having approximately one-fifth of the total registered patients in Hull) then the prevalence increased from 2.0% for the practices serving the youngest practice patients to 4.0% for the practices serving the oldest practice patients. For every increase in the average age of the patients of 10 years, the prevalence of CHD increased by 2.5 percentage points. Further analysis of diagnosed disease by the average age of practice patients is within the file above and within Local Analysis of Quality and Outcomes Framework Data.
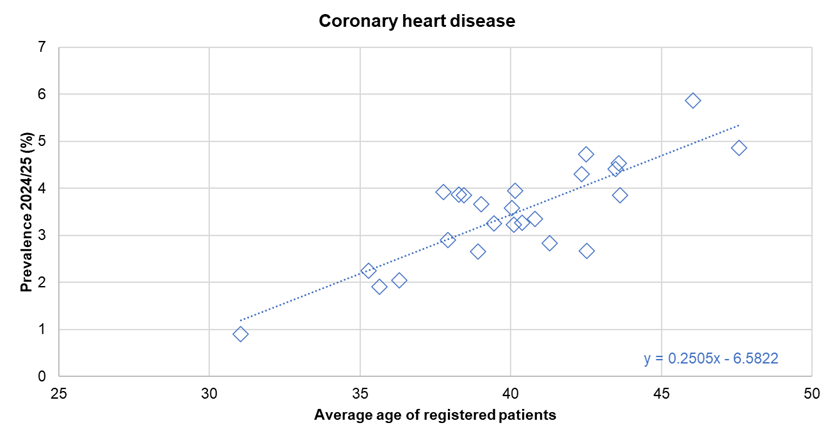
There was no statistically significant association between the prevalence of diagnosed CHD and the average deprivation score of registered patients (using the Index of Multiple Deprivation 2025) across the 25 practices.
Hospital Admissions for Coronary Heart Disease
The directly standardised hospital admission rate for CHD for 2024/25 is 8% higher in Hull compared than England. The rate is given as the number of admissions per 100,000 population (in the European Standard Population).
Compared with benchmark
| Indicator | Period | England | Yorkshire and the Humber region (statistical) | Kingston upon Hull | East Riding of Yorkshire | North East Lincolnshire | North Lincolnshire | York | North Yorkshire UA | Barnsley | Doncaster | Rotherham | Sheffield | Bradford | Calderdale | Kirklees | Leeds | Wakefield |
|---|---|---|---|---|---|---|---|---|---|---|---|---|---|---|---|---|---|---|
Hospital admissions due to coronary heart disease (Persons All ages) | 2024/25 | 386.6 | - | 416.0 | 360.6 | 538.0 | 536.1 | 341.6 | 371.5 | 640.4 | 399.6 | 564.1 | 383.3 | 548.5 | 438.9 | 391.3 | 283.1 | 305.4 |
The admission rate for CHD has been quite variable in Hull since 2003/04. The rate remained relatively unchanged between 20004/05 and 2006/07 at just over 800 admissions per 100,000 population, but decreased to 645 admissions per 100,000 population for 2008/09 before increasing sharply to 946 admissions per 100,000 population for 2011/12. The admission rate did then fall sharply to to 600 admissions per 100,000 population for 2014/15. The rate increased slightly for 2015/16, but remained just over 600 admissions per 100,000 population until 2017/18 when there was a further decrease to 578 admissions per 100,000 population for 2018/19. So whilst there have been quite a sharp increase and decrease between 2008/09 and 2014/15, there has been a general decrease over the entire period between 2003/04 and 2018/19.
There was a sharp decrease in the admission rate in Hull between 2018/19 and 2020/21 which will – at least in part – be due to the COVID-19 pandemic. The admission rate for most non-COVID-19 conditions and diseases did decrease, but in most cases, this occurred between 2019/20 and 2020/21. It is possible that there was a reduction in March 2020 which could have influenced the reduction between 2018/19 and 2019/20, but it is also possible that there was a reduction that was not influenced by the pandemic as there has been reductions over the previous 2-3 years prior to this. There has been an increase in the admission rate for CHD between 2020/21 and 2022/23, and it is possible that this is associated with a reduction during the pandemic and care and treatment has been delayed, although the rate decreased in the last two years.
For the latest year 2024/25, there were 965 admissions for CHD among Hull residents.
Compared with benchmark
Hospital admissions due to coronary heart disease (Persons All ages)
|
Period
|
Kingston upon Hull |
Yorkshire and the Humber region (statistical)
|
England
|
||||
|---|---|---|---|---|---|---|---|
|
Count
|
Value
|
95%
Lower CI |
95%
Upper CI |
||||
| 2003/04 | • | 1535 | 778.4 | 739.7 | 818.5 | - | 719.9 |
| 2004/05 | • | 1615 | 813.5 | 773.9 | 854.5 | - | 715.7 |
| 2005/06 | • | 1580 | 803.4 | 764.1 | 844.3 | - | 709.5 |
| 2006/07 | • | 1595 | 805.0 | 765.7 | 845.8 | - | 699.2 |
| 2007/08 | • | 1435 | 723.2 | 686.0 | 761.9 | - | 682.1 |
| 2008/09 | • | 1285 | 645.1 | 610.0 | 681.6 | - | 662.3 |
| 2009/10 | • | 1545 | 771.4 | 733.0 | 811.3 | - | 622.0 |
| 2010/11 | • | 1835 | 900.5 | 859.4 | 943.1 | - | 600.6 |
| 2011/12 | • | 1935 | 945.9 | 903.8 | 989.4 | - | 594.4 |
| 2012/13 | • | 1750 | 842.8 | 803.4 | 883.6 | - | 575.3 |
| 2013/14 | • | 1425 | 679.2 | 644.1 | 715.7 | - | 560.2 |
| 2014/15 | • | 1260 | 599.8 | 566.8 | 634.2 | - | 540.6 |
| 2015/16 | • | 1415 | 667.6 | 632.9 | 703.7 | - | 529.3 |
| 2016/17 | • | 1355 | 632.3 | 598.7 | 667.3 | - | 517.7 |
| 2017/18 | • | 1370 | 634.1 | 600.6 | 669.0 | - | 504.5 |
| 2018/19 | • | 1265 | 577.7 | 546.0 | 610.7 | - | 490.6 |
| 2019/20 | • | 1040 | 471.4 | 443.0 | 501.2 | - | 472.4 |
| 2020/21 | • | 785 | 351.0 | 326.7 | 376.6 | - | 369.4 |
| 2021/22 | • | 940 | 412.5 | 386.4 | 439.9 | - | 415.0 |
| 2022/23 | • | 1095 | 473.5 | 445.7 | 502.6 | - | 387.1 |
| 2023/24 | • | 1070 | 461.4 | 434.0 | 490.0 | - | 390.6 |
| 2024/25 | • | 965 | 416.0 | 390.0 | 443.2 | - | 386.6 |
Source: OHID, based on NHS England and Office for National Statistics data
Emergency Hospital Admissions for Coronary Heart Disease by Area Committee Areas in Hull
Directly age-standardised emergency admission rates for CHD have been produced for areas within Hull using data extracted from Hospital Episode Statistics. For the 5-year period 2020/21 to 2024/25 there was an average of 658 emergency hospital admissions for CHD each year, giving a rate of 288 emergency admissions per 100,000 population. CHD emergency admission rates were statistically significantly higher than the Hull average for Riverside and East Area Committee Areas, and statistically significantly lower for West Area Committee Areas.
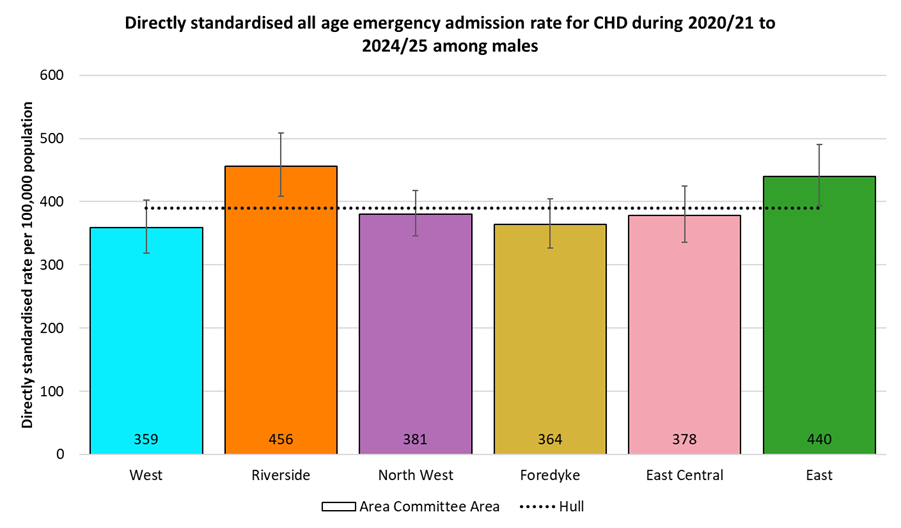
Emergency admission rates for CHD were around tice as high in men than in women. The rates for Riverside and East Area Committee Areas were statistically significantly higher than the Hull average of 390 per 100,000 males, while no Area Committee Area had statistically significantly lower rates.
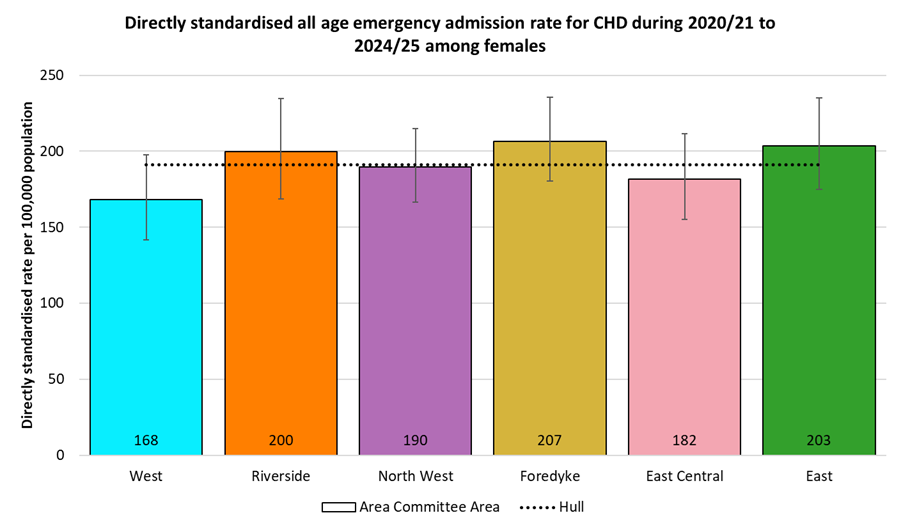
The pattern among women was similar, although as noted above, at around half the rates seen for men. There were no statistically significant differences between any of the Area Committee Areas and the Hull average of 191 per 100,000 women.
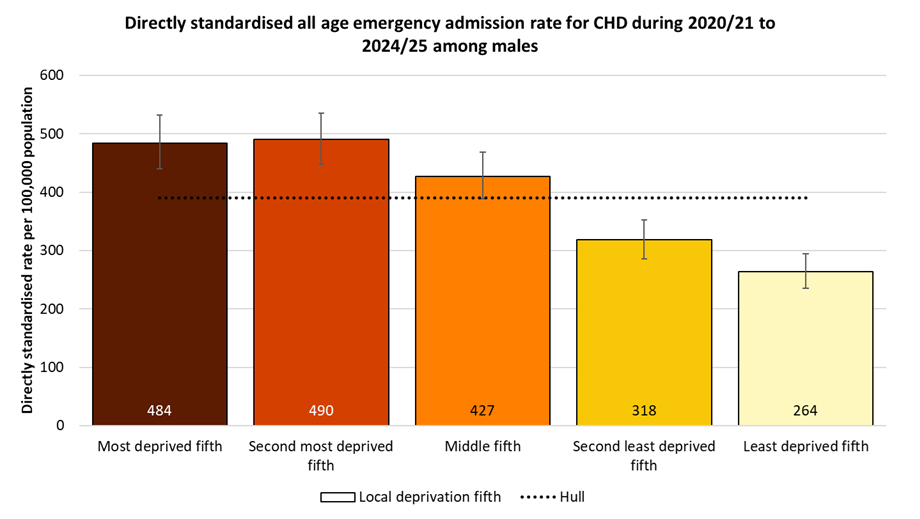
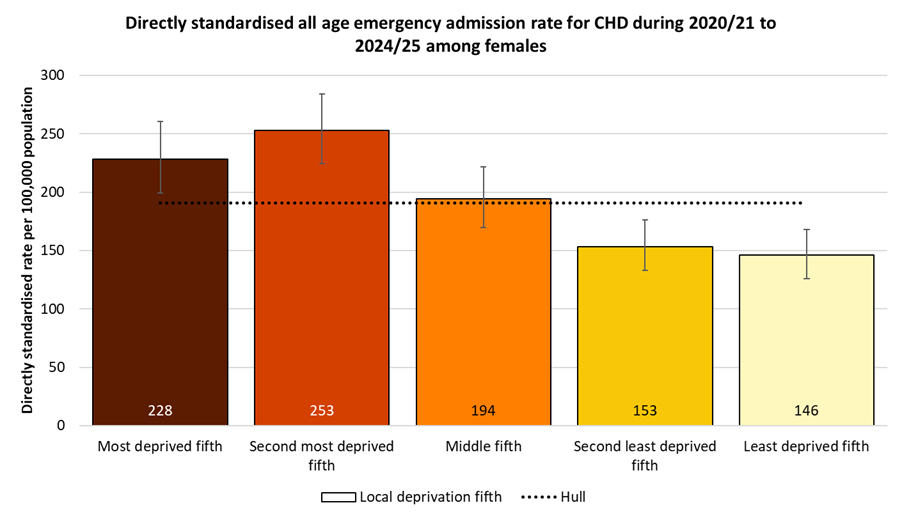
Emergency Hospital Admissions for Coronary Heart Disease by Local Deprivation Fifths
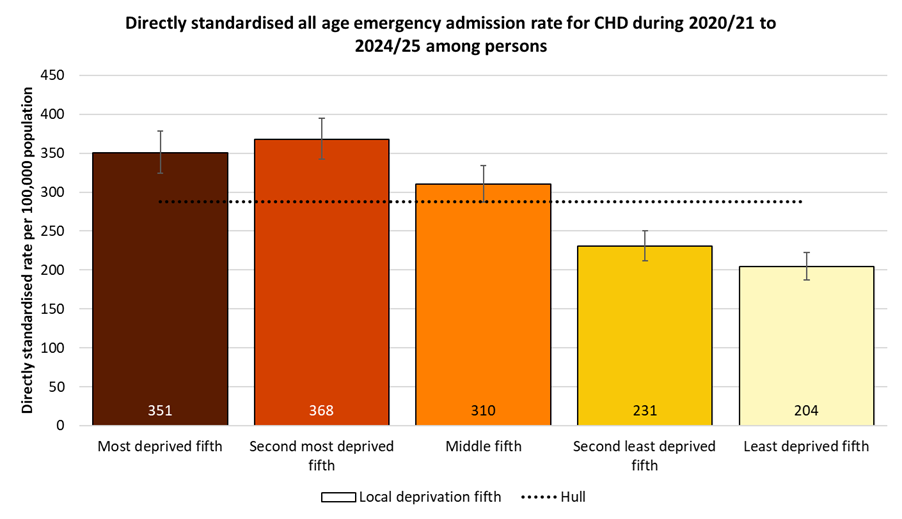
There was a deprivation gradient in CHD emergency admissions, although not a smooth trend. The highest admission rate was among residents of the second most deprived fifth of areas of Hull, with a rate that was 80% higher than for residents of the least deprived fifth of areas of the city.
The pattern was similar for men. Among men, the emergency hospital admission rates for CHD were very similar for men in the two most deprived fifths of areas of Hull , with rates in these areas 84-86% higher than among men living in the least deprived fifth of areas.
Similarly for women, albeit with the CHD emergency admission rate among women living in the second most deprived fifth of areas of Hull 11% higher than among women living in the most deprived fifth, but 73% higher than women resident in the least deprived fifth of areas of the city.
Deaths from Coronary Heart Disease
The directly standardised mortality rate for CHD (or ischaemic heart disease which is another name for CHD) is significantly higher than England among those aged under 75 years for 2022-24 being 90% higher in Hull compared to England.
The rate is given as the number of deaths per 100,000 population (in the European Standard Population).
Compared with benchmark
| Indicator | Period | England | Yorkshire and the Humber region (statistical) | Kingston upon Hull | East Riding of Yorkshire | North East Lincolnshire | North Lincolnshire | York | North Yorkshire UA | Barnsley | Doncaster | Rotherham | Sheffield | Bradford | Calderdale | Kirklees | Leeds | Wakefield |
|---|---|---|---|---|---|---|---|---|---|---|---|---|---|---|---|---|---|---|
Under 75 mortality rate from ischaemic heart disease (Persons <75 yrs) | 2022 - 24 | 40.6 | 50.0 | 77.0 | 41.5 | 65.4 | 53.3 | 36.8 | 37.0 | 49.0 | 66.7 | 62.5 | 48.0 | 66.3 | 40.5 | 49.4 | 42.1 | 48.6 |
Under 75 mortality rate from ischaemic heart disease (Male <75 yrs) | 2022 - 24 | 63.7 | 77.4 | 121.0 | 64.5 | 102.0 | 85.3 | 61.7 | 57.4 | 74.4 | 98.4 | 88.7 | 74.4 | 101.1 | 65.3 | 79.1 | 64.3 | 77.5 |
Under 75 mortality rate from ischaemic heart disease (Female <75 yrs) | 2022 - 24 | 18.9 | 23.9 | 33.1 | 19.7 | 30.5 | 22.5 | 13.7 | 17.9 | 24.4 | 36.3 | 37.5 | 22.7 | 32.8 | 17.1 | 21.1 | 21.2 | 21.0 |
The inequalities gap between Hull and England is similar for males and females. There are differences between males and females when comparing against the other local authorities in the region. The premature CHD mortality rate for Hull men is the highest in the region and considerably higher than the next highest local authority, and whilst the mortality rate for Hull women is among the highest in the region, it is not the highest.
Compared with benchmark
Under 75 mortality rate from ischaemic heart disease (Persons <75 yrs) 2022 - 24
| Area |
Recent
Trend |
Count
|
Value
|
95%
Lower CI |
95%
Upper CI |
|
|---|---|---|---|---|---|---|
| England | 60138 | 40.6 | 40.3 | 40.9 | ||
| Yorkshire and the Humber region (statistical) | 7373 | 50.0 | 48.9 | 51.2 | ||
| Kingston upon Hull | 498 | 77.0 | 70.3 | 84.1 | ||
| East Riding of Yorkshire | 480 | 41.5 | 37.9 | 45.5 | ||
| North East Lincolnshire | 296 | 65.4 | 58.1 | 73.3 | ||
| North Lincolnshire | 270 | 53.3 | 47.1 | 60.1 | ||
| York | 188 | 36.8 | 31.8 | 42.5 | ||
| North Yorkshire UA | 755 | 37.0 | 34.4 | 39.8 | ||
| Barnsley | 343 | 49.0 | 43.9 | 54.4 | ||
| Doncaster | 574 | 66.7 | 61.3 | 72.4 | ||
| Rotherham | 459 | 62.5 | 56.9 | 68.6 | ||
| Sheffield | 631 | 48.0 | 44.3 | 51.9 | ||
| Bradford | 840 | 66.3 | 61.8 | 70.9 | ||
| Calderdale | 234 | 40.5 | 35.4 | 46.0 | ||
| Kirklees | 555 | 49.4 | 45.4 | 53.7 | ||
| Leeds | 776 | 42.1 | 39.2 | 45.2 | ||
| Wakefield | 474 | 48.6 | 44.3 | 53.2 |
Source: OHID, based on Office for National Statistics data
Under 75 mortality rate from ischaemic heart disease (Male <75 yrs) 2022 - 24
| Area |
Recent
Trend |
Count
|
Value
|
95%
Lower CI |
95%
Upper CI |
|
|---|---|---|---|---|---|---|
| England | 45761 | 63.7 | 63.1 | 64.3 | ||
| Yorkshire and the Humber region (statistical) | 5565 | 77.4 | 75.4 | 79.5 | ||
| Kingston upon Hull | 390 | 121.0 | 109.2 | 133.7 | ||
| East Riding of Yorkshire | 364 | 64.5 | 58.0 | 71.6 | ||
| North East Lincolnshire | 225 | 102.0 | 89.1 | 116.3 | ||
| North Lincolnshire | 211 | 85.3 | 74.1 | 97.7 | ||
| York | 152 | 61.7 | 52.2 | 72.3 | ||
| North Yorkshire UA | 564 | 57.4 | 52.7 | 62.4 | ||
| Barnsley | 256 | 74.4 | 65.5 | 84.1 | ||
| Doncaster | 414 | 98.4 | 89.1 | 108.4 | ||
| Rotherham | 318 | 88.7 | 79.2 | 99.1 | ||
| Sheffield | 480 | 74.4 | 67.8 | 81.4 | ||
| Bradford | 630 | 101.1 | 93.3 | 109.3 | ||
| Calderdale | 183 | 65.3 | 56.1 | 75.5 | ||
| Kirklees | 434 | 79.1 | 71.9 | 87.0 | ||
| Leeds | 575 | 64.3 | 59.2 | 69.8 | ||
| Wakefield | 369 | 77.5 | 69.8 | 85.9 |
Source: OHID, based on Office for National Statistics data
Under 75 mortality rate from ischaemic heart disease (Female <75 yrs) 2022 - 24
| Area |
Recent
Trend |
Count
|
Value
|
95%
Lower CI |
95%
Upper CI |
|
|---|---|---|---|---|---|---|
| England | 14377 | 18.9 | 18.6 | 19.2 | ||
| Yorkshire and the Humber region (statistical) | 1808 | 23.9 | 22.8 | 25.1 | ||
| Kingston upon Hull | 108 | 33.1 | 27.2 | 40.0 | ||
| East Riding of Yorkshire | 116 | 19.7 | 16.2 | 23.7 | ||
| North East Lincolnshire | 71 | 30.5 | 23.8 | 38.5 | ||
| North Lincolnshire | 59 | 22.5 | 17.1 | 29.0 | ||
| York | 36 | 13.7 | 9.6 | 19.0 | ||
| North Yorkshire UA | 191 | 17.9 | 15.4 | 20.6 | ||
| Barnsley | 87 | 24.4 | 19.6 | 30.2 | ||
| Doncaster | 160 | 36.3 | 30.9 | 42.4 | ||
| Rotherham | 141 | 37.5 | 31.6 | 44.3 | ||
| Sheffield | 151 | 22.7 | 19.2 | 26.7 | ||
| Bradford | 210 | 32.8 | 28.5 | 37.6 | ||
| Calderdale | 51 | 17.1 | 12.7 | 22.5 | ||
| Kirklees | 121 | 21.1 | 17.5 | 25.2 | ||
| Leeds | 201 | 21.2 | 18.4 | 24.4 | ||
| Wakefield | 105 | 21.0 | 17.1 | 25.4 |
Source: OHID, based on Office for National Statistics data
There was a relatively sharp decrease in the premature CHD mortality rate in Hull between 2001-03 and 2010-12 with the mortality rate almost halving from 117 to 63 deaths per 100,000 population. However, since 2010-12 the mortality rate has changed little in Hull with a slight decrease to just under 60 deaths per 100,000 population in recent years, although the rate has increased to in the last 3-4 years to 77 deaths per 100,000 population for 2022-24.
Over the three year period 2022-24, there were 498 deaths among Hull residents aged under 75 years from CHD giving an average of 166 such deaths per year.
Compared with benchmark
Under 75 mortality rate from ischaemic heart disease (Persons <75 yrs)
|
Period
|
Kingston upon Hull |
Yorkshire and the Humber region (statistical)
|
England
|
||||
|---|---|---|---|---|---|---|---|
|
Count
|
Value
|
95%
Lower CI |
95%
Upper CI |
||||
| 2001 - 03 | • | 620 | 117.0 | 108.0 | 126.6 | 96.3 | 85.8 |
| 2002 - 04 | • | 575 | 108.2 | 99.5 | 117.5 | 87.2 | 79.5 |
| 2003 - 05 | • | 534 | 101.1 | 92.7 | 110.1 | 80.6 | 73.5 |
| 2004 - 06 | • | 500 | 94.8 | 86.6 | 103.5 | 75.5 | 67.6 |
| 2005 - 07 | • | 482 | 91.1 | 83.1 | 99.7 | 71.0 | 62.6 |
| 2006 - 08 | • | 464 | 87.7 | 79.9 | 96.1 | 67.7 | 58.6 |
| 2007 - 09 | • | 452 | 85.5 | 77.8 | 93.8 | 62.8 | 54.6 |
| 2008 - 10 | • | 413 | 78.3 | 70.8 | 86.2 | 60.0 | 51.3 |
| 2009 - 11 | • | 382 | 72.0 | 64.9 | 79.7 | 55.6 | 47.7 |
| 2010 - 12 | • | 338 | 62.7 | 56.1 | 69.8 | 52.8 | 45.1 |
| 2011 - 13 | • | 335 | 61.0 | 54.6 | 68.0 | 49.8 | 43.0 |
| 2012 - 14 | • | 343 | 61.7 | 55.2 | 68.6 | 48.5 | 41.5 |
| 2013 - 15 | • | 346 | 61.3 | 54.9 | 68.1 | 47.3 | 40.6 |
| 2014 - 16 | • | 337 | 58.6 | 52.4 | 65.3 | 46.0 | 39.4 |
| 2015 - 17 | • | 347 | 58.6 | 52.5 | 65.1 | 45.4 | 38.8 |
| 2016 - 18 | • | 350 | 57.6 | 51.7 | 64.0 | 45.1 | 38.3 |
| 2017 - 19 | • | 374 | 60.4 | 54.4 | 66.8 | 44.5 | 37.6 |
| 2018 - 20 | • | 362 | 57.3 | 51.5 | 63.5 | 44.2 | 38.0 |
| 2019 - 21 | • | 381 | 59.6 | 53.7 | 65.9 | 45.7 | 38.9 |
| 2020 - 22 | • | 420 | 65.4 | 59.3 | 72.0 | 48.6 | 40.6 |
| 2021 - 23 | • | 472 | 73.1 | 66.6 | 80.0 | 50.1 | 41.2 |
| 2022 - 24 | • | 498 | 77.0 | 70.3 | 84.1 | 50.0 | 40.6 |
Source: OHID, based on Office for National Statistics data
The change over time was similar for men with a relatively large decrease in the premature CHD mortality rate between 2001-03 and 2010-12 with the mortality rate decreasing from 176 to 95 deaths per 100,000 population. This was followed by little change in the mortality rate between 2011-13 and 2019-21 with the mortality rate remaining between 86 and 94 deaths per 100,000 population. There has been an increase in the last three years to 121 deaths per 100,000 population for 2022-24.
Among men, over the three year period 2022-24, there were 390 deaths among Hull residents aged under 75 years from CHD giving an average of 130 deaths per year.
Compared with benchmark
Under 75 mortality rate from ischaemic heart disease (Male <75 yrs)
|
Period
|
Kingston upon Hull |
Yorkshire and the Humber region (statistical)
|
England
|
||||
|---|---|---|---|---|---|---|---|
|
Count
|
Value
|
95%
Lower CI |
95%
Upper CI |
||||
| 2001 - 03 | • | 450 | 175.9 | 159.9 | 193.0 | 144.8 | 129.5 |
| 2002 - 04 | • | 400 | 155.1 | 140.1 | 171.1 | 131.3 | 120.6 |
| 2003 - 05 | • | 359 | 138.9 | 124.8 | 154.2 | 121.7 | 111.9 |
| 2004 - 06 | • | 328 | 126.3 | 112.9 | 140.8 | 113.9 | 103.1 |
| 2005 - 07 | • | 332 | 127.6 | 114.1 | 142.2 | 108.0 | 95.8 |
| 2006 - 08 | • | 331 | 127.2 | 113.8 | 141.8 | 103.1 | 89.6 |
| 2007 - 09 | • | 326 | 125.5 | 112.1 | 140.1 | 96.4 | 83.9 |
| 2008 - 10 | • | 307 | 118.5 | 105.5 | 132.7 | 91.6 | 79.1 |
| 2009 - 11 | • | 282 | 108.0 | 95.6 | 121.5 | 85.3 | 74.0 |
| 2010 - 12 | • | 254 | 95.0 | 83.5 | 107.5 | 81.3 | 69.8 |
| 2011 - 13 | • | 251 | 91.7 | 80.6 | 104.0 | 77.4 | 66.7 |
| 2012 - 14 | • | 254 | 91.6 | 80.5 | 103.8 | 76.0 | 64.3 |
| 2013 - 15 | • | 257 | 91.8 | 80.8 | 103.9 | 73.8 | 62.9 |
| 2014 - 16 | • | 245 | 85.7 | 75.1 | 97.3 | 71.4 | 61.2 |
| 2015 - 17 | • | 262 | 88.9 | 78.3 | 100.5 | 69.4 | 60.2 |
| 2016 - 18 | • | 268 | 88.1 | 77.8 | 99.4 | 68.8 | 59.8 |
| 2017 - 19 | • | 292 | 94.0 | 83.4 | 105.4 | 68.2 | 58.7 |
| 2018 - 20 | • | 282 | 89.0 | 78.8 | 100.0 | 67.9 | 59.6 |
| 2019 - 21 | • | 298 | 93.3 | 83.0 | 104.6 | 70.1 | 60.9 |
| 2020 - 22 | • | 324 | 101.2 | 90.4 | 112.8 | 74.2 | 63.7 |
| 2021 - 23 | • | 361 | 112.5 | 101.2 | 124.8 | 76.8 | 64.4 |
| 2022 - 24 | • | 390 | 121.0 | 109.2 | 133.7 | 77.4 | 63.7 |
Source: OHID, based on Office for National Statistics data
Among women in Hull, there was also a relatively sharp reduction in the premature CHD mortality rate between 2001-03 and 2010-12 from 61.4 to 31.2 deaths per 100,000 population. The mortality rate did reduce slightly between 2010-12 and 2019-20 to 26.0 deaths per 100,000 population, but has increased to 34.1 deaths per 100,000 population for deaths registered during 2021-23, before a small decrease in 2022-24.
Among women, over the three year period 2022-24, there were 108 deaths among Hull residents aged under 75 years from CHD giving an average of 36 deaths per year.
Compared with benchmark
Under 75 mortality rate from ischaemic heart disease (Female <75 yrs)
|
Period
|
Kingston upon Hull |
Yorkshire and the Humber region (statistical)
|
England
|
||||
|---|---|---|---|---|---|---|---|
|
Count
|
Value
|
95%
Lower CI |
95%
Upper CI |
||||
| 2001 - 03 | • | 169 | 61.4 | 52.5 | 71.4 | 52.0 | 45.5 |
| 2002 - 04 | • | 174 | 63.5 | 54.4 | 73.7 | 46.8 | 41.6 |
| 2003 - 05 | • | 174 | 64.6 | 55.4 | 75.0 | 42.7 | 37.8 |
| 2004 - 06 | • | 172 | 64.0 | 54.7 | 74.3 | 39.9 | 34.5 |
| 2005 - 07 | • | 149 | 55.7 | 47.1 | 65.4 | 36.7 | 31.7 |
| 2006 - 08 | • | 132 | 49.5 | 41.4 | 58.8 | 34.5 | 29.6 |
| 2007 - 09 | • | 125 | 47.0 | 39.1 | 56.0 | 31.4 | 27.0 |
| 2008 - 10 | • | 105 | 39.5 | 32.3 | 47.9 | 30.3 | 25.0 |
| 2009 - 11 | • | 100 | 37.3 | 30.4 | 45.5 | 27.7 | 22.8 |
| 2010 - 12 | • | 83 | 31.2 | 24.9 | 38.7 | 25.9 | 21.7 |
| 2011 - 13 | • | 84 | 30.9 | 24.6 | 38.3 | 23.7 | 20.7 |
| 2012 - 14 | • | 89 | 32.2 | 25.8 | 39.7 | 22.4 | 19.9 |
| 2013 - 15 | • | 89 | 31.4 | 25.2 | 38.8 | 22.1 | 19.4 |
| 2014 - 16 | • | 92 | 32.0 | 25.7 | 39.3 | 21.8 | 18.9 |
| 2015 - 17 | • | 85 | 28.6 | 22.8 | 35.4 | 22.4 | 18.5 |
| 2016 - 18 | • | 82 | 27.1 | 21.5 | 33.7 | 22.3 | 17.9 |
| 2017 - 19 | • | 82 | 26.7 | 21.3 | 33.2 | 21.8 | 17.6 |
| 2018 - 20 | • | 80 | 25.5 | 20.2 | 31.8 | 21.5 | 17.5 |
| 2019 - 21 | • | 83 | 26.0 | 20.7 | 32.2 | 22.3 | 18.0 |
| 2020 - 22 | • | 96 | 29.8 | 24.2 | 36.4 | 24.2 | 18.8 |
| 2021 - 23 | • | 111 | 34.1 | 28.0 | 41.0 | 24.6 | 19.2 |
| 2022 - 24 | • | 108 | 33.1 | 27.2 | 40.0 | 23.9 | 18.9 |
Source: OHID, based on Office for National Statistics data
Premature CHD Mortality Rates Across Wards and Area committee Areas in Hull
There was a three-fold difference in premature CHD mortality rates between Hull’s electoral wards, with the rate ranging from 140 per 100,000 population in Central ward to 46 per 100,000 in Derringham ward. Rates were statistically significantly higher than the Hull average of 77 per 100,000 population for Central, St Andrew’s & Docklands and Marfleet wards, while they were statistically significantly lower for Derringham and West Carr wards.
There were fewer than 10 deaths in Bricknell and Kingswood wards from CHD, so no rates could be produced for these wards.
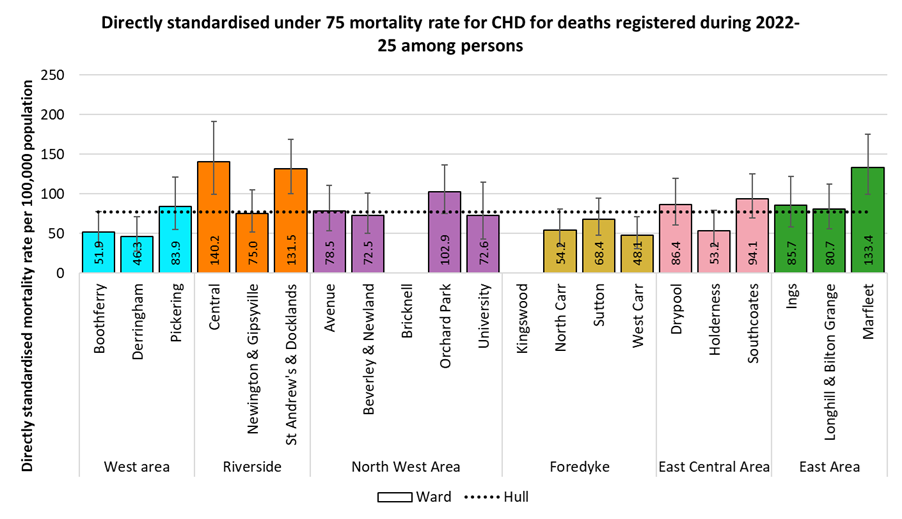
Differences between Area Committee Areas were not as large as between wards, but there was still a two-fold difference between the highest rate found for Riverside (111 per 100,000 population) and the rate for Foredyke (53 per 100,000 population). The rates for Riverside and East were statistically significantly higher than the Hull average, while the rates for Foredyke and West were statistically significantly lower.
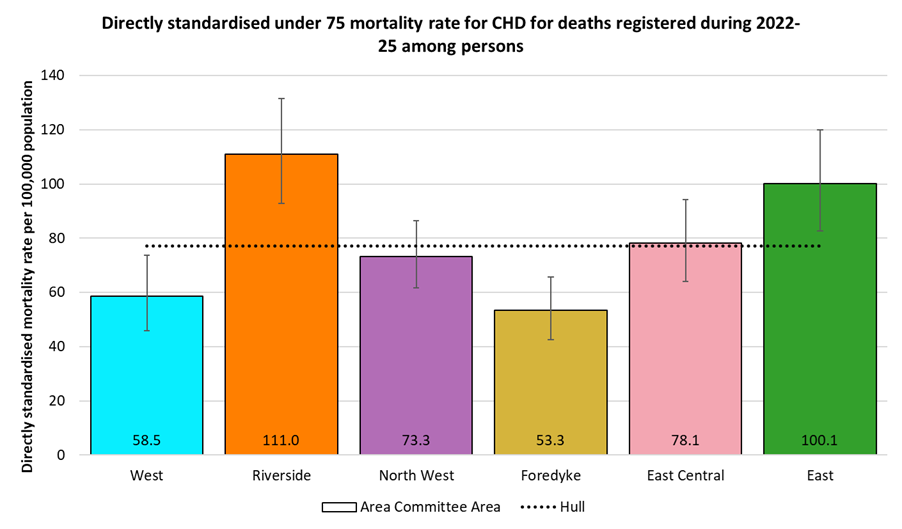
Similar patterns were seen for males, albeit with higher rates but a slightly smaller, 2.6-fold, difference between the wards. Among males, the highest mortality rates were found in St Andrew’s & Docklands (208 per 100,000 population), Central (207), Marfleet (185) and Orchard Park (157), with the rates for St Andrew’s & Docklands, Central and Marfleet wards statistically significantly higher than the Hull average (119 deaths per 100,000 population). There were fewer than 10 male deaths in Bricknell and Kingswood wards from CHD, so no rates could be produced for these wards.
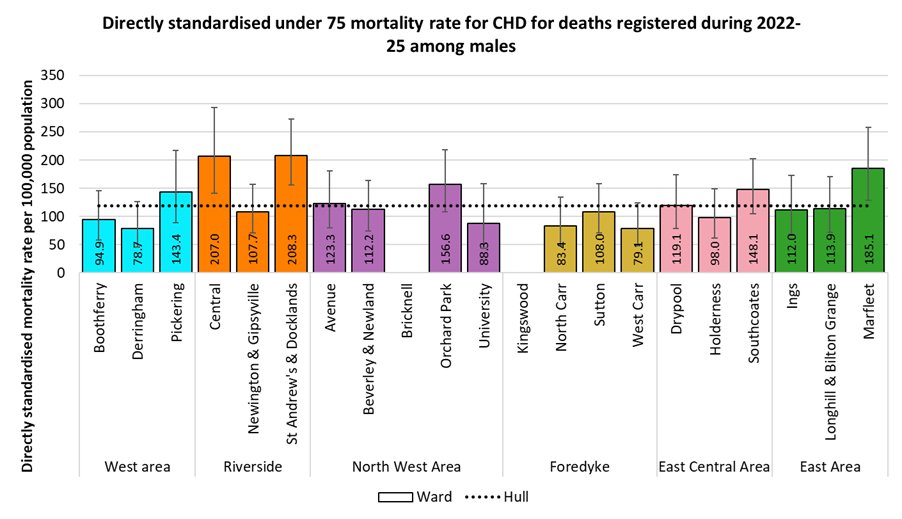
The differences between Area Committee Areas were smaller than for wards, with a two-fold difference between Riverside (170 per 100,000 population) and Foredyke (83 per 100,000 population). The rate for Riverside was statistically significantly higher than the Hull average, while the the rate for Foredyke was statistically significantly lower.
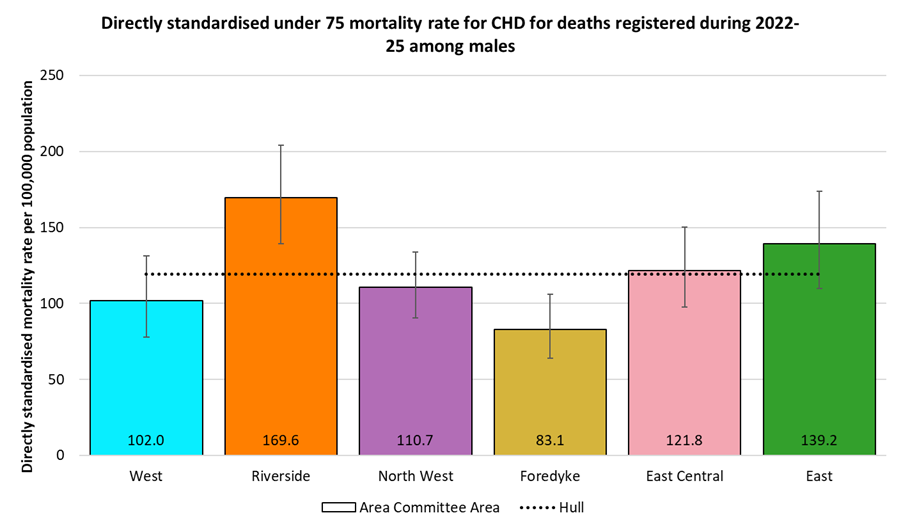
There were fewer than 10 under 75 deaths from CHD among women in 16 of Hull’s 21 wards, so a ward comparison is not shown. Unlike for males, The highest premature CHD mortality rate among females by Area Committee Area was found for East (64 per 100,000 population), which was 3.5 times higher than the rate for West (18 per 100,000 population). The rate for East was statistically significantly higher than the Hull average (35 per 100,000 population) while the rate for West was statistically significantly lower.
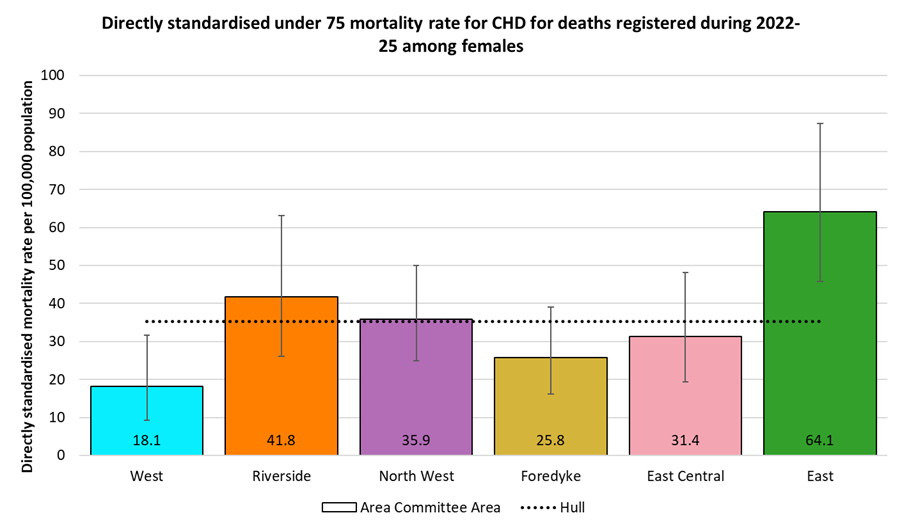
Premature CHD Mortality Rates by Local Deprivation Fifths
There is a strong association between premature mortality from coronary heart disease and deprivation.
For deaths registered during 2022-25, the directly age-standardised under 75 CHD mortality rates per 100,000 population (standardised to the European Standard Population) ranged from 27 deaths per 100,000 population living in the least deprived fifth of areas of Hull to 81 deaths per 100,000 population living in the most deprived fifth of areas of the city. The mortality rate in the most deprived fifth of areas was three times higher than in the least deprived fifth of areas.
A similar pattern by deprivation fifths occurs among men, although with higher rates. The premature CHD mortality rate ranges from 58 deaths per 100,000 men living in the least deprived fifth of areas of Hull to 191 deaths per 100,000 men living in the most deprived fifth of areas of the city, so 3.3 times higher among men in the most deprived parts of the city compared to those in the least deprived parts.
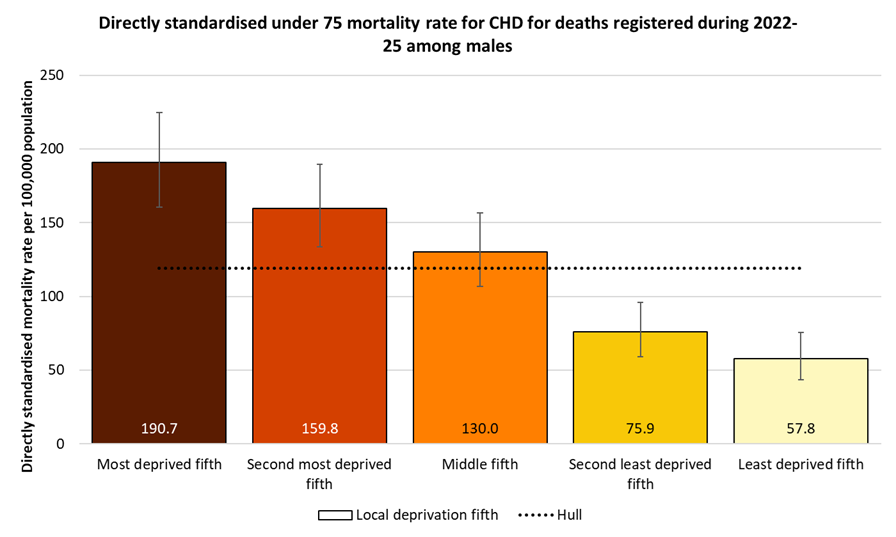
A similar pattern by deprivation is seen among women, although the mortality rates among women are less than one third of those for men. The premature CHD mortality rate ranges from 17 deaths per 100,000 women living in the second least deprived fifth of areas of Hull (women in the least deprived fifth had a slightly higher rate of 22 deaths per 100,000 women) to 62 deaths per 100,000 women living in the most deprived fifth of areas of the city, so 3.7 and 2.8 times higher among women in the most deprived fifth of the city compared to those in the second least deprived and least deprived fifths.
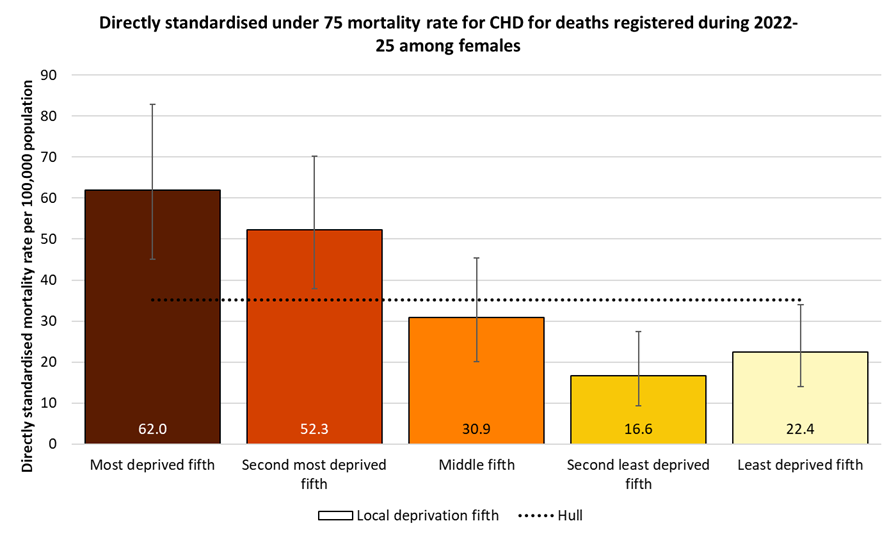
Stroke
Number of People who have had a Stroke or Transient Ischaemic Attack (Mini Stroke)
Fingertips gives the percentage of patients registered with Hull GPs who have been diagnosed as having had a stroke or transient ischaemic attack (TIA) with Hull (03F) included within the Humber and North Yorkshire Integrated Care Board.
In 2024/25, there were 5,093 patients registered with Hull GPs who had had a stroke or TIA. The prevalence was slightly lower in Hull than England (1.6% versus 1.9%).
Compared with benchmark
| Indicator | Period | England | NHS Humber and North Yorkshire Integrated Care Board - QOQ | Humber and North Yorkshire ICB - 02Y | Humber and North Yorkshire ICB - 03F | Humber and North Yorkshire ICB - 03H | Humber and North Yorkshire ICB - 03K | Humber and North Yorkshire ICB - 03Q | Humber and North Yorkshire ICB - 42D |
|---|---|---|---|---|---|---|---|---|---|
Stroke: QOF prevalence (Persons All ages) | 2024/25 | 1.9 | 2.4 | 2.6 | 1.6 | 2.6 | 2.3 | 2.3 | 2.7 |
The percentage of patients in Hull who have been diagnosed as having had a stroke or transient ischaemic attack has remained relatively static in Hull at 1.6% although the absolute numbers in Hull have increased in the last few years. The rate has also remained relatively unchanged in England and across the local Integrated Care Board, albeit both at a higher rate compared to Hull, although there has been a slight increase for England in the last year.
Compared with benchmark
Stroke: QOF prevalence (Persons All ages)
|
Period
|
Humber and North Yorkshire ICB - 03F |
NHS Humber and North Yorkshire Integrated Care Board - QOQ
|
England
|
||||
|---|---|---|---|---|---|---|---|
|
Count
|
Value
|
95%
Lower CI |
95%
Upper CI |
||||
| 2012/13 | • | 4593 | 1.6% | 1.5% | 1.6% | - | 1.7% |
| 2013/14 | • | 4535 | 1.6% | 1.5% | 1.6% | - | 1.7% |
| 2014/15 | • | 4560 | 1.6% | 1.5% | 1.6% | - | 1.7% |
| 2015/16 | • | 4623 | 1.6% | 1.5% | 1.6% | - | 1.7% |
| 2016/17 | • | 4698 | 1.5% | 1.5% | 1.6% | - | 1.7% |
| 2017/18 | • | 4772 | 1.6% | 1.6% | 1.6% | - | 1.8% |
| 2018/19 | • | 4748 | 1.6% | 1.5% | 1.6% | - | 1.8% |
| 2019/20 | • | 4755 | 1.6% | 1.5% | 1.6% | 2.2% | 1.8% |
| 2020/21 | • | 4752 | 1.6% | 1.5% | 1.6% | 2.2% | 1.8% |
| 2021/22 | • | 4766 | 1.6% | 1.5% | 1.6% | 2.2% | 1.8% |
| 2022/23 | • | 4920 | 1.6% | 1.5% | 1.6% | 2.3% | 1.8% |
| 2023/24 | • | 4987 | 1.6% | 1.5% | 1.6% | 2.3% | 1.9% |
| 2024/25 | • | 5093 | 1.6% | 1.6% | 1.7% | 2.4% | 1.9% |
Source: NHS England
From the local analysis, there was a statistically significant association between average age of the practice patients and the prevalence of diagnosed stroke and transient ischaemic attack across the 25 practices in Hull for 2024/25. The prevalence was 1.0% among practices serving the youngest patients compared to 2.0% among practices serving the oldest patients. For every increase in the average age of the patients of 10 years, the prevalence of stroke and transient ischaemic attack increased by 1.1 percentage points. Further analysis of diagnosed disease by the average age of practice patients is within the file above and within Local Analysis of Quality and Outcomes Framework Data.
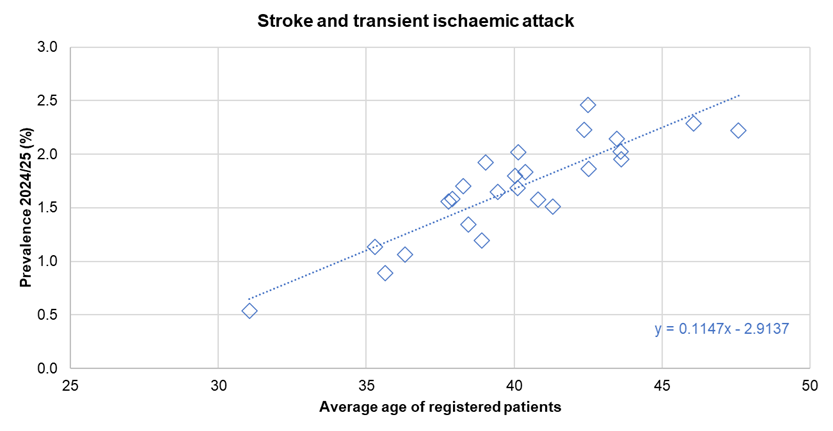
There was no statistically significant association between the prevalence of diagnosed stroke and transient ischaemic attack and the average deprivation score of registered patients across the 25 practices.
Hospital Admissions for Stroke
The directly standardised admission rate for stroke is marginally lower than England for 2024/25.
The rate is given as the number of admissions per 100,000 population (in the European Standard Population).
Compared with benchmark
| Indicator | Period | England | Yorkshire and the Humber region (statistical) | Kingston upon Hull | East Riding of Yorkshire | North East Lincolnshire | North Lincolnshire | York | North Yorkshire UA | Barnsley | Doncaster | Rotherham | Sheffield | Bradford | Calderdale | Kirklees | Leeds | Wakefield |
|---|---|---|---|---|---|---|---|---|---|---|---|---|---|---|---|---|---|---|
Hospital admissions due to stroke (Persons All ages) | 2024/25 | 172.7 | - | 167.5 | 167.8 | 204.2 | 174.3 | 185.6 | 185.2 | 264.5 | 170.1 | 225.5 | 185.1 | 174.0 | 181.3 | 190.3 | 194.8 | 195.2 |
Between 2012/13 and 2021/22, the admission rate for stroke has been reasonably similar to England with between 160 and 187 admissions per 100,000 population (the rate in 2016/17 at 189 per 100,000 population was slightly higher and statistically significantly higher than England). Whilst the rate increased to 194 admissions per 100,000 population for 2022/23, the rate has decreased to 168 admissions per 100,000 population for 2024/25.
For the latest financial year 2024/25, there were 375 admissions among Hull residents where the primary reason for admission was stroke.
Compared with benchmark
Hospital admissions due to stroke (Persons All ages)
|
Period
|
Kingston upon Hull |
Yorkshire and the Humber region (statistical)
|
England
|
||||
|---|---|---|---|---|---|---|---|
|
Count
|
Value
|
95%
Lower CI |
95%
Upper CI |
||||
| 2003/04 | • | 290 | 155.1 | 137.6 | 174.1 | - | 180.7 |
| 2004/05 | • | 250 | 131.9 | 115.9 | 149.5 | - | 176.9 |
| 2005/06 | • | 245 | 127.5 | 111.9 | 144.7 | - | 174.6 |
| 2006/07 | • | 190 | 100.2 | 86.4 | 115.7 | - | 163.9 |
| 2007/08 | • | 240 | 126.9 | 111.2 | 144.2 | - | 157.7 |
| 2008/09 | • | 220 | 114.2 | 99.4 | 130.5 | - | 160.7 |
| 2009/10 | • | 320 | 166.0 | 148.2 | 185.4 | - | 170.0 |
| 2010/11 | • | 380 | 195.4 | 176.1 | 216.2 | - | 175.1 |
| 2011/12 | • | 410 | 206.1 | 186.5 | 227.2 | - | 179.0 |
| 2012/13 | • | 315 | 159.7 | 142.4 | 178.6 | - | 179.3 |
| 2013/14 | • | 320 | 162.1 | 144.7 | 181.0 | - | 174.7 |
| 2014/15 | • | 360 | 180.0 | 161.8 | 199.8 | - | 172.4 |
| 2015/16 | • | 375 | 186.7 | 168.1 | 206.8 | - | 173.6 |
| 2016/17 | • | 390 | 188.9 | 170.4 | 208.8 | - | 170.2 |
| 2017/18 | • | 380 | 183.1 | 164.8 | 202.7 | - | 170.2 |
| 2018/19 | • | 355 | 166.6 | 149.5 | 185.2 | - | 167.3 |
| 2019/20 | • | 355 | 166.0 | 149.0 | 184.4 | - | 171.8 |
| 2020/21 | • | 375 | 175.6 | 158.2 | 194.5 | - | 166.3 |
| 2021/22 | • | 360 | 166.4 | 149.6 | 184.6 | - | 171.4 |
| 2022/23 | • | 425 | 194.1 | 176.0 | 213.5 | - | 168.4 |
| 2023/24 | • | 390 | 175.1 | 158.1 | 193.5 | - | 173.1 |
| 2024/25 | • | 375 | 167.5 | 150.9 | 185.4 | - | 172.7 |
Source: OHID, based on NHS England and Office for National Statistics data
Emergency Hospital Admissions for Stroke by Area Committee Areas in Hull
Directly age-standardised emergency admission rates for stroke, produced for Area Committee Areas in Hull, are shown below, using data extracted from Hospital Episode Statistics. For the 5-year period 2020/21 to 2024/25 there was an average of 431 emergency hospital admissions for stoke each year in Hull, giving a rate of 195 emergency admissions per 100,000 population. Emergency admission rates for stroke were statistically significantly higher than the Hull average for Riverside Area Committee Area (42% higher). Rates in other Area Committee Area were not significantly different to the Hull average, and ranged from 177 per 100,000 population in East Central and West to 191 per 100,000 population in East.
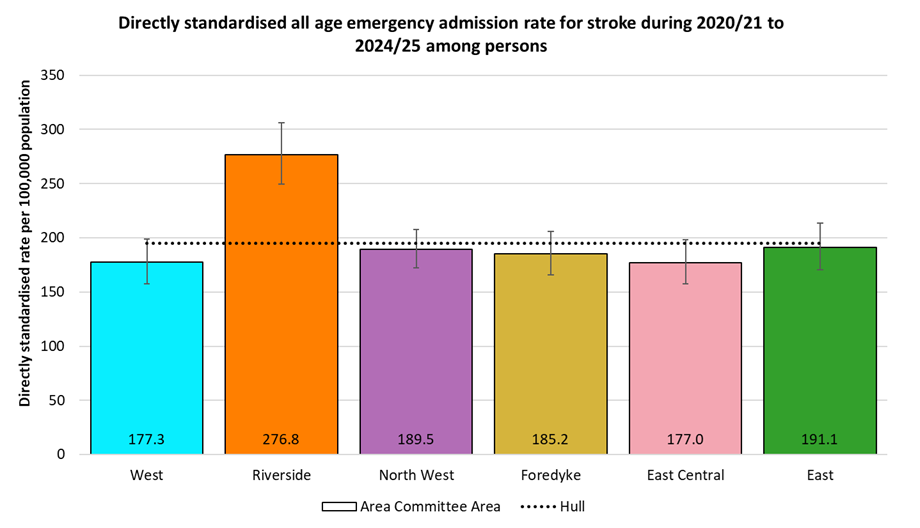
The highest emergency admission rates for stroke were seen among males. Again the highest rate was found for Riverside Area Committee Area, at 345 per 100,000 males, which was almost one and a half times higher than the Hull average of 231 per 100,000 males. Rates in other Area Committee Areas ranged between 204 per 100,000 males in East to 225 per 100,000 males in East Central.
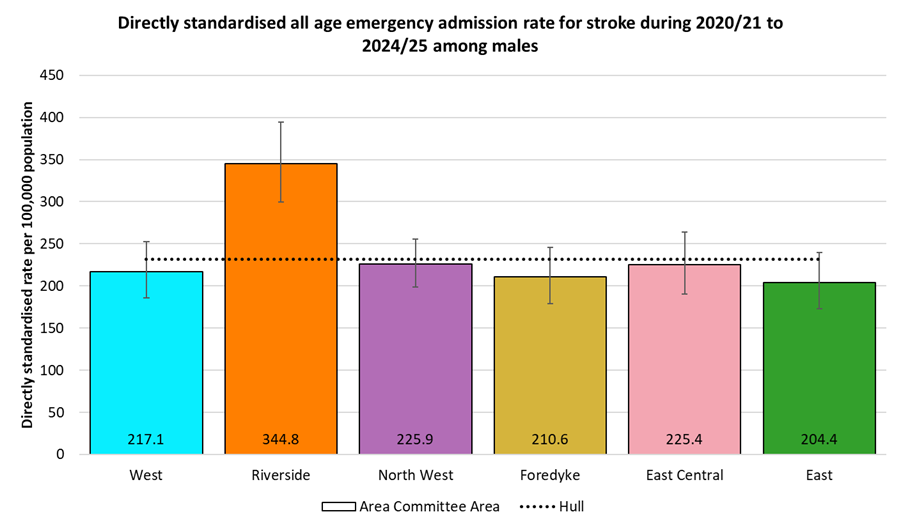
The pattern of emergency hospital admission rates for stroke among females was similar, although with rates around one third lower than for males in most Area Committee Areas. Again, the highest rate was in Riverside Area Committee Area, although at 31% higher than the Hull average of 161 emergency admissions per 100,000 females, the difference between this area and the other Area Committee Areas in Hull was smaller for women than it was for men. Rates were most similar between males and females in East and Foredyke Area committee Areas, with female rates 14% and 22% lower respectively than male rates.
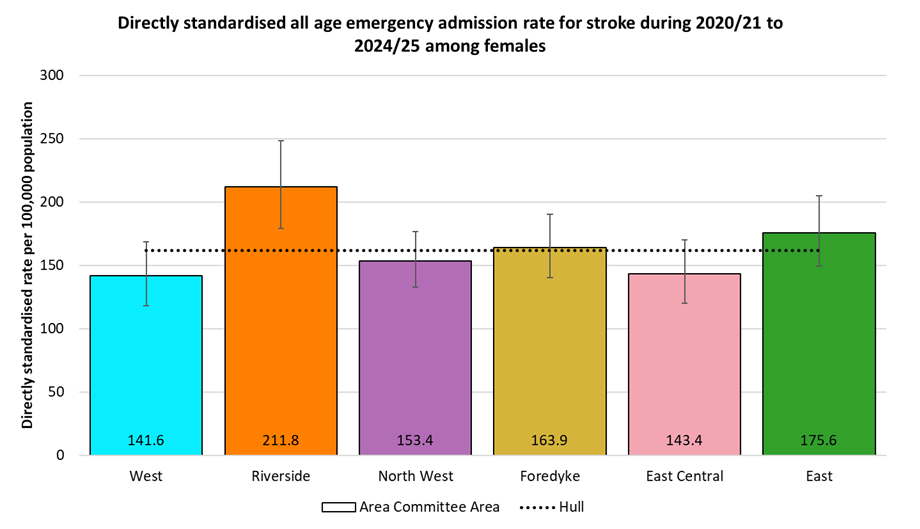
Emergency Hospital Admissions for Stroke by Local Deprivation Fifths
There was a clear deprivation gradient in emergency hospital admissions for stroke. The rate of emergency admissions among people living in the most deprived fifth of areas of Hull was 85% higher than among people living in the least deprived fifth of areas of the city.
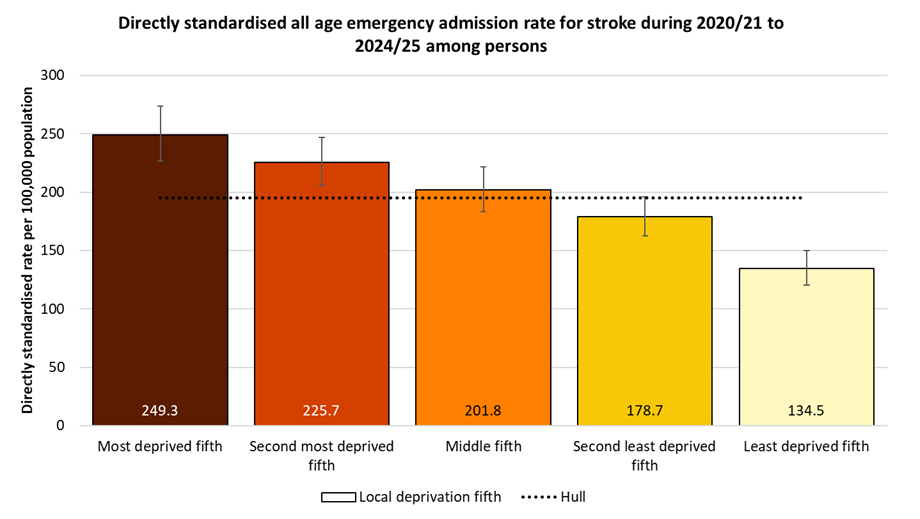
This pattern held true for males, with the admission rate among males living in the most deprived fifth of areas of Hull 83% higher than for males in the least deprived fifth of areas of the city.
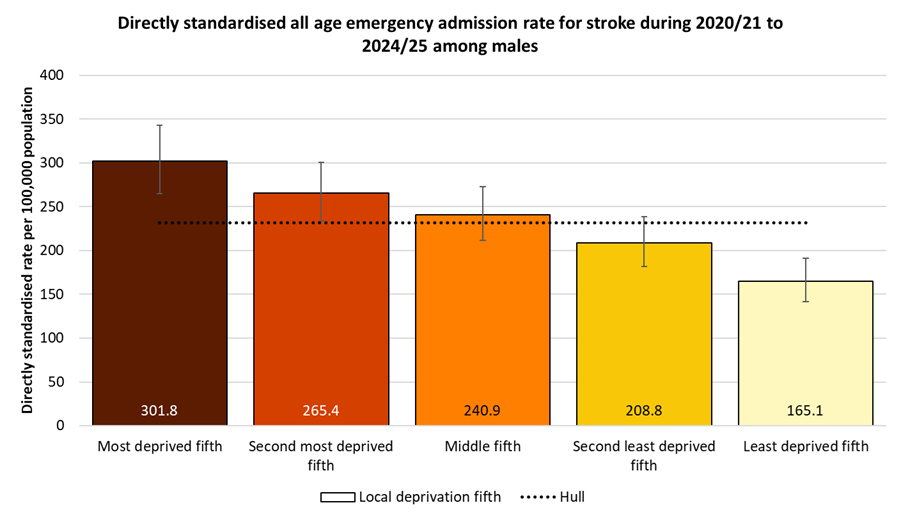
The deprivation gradient in emergency hospital admissions for stroke is also apparent for females, although with an even greater difference between deprivation fifths. Females living in the most deprived fifth of areas of Hull had an emergency admission rate for stroke 91% higher than those in the least deprived fifth of areas.
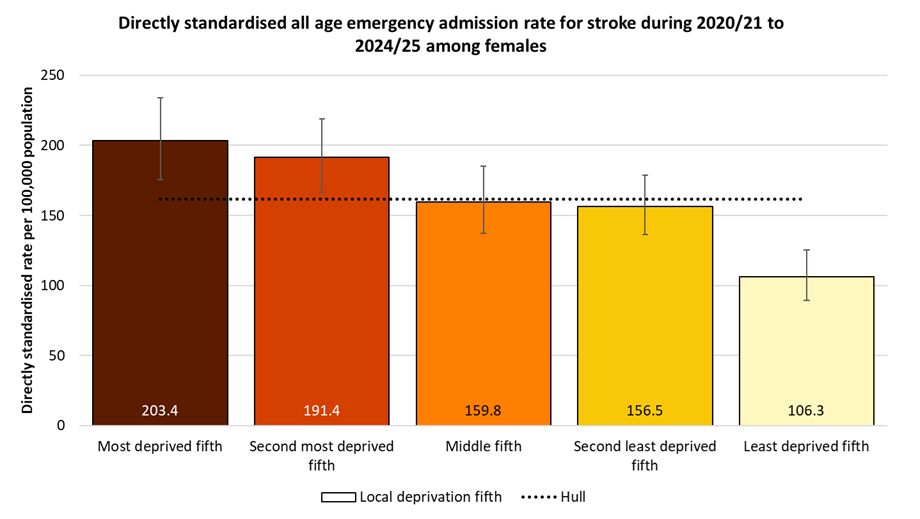
Deaths from Stroke
The directly standardised mortality rate for stroke is substantially higher than England for both deaths occurring under 75 years and 75+ years for 2022-24 being 30% higher for under 75s, and 23% higher among those aged 75+ years. The mortality rate from stroke is among the highest in the region.
The mortality rate is given as the number of deaths per 100,000 population (in the European Standard Population).
Compared with benchmark
| Indicator | Period | England | Yorkshire and the Humber region (statistical) | Kingston upon Hull | East Riding of Yorkshire | North East Lincolnshire | North Lincolnshire | York | North Yorkshire UA | Barnsley | Doncaster | Rotherham | Sheffield | Bradford | Calderdale | Kirklees | Leeds | Wakefield |
|---|---|---|---|---|---|---|---|---|---|---|---|---|---|---|---|---|---|---|
Under 75 mortality rate from stroke (Persons <75 yrs) | 2022 - 24 | 12.7 | 14.2 | 16.5 | 13.0 | 16.2 | 13.6 | 11.1 | 11.1 | 16.4 | 15.3 | 13.3 | 13.6 | 19.9 | 12.0 | 16.3 | 13.2 | 14.6 |
Under 75 mortality rate from stroke (Male <75 yrs) | 2022 - 24 | 14.9 | 16.4 | 16.9 | 16.1 | 20.8 | 17.1 | 14.2 | 11.6 | 17.4 | 15.2 | 15.9 | 16.6 | 23.7 | 14.6 | 19.6 | 15.4 | 16.5 |
Under 75 mortality rate from stroke (Female <75 yrs) | 2022 - 24 | 10.7 | 12.1 | 16.0 | 10.0 | 11.7 | 10.2 | 8.2 | 10.5 | 15.5 | 15.3 | 10.7 | 10.8 | 16.1 | 9.6 | 13.2 | 11.2 | 12.8 |
Over 74 mortality rate from stroke (Persons 75+ yrs) | 2022 - 24 | 409.9 | 449.9 | 503.8 | 462.0 | 479.4 | 414.6 | 449.3 | 432.3 | 448.6 | 392.0 | 399.3 | 446.2 | 473.1 | 507.7 | 465.6 | 438.4 | 483.3 |
There was a relatively sharp fall in the under 75s stroke mortality rate between 2004-06 and 2011-13 from 34.2 deaths per 100,000 population to a low of 17.6 per 100,000 population, but the mortality rate increased to 21.0 deaths per 100,000 population for 2014-16 and has remained around 20 deaths per 100,000 population until 2019-21, with a decrease in the last two years to 18 deaths per 100,000 population for 2021-23.
Throughout the entire period 2001-03 to 2022-24, the premature mortality rate from stroke has been statistically significantly higher in Hull compared to England, although with the reduction in Hull in the last 3-4 years, the inequalities gap between Hull and England has narrowed slightly.
There were 106 deaths among Hull residents who are aged under the age of 75 years during the three year period 2022-24 equating to an average of 35 deaths per year.
Compared with benchmark
Under 75 mortality rate from stroke (Persons <75 yrs)
|
Period
|
Kingston upon Hull |
Yorkshire and the Humber region (statistical)
|
England
|
||||
|---|---|---|---|---|---|---|---|
|
Count
|
Value
|
95%
Lower CI |
95%
Upper CI |
||||
| 2001 - 03 | • | 182 | 34.2 | 29.4 | 39.5 | 27.4 | 25.8 |
| 2002 - 04 | • | 174 | 32.9 | 28.2 | 38.2 | 25.2 | 24.3 |
| 2003 - 05 | • | 168 | 31.9 | 27.3 | 37.1 | 23.7 | 22.5 |
| 2004 - 06 | • | 170 | 32.4 | 27.7 | 37.6 | 21.7 | 20.6 |
| 2005 - 07 | • | 148 | 28.1 | 23.7 | 33.0 | 20.7 | 19.1 |
| 2006 - 08 | • | 143 | 27.3 | 23.0 | 32.1 | 19.4 | 17.7 |
| 2007 - 09 | • | 117 | 21.8 | 18.0 | 26.2 | 18.4 | 16.5 |
| 2008 - 10 | • | 122 | 22.6 | 18.7 | 27.0 | 17.6 | 15.7 |
| 2009 - 11 | • | 105 | 19.2 | 15.7 | 23.3 | 17.1 | 15.1 |
| 2010 - 12 | • | 107 | 20.0 | 16.4 | 24.2 | 16.4 | 14.6 |
| 2011 - 13 | • | 95 | 17.6 | 14.2 | 21.5 | 15.3 | 14.0 |
| 2012 - 14 | • | 104 | 19.2 | 15.7 | 23.3 | 14.4 | 13.6 |
| 2013 - 15 | • | 106 | 19.1 | 15.6 | 23.1 | 14.2 | 13.4 |
| 2014 - 16 | • | 117 | 21.0 | 17.3 | 25.2 | 14.3 | 13.2 |
| 2015 - 17 | • | 115 | 19.7 | 16.3 | 23.7 | 14.2 | 12.9 |
| 2016 - 18 | • | 119 | 20.0 | 16.6 | 24.0 | 14.1 | 12.7 |
| 2017 - 19 | • | 123 | 20.1 | 16.7 | 24.0 | 13.6 | 12.3 |
| 2018 - 20 | • | 127 | 20.6 | 17.1 | 24.5 | 13.8 | 12.4 |
| 2019 - 21 | • | 126 | 20.0 | 16.6 | 23.8 | 13.8 | 12.5 |
| 2020 - 22 | • | 120 | 18.8 | 15.6 | 22.5 | 14.1 | 12.6 |
| 2021 - 23 | • | 112 | 17.4 | 14.4 | 21.0 | 14.1 | 12.7 |
| 2022 - 24 | • | 106 | 16.5 | 13.5 | 20.0 | 14.2 | 12.7 |
Source: OHID, based on Office for National Statistics data
The trends over the time in the premature mortality from stroke followed a similar pattern for males with a decrease from 40.7 to 22.5 deaths per 100,000 population between 2001-03 and 2011-13 with the mortality rate remaining relatively unchanged until 2016-18 when it increased slightly to around 25 deaths per 100,000 population until 2019-21. However, there have been decreases in the last three years with the mortality rate 16.9 deaths per 100,000 population for 2022-24.
Among men, there were 54 deaths among Hull residents who are aged under the age of 75 years during the three year period 2021-23 equating to an average of 18 deaths per year.
Just over half of all the premature deaths due to stroke were among men.
Compared with benchmark
Under 75 mortality rate from stroke (Male <75 yrs)
|
Period
|
Kingston upon Hull |
Yorkshire and the Humber region (statistical)
|
England
|
||||
|---|---|---|---|---|---|---|---|
|
Count
|
Value
|
95%
Lower CI |
95%
Upper CI |
||||
| 2001 - 03 | • | 104 | 40.7 | 33.2 | 49.4 | 32.0 | 30.3 |
| 2002 - 04 | • | 92 | 36.8 | 29.7 | 45.1 | 29.3 | 28.5 |
| 2003 - 05 | • | 89 | 35.5 | 28.5 | 43.7 | 27.5 | 26.2 |
| 2004 - 06 | • | 86 | 34.2 | 27.3 | 42.3 | 25.4 | 24.0 |
| 2005 - 07 | • | 74 | 29.3 | 23.0 | 36.8 | 23.9 | 22.0 |
| 2006 - 08 | • | 75 | 29.1 | 22.8 | 36.5 | 21.8 | 20.5 |
| 2007 - 09 | • | 66 | 24.6 | 18.9 | 31.3 | 20.7 | 19.2 |
| 2008 - 10 | • | 77 | 28.6 | 22.5 | 35.8 | 20.2 | 18.5 |
| 2009 - 11 | • | 69 | 25.2 | 19.5 | 32.0 | 20.4 | 17.8 |
| 2010 - 12 | • | 67 | 25.6 | 19.8 | 32.7 | 19.5 | 17.0 |
| 2011 - 13 | • | 60 | 22.5 | 17.1 | 29.1 | 18.0 | 16.3 |
| 2012 - 14 | • | 61 | 23.1 | 17.6 | 29.8 | 16.2 | 15.8 |
| 2013 - 15 | • | 60 | 21.6 | 16.4 | 27.9 | 15.9 | 15.6 |
| 2014 - 16 | • | 64 | 23.3 | 17.8 | 29.8 | 16.0 | 15.3 |
| 2015 - 17 | • | 66 | 22.7 | 17.5 | 29.0 | 16.0 | 15.0 |
| 2016 - 18 | • | 73 | 24.6 | 19.2 | 31.0 | 15.8 | 14.7 |
| 2017 - 19 | • | 77 | 25.0 | 19.7 | 31.3 | 15.2 | 14.4 |
| 2018 - 20 | • | 78 | 24.9 | 19.7 | 31.1 | 15.4 | 14.5 |
| 2019 - 21 | • | 80 | 25.3 | 20.0 | 31.5 | 16.1 | 14.7 |
| 2020 - 22 | • | 73 | 22.9 | 17.9 | 28.8 | 16.6 | 14.8 |
| 2021 - 23 | • | 67 | 21.0 | 16.2 | 26.6 | 16.8 | 14.9 |
| 2022 - 24 | • | 54 | 16.9 | 12.7 | 22.1 | 16.4 | 14.9 |
Source: OHID, based on Office for National Statistics data
The premature mortality rate among Hull women was just under 30 deaths per 100,000 population between 2001-03 and 2004-06, but fell sharply to a low of 12.9 deaths per 100,000 population for 2011-13 before increasing to 18.8 deaths per 100,000 population in 2014-16. The mortality has reduced since then decreased slowly but increased in 2022-24 to 16.0 deaths per 100,000 population.
Among women, there were 52 deaths among Hull residents who are aged under the age of 75 years during the three year period 2022-24 equating to an average of 17 deaths per year.
Just under half of all the premature deaths due to stroke were among women.
Compared with benchmark
Under 75 mortality rate from stroke (Female <75 yrs)
|
Period
|
Kingston upon Hull |
Yorkshire and the Humber region (statistical)
|
England
|
||||
|---|---|---|---|---|---|---|---|
|
Count
|
Value
|
95%
Lower CI |
95%
Upper CI |
||||
| 2001 - 03 | • | 78 | 28.1 | 22.2 | 35.0 | 23.3 | 21.7 |
| 2002 - 04 | • | 81 | 29.2 | 23.2 | 36.3 | 21.6 | 20.4 |
| 2003 - 05 | • | 79 | 28.6 | 22.6 | 35.7 | 20.2 | 19.1 |
| 2004 - 06 | • | 84 | 30.8 | 24.5 | 38.1 | 18.3 | 17.5 |
| 2005 - 07 | • | 74 | 27.1 | 21.2 | 34.0 | 17.7 | 16.4 |
| 2006 - 08 | • | 68 | 25.4 | 19.7 | 32.2 | 17.1 | 15.1 |
| 2007 - 09 | • | 50 | 18.9 | 14.1 | 24.9 | 16.2 | 14.0 |
| 2008 - 10 | • | 44 | 16.6 | 12.1 | 22.3 | 15.2 | 13.1 |
| 2009 - 11 | • | 36 | 13.3 | 9.4 | 18.4 | 14.0 | 12.5 |
| 2010 - 12 | • | 40 | 14.8 | 10.5 | 20.1 | 13.6 | 12.3 |
| 2011 - 13 | • | 35 | 12.9 | 9.0 | 17.9 | 12.8 | 11.8 |
| 2012 - 14 | • | 43 | 15.6 | 11.2 | 21.0 | 12.8 | 11.5 |
| 2013 - 15 | • | 46 | 16.5 | 12.1 | 22.0 | 12.6 | 11.3 |
| 2014 - 16 | • | 53 | 18.8 | 14.1 | 24.6 | 12.7 | 11.3 |
| 2015 - 17 | • | 49 | 16.8 | 12.4 | 22.3 | 12.4 | 10.9 |
| 2016 - 18 | • | 46 | 15.5 | 11.4 | 20.7 | 12.4 | 10.7 |
| 2017 - 19 | • | 46 | 15.3 | 11.2 | 20.4 | 12.0 | 10.3 |
| 2018 - 20 | • | 49 | 16.2 | 12.0 | 21.3 | 12.3 | 10.4 |
| 2019 - 21 | • | 46 | 14.7 | 10.8 | 19.6 | 11.5 | 10.3 |
| 2020 - 22 | • | 47 | 14.8 | 10.9 | 19.7 | 11.8 | 10.6 |
| 2021 - 23 | • | 45 | 13.9 | 10.1 | 18.6 | 11.6 | 10.6 |
| 2022 - 24 | • | 52 | 16.0 | 11.9 | 20.9 | 12.1 | 10.7 |
Source: OHID, based on Office for National Statistics data
For those aged 75+ years, the mortality rate in Hull was slightly higher than England but not significantly higher between 2004-06 and 2010-12 decreasing from 1,002 to 721 deaths per 100,000 population in line with the decrease for England. However, whilst the mortality rate continued to decline at a similar rate in England, the mortality rate increased in Hull to 787 deaths per 100,000 population for 2012-14 and remained just under 800 deaths per 100,000 population until 2015-17 before reducing to 504 deaths per 100,000 population for 2022-24. Whilst the latest mortality rate in Hull is considerably lower than it was in 2001-03, the mortality rate has been statistically significantly higher than England since 2011-13.
Whilst the inequalities gap between Hull and England has reduced from its high of 5-9 years ago, the current inequalities gap is wider now than it was in 2001-03.
Among those aged 75+ years, there were 270 deaths among Hull residents from stroke during the three year period 2022-24 equating to 90 deaths per year.
Compared with benchmark
Over 74 mortality rate from stroke (Persons 75+ yrs)
|
Period
|
Kingston upon Hull |
Yorkshire and the Humber region (statistical)
|
England
|
||||
|---|---|---|---|---|---|---|---|
|
Count
|
Value
|
95%
Lower CI |
95%
Upper CI |
||||
| 2004 - 06 | • | 482 | 1001.8 | 913.0 | 1096.8 | 985.7 | 921.1 |
| 2005 - 07 | • | 456 | 944.4 | 858.3 | 1036.7 | 924.8 | 871.6 |
| 2006 - 08 | • | 437 | 892.0 | 808.8 | 981.2 | 896.1 | 840.2 |
| 2007 - 09 | • | 417 | 840.7 | 760.5 | 927.0 | 852.6 | 802.1 |
| 2008 - 10 | • | 393 | 792.8 | 715.2 | 876.5 | 811.6 | 770.6 |
| 2009 - 11 | • | 370 | 743.7 | 668.9 | 824.6 | 757.5 | 714.2 |
| 2010 - 12 | • | 363 | 721.2 | 648.1 | 800.2 | 727.8 | 675.7 |
| 2011 - 13 | • | 375 | 733.5 | 660.4 | 812.5 | 703.9 | 634.8 |
| 2012 - 14 | • | 401 | 786.5 | 710.7 | 868.0 | 667.3 | 604.9 |
| 2013 - 15 | • | 404 | 792.7 | 716.6 | 874.6 | 640.2 | 584.7 |
| 2014 - 16 | • | 404 | 796.0 | 719.6 | 878.3 | 601.4 | 555.4 |
| 2015 - 17 | • | 393 | 775.4 | 699.8 | 856.9 | 581.8 | 533.8 |
| 2016 - 18 | • | 389 | 765.5 | 690.5 | 846.4 | 542.0 | 501.3 |
| 2017 - 19 | • | 354 | 687.9 | 617.4 | 764.2 | 517.2 | 475.9 |
| 2018 - 20 | • | 333 | 644.1 | 576.2 | 717.7 | 503.5 | 457.1 |
| 2019 - 21 | • | 308 | 593.7 | 528.8 | 664.2 | 483.5 | 438.7 |
| 2020 - 22 | • | 295 | 565.9 | 502.8 | 634.6 | 474.5 | 430.7 |
| 2021 - 23 | • | 291 | 550.4 | 488.7 | 617.7 | 452.1 | 419.6 |
| 2022 - 24 | • | 270 | 503.8 | 445.2 | 567.9 | 449.9 | 409.9 |
Source: OHID, based on Office for National Statistics data
Estimated Number of People in the Future Who Will Have Had a Stroke
The Projecting Adult Needs and Service Information (PANSI) provides current estimates and future projections at local authority level of the number of people with different health needs. The prevalence for different age groups and for males and females estimated from different surveys and research has been applied to current population estimates and population projections to provide estimates for each local authority.
The estimates do not take into account deprivation, and due to Hull’s high levels of deprivation, the incidence of stroke is higher than England. However, it is difficult to say how different the prevalence of stroke will be in Hull because more people in Hull who have a stroke will die from their stroke.
They estimate that there are around 470 residents of Hull aged 18-64 years who are living with a long-standing health condition caused by a stroke.
| Gender | Age | 2025 | 2030 | 2035 | 2040 | 2045 |
| Males | 18-44 | 0 | 0 | 0 | 0 | 0 |
| Males | 45-64 | 257 | 250 | 251 | 263 | 274 |
| Males | Total 18-64 | 258 | 250 | 251 | 263 | 274 |
| Females | 18-44 | 53 | 53 | 52 | 51 | 50 |
| Females | 45-64 | 157 | 154 | 157 | 163 | 169 |
| Females | Total 18-64 | 210 | 207 | 209 | 214 | 219 |
| All | Total 18-64 | 467 | 457 | 460 | 477 | 492 |
Atrial Fibrillation
In 2024/25, there were 5,717 patients registered with Hull GPs (03F) who had been diagnosed with atrial fibrillation which was lower than England (1.8% versus 2.2%).
Compared with benchmark
| Indicator | Period | England | NHS Humber and North Yorkshire Integrated Care Board - QOQ | Humber and North Yorkshire ICB - 02Y | Humber and North Yorkshire ICB - 03F | Humber and North Yorkshire ICB - 03H | Humber and North Yorkshire ICB - 03K | Humber and North Yorkshire ICB - 03Q | Humber and North Yorkshire ICB - 42D |
|---|---|---|---|---|---|---|---|---|---|
Atrial fibrillation: QOF prevalence (Persons All ages) | 2024/25 | 2.2 | 2.9 | 3.4 | 1.8 | 2.8 | 2.6 | 2.6 | 3.3 |
The prevalence of atrial fibrillation has been gradually increasing in Hull in line with increases across England and for Humber and North Yorkshire Integrated Care Board. However, the percentage diagnosed with atrial fibrillation in Hull has been consistently lower than both England and for the local Integrated Care Board. Furthermore, the diagnosed prevalence has increased in England and for the local Integrated Care Board in the 3-4 years but there has been no real change in Hull.
Compared with benchmark
Atrial fibrillation: QOF prevalence (Persons All ages)
|
Period
|
Humber and North Yorkshire ICB - 03F |
NHS Humber and North Yorkshire Integrated Care Board - QOQ
|
England
|
||||
|---|---|---|---|---|---|---|---|
|
Count
|
Value
|
95%
Lower CI |
95%
Upper CI |
||||
| 2012/13 | • | 3652 | 1.3% | 1.2% | 1.3% | 1.8% | 1.5% |
| 2013/14 | • | 3738 | 1.3% | 1.3% | 1.3% | 1.9% | 1.6% |
| 2014/15 | • | 3885 | 1.3% | 1.3% | 1.4% | 1.9% | 1.6% |
| 2015/16 | • | 4052 | 1.4% | 1.3% | 1.4% | 2.0% | 1.7% |
| 2016/17 | • | 4531 | 1.5% | 1.4% | 1.5% | 2.2% | 1.8% |
| 2017/18 | • | 4780 | 1.6% | 1.6% | 1.6% | 2.3% | 1.9% |
| 2018/19 | • | 4957 | 1.6% | 1.6% | 1.7% | 2.5% | 2.0% |
| 2019/20 | • | 5262 | 1.7% | 1.7% | 1.8% | 2.6% | 2.1% |
| 2020/21 | • | 5215 | 1.7% | 1.7% | 1.8% | 2.6% | 2.0% |
| 2021/22 | • | 5394 | 1.8% | 1.7% | 1.8% | 2.6% | 2.1% |
| 2022/23 | • | 5411 | 1.7% | 1.7% | 1.8% | 2.7% | 2.1% |
| 2023/24 | • | 5482 | 1.7% | 1.7% | 1.8% | 2.8% | 2.2% |
| 2024/25 | • | 5717 | 1.8% | 1.8% | 1.9% | 2.9% | 2.2% |
Source: NHS England
From the local analysis, there was a statistically significant association between average age of the practice patients and the prevalence of diagnosed atrial fibrillation across the 25 practices in Hull for 2024/25. The prevalence was 1.1% among practices serving the youngest patients compared to 2.4% among practices serving the oldest patients. For every increase in the average age of the patients of 10 years, the prevalence of atrial fibrillation increased by 1.6 percentage points. Further analysis of diagnosed disease by the average age of practice patients is within the file above and within Local Analysis of Quality and Outcomes Framework Data.
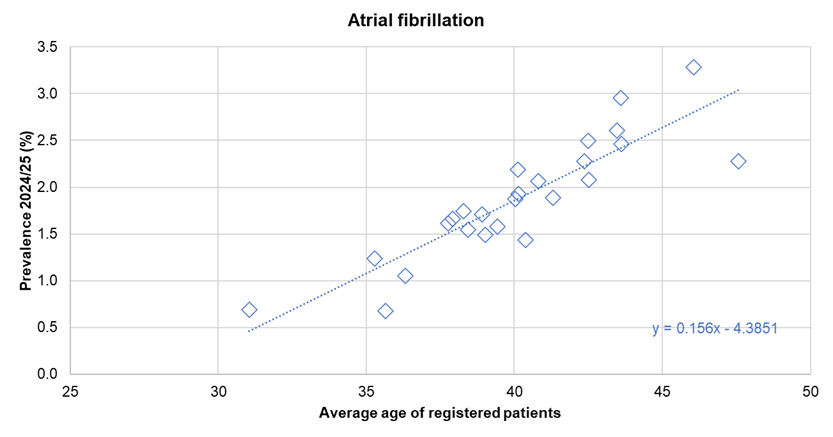
There was no statistically significant association between the prevalence of diagnosed atrial fibrillation and the average deprivation score of registered patients across the 25 practices.
Heart Failure
Number of People with Heart Failure
In 2024/25, there were 2,399 patients registered with Hull GPs (03F) who were diagnosed with heart failure representing 0.8% of Hull’s registered population which was lower than England (1.1%).
Compared with benchmark
| Indicator | Period | England | NHS Humber and North Yorkshire Integrated Care Board - QOQ | Humber and North Yorkshire ICB - 02Y | Humber and North Yorkshire ICB - 03F | Humber and North Yorkshire ICB - 03H | Humber and North Yorkshire ICB - 03K | Humber and North Yorkshire ICB - 03Q | Humber and North Yorkshire ICB - 42D |
|---|---|---|---|---|---|---|---|---|---|
Heart Failure: QOF prevalence (Persons All ages) | 2024/25 | 1.1 | 1.2 | 1.5 | 0.8 | 1.0 | 1.0 | 1.3 | 1.5 |
The prevalence of heart failure has increased gradually in Hull over time following similar increases in England and across the Humber and North Yorkshire Integrated Care Board until 2019/20 prior to the pandemic. The numbers fell for 2020/21, but have increased subsequently in Hull although the percentage has remained relatively unchanged. In contrast, the prevalence has increased since 2019/20 for both England the the local Integrated Care Board.
Compared with benchmark
Heart Failure: QOF prevalence (Persons All ages)
|
Period
|
Humber and North Yorkshire ICB - 03F |
NHS Humber and North Yorkshire Integrated Care Board - QOQ
|
England
|
||||
|---|---|---|---|---|---|---|---|
|
Count
|
Value
|
95%
Lower CI |
95%
Upper CI |
||||
| 2012/13 | • | 1826 | 0.6% | 0.6% | 0.7% | - | 0.7% |
| 2013/14 | • | 1897 | 0.7% | 0.6% | 0.7% | - | 0.7% |
| 2014/15 | • | 1932 | 0.7% | 0.6% | 0.7% | - | 0.7% |
| 2015/16 | • | 1976 | 0.7% | 0.6% | 0.7% | - | 0.8% |
| 2016/17 | • | 2017 | 0.7% | 0.6% | 0.7% | - | 0.8% |
| 2017/18 | • | 2034 | 0.7% | 0.7% | 0.7% | - | 0.8% |
| 2018/19 | • | 2375 | 0.8% | 0.8% | 0.8% | - | 0.9% |
| 2019/20 | • | 2437 | 0.8% | 0.8% | 0.8% | 1.0% | 0.9% |
| 2020/21 | • | 2360 | 0.8% | 0.7% | 0.8% | 1.0% | 0.9% |
| 2021/22 | • | 2511 | 0.8% | 0.8% | 0.8% | 1.1% | 1.0% |
| 2022/23 | • | 2549 | 0.8% | 0.8% | 0.9% | 1.1% | 1.0% |
| 2023/24 | • | 2579 | 0.8% | 0.8% | 0.9% | 1.2% | 1.1% |
| 2024/25 | • | 2399 | 0.8% | 0.7% | 0.8% | 1.2% | 1.1% |
Source: NHS England
From the local analysis, there was a statistically significant association between average age of the practice patients and the prevalence of diagnosed heart failure across the 25 practices in Hull for 2024/25. The prevalence was 0.5% among practices serving the youngest patients compared to 0.9% among practices serving the oldest patients. For every increase in the average age of the patients of 10 years, the prevalence of heart failure increased by 0.5 percentage points. Further analysis of diagnosed disease by the average age of practice patients is within the file above and within Local Analysis of Quality and Outcomes Framework Data.
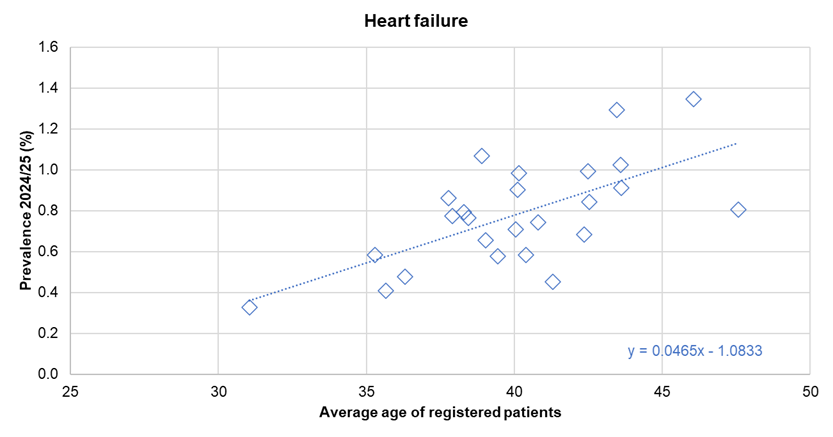
There was no statistically significant association between the prevalence of diagnosed heart failure and the average deprivation score of registered patients across the 25 practices.
Hospital Admissions for Heart Failure
The directly standardised hospital admission rate for heart failure in Hull for 2024/25 is statistically significantly higher than England. The rate is given as the number of admissions per 100,000 population (in the European Standard Population).
Compared with benchmark
| Indicator | Period | England | Yorkshire and the Humber region (statistical) | Kingston upon Hull | East Riding of Yorkshire | North East Lincolnshire | North Lincolnshire | York | North Yorkshire UA | Barnsley | Doncaster | Rotherham | Sheffield | Bradford | Calderdale | Kirklees | Leeds | Wakefield |
|---|---|---|---|---|---|---|---|---|---|---|---|---|---|---|---|---|---|---|
Hospital admissions due to heart failure (Persons All ages) | 2024/25 | 175.0 | - | 199.7 | 150.7 | 184.3 | 215.7 | 168.2 | 142.4 | 239.7 | 179.9 | 193.2 | 219.9 | 172.4 | 128.8 | 156.9 | 153.8 | 177.7 |
The admission rate for heart failure was significantly lower than England between 2006/07 and 2010/11, but has generally been increasing since then although is little changed in the past three years.. It is possible that part of the earlier increases could be better case diagnosis and recording of heart failure. In 2019/20, the admission rate was 49% higher in Hull compared to England. There has been a drastic fall in the admission rate between 2019/20 and 2020/21 presumably due to the COVID-19 pandemic. This recent fall was considerably greater in Hull than for England, but the admission rate for heart failure in Hull was still significantly higher than England for 2024/25.
During 2024/25, there were 440 emergency and elective admissions for heart failure among Hull residents.
Compared with benchmark
Hospital admissions due to heart failure (Persons All ages)
|
Period
|
Kingston upon Hull |
Yorkshire and the Humber region (statistical)
|
England
|
||||
|---|---|---|---|---|---|---|---|
|
Count
|
Value
|
95%
Lower CI |
95%
Upper CI |
||||
| 2003/04 | • | 300 | 157.0 | 139.6 | 175.9 | - | 160.9 |
| 2004/05 | • | 295 | 158.6 | 140.8 | 178.0 | - | 155.8 |
| 2005/06 | • | 275 | 142.3 | 125.8 | 160.4 | - | 149.0 |
| 2006/07 | • | 210 | 111.8 | 97.0 | 128.1 | - | 135.8 |
| 2007/08 | • | 215 | 113.4 | 98.6 | 129.8 | - | 135.6 |
| 2008/09 | • | 160 | 85.3 | 72.5 | 99.7 | - | 132.6 |
| 2009/10 | • | 205 | 111.3 | 96.5 | 127.8 | - | 131.8 |
| 2010/11 | • | 220 | 113.8 | 99.1 | 130.0 | - | 130.5 |
| 2011/12 | • | 310 | 159.3 | 141.9 | 178.3 | - | 130.8 |
| 2012/13 | • | 300 | 152.1 | 135.2 | 170.5 | - | 132.3 |
| 2013/14 | • | 280 | 138.9 | 122.9 | 156.4 | - | 134.0 |
| 2014/15 | • | 320 | 160.6 | 143.3 | 179.4 | - | 142.8 |
| 2015/16 | • | 350 | 178.7 | 160.2 | 198.6 | - | 154.7 |
| 2016/17 | • | 385 | 194.7 | 175.5 | 215.3 | - | 158.0 |
| 2017/18 | • | 430 | 214.0 | 194.0 | 235.5 | - | 163.1 |
| 2018/19 | • | 450 | 224.7 | 204.2 | 246.6 | - | 163.2 |
| 2019/20 | • | 500 | 247.3 | 225.9 | 270.2 | - | 173.9 |
| 2020/21 | • | 355 | 171.4 | 153.9 | 190.4 | - | 149.3 |
| 2021/22 | • | 430 | 203.8 | 184.8 | 224.2 | - | 178.2 |
| 2022/23 | • | 420 | 198.0 | 179.4 | 218.0 | - | 170.4 |
| 2023/24 | • | 440 | 205.7 | 186.8 | 225.9 | - | 179.6 |
| 2024/25 | • | 440 | 199.7 | 181.3 | 219.4 | - | 175.0 |
Source: OHID, based on NHS England and Office for National Statistics data
Deaths from Heart Failure
Information is also given on the percentage of deaths from heart failure which occur at home or at the deceased usual residence. The percentage in Hull is considerably lower than England for the two-year period 2023-24 (35% versus 60%).
Compared with benchmark
| Indicator | Period | England | Yorkshire and the Humber region (statistical) | Kingston upon Hull | East Riding of Yorkshire | North East Lincolnshire | North Lincolnshire | York | North Yorkshire UA | Barnsley | Doncaster | Rotherham | Sheffield | Bradford | Calderdale | Kirklees | Leeds | Wakefield |
|---|---|---|---|---|---|---|---|---|---|---|---|---|---|---|---|---|---|---|
Proportion of deaths at home (or usual place of residence) from heart failure (Persons All ages) | 2023 - 24 | 59.9 | 61.0 | 35.4 | 45.5 | 92.7 | 86.6 | 38.1 | 49.1 | 36.6 | 94.4 | 90.7 | 88.5 | 55.2 | 39.7 | 48.7 | 75.4 | 48.4 |
Just over half of all heart failure deaths in Hull occurred at home or their usual place of residence for 2012-13, but this has decreased to 39% in 2015-16 and remained just over 40% until 2018-19. The percentage increased for 2019-20 and 2020-21, but this could be associated with the pandemic with fewer people being admitted to hospital and thus dying in hospital, but the percentage returned to just over 40% for 2021-22, although has decreased further to a new low of 35% for 2023-24.
A significantly lower percentage of people with heart failure die at home or their usual place of residence in Hull compared to England. Many factors could influence this which might include patient choice, family support mechanisms and facilities at home (for example, making room for medical equipment or having a downstairs toilet in the home etc).
Compared with benchmark
Proportion of deaths at home (or usual place of residence) from heart failure (Persons All ages)
|
Period
|
Kingston upon Hull |
Yorkshire and the Humber region (statistical)
|
England
|
||||
|---|---|---|---|---|---|---|---|
|
Count
|
Value
|
95%
Lower CI |
95%
Upper CI |
||||
| 2012 - 13 | • | 267 | 54.3% | 49.9% | 58.6% | 59.1% | 58.2% |
| 2013 - 14 | • | 250 | 51.3% | 46.9% | 55.8% | 59.7% | 58.1% |
| 2014 - 15 | • | 205 | 46.8% | 42.2% | 51.5% | 59.6% | 58.5% |
| 2015 - 16 | • | 167 | 38.6% | 34.1% | 43.2% | 58.6% | 58.6% |
| 2016 - 17 | • | 219 | 42.4% | 38.3% | 46.8% | 58.1% | 58.6% |
| 2017 - 18 | • | 257 | 43.2% | 39.3% | 47.2% | 57.8% | 59.0% |
| 2018 - 19 | • | 267 | 42.9% | 39.1% | 46.9% | 59.0% | 59.3% |
| 2019 - 20 | • | 312 | 49.1% | 45.2% | 52.9% | 62.6% | 60.9% |
| 2020 - 21 | • | 296 | 47.1% | 43.2% | 51.0% | 63.1% | 61.0% |
| 2021 - 22 | • | 258 | 41.0% | 37.2% | 44.8% | 61.3% | 59.7% |
| 2022 - 23 | • | 230 | 36.6% | 33.0% | 40.5% | 60.9% | 59.6% |
| 2023 - 24 | • | 222 | 35.4% | 31.8% | 39.2% | 61.0% | 59.9% |
Source: Office for National Statistics
Hypertension
Number of People with Hypertension
In 2024/25, there were 48,675 patients registered with Hull GPs (03F) who were diagnosed with hypertension (high blood pressure) representing 15.5% of Hull’s registered population which is similar to England. The recorded prevalence in Hull is considerably lower than the average for the Humber and North Yorkshire Integrated Care Board, although the population across the local Integrated Care Board will be slightly older on average compared to Hull which could partly explain the difference.
Compared with benchmark
| Indicator | Period | England | NHS Humber and North Yorkshire Integrated Care Board - QOQ | Humber and North Yorkshire ICB - 02Y | Humber and North Yorkshire ICB - 03F | Humber and North Yorkshire ICB - 03H | Humber and North Yorkshire ICB - 03K | Humber and North Yorkshire ICB - 03Q | Humber and North Yorkshire ICB - 42D |
|---|---|---|---|---|---|---|---|---|---|
Hypertension: QOF prevalence (Persons All ages) | 2024/25 | 15.2 | 17.8 | 20.9 | 15.5 | 17.2 | 18.1 | 14.5 | 19.0 |
The prevalence of hypertension in Hull has remained relatively unchanged in the three years prior to the COVID-19 pandemic, but decreased for 2020/21 and 2021/22, although the numbers have increased in the last two years to a new high prevalence of 14.8% for Hull for 2023/24. The change in prevalence over time for Hull has been very similar to that of England, and whilst the pattern of change has also been similar to the local Integrated Care Board, the prevalence in Hull has been consistently lower.
Compared with benchmark
Hypertension: QOF prevalence (Persons All ages)
|
Period
|
Humber and North Yorkshire ICB - 03F |
NHS Humber and North Yorkshire Integrated Care Board - QOQ
|
England
|
||||
|---|---|---|---|---|---|---|---|
|
Count
|
Value
|
95%
Lower CI |
95%
Upper CI |
||||
| 2009/10 | • | 21403 | 12.4% | 12.2% | 12.6% | - | 13.4% |
| 2010/11 | • | 22117 | 13.0% | 12.8% | 13.2% | - | 13.5% |
| 2011/12 | • | 22933 | 13.2% | 13.0% | 13.3% | - | 13.6% |
| 2012/13 | • | 40119 | 13.8% | 13.7% | 13.9% | 15.1% | 13.7% |
| 2013/14 | • | 40546 | 14.1% | 13.9% | 14.2% | 15.2% | 13.7% |
| 2014/15 | • | 41391 | 14.3% | 14.1% | 14.4% | 15.3% | 13.8% |
| 2015/16 | • | 41993 | 14.2% | 14.1% | 14.3% | 15.4% | 13.8% |
| 2016/17 | • | 42618 | 13.8% | 13.7% | 13.9% | 15.3% | 13.8% |
| 2017/18 | • | 43006 | 14.4% | 14.3% | 14.5% | 15.7% | 13.9% |
| 2018/19 | • | 43376 | 14.4% | 14.3% | 14.5% | 15.8% | 14.0% |
| 2019/20 | • | 43740 | 14.4% | 14.3% | 14.6% | 15.9% | 14.1% |
| 2020/21 | • | 43148 | 14.2% | 14.1% | 14.3% | 15.8% | 13.9% |
| 2021/22 | • | 43592 | 14.2% | 14.1% | 14.3% | 16.0% | 14.0% |
| 2022/23 | • | 45177 | 14.5% | 14.4% | 14.6% | 16.6% | 14.4% |
| 2023/24 | • | 46681 | 14.8% | 14.7% | 15.0% | 17.2% | 14.8% |
| 2024/25 | • | 48675 | 15.5% | 15.3% | 15.6% | 17.8% | 15.2% |
Source: NHS England
From the local analysis, there was a statistically significant association between average age of the practice patients and the prevalence of diagnosed hypertension across the 25 practices in Hull for 2024/25. The prevalence was 10.4% among practices serving the youngest patients compared to 18.2% among practices serving the oldest patients. For every increase in the average age of the patients of 10 years, the prevalence of hypertension increased by 10.5 percentage points. Further analysis of diagnosed disease by the average age of practice patients is within the file above and within Local Analysis of Quality and Outcomes Framework Data.
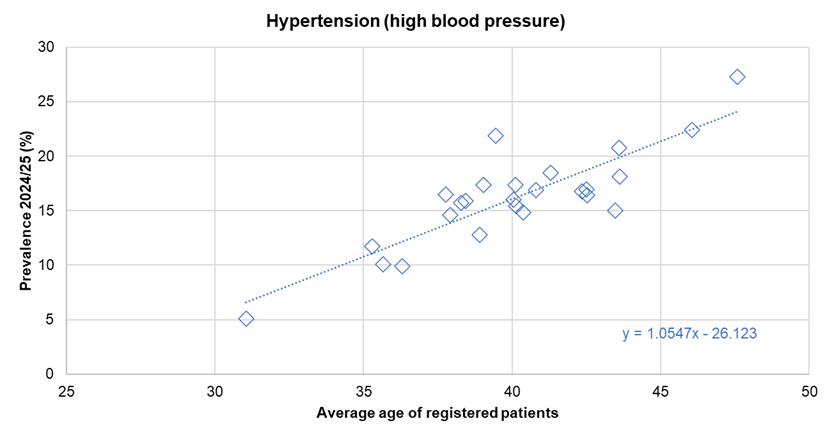
There was no statistically significant association between the prevalence of diagnosed hypertension and the average deprivation score of registered patients across the 25 practices.
Number of People who have had Blood Pressure Measured in Last Five Years
A similar percentage of patients aged 45+ years registered with Hull GPs (03F) had had their blood pressure measured in the last five years in 2024/25 compared to England (87.9% versus 87.3%) with a total of 110,213 patients aged 45+ years having their blood pressure measured in the last five years.
Compared with benchmark
| Indicator | Period | England | NHS Humber and North Yorkshire Integrated Care Board - QOQ | Humber and North Yorkshire ICB - 02Y | Humber and North Yorkshire ICB - 03F | Humber and North Yorkshire ICB - 03H | Humber and North Yorkshire ICB - 03K | Humber and North Yorkshire ICB - 03Q | Humber and North Yorkshire ICB - 42D |
|---|---|---|---|---|---|---|---|---|---|
Patients (aged 45+ yrs), who have a record of blood pressure in the last 5 yrs (denominator incl. PCAs) (Persons 45+ yrs) | 2024/25 | 87.3 | 88.3 | 89.6 | 87.9 | 90.8 | 88.9 | 84.2 | 88.4 |
Between 2014/15 and 2019/20, the percentage fell very slightly over time, but despite the decrease, nine in ten have had their blood pressure measured in the last five years over these years. However, the percentage fell to a low of 86.2% for 2021/22 which is likely associated with the COVID-19 pandemic. The percentage has increased in 2024/25 although it remains considerably lower than it was in 2014/15 (91.5%). It is possible that time is in even shorter supply now which has resulted in fewer patients having their blood pressure measured opportunistically during routine primary care appointments.
Compared with benchmark
Patients (aged 45+ yrs), who have a record of blood pressure in the last 5 yrs (denominator incl. PCAs) (Persons 45+ yrs)
|
Period
|
Humber and North Yorkshire ICB - 03F |
NHS Humber and North Yorkshire Integrated Care Board - QOQ
|
England
|
||||
|---|---|---|---|---|---|---|---|
|
Count
|
Value
|
95%
Lower CI |
95%
Upper CI |
||||
| 2014/15 | • | 107283 | 91.5% | 91.4% | 91.7% | 91.0% | 90.6% |
| 2015/16 | • | 107978 | 91.0% | 90.9% | 91.2% | 91.0% | 90.6% |
| 2016/17 | • | 108930 | 90.9% | 90.7% | 91.0% | 90.9% | 90.7% |
| 2017/18 | • | 109540 | 90.7% | 90.5% | 90.8% | 90.4% | 90.5% |
| 2018/19 | • | 109948 | 90.4% | 90.2% | 90.5% | 89.9% | 90.0% |
| 2019/20 | • | 110501 | 90.1% | 90.0% | 90.3% | 89.5% | 89.5% |
| 2020/21 | • | 107601 | 87.3% | 87.1% | 87.4% | 86.6% | 86.5% |
| 2021/22 | • | 107053 | 86.2% | 86.0% | 86.4% | 86.0% | 85.0% |
| 2022/23 | • | 107579 | 86.6% | 86.4% | 86.8% | 87.2% | 86.0% |
| 2023/24 | • | 109215 | 87.5% | 87.3% | 87.7% | 87.8% | 86.8% |
| 2024/25 | • | 110213 | 87.9% | 87.7% | 88.1% | 88.3% | 87.3% |
Source: NHS England
Peripheral Arterial Disease
In 2024/25, there were 2,329 patients registered with Hull GPs (03F) who were diagnosed with peripheral arterial disease (PAD) representing 0.7% of the patient population in Hull which is slightly higher than for England (0.6%).
Compared with benchmark
| Indicator | Period | England | NHS Humber and North Yorkshire Integrated Care Board - QOQ | Humber and North Yorkshire ICB - 02Y | Humber and North Yorkshire ICB - 03F | Humber and North Yorkshire ICB - 03H | Humber and North Yorkshire ICB - 03K | Humber and North Yorkshire ICB - 03Q | Humber and North Yorkshire ICB - 42D |
|---|---|---|---|---|---|---|---|---|---|
PAD: QOF prevalence (Persons All ages) | 2024/25 | 0.6 | 0.8 | 0.9 | 0.7 | 1.0 | 0.6 | 0.6 | 0.8 |
The prevalence of PAD has increased slightly in Hull from 0.6% to 0.8% between 2017/18 and 2020/21, but decreased between 2020/21 and 2021/22, with the numbers remaining at a similar level for 2024/25, with a prevalence of 0.7%. Since 2017/18, the prevalence in Hull has been consistently higher than for England.
Compared with benchmark
PAD: QOF prevalence (Persons All ages)
|
Period
|
Humber and North Yorkshire ICB - 03F |
NHS Humber and North Yorkshire Integrated Care Board - QOQ
|
England
|
||||
|---|---|---|---|---|---|---|---|
|
Count
|
Value
|
95%
Lower CI |
95%
Upper CI |
||||
| 2015/16 | • | 1723 | 0.6% | 0.6% | 0.6% | 0.7% | 0.6% |
| 2016/17 | • | 1790 | 0.6% | 0.6% | 0.6% | 0.7% | 0.6% |
| 2017/18 | • | 1768 | 0.6% | 0.6% | 0.6% | 0.7% | 0.6% |
| 2018/19 | • | 2245 | 0.7% | 0.7% | 0.8% | 0.8% | 0.6% |
| 2019/20 | • | 2294 | 0.8% | 0.7% | 0.8% | 0.8% | 0.6% |
| 2020/21 | • | 2302 | 0.8% | 0.7% | 0.8% | 0.8% | 0.6% |
| 2021/22 | • | 2296 | 0.7% | 0.7% | 0.8% | 0.8% | 0.6% |
| 2022/23 | • | 2302 | 0.7% | 0.7% | 0.8% | 0.8% | 0.6% |
| 2023/24 | • | 2320 | 0.7% | 0.7% | 0.8% | 0.8% | 0.6% |
| 2024/25 | • | 2329 | 0.7% | 0.7% | 0.8% | 0.8% | 0.6% |
Source: NHS England
From the local analysis, there was a statistically significant association between average age of the practice patients and the prevalence of diagnosed PAD across the 25 practices in Hull for 2024/25. The prevalence was 0.5% among practices serving the youngest patients compared to 0.9% among practices serving the oldest patients. For every increase in the average age of the patients of 10 years, the prevalence of PAD increased by 0.4 percentage points. Further analysis of diagnosed disease by the average age of practice patients is within the file above and within Local Analysis of Quality and Outcomes Framework Data.
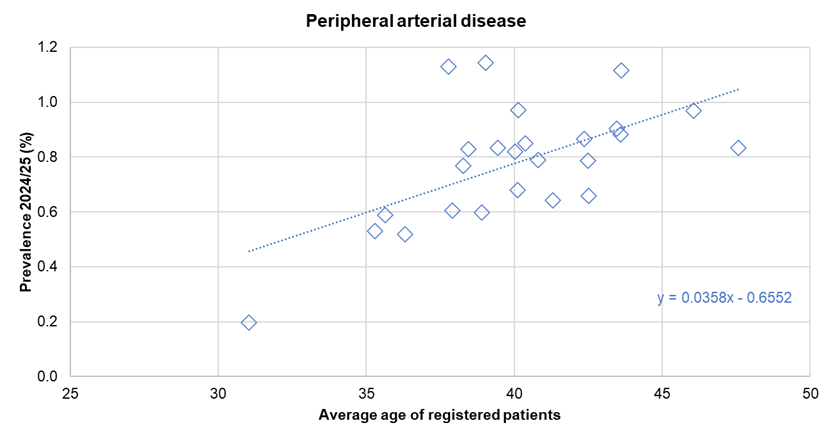
There was no statistically significant association between the prevalence of diagnosed PAD and the average deprivation score of registered patients across the 25 practices.
Strategic Need and Service Provision
All Cardiovascular Disease
It is necessary to work together to ensure people understand the benefit of positive life choices and know how to access information and seek early support to change.
People aged 40-79 years who are eligible for the NHS Health Check should be encouraged to attend, and those who have already been diagnosed with a cardiovascular disease should attend their annual reviews so that they get the best on-going treatment for their condition in order to minimise the likelihood of a further cardiovascular event.
The local NHS Hull Clinical Commissioning Group’s Cardiovascular Disease Outcomes Strategy details local on-going programmes and work areas to reduce CVD and its effects in relation to integrated care, prevention and risk management, improving acute care, improving and enhancing case finding in primary care, better identification of very high risk families and individuals, and better early management and secondary prevention in the community.
The Yorkshire and Humber Familial Hypercholesterolaemia Service was launched in 2017 which identifies people with familial hypercholesterolaemia and then offering cascade testing of relatives of the index case to identify other family members affected. Once identified, with familial hypercholesterolaemia statin treatment, the risk of having a cardiac event can be reduced to the level of risk in the general population.
Practices should be supported in terms of case finding with regard to cardiovascular diseases. Where a patient has one cardiovascular condition, clinicians should proactively seek to assess the risk and diagnose other cardiovascular conditions with a standard cardiovascular assessment undertaken to examine the existence of and/or risk of hypertension, familial hypercholesterolaemia, coronary heart disease, stroke, peripheral arterial disease, type 2 diabetes, and kidney disease.
Coronary Heart Disease
People need to know that stopping smoking has immediate health benefits, with heart rate and blood pressure dropping within 20 minutes, excess risk of coronary heart disease reducing to half that of a continuing smoker’s after one year, and risk of coronary heart disease reducing to that of a non-smoker’s after 15 years.
Cardiac rehabilitation is a structured set of services that enables people with CHD to have the best possible help (physical, psychological and social) to preserve or resume their optimal functioning in society. Cardiac rehabilitation also supports patients’ return to work, improves their functional capacity and physical activity status, perceived quality of life and supports the development of self-management skills. It is proven to be cost effective, with a lower cost per QALY (Quality Adjusted Life Years), compared with all other cardiology treatments. The benefits of a menu driven approach, with a choice of setting and individually identified patient goals are increasingly recognised. This service should be available to all, and all people who would benefit should be encouraged to participate in a cardiac rehabilitation programme.
Stroke
Work should continue to ensure that people realise that stroke is a medical emergency, and people with symptoms of a stroke or a transient ischaemic attack seek medical help immediately.
There is a need to work with partners to ensure that services are integrated, high quality and accessible in ways that offer people appropriate choices. Also working with partners to promote self-care, reablement or mutual support in community settings so this is viewed as the norm and reduce reliance on residential or home care.
The intention is to reduce mortality and levels of dependency following an acute stroke, reduce length of stay of stroke patients in bed-based services, reduce re-admission rates, facilitate earlier hospital discharge home to usual place of residence with the necessary support or into stroke community rehabilitation units, to increase numbers of patients supported to maximise their ability and independence in their own home, improve stroke survivor experience, improve detection and management of psychological issues in stroke survivors and ensure routine use of assessment tools to systematically assess patients at six months. National clinical guidelines for stroke are available which detail how to achieve these outcomes.
Heart Failure
Testing for Brain Natriuretic Peptide (BNP and NT Pro-BNP) can act as a cost effective pre-screening tool to ensure only those patients deemed at higher risk of heart failure are referred on for specialist assessment with echocardiography. Practices have access to BNP testing for patients with suspected heart failure, and across the region could help save over £200,000 and means valuable resources are used effectively.
A diuretic is a medicine which increases the amount of water that passes out of the kidneys. Whilst they are often used to treat heart failure, they are also used to treat other conditions such as certain liver and kidney disorders, and sometimes hypertension. Patients without heart failure who are taking loop diuretics (one type of diuretics) should be assessed to ensure they do not have heart failure through BNP testing.
Patients with heart failure require specialist heart failure assessment followed by systematic care with medication and rehabilitation once their condition is stable. Hull CCG commissions a tele-health service which include tele-monitoring provision for patients with heart failure. Rehabilitation should include education, lifestyle advice, physical activity and self-management advice. Cardiac rehabilitation should be available to all people with heart failure who would benefit, and people who would benefit should be encouraged to participate.
Furthermore, as the prognosis of heart failure is poor, appropriate palliative care and end of life care should be provided where necessary.
Atrial Fibrillation
Opportunities should be taken to identify people with undiagnosed atrial fibrillation through pulse checking and/or use of blood pressure monitors which can detect irregular pulse.
Appropriate treatment should be given, for example, anti-coagulation, for patients newly diagnosed with atrial fibrillation to reduce the likelihood of having a stroke.
Hypertension
Opportunistic approaches should be taken to detect those with undiagnosed hypertension including the use of 24 hour blood pressure monitoring devices.
There is a need to increase the number of patients achieving blood pressure targets. Achieving blood pressure targets for patients, particularly those with diabetes and hypertension, shows that serious events such as fatal and non-fatal strokes are significantly reduced. This further reduces unplanned hospital admissions, reducing NHS costs. Patients who are not achieving the nationally recognised blood pressure target should be referred to the correct healthcare professional for review and treatment.
Resources
The Office for Health Improvement & Disparities’ Fingertips: https://fingertips.phe.org.uk/
NHS Digital. Quality and Outcomes Framework. https://qof.digital.nhs.uk/
Projecting Adult Needs and Service Information (PANSI). www.pansi.org.uk
Projecting Older People Population Information (POPPI). www.poppi.org.uk
Department of Health, Cardiovascular disease outcomes strategy. Improving outcomes for people with or at risk of cardiovascular disease. 2013, Department of Health: London.
National Institute for Health and Care Excellence, Clinical Guidance 71. Identification and management of familial hypercholesterolaemia. www.nice.org.uk. 2008, National Institute for Health and Care Excellence: London.
NHS. Coronary heart disease. www.nhs.uk. 2014, NHS Choices: London.
Newton, J.N., et al., Changes in health in England, with analysis by English regions and areas of deprivation, 1990-2013: a systematic analysis for the Global Burden of Disease Study 2013. The Lancet, 2015. 386(10010): p. 2257-2274.
NHS. Stroke. www.nhs.uk. 2013, NHS Choices: London.
NHS. Transient ischaemic attack (TIA). www.nhs.uk. 2014, NHS Choices: London.
Medline Plus, Stroke. US National Library of Medicine National Institutes of Health: Bethesda, USA, 2014
Department of Health, National Stroke Strategy. www.dh.gov.uk. 2007, Department of Health: London.
O’Donnell, M.J., et al., Risk factors for ischaemic and intracerebral haemorrhagic stoke in 22 countries (the INTERSTROKE study): a case-control study. Lancet, 2010. 376(9735): p. 112-123.
National Institute for Health and Care Excellence, Clinical guideline 108: Chronic heart failure. Management of chronic heart failure in adults in primary and secondary care. www.nice.org.uk. 2010, National Institute for Health and Care Excellence: London.
NHS. Atrial fibrillation. www.nhs.uk. 2013, NHS Choices: London.
National Institute for Health and Care Excellence, Clinical Guideline 180 Atrial fibrillation: the management of atrial fibrillation. www.nice.org.uk. 2014, National Institute for Health and Care Excellence: London.
Doncaster Primary Care Trust, User Guides for QOF Benchmarking Tool, 2008.
Office for National Statistics, Prescribing of specific types of drugs for patients with atrial fibrillation by age, sex and calendar year: 1994-98. www.ons.gov.uk. 2005, Office for National Statistics: London.
NHS. High blood pressure (hypertension). www.nhs.uk. 2014, NHS Choices: London.
National Institute for Health and Care Excellence, Clinical guideline 127: Hypertension. Clinical management of primary hypertension in adults. www.nice.org.uk. 2011, National Institute for Health and Care Excellence: London.
NHS. Peripheral arterial disease (PAD). www.nhs.uk. 2014, NHS Choices: London.
Fowkes, F.G.R., et al., Comparison of global estimates of prevalence and risk factors for peripheral artery disease in 2000 and 2010: a systematic review and analysis. Lancet, 2013. 382: p. 1329-1340.
Stoffers, H.E.J.H., et al., The prevalence of asymptomatic and unrecognized peripheral arterial occulsive disease. International Journal of Epidemiology, 1996. 25: p. 282-290.
Hirsch, A.T., et al., Peripheral arterial disease detection, awareness, and treatment in primary care. JAMA, 2001. 286: p. 1317-1324.
McDermott, M.M., et al., Asymtomatic peripheral arterial disease is independently associated with impaired lower extremity functioning: the women’s health and aging study. Circulation, 2000. 101: p. 1007-1012.
Pande, R.L., et al., Secondary prevention and mortality in peripheral artery disease: National Health and Nutrition Examination Study, 1999 to 2004. Circulation, 2011. 124: p. 17-23.
Smith, G.D., M.J. Shipley, and G. Rose, Intermittent claudication, heart disease risk factors, and mortality. The Whitehall Study. Circulation, 1990. 82: p. 1925-1931.
Fowkes, F.G., et al., Ankle brachial index combined with Framingham Risk Score to predict cardiovascular events and mortality: a meta-analysis. JAMA, 2008. 300: p. 197-208.
American Cancer Society, When smokers quit what are the benefits over time? www.cancer.org. 2014, American Cancer Society: Atlanta.
National Institute for Health and Care Excellence, Cardiac rehabilitation services. Guide for commissioners. 2013, National Institute for Health and Care Excellence: London.
Surgeon General of the US Public Health Service, How tobacco smoke causes disease, 2010.
International Agency for Research on Cancer, IARC Handbooks of Cancer Prevention: Tobacco control: reversal of risk after quitting smoking. www.iarc.fr/ 2007, World Health Organisation: Lyon.
The National Collaborating Centre for Chronic Conditions on behalf of National Institute for Health and Care Excellence, Clinical guideline 68: Stroke. National clinical guidelines for diagnosis and initial management of acute stroke and transient ischaemic attack. www.nice.org.uk. 2008, Royal College of Physicians: London.
Royal College of Physicians, National clinical guidelines for stroke. Prepared by the Intercollegiate Stroke Working Party. Fourth edition. www.rcplondon.ac.uk. 2012, Royal College of Physicians: London.
NHS Yorkshire and the Humber. Delivering Healthy Ambitions Better for Less. Heart failure, 2015.
Updates
This page was last updated / checked on 1 June 2026.
This page is due to be updated / checked in December 2026.