Index
This topic area covers statistics and information relating to alcohol consumption among young people in Hull including local strategic need and service provision. Further information relating to Alcohol Consumption Among Adults is given under Lifestyle Factors within Adults. Alcohol consumption information has been collected within Hull’s Health and Wellbeing Surveys and full reports are available under Surveys within Tools and Resources.
This page contains information from the Office for Health Improvement & Disparities’ Fingertips. Information is taken ‘live’ from the site so uses the latest available data from Fingertips and displays it on this page. As a result, some comments on this page may relate to an earlier period of time until this page is next updated (see review dates at the end of this page).
The Office for National Statistics ‘back-date’ their recent estimates of the resident population once more accurate Census data becomes available. Their revised estimates were released for each local authority on the 23 November 2023. The Office for Health Improvement & Disparities updated the majority of their indicators that relied on population estimates in February, but not all indicators were updated including those relating to alcohol-specific admissions among under 18s. This means that the trend data is currently missing from Fingertips until this indicator has been updated for the the back-revised populations.
Headlines
- As well as alcoholic liver disease, alcohol consumption is a causal factor in 60 types of diseases and injuries, with a component cause in 200 others. The cost to society was estimated to be £21 billion in 2013/14. As well as individual health risks, excessive alcohol consumption has significant effects on family, the community and the economy. Around 40% of all violent crimes are alcohol-related.
- Whilst more young people and adults are never drinking alcohol, and the majority of those who are drinking are drinking less alcohol, there are harmful levels of alcohol consumption across Hull resulting in high levels of health-related harm and hospital admissions.
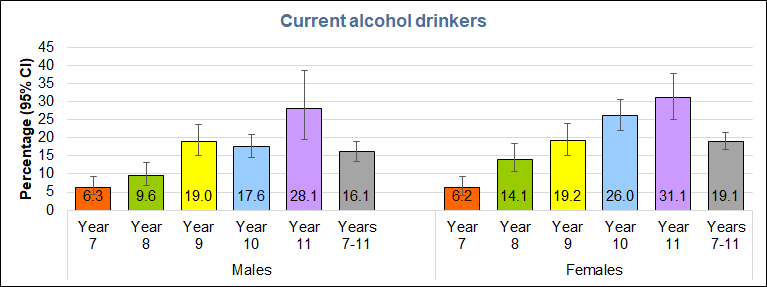
- In 2024, almost one in six boys and almost one in five girls reported that they regularly or sometimes drank alcohol, including 28% of boys and 31% of girls in year 11.
- Similar percentages of pupils in 2024 reported that they found it easy to get alcohol.
- In 2016, the percentage of Year 11 (aged 15-16 years) pupils drinking alcohol at least once a week was 11% for boys and 8.5% for girls, having fallen from 36% for boys and 22% of girls since 2008-09.
- In 2016, very few younger pupils exceeded the maximum recommended weekly alcohol limits for adults (14 units), but 7.7% of boys and 5.0% of girls did so in Year 11, but this was a fall from 2008-09 when 26% of boys and 10% of girls had exceeded 14 units the previous week.
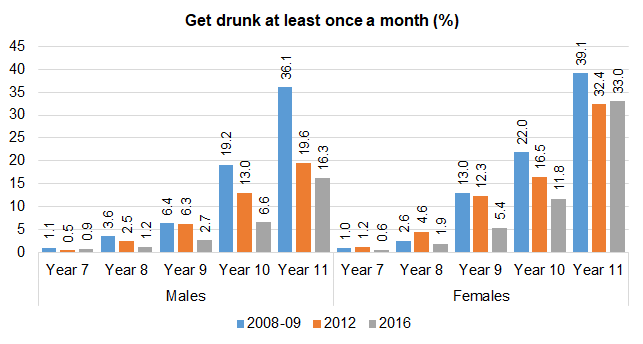
- In 2008-09, over one-third of boys and almost four in ten girls in Year 11 reported they got drunk at least once a month, but this fell to 16% of boys and 33% of girls in 2016.
- Whilst admissions from alcohol-specific conditions among under 18s was twice as high in Hull compared to England for the three year period 2016/17-2018/19 and 2017/18-2019/20, the rates have reduced sharply in Hull. The admission rates are comparable in Hull as England for 2021/22-2023/24 with 33 admissions in total over the three years (15 males and 18 females). In contrast with adults, admission rates are higher among females in Hull compared to males among those aged under 18 years (although this is not unique and is the case regionally and nationally for the majority of local authorities).
The Population Affected – Why Is It Important?
Alcohol consumption is the world’s third largest risk factor for disease and disability. Alcohol is a causal factor in 60 types of diseases and injuries, and a component cause in 200 others. Liver problems, reduced fertility, high blood pressure, increased risk of various cancers and heart attack are some of the numerous harmful effects of regularly drinking more than the recommended levels. Excessive alcohol consumption can also lead to fatigue, depression, weight gain, poor sleep and sexual problems.
Modelled estimates suggest that over one million admissions attributable to alcohol occurred in England during 2012/13. In 2013/14, the total annual cost to society of alcohol-related harm was estimated to be £21 billion (£3.5 billion for NHS). There are also significant effects on families and communities, with an increased risk of vandalism, violent crime, domestic abuse, road casualties and sickness absence from work. It is estimated that around 40% of all violent crimes are alcohol-related.
The Hull Picture
Much of the information in this section comes from the local Health and Wellbeing Surveys. A number of Health and Wellbeing Surveys have been completed with young people in Hull through secondary schools since 2002 which provide valuable information on the health, wellbeing and lifestyle behaviours of the young people in Hull. The latest survey was conducted between March and May 2024, and involved almost 4,000 secondary school pupils mainly from eight of Hull’s 13 mainstream secondary schools. Further details are available on Local Surveys Involving Young People under Tools and Resources).
Health and Wellbeing Survey 2024
From the local Health and Wellbeing Survey 2024, 18% of pupils overall reported that they regularly or sometimes drink alcohol, with percentages slightly higher among girls than boys. Percentages by year rose from 6% among pupils in year 7 to 28% among year 11 boys and 31% among year 11 girls.
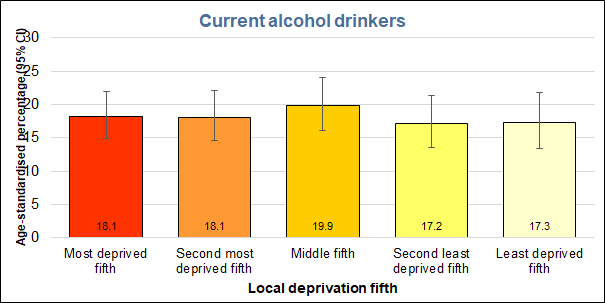
There were only small differences in the percentages of pupils drinking alcohol between the deprivation fifths (defined locally using the 2019 Index of Multiple Deprivation).
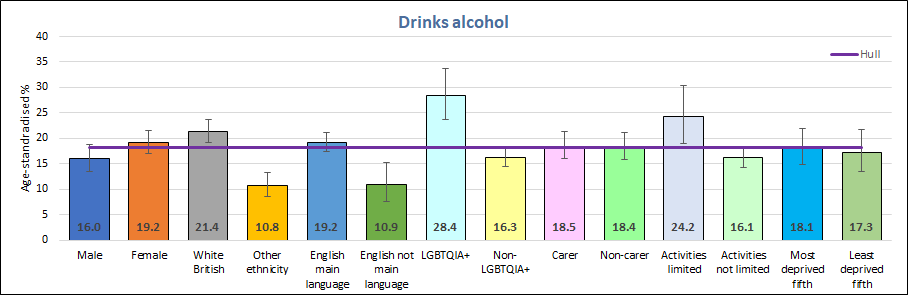
There was, however, considerable variation in the percentages of pupils drinking alcohol by subgroup. Pupils identifying as LGBTQ+ were the most likely to drink alcohol (28%), followed by pupils whose daily activities were affected by long-term illness or disability (24%) and White British pupils (21%), each of which subgroup had a statistically significantly higher percentage of alcohol drinkers that the average for Hull. Three subgroups had significantly lower percentages drinking alcohol, pupils from ethnic minority backgrounds (11%), pupils whose main language was not English (11%) and pupils whose daily activities are not affected by long-term illness or disability.
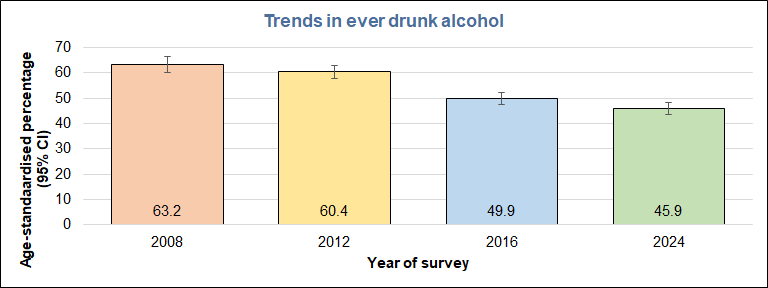
Because of a change in the style of questions asked in 2024, it is not possible to look at trends in the percentage of pupils that drink alcohol. However, it is possible to look at trends in those who report having never drunk alcohol. This shows a small reduction in the [percentage reporting never drinking alcohol in the 2024 survey compared with the 2016 survey, which itself saw a significant decrease compared with earlier surveys.
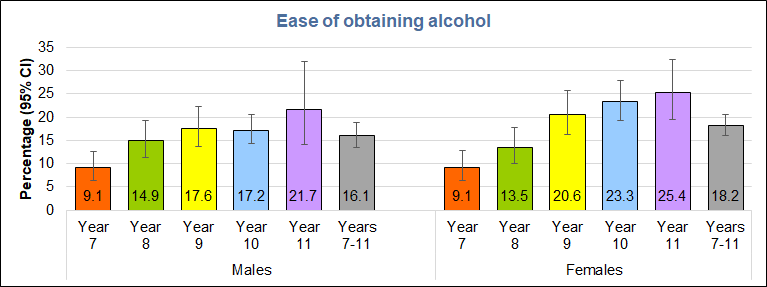
Pupils were also asked in 2024 how easy they found it to get alcohol (the first time this question has been asked in local surveys). Overall, 18% of pupils found it easy to get alcohol, lightly higher among girls than boys. The percentage reporting it was easy rose from 9% among pupils in year 7 to 22% of boys in year 11 and 25% of girls in year 11.
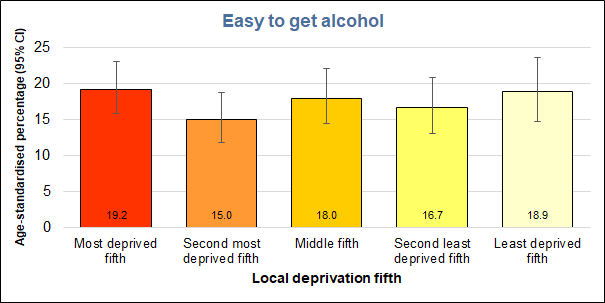
While there were differences between pupils living in areas within different deprivation fifths, these differences were not consistent, with pupils inn the most deprived and least deprived fifths of areas having similar percentages reporting it was easy to get alcohol.
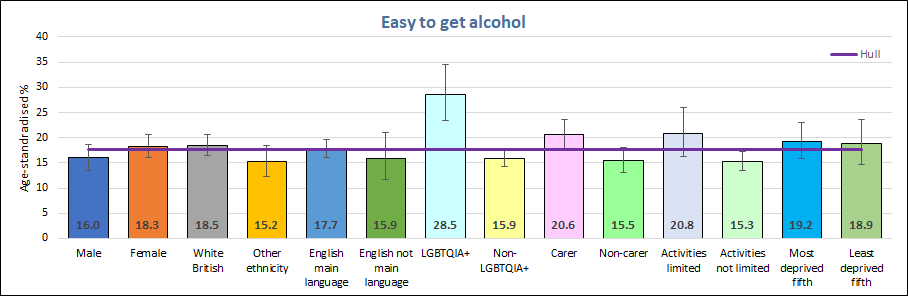
There were greater differences between subgroups in the percentage that found it easy to get alcohol, but only one subgroup had a significantly higher percentage than the Hull average, those identifying as LGBTQ+, amongst whom almost three in ten (29%) found it easy to get alcohol. At the other end of the spectrum pupils whose daily activities were not affected by long-term illness or disability were the only subgroup with a significantly lower percentage finding it easy to get alcohol (15%).
Earlier Health and Wellbeing Surveys
The following analyses are for data that was not collected in the 2024 survey, but may still be of some interest.
From the local Young People Health and Lifestyle Survey 2016, 17% of Year 7 pupils (aged 11-12 years) had ever had a whole alcoholic drink but this increased to 83% among Year 11 pupils (aged 15-16 years). Children in Hull were more likely to have had a whole alcoholic drink compared to England (46% in Hull and 38% in England across all ages). In 2008-09 and 2012, over 60% of pupils in Hull had had a whole alcoholic drink but this fell to 50% in 2016.
Over time, the percentage of children drinking alcohol at least once a week has at least halved over time with some of the greatest differences in the older ages (36% of boys and 22% of girls in Year 11 reported weekly drinking in 2008-09 but this fell to 11% of boys and 8.5% of girls in 2016). Whilst the percentages drinking alcohol weekly were small among pupils aged 11-14 years they were slightly higher than England, but pupils aged 15 years were less likely to drink alcohol weekly in Hull (6.4% versus 10% in boys and 5.5% versus 10% in girls).
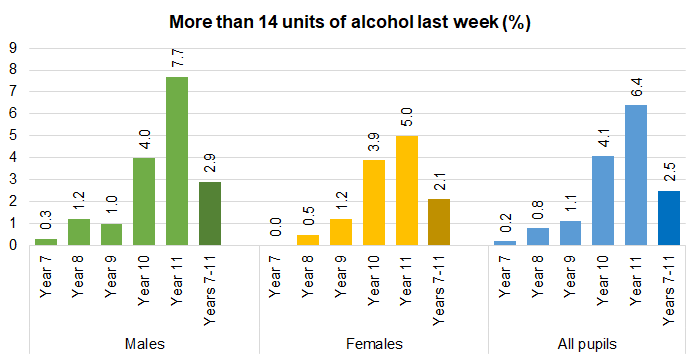
Very few younger pupils exceeded the maximum recommended alcohol limits for adults (14 units), but 7.7% of boys and 5.0% of girls did so in Year 11. This was a considerable reduction over time though across all school years. Among Year 11 pupils, in 2008-09, 26% of boys and 10% of girls had exceeded 14 units the previous week, and in 2012, 11% of boys and 7.4% of girls had done so. Across all school years, there was a clear trend in the percentage exceeding 14 units the previous week by deprivation among boys (4.2% in most deprived fifth compared to 1.5% in least deprived fifth of areas of Hull), although there was less of an association among girls with the highest prevalence for the least deprived fifth of areas of Hull (between 1.5% to 1.7% for most deprived four-fifths of areas compared to 2.3% for least deprived fifth of areas of Hull).
In 2008-09, over one-third of boys and almost four in ten girls in Year 11 reported that they got drunk at least once a month, but this fell to 16% of boys and 33% of girls in 2016.
The Office for Health Improvement & Disparities’ Fingertips provide information on a number of indicators relating to alcohol. This includes the number of hospital admissions among under 18s which are wholly or specifically due to alcohol such as alcohol poisoning, and the number is given as a rate per 100,000 population (the rates are not age-standardised).
A full list of diseases and conditions which are included in the alcohol-specific / wholly attributable to alcohol measure is given under Alcohol Specific Admissions and Deaths.
The admission rate for alcohol-specific conditions among the under 18s in Hull for the three year period 2021/22 to 2023/24 is comparable to England for males and females combined with no statistically significant difference between Hull and England.
For adults, the admission rates for alcohol-specific conditions are significantly higher for men compared to women generally around twice as high among men. However, the pattern is the reverse for under 18s with more women admitted to hospital for alcohol-specific conditions. This is not unique to Hull as the admission rates are higher among women compared to men for local authorities across the region with the exception of York and Bradford for 2021/22-2023/24, although for Hull the difference in the admission rates for men and women is small compared to some local authorities within the region.
Compared with benchmark
| Indicator | Period | England | Yorkshire and the Humber region (statistical) | Kingston upon Hull | East Riding of Yorkshire | North East Lincolnshire | North Lincolnshire | York | North Yorkshire UA | Barnsley | Doncaster | Rotherham | Sheffield | Bradford | Calderdale | Kirklees | Leeds | Wakefield |
|---|---|---|---|---|---|---|---|---|---|---|---|---|---|---|---|---|---|---|
Admission episodes for alcohol-specific conditions (under 18 years) (Persons <18 yrs) | 2021/22 - 23/24 | 22.6 | 19.0 | 18.3 | 14.6 | 27.2 | 14.6 | 29.9 | 25.7 | 32.9 | 14.8 | 17.5 | 25.6 | 15.4 | 23.7 | 11.5 | 12.2 | 21.0 |
Admission episodes for alcohol-specific conditions (under 18 years) (Male <18 yrs) | 2021/22 - 23/24 | 15.4 | 14.6 | 16.3 | 13.5 | 23.5 | - | 37.8 | 19.8 | 16.7 | - | 13.7 | 16.7 | 15.9 | 14.5 | 7.9 | 7.5 | 17.4 |
Admission episodes for alcohol-specific conditions (under 18 years) (Female <18 yrs) | 2021/22 - 23/24 | 30.0 | 23.5 | 20.5 | 15.7 | 31.0 | - | 21.6 | 31.9 | 49.9 | 22.1 | 21.5 | 34.9 | 14.9 | 33.4 | 15.3 | 17.1 | 24.8 |
For males and females combined, the alcohol-specific admission rate among under 18s was particularly high for 2016/17-2018/19 with 60.6 admissions per 100,000 population, but since then the rate has decreased sharply to a new low of 18.3 admissions per 100,000 population for 2021/22-2023/24.
Over the three year period, there were 33 alcohol-specific admissions in Hull so an average of 11 per year.
Compared with benchmark
Admission episodes for alcohol-specific conditions (under 18 years) (Persons <18 yrs)
|
Period
|
Kingston upon Hull |
Yorkshire and the Humber region (statistical)
|
England
|
||||
|---|---|---|---|---|---|---|---|
|
Count
|
Value
|
95%
Lower CI |
95%
Upper CI |
||||
| 2012/13 - 14/15 | • | 75 | 44.9 | 35.3 | 56.3 | 37.2 | 39.2 |
| 2013/14 - 15/16 | • | 60 | 35.6 | 26.2 | 44.5 | 35.9 | 37.6 |
| 2014/15 - 16/17 | • | 65 | 38.3 | 29.0 | 48.1 | 33.5 | 34.4 |
| 2015/16 - 17/18 | • | 80 | 46.7 | 36.5 | 57.4 | 33.7 | 33.2 |
| 2016/17 - 18/19 | • | 105 | 60.6 | 49.1 | 72.7 | 32.6 | 32.0 |
| 2017/18 - 19/20 | • | 100 | 57.2 | 45.5 | 68.3 | 30.6 | 31.2 |
| 2018/19 - 20/21 | • | 70 | 39.7 | 32.0 | 51.5 | 27.7 | 29.9 |
| 2019/20 - 21/22 | • | 50 | 28.2 | 21.0 | 37.2 | 23.8 | 28.8 |
| 2020/21 - 22/23 | • | 34 | 19.1 | 13.2 | 26.7 | 21.5 | 26.1 |
| 2021/22 - 23/24 | • | 33 | 18.3 | 12.6 | 25.7 | 19.0 | 22.6 |
Source: OHID, based on NHS England and Office for National Statistics data
Over the three year period 2021/22-2023/24, there were 15 admissions among males aged under 18 years in Hull for alcohol-specific conditions so on average five per year.
Compared with benchmark
Admission episodes for alcohol-specific conditions (under 18 years) (Male <18 yrs)
|
Period
|
Kingston upon Hull |
Yorkshire and the Humber region (statistical)
|
England
|
||||
|---|---|---|---|---|---|---|---|
|
Count
|
Value
|
95%
Lower CI |
95%
Upper CI |
||||
| 2012/13 - 14/15 | • | 40 | 46.5 | 31.2 | 60.6 | 33.7 | 30.6 |
| 2013/14 - 15/16 | • | 30 | 34.6 | 24.3 | 50.7 | 31.0 | 29.5 |
| 2014/15 - 16/17 | • | 35 | 40.0 | 26.9 | 54.2 | 29.2 | 27.6 |
| 2015/16 - 17/18 | • | 45 | 50.9 | 38.1 | 69.4 | 28.5 | 26.7 |
| 2016/17 - 18/19 | • | 60 | 67.2 | 50.3 | 85.2 | 28.1 | 26.2 |
| 2017/18 - 19/20 | • | 60 | 66.6 | 52.8 | 88.3 | 26.6 | 25.3 |
| 2018/19 - 20/21 | • | 45 | 49.7 | 34.4 | 64.0 | 23.8 | 23.3 |
| 2019/20 - 21/22 | • | 30 | 33.0 | 22.3 | 47.1 | 19.3 | 20.7 |
| 2020/21 - 22/23 | • | 17 | 18.6 | 10.8 | 29.8 | 16.2 | 17.8 |
| 2021/22 - 23/24 | • | 15 | 16.3 | 9.1 | 26.9 | 14.6 | 15.4 |
Source: OHID, based on NHS England and Office for National Statistics data
For females aged under 18 years over the three year period 2021/22-2023/24, there were 18 alcohol-specific admissions in Hull so on average six per year.
Compared with benchmark
Admission episodes for alcohol-specific conditions (under 18 years) (Female <18 yrs)
|
Period
|
Kingston upon Hull |
Yorkshire and the Humber region (statistical)
|
England
|
||||
|---|---|---|---|---|---|---|---|
|
Count
|
Value
|
95%
Lower CI |
95%
Upper CI |
||||
| 2012/13 - 14/15 | • | 35 | 43.3 | 32.2 | 63.0 | 40.8 | 48.2 |
| 2013/14 - 15/16 | • | 25 | 30.6 | 21.8 | 48.1 | 41.1 | 46.0 |
| 2014/15 - 16/17 | • | 30 | 36.5 | 24.6 | 52.0 | 38.3 | 41.6 |
| 2015/16 - 17/18 | • | 35 | 42.1 | 27.4 | 55.8 | 39.1 | 40.0 |
| 2016/17 - 18/19 | • | 45 | 53.6 | 39.1 | 71.7 | 37.0 | 38.0 |
| 2017/18 - 19/20 | • | 35 | 41.3 | 29.7 | 58.8 | 34.8 | 37.3 |
| 2018/19 - 20/21 | • | 30 | 35.0 | 22.7 | 48.6 | 31.8 | 36.9 |
| 2019/20 - 21/22 | • | 20 | 23.2 | 14.2 | 35.9 | 28.9 | 37.2 |
| 2020/21 - 22/23 | • | 17 | 19.6 | 11.4 | 31.4 | 27.0 | 34.7 |
| 2021/22 - 23/24 | • | 18 | 20.5 | 12.1 | 32.4 | 23.5 | 30.0 |
Source: OHID, based on NHS England and Office for National Statistics data
Strategic Need and Service Provision
Hull’s Alcohol and Drugs Partnership Strategy 2022-25 provides key priorities and recommendations for preventing alcohol related harm. The Strategy has six priorities:
- Developing a Prevention and Early Intervention approach across the partnership;
- Implement a more targeted approach to support at-risk groups;
- Improving services to effectively support young people and adults with co-existing mental illness and substance use, and/or with multiple and complex needs;
- Tackling alcohol/drug related stigma to ensure people have equitable access to services and resources.;
- Developing community assets to achieve and sustain recovery; and
- Reducing the risks associated with alcohol/drug use by utilising a harm reduction approach.
It is necessary that public health, health providers, schools and those working with young people and families, community workers, and communities work together to maximise opportunities to prevent and identify alcohol/drug use among children, young people and families, and offer more wrap-around support to prevent rapid escalation of problems associated with alcohol use.
It is recognised that more work needs to be done around increasing local awareness and understanding of alcohol and drug related harm, managing availability of alcohol, providing age appropriate and accurate information to children and young people, and commissioning universal, targeted and specialist substance treatment services that meet the needs of children and young people, especially of groups at risk.
Further information is available in the Hull Alcohol and Drugs Partnership Strategy.
Social return on investment tools for drugs and alcohol make the case of investing in treatment programs to reduce overall crime and anti-social behaviour to reduce costs to society and the economy. It is estimated that over 4,421 crimes (90% shoplifting) were committed by alcohol treatment clients before their entry to treatment, and with an estimated 39% reduction in the number of crimes, around 1,726 crimes were prevented after treatment. The gross benefit of alcohol treatment in 2017/18 in Hull was estimated to be over £3,280,176.
ReFresh is a young people’s drug and alcohol service providing confidential support for young people up to the age of 18 who live, study or work in Hull. ReFresh can help with family relationships, secure somewhere stable to live, get support with school, college or work, and help young people make positive use of their time. They offer a space for:
- young people to talk with someone to listen to them;
- providing advice and information on reducing consumption of alcohol and substances and using safely;
- providing health checks including sexual health, safer injecting, and testing and treatment for blood borne viruses;
- helping to deal with cravings, controlling tension and reducing anxiety;
- helping with emotional and mental health; and
- helping improve family relationships.
Young people can contact ReFresh through email and phone as well as visiting in person. Parents and carers can also seek advice and support if they are concerned about a young person.
Young people can contact ReFresh through email and phone as well as visiting in person. Parents and carers can also seek advice and support if they are concerned about a young person.
Resources
Local Young People Health and Wellbeing Surveys
The Office for Health Improvement & Disparities’ Fingertips. https://fingertips.phe.org.uk/
Hull City Council. Drug and Alcohol Support. https://www.hull.gov.uk/health-and-wellbeing/public-health/drug-and-alcohol-support
Hull City Council. Hull Alcohol and Drugs Strategy 2022-25. https://www.hull.gov.uk/sites/hull/files/media/Editor%20-%20Public%20health/Hull%20Alcohol%20and%20Drugs%20Strategy%202022-2025.pdf
Hull ReFresh. Hull’s young people drug and alcohol service. https://www.refreshhull.org.uk/
Updates
This page was last updated / checked on 10 March 2026.
This page is due to be updated / checked in March 2027.