Index
This topic area covers statistics and information relating to cancer in Hull including local strategic need and service provision. Further information relating to the national screening programmes to detect breast, cervical and colorectal cancer are given within Screening and the NHS Health Check under Prevention within Adults.
This page contains information from the Office for Health Improvement & Disparities’ Fingertips. Information is taken ‘live’ from the site so uses the latest available data from Fingertips and displays it on this page. As a result, some comments on this page may relate to an earlier period of time until this page is next updated (see review dates at the end of this page).
In July 2022, Clinical Commissioning Groups (CCGs) ceased to exist and were replaced by the Integrated Care System. The sub Integrated Care Board areas which include Hull are within the Humber and North Yorkshire Integrated Care Board. In Fingertips, the sub-ICB area referenced by 03F relates to Hull (see Integrated Care Board for the codes relating to the other local sub-ICB areas). For some indicators on Fingertips and other data given elsewhere, data is still being presented at CCG level (and for Humber, Coast and Vale) and has not yet been updated for sub-ICBs. However, for Hull the geographical area for the CCG and the sub-ICB area (03F) are the same so the information can still be examined and compared to understand the health needs within Hull.
As at the beginning of May 2025, the latest available data for incidence and deaths by cancer site at sub-Integrated Care Board level is for 2018-20. However, this information is due to be updated “in the next couple of months” so it is anticipated that some of the existing data on this page can be updated soon. However, in October 2025, the data is still not available. Information was presented at ward level from Fingertips (for 2015-19 for incidence and for 2016-20 for mortality) but it appears that this data will not be updated, and has been replaced with data at a different geographical level (middle layer super output areas).
Local mortality data is available before national data is published. Because of this, the local analysis of cancer mortality comparing areas within Hull may be for a more recent period than the nationally produced comparisons of cancer mortality.
Headlines
- One in two people will develop some form of cancer during their lifetime.
- The high current and historical prevalence of smoking, and increased levels of poor diet, physical inactivity and obesity result in higher levels of cancer in Hull.
- People in Hull are more likely to present with their cancer in an emergency setting rather than through their GP or through an elective procedure, and a slightly higher percentage of cancers in Hull are diagnosed at a later stage at diagnosis compared to people throughout the rest of England which impacts on survival and mortality rates. Urgent referrals for cancer (two week wait) are lower in Hull compared to England particularly when considered in relation to the incidence rate of some cancers for Hull.
- In Hull, during the three year period 2020-22, there were 2,297 new cases of cancer were diagnosed among males and 2,228 new cases of cancer diagnosed among females. Among men, prostate cancer accounted for the highest percentage of new cancer diagnoses (463) followed by lung cancer (451) and colorectal cancer (275). Among women, the highest percentage of new cancer diagnoses were for breast cancer (543) followed by lung cancer (440) and colorectal cancer (210). The incidence rate of new cases of cancer in Hull is significantly higher than England particularly so for cancers of the lung (80% higher than England), stomach (52% higher than England), oesophagus (37% higher than England) and pancreas (29% higher than England). Overall, the cancer incidence in Hull was 10% higher than England for 2020-22.
- Ten of 33 neighbourhoods in Hull had cancer incidence rates statistically significantly higher than England: three in West Central (Gipsyville, Hull City centre and Sculcoates), one in North West (Bricknell), three in North East (Bransholme Central, North Bransholme and Sutton), one in East Central (Southcoates & Victoria Dock) and two in East (Greatfield and Southcoates East).
- 23 of the 33 neighbourhoods in Hull had statistically significantly higher incidence rates for lung cancer than England, with the cancer incidence rate more than twice as high compared with England for 12 neighbourhoods, The rate of new lung cancer cases was more than twice as high as England for 12 neighbourhoods; four in West Central (Boulevard & St Andrew’s Quay, Gipsyville, Newington and Sculcoates), three in North West (Greenwood, Newland South and Orchard Park), two in North East (Bransholme Central and North Bransholme), one in East Central (Drypool & Victoria Dock) and two in East (Greatfield and Southcoates East).
- Only four neighbourhoods in Hull had a statistically significantly higher rate of new colorectal cancers, Ings, Newland South, Sutton South and University & Newland North.
- The incidence rate of new breast cancer cases was lower than England for 19 of the 33 neighbourhoods in Hull, with Southcoates East and Anlaby Park & Pickering neighbourhoods having statistically significantly lower incidence rates of breast cancer compared to England. Only one of Hull’s neighbourhoods had a statistically significantly higher rate of new breast cancer cases compared to England, Gipsyville.
- The incidence rate for prostate cancer was lower than England for the 27 of Hull’s 33 neighbourhoods, and was statistically significantly lower for Greenwood, Boulevard & St Andrew’s Quay and Gipsyville.
- In Hull, between 2001-03 and 2020-22, the rate of new cancers diagnosed has decreased by 3% among men but increased by 15% among women. Over the same period, new cases of lung cancer reduced by 12% for men but increased by 38% for women, and new cases of colorectal cancer have reduced by 19% for men but increased by 12% for women. The rate of new cases of breast cancer has increased slightly among women in Hull by 1%, and the number of new cases of prostate cancer diagnosed has increased by 5% among men between 2001-03 and 2020-22.
- During 2022, just over half (53.1%) of cancers were diagnosed at an early stage compared to 56.8% for England.
- For deaths registered during the three year period 2023-25, the premature (under 75 years) mortality rates were around one-third higher in Hull compared to England for both men (39% higher) and women (29% higher) with a total of 1,021 premature cancer deaths over the three year period (579 men and 442 women).
- Premature mortality rates for cancer have been gradually reducing in Hull in the last 20 years or so with a relatively consistent downward trend (albeit with a slight ‘blip’ during the COVID-19 pandemic).
- For deaths registered during 2022 to 2025, mortality rates were statistically significantly higher than England in all but one of Hull’s 21 wards for mortality at all ages (the exception being Bricknell). For cancer deaths under 75 years, 17 wards had significantly higher cancer mortality rates than England. There was a very strong association with deprivation, with under 75 year cancer mortality 1.9 times higher among people living in the most deprived areas compared to the least deprived areas of Hull (and 2.2 times higher for deaths from cancer considered to be preventable).
- Whilst there is an inequalities gap in relation to premature cancer mortality between Hull and England, the inequalities gap for premature cancer mortality from causes considered to be preventable is greater. Premature cancer mortality rates are 34% higher in Hull for 2022-24 but are 51% higher for premature cancer mortality from causes considered to be preventable.
- In Hull for 2023-25, the highest proportion of cancer deaths were due to lung cancer for both men (25%) and women (28%) followed by breast cancer deaths for women (12%), prostate cancer deaths for men (11%) and colorectal cancer deaths for men (11%) and women (10%).
- Compared to England, mortality in Hull was particularly high for cancers of the lung (83% higher), stomach (75% higher), colorectal (34% higher), pancreas (21% higher) and bladder (20% higher).
- With high historical and current levels of smoking among Hull residents, the mortality rate for lung cancer is particularly high being the second highest for men and the fifth highest for women across England’s 151 upper-tier local authorities for 2022-24.
- Whilst the mortality rate from both lung cancer and colorectal cancer has reduced among Hull men over the last two decades, reductions have been smaller for Hull women. The under 75 mortality rate for breast cancer among women has reduced in Hull over time. The mortality rate for prostate cancer among Hull men was generally lower than England prior to 2015-17, but has increased in Hull and is currently 12% higher than England for 2022-24.
- One year cancer survival is available for cancers diagnosed between 2005-20 with one year follow-up to the end of 2021. Survival rates have increased over the period from 62.9% to 71.3%. It is difficult to directly compare the all-cancers survival rates between Hull and England as the incidence and survival rates differ by cancer site and the percentage of different cancers by site differs between Hull and England.
- Lung cancer survival rates have improved in Hull increasing by 39% from 32.0% for cancers diagnosed in 2005 to 44.5% for cancers diagnosed in 2020, although survival is higher in England for cancers diagnosed in 2020 (48.1%) and the increase in survival over the entire period has been higher in England (increased by 66%).
- One year survival from colorectal cancer has also improved from 72.9% in 2005 to 77.2% in 2020 but has been consistently lower than England over the period with a 3.3 percentage point difference for 2020 (England 80.5%), although the improvement in Hull over the entire period has been higher than the increase for England (increases of 5% and 5% respectively).
- One year survival from breast cancer diagnosed in 2020 is high at 93.5 %, although this represents a small decrease of 1% since 2005. By contrast the breast cancer one-year survival rate saw consistent small increases between 2005 and 2020, giving an increasing inequalities gap.
The Population Affected – Why Is It Important?
All Cancers
Cancer is a condition where cells in a specific part of the body grow and reproduce uncontrollably destroying healthy tissue including organs and can spread to other parts of the body (metastasis). There are over 200 different types of cancer, each with its own methods of diagnosis and treatment. One in two people will develop some form of cancer during their lifetime. In the UK, the four most common types of cancer are: lung cancer; breast cancer; prostate cancer; and bowel cancer. Treatment is often simpler and more likely to be effective when cancer is diagnosed at an early stage, so finding cancer early can make a real difference. There are two major components of early detection of cancer: education to promote early diagnosis and screening. With the ageing population, it is likely that the incidence and prevalence of cancer will increase.
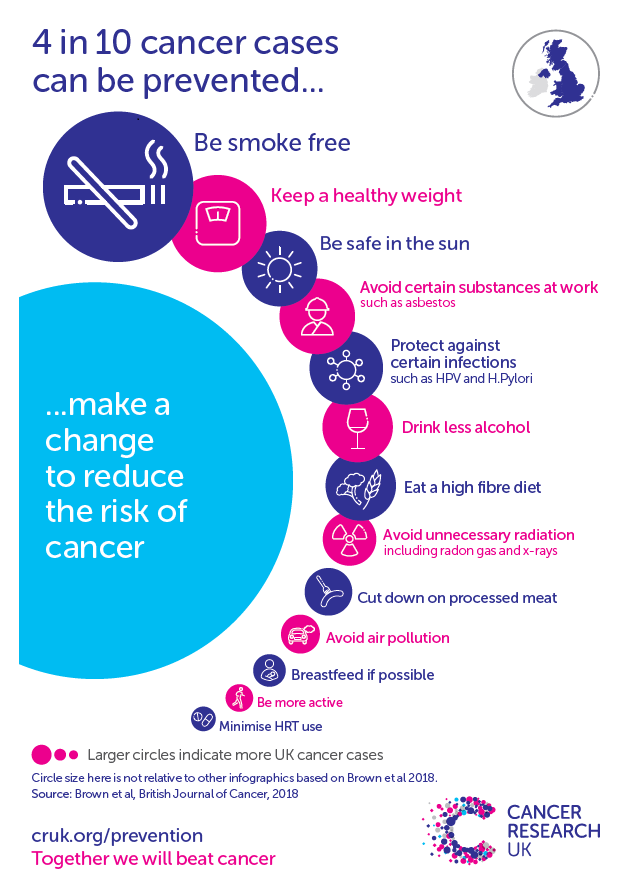
Healthy eating, taking regular exercise, maintaining a healthy weight, and not smoking helps lower the risk of developing cancer. Changing lifestyle behaviours can have a dramatic effect.
Cancer Research UK have an infographic which illustrates the risk of cancer.
Screening programmes are in place for cancers of the breast, cervical and bowel (colorectal). Uptake rates for screening can be found in Screening and the NHS Health Check under Prevention within Adults.
Lung Cancer
The majority of lung cancer cases are preventable as it is estimated that 81% of all cases of lung cancer are directly attributable to smoking, and risk of developing lung cancer reduces over time once a smoker quits smoking.
Nationally, lung cancer has the fifth highest disability adjusted life years and thus has a substantial impact on the quality of people’s lives.
Prostate Cancer
The causes of prostate cancer are largely unknown. Prostate cancer can be slow to develop. So there are many men die with prostate cancer, not because of it. Despite this, there are still considerable numbers that do die from prostate cancer, and it is the most frequent cancer among men.
Breast Cancer
Whilst the causes of breast cancer are not fully understood, it is not possible to know if it can be prevented altogether. However, although not definitive, there are benefits for women who maintain a healthy weight, exercise regularly and who have a low intake of saturated fat and alcohol. Being overweight or obese, particularly after the menopause, causes more oestrogen to be produced which can increase the risk of breast cancer. Family history is also an important risk factor for breast cancer. Screening for breast cancer is the single biggest factor that allows for early diagnosis. Among women, breast cancer is the most frequently occurring cancer.
Colorectal Cancer
There is an increased risk of bowel cancer among those aged 60+ years, who eat a diet high in red or processed meats and low in fibre, who are overweight or obese, physical inactive or smokers, have a high alcohol intake, have a family history of bowel cancer, or have another medical conditions such as severe ulcerative colitis or Crohn’s disease.
The Hull Picture
Screening
Further information relating to the national screening programmes to detect breast, cervical and colorectal cancer are given within Screening and the NHS Health Check within Prevention under Adults.
Incidence
By Cancer Site
From the NHS National Disease Registration Service, the table below gives the total number of new cancers diagnosed over the three year period 2020-22 for Hull by cancer site for men and women separately. The International Classification of Disease version 10 codes has been included for each cancer site for reference. Not all cancer sites are included (most have too smaller numbers to present including male cases of breast cancer) so the figures for each individual cancer site do not sum to the total.
Over the three year period 2020-22, there were 4,525 new cases of cancer excluding non-melanoma skin cancer (NMSC) that were diagnosed giving an average of 1,508 new diagnoses each year.
Lung, breast, prostate and colorectal cancers were the most commonly occurring cancers in Hull over the three year period.
| Cancer site | ICD 10 code | Males | Females | Persons |
| Oesophagus | C15 | 112 | 36 | 148 |
| Stomach | C16 | 53 | 26 | 79 |
| Colorectal | C18-C20 | 275 | 210 | 485 |
| Liver and biliary tract | C22, C23, C241 | 61 | 50 | 111 |
| Pancreas | C25 | 86 | 69 | 155 |
| Trachea, bronchus and lung | C33-C34 | 451 | 440 | 891 |
| Breast | C50 | 543 | ||
| Cervical | C53 | 53 | ||
| Uterus | C54-C55 | 110 | ||
| Ovary (including peritoneum and retroperitoneum) | C56-C57, C48 | 107 | ||
| Prostate | C61 | 463 | ||
| Kidney, except renal pelvis | C64 | 98 | 61 | 159 |
| Bladder (including in situ and unknown behaviour) | C67, D090, D414 | 158 | 61 | 219 |
| Blood (all haematological) | C81-C96, D479 | 269 | 175 | 444 |
| All cancers excluding NMSC | C00-C97 excl C44 | 2,297 | 2,228 | 4,525 |
The table below gives the standardised incidence rate so compares the number of new cases in Hull with England after adjusting for the age structure of the two populations. The incidence rates are given as the number of new cancers diagnosed within the three year period 2020-22 per 100,000 person-years. For most cancers, the numbers are relatively small so it is not possible to examine incidence for males and females separately.
The rates are substantially higher in Hull for lung cancer, being 80% higher than England for men and 89% higher for women. Rates are also substantially higher for bladder cancer (54% higher than England), stomach cancer (52% higher than England), oesophageal cancer (37% higher than England) and pancreatic cancer (29% higher than England). Incidence rates are also higher in Hull compared to England for cancers of the colon and rectum, liver and intrahepatic bile ducts, kidney, cervix, ovary and uterus, as well as for blood (haematological) cancers.
Compared to England, the age-standardised incidence rate was lower in Hull for cancers of the breast (9% lower than England) and prostate (17% lower than England).
Overall, the incidence of all cancers in Hull compared to England was 10% higher for men and women combined (7% higher for men and 13% higher for women).
| Cancer site | ICD 10 code | Gender | Hull | England |
| Oesophagus | C15 | Persons | 22.9 | 16.7 |
| Stomach | C16 | Persons | 12.3 | 8.1 |
| Colorectal | C18-C20 | Males | 88.1 | 85.9 |
| Colorectal | C18-C20 | Females | 59.5 | 58.8 |
| Colorectal | C18-C20 | Persons | 73.8 | 72.4 |
| Liver and intrahepatic bile ducts | C22 | Persons | 17.2 | 15.2 |
| Pancreas | C25 | Persons | 23.3 | 18.0 |
| Trachea, bronchus and lung | C33-C34 | Males | 147.6 | 82.0 |
| Trachea, bronchus and lung | C33-C34 | Females | 127.2 | 67.2 |
| Trachea, bronchus and lung | C33-C34 | Persons | 137.4 | 74.6 |
| Breast | C50 | Females | 149.0 | 163.7 |
| Cervical | C53 | Females | 13.6 | 9.1 |
| Uterus | C54-C55 | Females | 30.8 | 29.0 |
| Ovary (including peritoneum and retroperitoneum) | C56-C57, C48 | Females | 29.3 | 24.1 |
| Prostate | C61 | Males | 149.2 | 180.1 |
| Kidney, except renal pelvis | C64 | Persons | 24.0 | 19.2 |
| Bladder (including in situ and unknown behaviour) | C67, D090, D414 | Persons | 52.9 | 34.3 |
| Blood (all haematological) | CC81-C96, D479 | Males | 83.4 | 79.1 |
| Blood (all haematological) | C81-C96, D479 | Females | 48.9 | 50.8 |
| Blood (all haematological) | C81-C96, D479 | Persons | 66.1 | 65.0 |
| All cancers excluding NMSC | C00-C97 excl C44 | Males | 730.0 | 683.6 |
| All cancers excluding NMSC | C00-C97 excl C44 | Females | 622.2 | 549.6 |
| All cancers excluding NMSC | C00-C97 excl C44 | Persons | 676.1 | 616.6 |
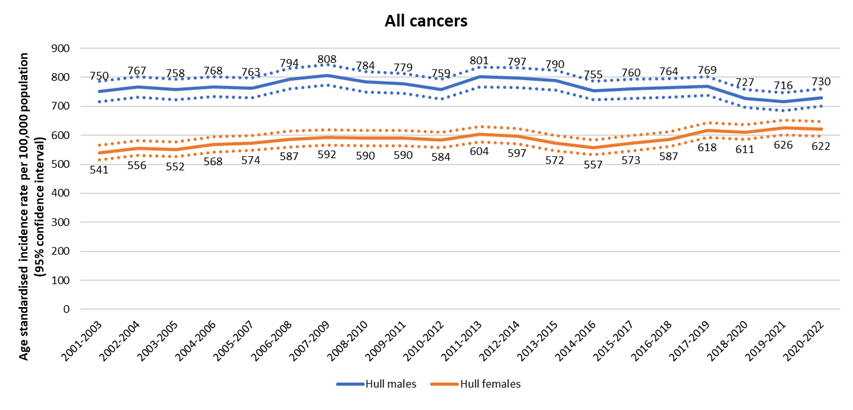
Between 2001-03 and 2017-19, the incidence rate of all cancers (excluding non-melanoma skin cancer) had increased in Hull by 3% for men and by 14% for women. Since 2017-19, the incidence has decreased among men by 5% and remained steady among women (despite increasing for the previous three years). This change in cancer incidence trends may be associated with fewer new cases of cancers being detected in 2020 because of the COVID-19 pandemic, with each of the most recent three year periods including 2020. It remains to be seen which direction the trend will go for 2021-2023 and onwards.
Overall, between 2001-03 and 2020-22, there has been a decrease in cancer incidence of 3% among men, but an increase of 15% among women.
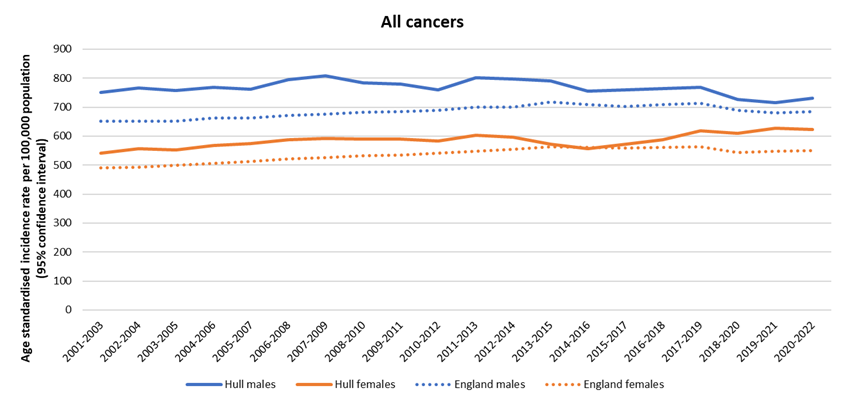
In 2020-22, the standardised incidence rate for all cancers (excluding non-melanoma skin cancer) was 7% higher in Hull compared to England for men and 13% higher for women. For men, the cancer incidence rate in Hull has followed a reasonably similar pattern to that for England. For women, the incidence rate increased gradually in both Hull and England to the period 2011-13 to 2013-15, but then increased in Hull, while the England rate remained steady or decreased, leading to a widening of the gap between Hull and England, which in 2019-21 and 2020-22 was higher than at any point this century.
Lung Cancer
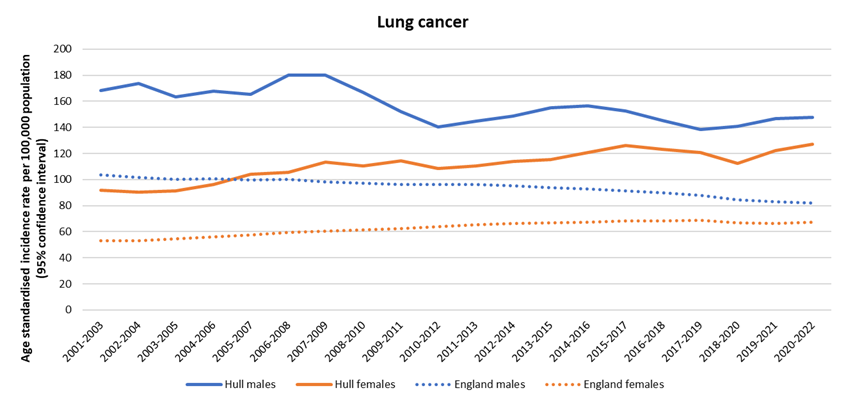
For lung cancer among Hull men, the incidence rate has fallen by 12% over the last 20 years between 2001-03 and 2020-22.
Among Hull women, however, over the same 20-year period, the lung cancer incidence rate increased by more than one-third (38%).
The lung cancer incidence rate was 83% higher among Hull men compared to Hull women in 2001-03, but by 2020-22, the rate rate among men was only 16% higher.
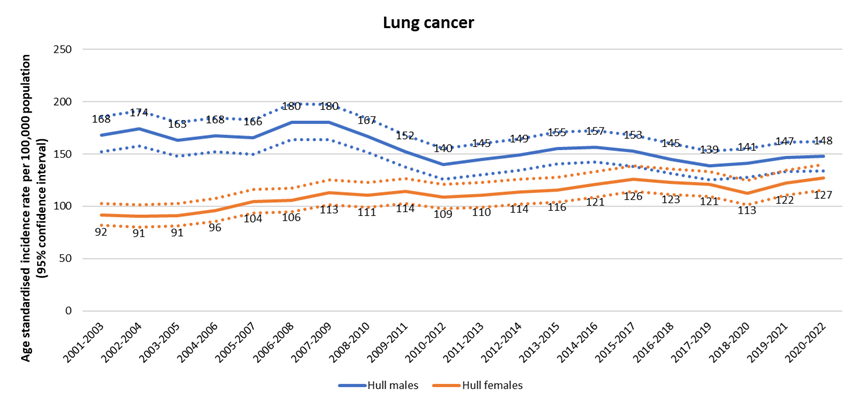
The age standardised incidence rate per 100,000 population for lung cancer is statistically significantly higher than England with the rate being very much higher in Hull. The latest incidence rate is 84% higher in Hull compared to England (80% higher for men and 89% higher for women).
There is more variability in the lung cancer incidence rate in Hull, but there has been a reasonably similar rate of change with England for both men (-16% versus -20%) and women (+21% versus +24%).
Colorectal Cancer
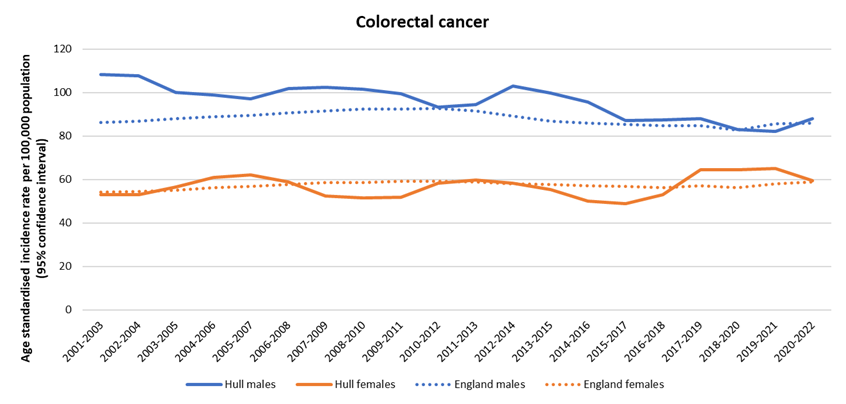
For colorectal cancer, the age standardised incidence rates among Hull men have been consistently higher than the rates among Hull women, with the differences statistically significant for each year apart from 2018-20 and 2019-21 . Over the 20 year period, there has been a reduction of 19% in the incidence rate for colorectal cancer for men, but for women the incidence of colorectal cancer has increased by 12%.
In Hull, the rate of new cases of colorectal cancers diagnosed among men in 2001-03 was more than double the rate in women, but for cancers diagnosed in 2020-22, the rate was only 48% higher among men compared to women.
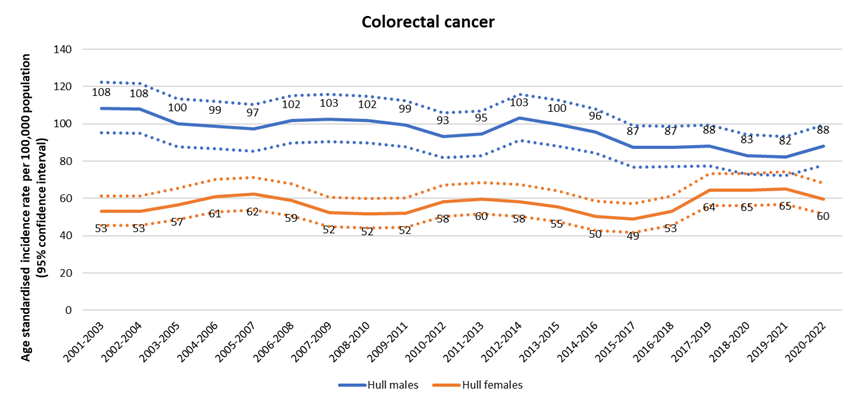
There has been no statistically significant difference in the incidence rate for colorectal cancer between Hull and England over the last 20 years with the exception of men in 2001-03 and 2002-04.
The rate of decrease in the incidence rate has been much greater in Hull compared to England among men (-19% versus -1%) and among women the increase in the incidence rate in Hull has been greater than for England (+12% versus +8%).
Breast Cancer
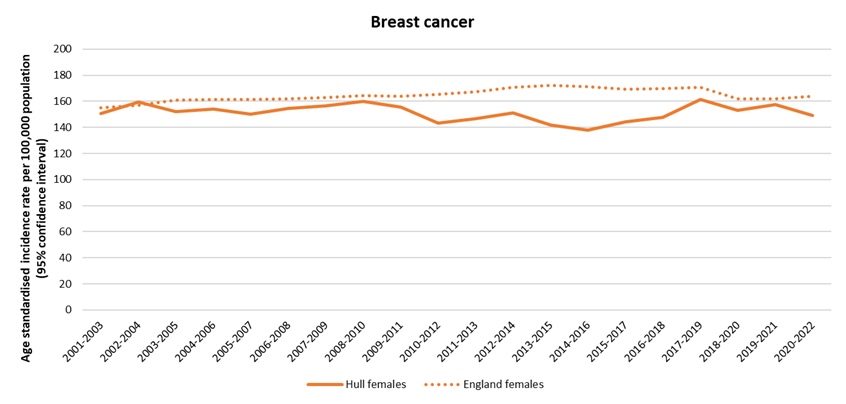
The incidence rate for breast cancer among women has varied between 138 and 161 per 100,000 population over the last 20 years, with the peak seen in 2017-19, although the rate has decreased since to 149 per 100,000 population in 2020-22.
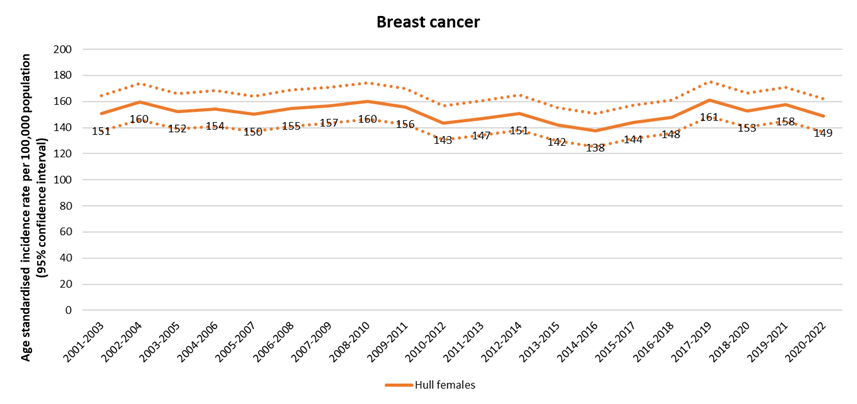
The incidence of breast cancer has generally been lower than England throughout the past 20 years, with the only excepti0n being 2002-04. The latest rate for Hull for 2020-22 is 9% lower than England (149 versus 164 per 100,000 population). The rate of change between 2001-03 and 2017-19 was similar for Hull (+7%) and England (+10%), but since 2017-19, the breast cancer incidence rate in Hull has decreased by 8%, while decreasing in England by 4%. Over the entire 20-year period from 2001-03 to 2020-22, the breast cancer incidence rate decreased in Hull by 1% while increasing in England by 6%.
Prostate Cancer
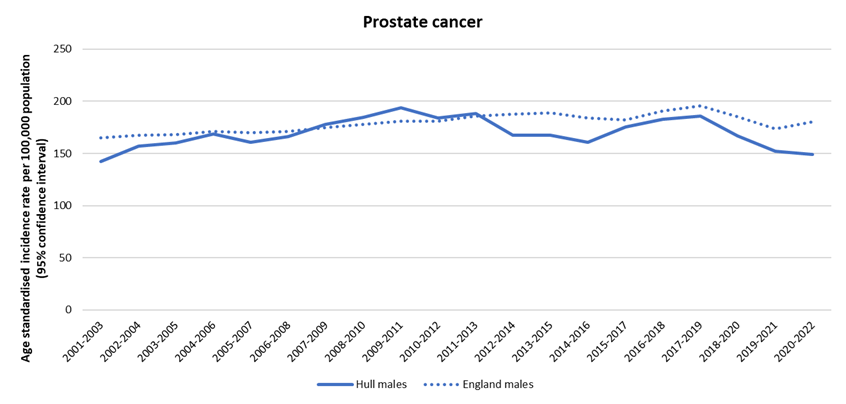
Between 2001-03 and 2017-19, the incidence of prostate cancer increased in Hull by 30%, although the rate has decreased by 20% since then, leading to an overall increase in prostate cancer incidence rates between 2001-03 and 2020-22 of 5%. The decreases since 2017-19 are likely due to the 2020 COVID-19 pandemic which saw a large decrease in cancer diagnoses. Each of the most recent three-year periods includes 2020, the peak pandemic year. It remains to be seen which direction the trend will go for 2021-2023 and onwards.
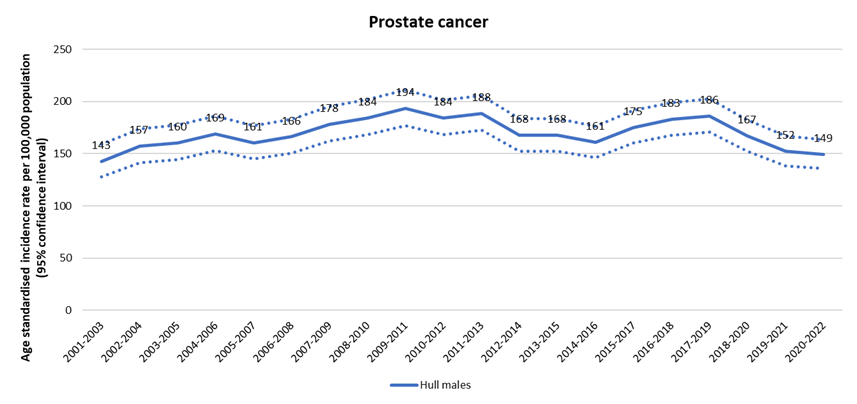
The incidence rate for prostate cancer has been reasonably similar in Hull to the rate in England over much of this century, although the rates for Hull and England have diverged somewhat since 2017-19, with the rate in Hull currently 17% lower than for England (149 versus 180 per 100,000 population respectively).
Rates Across Hull’s neighbourhoods
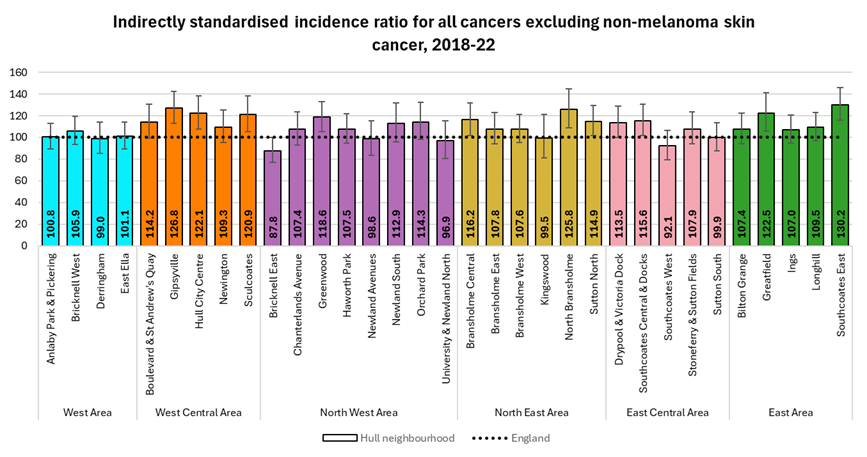
Within the NHS National Disease Registration Service, data on the number of cancers diagnosed in each Middle Layer Super Output area (of which there are 33 in Hull, equivalent to neighbourhoods) are given. Standardised incidence ratios have been produced for each of these neighbourhoods using this information, MSOA populations and England age-specific rates, and are given for all cancers (excluding non-melanoma skin cancer), colorectal cancer, lung cancer, breast cancer and prostate cancer. The standardised incidence ratio compared the number of cancers diagnosed in each neighbourhood with the number that would have occurred if the incidence rate was the same as for England overall. The data presented below relates to the five year period 2018-22 and the standardised incidence ratios are given together with 95% confidence intervals (which gives a range of values where the true value is likely to fall taking into account random variation). The standardised incidence ratios are standardised to England with the ratio for England being 100 for the period 2018-22. So that any ratio above 100 denotes that the neighbourhood has a higher incidence rate for the specific cancer compared to England for the period 2018-22, and a ratio below 100 denotes a lower incidence rate.
If the 95% confidence interval does not contain the value of 100, this means that the incidence rate for the neighbourhood is statistically significantly different from England after allowing for differences in the age structure between the neighbourhood and England.
All Cancers
The standardised incidence ratios across Hull’s 33 neighbourhoods ranged between 88 in Bricknell East and 130 in Southcoates East. The lower 95% confidence limits were higher than 100 for ten neighbourhoods, three in West Central (Gipsyville, Hull City centre and Sculcoates), one in North West (Bricknell), three in North East (Bransholme Central, North Bransholme and Sutton), one in East Central (Southcoates & Victoria Dock) and two in East (Greatfield and Southcoates East). For these ten neighbourhoods, the cancer incidence rates – after adjusting for the age distribution of the neighbourhoods – were statistically significantly higher than England.
Southcoates East, Gipsyville and North Bransholme had the highest new rate of cancers diagnosed in 2018-22 in Hull, with rates more than 25% higher than the incidence rate in England.
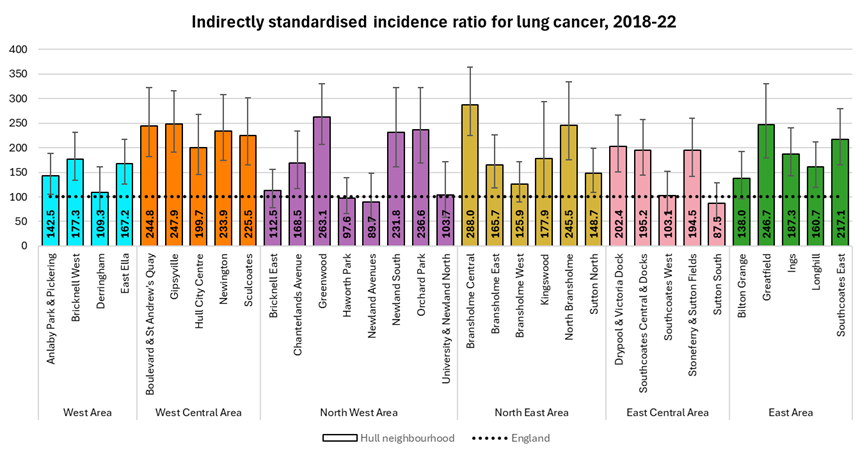
Lung Cancer
The standardised incidence ratios for lung cancers diagnosed during 2018-22 across Hull’s neighbourhoods ranged between 88 in Sutton South to 288 in Bransholme Central.
The cancer incidence rate for lung cancer was statistically significantly higher than England after adjusting for the age structure of the local population for 23 of Hull’s 33 neighbourhoods.
The rate of new lung cancer cases was more than twice as high as England for 12 neighbourhoods; four in West Central (Boulevard & St Andrew’s Quay, Gipsyville, Newington and Sculcoates), three in North West (Greenwood, Newland South and Orchard Park), two in North East (Bransholme Central and North Bransholme), one in East Central (Drypool & Victoria Dock) and two in East (Greatfield and Southcoates East).
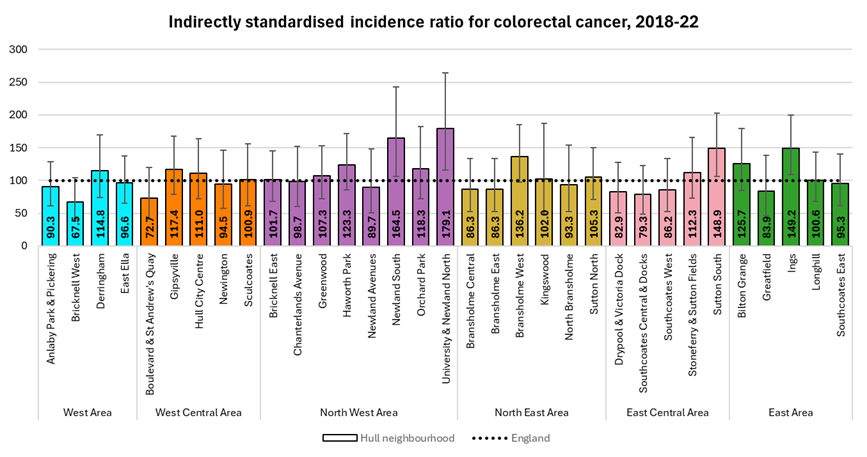
Colorectal Cancer
The standardised incidence ratios for colorectal cancers diagnosed during 2018-22 across Hull’s neighbourhoods ranged between 68 in Bricknell West to 179 in University & Newland North.
For the majority of neighbourhoods in Hull, the incidence rate of new cases of colorectal cancer was not statistically significantly different than England with the only exceptions being University & Newland North (79% higher than England), Newland South (65% higher than England), Ings (49% higher than England) and Sutton South (49% higher than England).
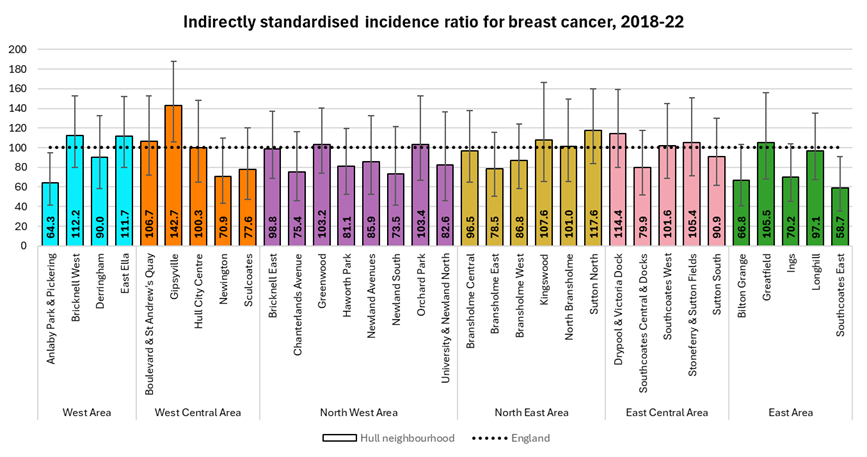
Breast Cancer
The standardised incidence ratios for breast cancers diagnosed during 2018-22 across Hull’s neighbourhoods ranged between 59 in Southcoates East to 143 in Gipsyville.
The rate of new cases of breast cancer was lower than England for the 19 of the 33 neighbourhoods in Hull with Southcoates East and Anlaby Park & Pickering neighbourhoods having statistically significantly lower incidence rates of breast cancer compared to England (41% and 36% lower respectively than England). Only one of Hull’s neighbourhoods had a statistically significantly higher rate of new breast cancer cases compared to England, Gipsyville (43% higher than England).
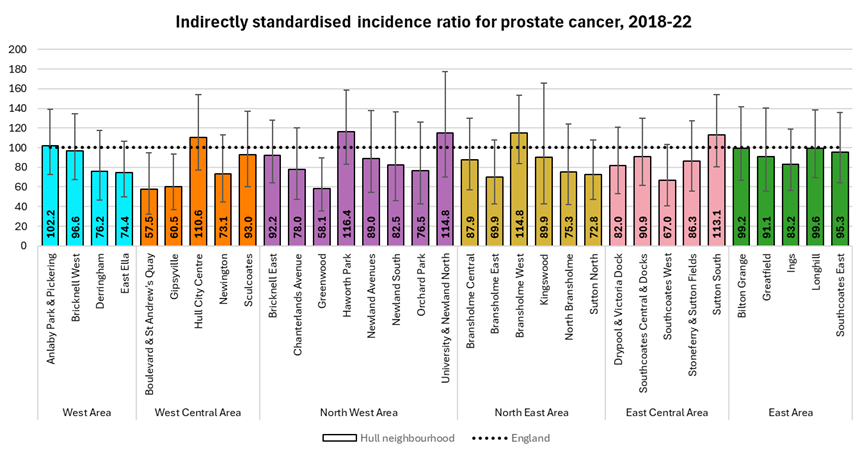
Prostate Cancer
The standardised incidence ratios for prostate cancers diagnosed during 2018-22 across Hull’s neighbourhoods ranged between 57 in Boulevard & St Andrew’s Quay to 116 in Haworth Park.
The incidence rate for prostate cancer was lower than England for the 27 of Hull’s 33 neighbourhoods, and was statistically significantly lower for Boulevard & St Andrew’s Quay (43% lower than England), Greenwood (42% lower than England), and Gipsyville (39% lower than England).
Prevalence
The Office for Health Improvement & Disparities’ Fingertips gives the percentage of patients registered with Hull GPs who are have been diagnosed with cancer since the 1 April 2004. For 2024/25, 3.3% of Hull’s (03F) registered population had had a cancer diagnosis since 1 April 2004 which was considerably lower than the Humber and North Yorkshire Integrated Care Board average and England.
Whilst the incidence of cancer is much higher in Hull, survival rates are generally lower, so this would account for the discrepancy between incidence and prevalence in Hull. Furthermore, incidence and survival rates differ by cancer site. Hull has a much higher incidence of lung cancer, and survival rates from lung cancer are lower than for many other cancer sites which further impacts on the prevalence.
Compared with benchmark
| Indicator | Period | England | NHS Humber and North Yorkshire Integrated Care Board - QOQ | Humber and North Yorkshire ICB - 02Y | Humber and North Yorkshire ICB - 03F | Humber and North Yorkshire ICB - 03H | Humber and North Yorkshire ICB - 03K | Humber and North Yorkshire ICB - 03Q | Humber and North Yorkshire ICB - 42D |
|---|---|---|---|---|---|---|---|---|---|
Cancer: QOF prevalence (Persons All ages) | 2024/25 | 3.8 | 4.5 | 5.6 | 3.3 | 4.0 | 4.1 | 3.9 | 5.1 |
The percentage of patients who have had a cancer diagnosis since April 2004 has gradually increased over time which is what would be expected given that the indicator measures cancer diagnoses since a specific point in time. The cumulative total of patients should increase, particularly for cancers with a high survival rate.
The rate of increase in the indicator for Hull has shown a similar pattern to that of England and the Humber and North Yorkshire Integrated Care Board, although the percentage has been consistently lower in Hull. The number of registered patients with a cancer diagnosis since the 1 April 2004 has tripled between 2009/10 from 1,909 (1.1%) to 10,289 (3.3%) in Hull for 2024/25.
Compared with benchmark
Cancer: QOF prevalence (Persons All ages)
|
Period
|
Humber and North Yorkshire ICB - 03F |
NHS Humber and North Yorkshire Integrated Care Board - QOQ
|
England
|
||||
|---|---|---|---|---|---|---|---|
|
Count
|
Value
|
95%
Lower CI |
95%
Upper CI |
||||
| 2009/10 | • | 1909 | 1.1% | 1.1% | 1.2% | - | 1.4% |
| 2010/11 | • | 2341 | 1.4% | 1.3% | 1.4% | - | 1.6% |
| 2011/12 | • | 2667 | 1.5% | 1.5% | 1.6% | - | 1.8% |
| 2012/13 | • | 5081 | 1.7% | 1.7% | 1.8% | 2.3% | 1.9% |
| 2013/14 | • | 5604 | 1.9% | 1.9% | 2.0% | 2.5% | 2.1% |
| 2014/15 | • | 6028 | 2.1% | 2.0% | 2.1% | 2.7% | 2.3% |
| 2015/16 | • | 6463 | 2.2% | 2.1% | 2.2% | 2.9% | 2.4% |
| 2016/17 | • | 6857 | 2.2% | 2.2% | 2.3% | 3.0% | 2.6% |
| 2017/18 | • | 7345 | 2.5% | 2.4% | 2.5% | 3.3% | 2.7% |
| 2018/19 | • | 8013 | 2.7% | 2.6% | 2.7% | 3.6% | 3.0% |
| 2019/20 | • | 8444 | 2.8% | 2.7% | 2.8% | 3.7% | 3.1% |
| 2020/21 | • | 8646 | 2.8% | 2.8% | 2.9% | 3.8% | 3.2% |
| 2021/22 | • | 9032 | 2.9% | 2.9% | 3.0% | 4.0% | 3.3% |
| 2022/23 | • | 9625 | 3.1% | 3.0% | 3.2% | 4.1% | 3.5% |
| 2023/24 | • | 9895 | 3.1% | 3.1% | 3.2% | 4.3% | 3.6% |
| 2024/25 | • | 10289 | 3.3% | 3.2% | 3.3% | 4.5% | 3.8% |
Source: NHS England
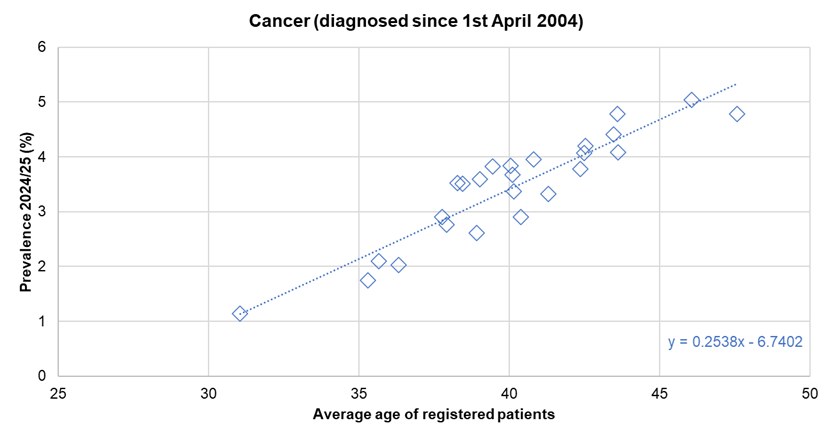
From the local analysis of the national Quality and Outcomes Framework datasets, there was a statistically significant association between average age of the practice patients and the percentage of patients who have had a cancer diagnosis since 1 April 2004 across the 25 practices in Hull for 2024/25. If the practices were divided into five approximately equal sized groups based on average age of patients (with each fifth having approximately one-fifth of the total registered patients in Hull) then the prevalence increased from 1.8% for the practices serving the youngest practice patients to 4.2% for the practices serving the oldest practice patients. For every increase in the average age of the patients of 10 years, the percentage of patients who have had a cancer diagnosis since April 2004 increased by 2.5 percentage points. Further analysis of diagnosed disease by the average age of practice patients is within the file above and within Local Analysis of Quality and Outcomes Framework Data.
There was no statistically significant association between the percentage of patients who have had a cancer diagnosis since 1 April 2004 and the average deprivation score of registered patients (using the Index of Multiple Deprivation 2025) across the 25 practices.
Two week wait
The two week wait appointment system was introduced so that any patient with symptoms that might indicate cancer could be seen by a specialist as soon as possible. The Office for Health Improvement & Disparities’ Fingertips presents indicators relating to the two week wait for the sub Integrated Care Board areas which include Hull within the Humber and North Yorkshire Integrated Care Board. The sub-ICB area referenced by 03F relates to Hull (see Integrated Care Board for the codes relating to the other local sub-ICB areas).
In 2024/25, Hull had a lower number of two week wait referrals per 100,000 population compared to England (4,271 versus 4,899) and the percentage of cancers diagnosed from the two week wait referrals was also lower in Hull compared to England (5.6% versus 6.0%) as was the percentage of cancers treated out of those two week wait referrals (43.3% versus 53.9%).
Compared with benchmark
| Indicator | Period | England | NHS Humber and North Yorkshire Integrated Care Board - QOQ | Humber and North Yorkshire ICB - 02Y | Humber and North Yorkshire ICB - 03F | Humber and North Yorkshire ICB - 03H | Humber and North Yorkshire ICB - 03K | Humber and North Yorkshire ICB - 03Q | Humber and North Yorkshire ICB - 42D |
|---|---|---|---|---|---|---|---|---|---|
Urgent suspected cancer referrals (Persons All ages) | 2024/25 | 4899 | 4644 | 5511 | 4271 | 3918 | 4146 | 3953 | 5058 |
Urgent suspected cancer referrals resulting in a diagnosis of cancer (Conversion rate: as % of all USC referrals) (Persons All ages) | 2024/25 | 6.0 | 7.4 | 7.5 | 5.6 | 6.6 | 6.8 | 8.1 | 8.3 |
New cancer cases treated resulting from an urgent suspected cancer referral (Detection rate: % of all new cancer cases treated) (Persons All ages) | 2024/25 | 53.9 | 49.4 | 50.2 | 43.3 | 45.1 | 50.2 | 49.1 | 52.1 |
The number of two week wait referrals per 100,000 population has increased over time for Hull, England and across the region. There has been a relatively consistent increase over time with the exception of a temporary decease in 2019/20 due to the COVID-19 pandemic. However, over the entire period 2009/10 to 2024/25, the rate of two week referrals has been lower in Hull.
Compared with benchmark
Urgent suspected cancer referrals (Persons All ages)
|
Period
|
Humber and North Yorkshire ICB - 03F |
NHS Humber and North Yorkshire Integrated Care Board - QOQ
|
England
|
||||
|---|---|---|---|---|---|---|---|
|
Count
|
Value
|
95%
Lower CI |
95%
Upper CI |
||||
| 2009/10 | • | 3194 | 1110 | 1072 | 1149 | 1503 | 1643 |
| 2010/11 | • | 3598 | 1255 | 1214 | 1297 | 1650 | 1808 |
| 2011/12 | • | 4123 | 1421 | 1378 | 1466 | 1842 | 1978 |
| 2012/13 | • | 4777 | 1645 | 1599 | 1692 | 2134 | 2165 |
| 2013/14 | • | 5836 | 2022 | 1971 | 2075 | 2422 | 2397 |
| 2014/15 | • | 6340 | 2183 | 2130 | 2238 | 2769 | 2708 |
| 2015/16 | • | 6857 | 2317 | 2263 | 2373 | 3067 | 2975 |
| 2016/17 | • | 7545 | 2444 | 2390 | 2500 | 3171 | 3164 |
| 2017/18 | • | 7321 | 2447 | 2392 | 2504 | 3259 | 3263 |
| 2018/19 | • | 8739 | 2902 | 2842 | 2964 | 3635 | 3675 |
| 2019/20 | • | 9603 | 3169 | 3106 | 3233 | 3771 | 3896 |
| 2020/21 | • | 8549 | 2818 | 2758 | 2878 | 3201 | 3389 |
| 2021/22 | • | 10527 | 3427 | 3362 | 3493 | 4014 | 4323 |
| 2022/23 | • | 10956 | 3522 | 3457 | 3589 | 4255 | 4619 |
| 2023/24 | • | 12289 | 3909 | 3840 | 3979 | 4505 | 4770 |
| 2024/25 | • | 13446 | 4271 | 4199 | 4344 | 4644 | 4899 |
Source: NHS England, National Disease Registration Service
The majority of referrals do not result in a cancer diagnosis, and with the increasing number of referrals, the percentage resulting in a diagnosis of cancer has reduced over time.
If there were many more referrals for a geographical area compared to England, then it might be expected that the percentage resulting in a cancer diagnosis and subsequently requiring treatment could be lower. However, there are fewer referrals in Hull, and with a higher incidence rate of cancer this suggests that people are not visiting their GP when they have symptoms that may signify cancer and/or that GPs when they see such symptoms in their patients are not using the two week wait referral system. It is more common for people living in more deprived areas to delay visiting their GP, so it is perhaps not surprising that the rate of two week wait referrals is lower in Hull.
Compared with benchmark
Urgent suspected cancer referrals resulting in a diagnosis of cancer (Conversion rate: as % of all USC referrals) (Persons All ages)
|
Period
|
Humber and North Yorkshire ICB - 03F |
NHS Humber and North Yorkshire Integrated Care Board - QOQ
|
England
|
||||
|---|---|---|---|---|---|---|---|
|
Count
|
Value
|
95%
Lower CI |
95%
Upper CI |
||||
| 2009/10 | • | 506 | 15.8% | 14.6% | 17.1% | 14.5% | 10.8% |
| 2010/11 | • | 490 | 13.6% | 12.5% | 14.8% | 13.8% | 10.3% |
| 2011/12 | • | 566 | 13.7% | 12.7% | 14.8% | 12.6% | 10.0% |
| 2012/13 | • | 587 | 12.3% | 11.4% | 13.2% | 11.4% | 9.4% |
| 2013/14 | • | 678 | 11.6% | 10.8% | 12.5% | 11.2% | 9.0% |
| 2014/15 | • | 616 | 9.7% | 9.0% | 10.5% | 9.9% | 8.2% |
| 2015/16 | • | 652 | 9.5% | 8.8% | 10.2% | 9.6% | 7.8% |
| 2016/17 | • | 650 | 8.6% | 8.0% | 9.3% | 9.5% | 7.6% |
| 2017/18 | • | 691 | 9.4% | 8.8% | 10.1% | 9.6% | 7.5% |
| 2018/19 | • | 708 | 8.1% | 7.5% | 8.7% | 8.9% | 7.1% |
| 2019/20 | • | 657 | 6.8% | 6.4% | 7.4% | 8.0% | 6.6% |
| 2020/21 | • | 623 | 7.3% | 6.8% | 7.9% | 9.0% | 7.0% |
| 2021/22 | • | 701 | 6.7% | 6.2% | 7.2% | 8.1% | 6.2% |
| 2022/23 | • | 778 | 7.1% | 6.6% | 7.6% | 7.7% | 6.0% |
| 2023/24 | • | 695 | 5.7% | 5.3% | 6.1% | 7.4% | 6.0% |
| 2024/25 | • | 751 | 5.6% | 5.2% | 6.0% | 7.4% | 6.0% |
Source: NHS England, National Disease Registration Service
The percentage of new cases treated resulting from two week wait referral had been increasing in Hull as it has in England and the region, but the percentage has been more variable in Hull, and from 2016/17 onwards has been lower than England, with the percentage dropping in 2024/25 in Hull, the region and England, but with the decrease larger in Hull.
Compared with benchmark
New cancer cases treated resulting from an urgent suspected cancer referral (Detection rate: % of all new cancer cases treated) (Persons All ages)
|
Period
|
Humber and North Yorkshire ICB - 03F |
NHS Humber and North Yorkshire Integrated Care Board - QOQ
|
England
|
||||
|---|---|---|---|---|---|---|---|
|
Count
|
Value
|
95%
Lower CI |
95%
Upper CI |
||||
| 2009/10 | • | 513 | 36.7% | 34.2% | 39.3% | 41.9% | 42.4% |
| 2010/11 | • | 499 | 39.1% | 36.5% | 41.8% | 42.4% | 43.7% |
| 2011/12 | • | 587 | 42.0% | 39.4% | 44.6% | 42.9% | 45.0% |
| 2012/13 | • | 585 | 45.2% | 42.5% | 47.9% | 46.0% | 46.3% |
| 2013/14 | • | 685 | 47.7% | 45.2% | 50.3% | 46.7% | 47.4% |
| 2014/15 | • | 646 | 49.0% | 46.3% | 51.7% | 49.0% | 48.4% |
| 2015/16 | • | 638 | 52.4% | 49.6% | 55.2% | 51.0% | 49.7% |
| 2016/17 | • | 693 | 49.6% | 47.0% | 52.3% | 50.2% | 51.0% |
| 2017/18 | • | 677 | 46.2% | 43.7% | 48.8% | 51.6% | 51.3% |
| 2018/19 | • | 703 | 51.9% | 49.2% | 54.5% | 52.2% | 53.2% |
| 2019/20 | • | 711 | 49.7% | 47.1% | 52.2% | 52.2% | 53.7% |
| 2020/21 | • | 615 | 51.1% | 48.3% | 53.9% | 53.9% | 54.8% |
| 2021/22 | • | 703 | 49.0% | 46.4% | 51.6% | 52.2% | 54.4% |
| 2022/23 | • | 825 | 47.8% | 45.5% | 50.2% | 53.0% | 55.6% |
| 2023/24 | • | 743 | 50.0% | 47.4% | 52.5% | 53.2% | 55.7% |
| 2024/25 | • | 781 | 43.3% | 41.0% | 45.6% | 49.4% | 53.9% |
Source: NHS England, National Disease Registration Service
Information is also available on Fingertips for the specific cancer sites of breast, lower gastrointestinal, lung and skin.
For 2024/25 compared to England, the referral rate in Hull (03F) was higher for lower gastrointestinal cancers, similar for breast cancer, but lower for lung cancer, and much lower for skin cancer.
It is possible that the incidence of these cancers differs between Hull and England, but it is also possible that the relatively low two week wait referral rate in Hull means that residents are not accessing cancer treatment as quickly as others do across other geographical areas. The incidence of some cancers such as lung cancer is much higher in Hull, so it suggests that the two week referral route is not been used in Hull as readily as elsewhere.
Compared with benchmark
| Indicator | Period | England | NHS Humber and North Yorkshire Integrated Care Board - QOQ | Humber and North Yorkshire ICB - 02Y | Humber and North Yorkshire ICB - 03F | Humber and North Yorkshire ICB - 03H | Humber and North Yorkshire ICB - 03K | Humber and North Yorkshire ICB - 03Q | Humber and North Yorkshire ICB - 42D |
|---|---|---|---|---|---|---|---|---|---|
Urgent suspected cancer referrals for suspected breast cancer (Persons All ages) | 2024/25 | 821 | 812 | 882 | 836 | 892 | 809 | 697 | 786 |
Urgent suspected cancer referrals for suspected lower GI cancer (Persons All ages) | 2024/25 | 772 | 969 | 1154 | 957 | 819 | 825 | 878 | 1004 |
Urgent suspected cancer referrals for suspected lung cancer (Persons All ages) | 2024/25 | 111 | 99 | 103 | 80 | 92 | 106 | 76 | 117 |
Urgent suspected cancer referrals for suspected skin cancer (Persons All ages) | 2024/25 | 1196 | 666 | 619 | 261 | 473 | 537 | 559 | 1064 |
The rate of two week wait referrals for breast has been consistently lower in Hull compared to England over the last decade, although the referral rate has been increasing in the last 2-3 years at a faster rate in Hull, and for the first time – since 2012/13 – the rate of two week wait referrals for breast cancer in 2024/25 was higher than for England.
The rate of two week wait referrals for breast cancer does not appear to have been adversely affected by the COVID-19 pandemic.
Compared with benchmark
Urgent suspected cancer referrals for suspected breast cancer (Persons All ages)
|
Period
|
Humber and North Yorkshire ICB - 03F |
NHS Humber and North Yorkshire Integrated Care Board - QOQ
|
England
|
||||
|---|---|---|---|---|---|---|---|
|
Count
|
Value
|
95%
Lower CI |
95%
Upper CI |
||||
| 2009/10 | • | 718 | 250 | 232 | 268 | 319 | 338 |
| 2010/11 | • | 745 | 260 | 242 | 279 | 344 | 377 |
| 2011/12 | • | 672 | 232 | 214 | 250 | 334 | 371 |
| 2012/13 | • | 760 | 262 | 243 | 281 | 386 | 390 |
| 2013/14 | • | 966 | 335 | 314 | 357 | 431 | 444 |
| 2014/15 | • | 1009 | 347 | 326 | 370 | 470 | 482 |
| 2015/16 | • | 1097 | 371 | 349 | 393 | 541 | 541 |
| 2016/17 | • | 1149 | 372 | 351 | 394 | 556 | 561 |
| 2017/18 | • | 1241 | 415 | 392 | 439 | 591 | 581 |
| 2018/19 | • | 1650 | 548 | 522 | 575 | 659 | 684 |
| 2019/20 | • | 1750 | 577 | 551 | 605 | 645 | 711 |
| 2020/21 | • | 1948 | 642 | 614 | 671 | 693 | 693 |
| 2021/22 | • | 2518 | 820 | 788 | 852 | 823 | 824 |
| 2022/23 | • | 2245 | 722 | 692 | 752 | 743 | 773 |
| 2023/24 | • | 2448 | 779 | 748 | 810 | 825 | 822 |
| 2024/25 | • | 2633 | 836 | 805 | 869 | 812 | 821 |
Source: NHS England, National Disease Registration Service
The rate of two week wait referrals for lower gastrointestinal cancers has been consistently lower in Hull compared to England between 2013/14 and 2022/23, but is higher in 2024/25. The referral rate decreased in 2020/21 likely associated with the pandemic.
Compared with benchmark
Urgent suspected cancer referrals for suspected lower GI cancer (Persons All ages)
|
Period
|
Humber and North Yorkshire ICB - 03F |
NHS Humber and North Yorkshire Integrated Care Board - QOQ
|
England
|
||||
|---|---|---|---|---|---|---|---|
|
Count
|
Value
|
95%
Lower CI |
95%
Upper CI |
||||
| 2009/10 | • | 468 | 163 | 148 | 178 | 273 | 255 |
| 2010/11 | • | 572 | 200 | 184 | 217 | 300 | 282 |
| 2011/12 | • | 695 | 240 | 222 | 258 | 354 | 334 |
| 2012/13 | • | 1008 | 347 | 326 | 369 | 446 | 379 |
| 2013/14 | • | 1044 | 362 | 340 | 384 | 445 | 368 |
| 2014/15 | • | 1102 | 379 | 357 | 403 | 502 | 421 |
| 2015/16 | • | 1140 | 385 | 363 | 408 | 542 | 453 |
| 2016/17 | • | 1194 | 387 | 365 | 409 | 605 | 511 |
| 2017/18 | • | 1101 | 368 | 347 | 390 | 661 | 557 |
| 2018/19 | • | 1414 | 470 | 445 | 495 | 754 | 650 |
| 2019/20 | • | 1716 | 566 | 540 | 594 | 847 | 725 |
| 2020/21 | • | 1489 | 491 | 466 | 516 | 686 | 615 |
| 2021/22 | • | 1887 | 614 | 587 | 643 | 896 | 799 |
| 2022/23 | • | 2407 | 774 | 743 | 805 | 1031 | 901 |
| 2023/24 | • | 2673 | 850 | 818 | 883 | 935 | 794 |
| 2024/25 | • | 3014 | 957 | 923 | 992 | 969 | 772 |
Source: NHS England, National Disease Registration Service
The rate of two week wait referrals for lung cancer has been consistently higher or similar in Hull compared to England over the last decade, although the rate of referrals has been decreasing in Hull since 2016/17. Furthermore, from 2017/18 onwards, the rate – in general – in Hull has only been comparable to the rate in England. The rate in 2024/25 is 28% lower in Hull compared to England which represents a significant difference given that lung cancer incidence in Hull is very high compared to England.
Given that current and historical patterns of smoking in Hull and the increased prevalence of lung cancer compared to England, it would be expected that two week referrals should be considerably higher in Hull.
Compared with benchmark
Urgent suspected cancer referrals for suspected lung cancer (Persons All ages)
|
Period
|
Humber and North Yorkshire ICB - 03F |
NHS Humber and North Yorkshire Integrated Care Board - QOQ
|
England
|
||||
|---|---|---|---|---|---|---|---|
|
Count
|
Value
|
95%
Lower CI |
95%
Upper CI |
||||
| 2009/10 | • | 348 | 121 | 109 | 134 | 89 | 66 |
| 2010/11 | • | 323 | 113 | 101 | 126 | 98 | 70 |
| 2011/12 | • | 316 | 109 | 97 | 122 | 88 | 77 |
| 2012/13 | • | 358 | 123 | 111 | 137 | 101 | 90 |
| 2013/14 | • | 404 | 140 | 127 | 154 | 103 | 93 |
| 2014/15 | • | 458 | 158 | 144 | 173 | 114 | 101 |
| 2015/16 | • | 448 | 151 | 138 | 166 | 119 | 103 |
| 2016/17 | • | 499 | 162 | 148 | 176 | 130 | 109 |
| 2017/18 | • | 372 | 124 | 112 | 138 | 112 | 107 |
| 2018/19 | • | 339 | 113 | 101 | 125 | 112 | 103 |
| 2019/20 | • | 329 | 109 | 97 | 121 | 115 | 107 |
| 2020/21 | • | 184 | 61 | 52 | 70 | 69 | 69 |
| 2021/22 | • | 341 | 111 | 100 | 123 | 113 | 97 |
| 2022/23 | • | 335 | 108 | 96 | 120 | 115 | 109 |
| 2023/24 | • | 265 | 84 | 74 | 95 | 107 | 113 |
| 2024/25 | • | 251 | 80 | 70 | 90 | 99 | 111 |
Source: NHS England, National Disease Registration Service
Between 2012/13 and 2020/21, the rate of two week wait referrals for skin cancer in Hull has been consistently lower compared to England although around 5% lower or less so not substantially lower. However, whilst referrals have increased quite sharply in England since 2020/21, there has been a relatively sharp reduction in Hull so that the referral rate is now 78% lower in Hull compared to England.
The referral rate for skin cancer in Hull is less than one-quarter that of England for 2024/25.
Compared with benchmark
Urgent suspected cancer referrals for suspected skin cancer (Persons All ages)
|
Period
|
Humber and North Yorkshire ICB - 03F |
NHS Humber and North Yorkshire Integrated Care Board - QOQ
|
England
|
||||
|---|---|---|---|---|---|---|---|
|
Count
|
Value
|
95%
Lower CI |
95%
Upper CI |
||||
| 2009/10 | • | 385 | 134 | 121 | 148 | 202 | 290 |
| 2010/11 | • | 518 | 181 | 165 | 197 | 239 | 322 |
| 2011/12 | • | 588 | 203 | 187 | 220 | 271 | 348 |
| 2012/13 | • | 720 | 248 | 230 | 267 | 320 | 375 |
| 2013/14 | • | 1011 | 350 | 329 | 373 | 410 | 435 |
| 2014/15 | • | 1253 | 431 | 408 | 456 | 507 | 508 |
| 2015/16 | • | 1526 | 516 | 490 | 542 | 602 | 572 |
| 2016/17 | • | 1695 | 549 | 523 | 576 | 613 | 630 |
| 2017/18 | • | 1802 | 602 | 575 | 631 | 640 | 664 |
| 2018/19 | • | 2238 | 743 | 713 | 775 | 734 | 767 |
| 2019/20 | • | 2412 | 796 | 764 | 828 | 748 | 831 |
| 2020/21 | • | 1977 | 652 | 623 | 681 | 558 | 689 |
| 2021/22 | • | 2200 | 716 | 687 | 747 | 667 | 936 |
| 2022/23 | • | 1544 | 496 | 472 | 522 | 685 | 1012 |
| 2023/24 | • | 1036 | 330 | 310 | 350 | 707 | 1132 |
| 2024/25 | • | 823 | 261 | 244 | 280 | 666 | 1196 |
Source: NHS England, National Disease Registration Service
Cancer Stage at Diagnosis
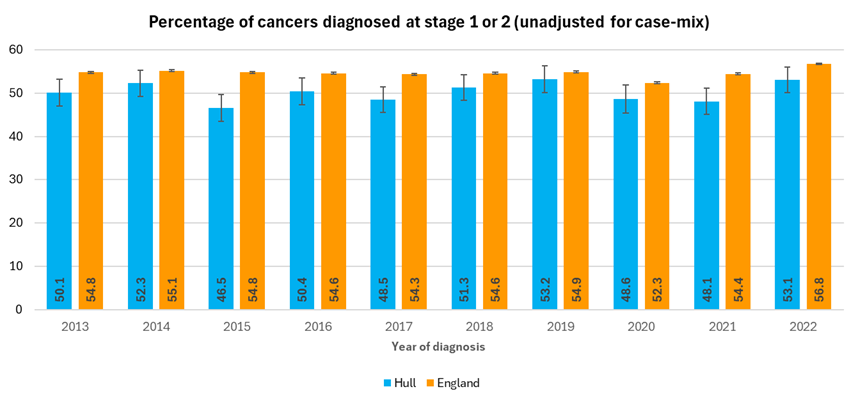
The Office for Health Improvement & Disparities’ Fingertips gives the percentage of cancers diagnosed at an early stage (stages 1 and 2). For 2022, for cancers where staging was possible and recorded, just over half of cancers were diagnosed at stages 1 or 2 in Hull (53.1%) which was lower than England (56.8%).
The percentage is given out of the total number of new cases whose stage is known (1, 2, 3 and 4) for the following cancer sites: invasive malignancies of lung, oesophagus, stomach, colorectal, pancreas, invasive melanomas of the skin, breast, cervix, uterus, ovary, prostate, testis, kidney, bladder, Hodgkin Lymphoma, thyroid, larynx, oropharynx, oral cavity and non-Hodgkin lymphoma.
Compared with benchmark
| Indicator | Period | England | Yorkshire and the Humber region (statistical) | Kingston upon Hull | East Riding of Yorkshire | North East Lincolnshire | North Lincolnshire | York | North Yorkshire UA | Barnsley | Doncaster | Rotherham | Sheffield | Bradford | Calderdale | Kirklees | Leeds | Wakefield |
|---|---|---|---|---|---|---|---|---|---|---|---|---|---|---|---|---|---|---|
Percentage of cancers diagnosed at stages 1 and 2 (Persons All ages) | 2022 | 56.8 | 54.2 | 53.1 | 54.7 | 49.1 | 52.4 | 56.7 | 55.3 | 52.5 | 57.0 | 55.3 | - | 51.2 | 54.2 | 52.9 | 55.1 | 56.3 |
The percentage in Hull has been quite variable between 2013 and 2017 at around 50%, although the percentage increased to 53% for 2019. The decrease for 2020 and 2021 could be associated with the COVID-19 pandemic, and reduced access or perceived access to primary and secondary care resulting in later diagnosis for a small percentage of patients. However, the percentage has increased back to 53% for 2022 similar to the figure prior to the pandemic.
Compared with benchmark
Percentage of cancers diagnosed at stages 1 and 2 (Persons All ages)
|
Period
|
Kingston upon Hull |
Yorkshire and the Humber region (statistical)
|
England
|
||||
|---|---|---|---|---|---|---|---|
|
Count
|
Value
|
95%
Lower CI |
95%
Upper CI |
||||
| 2013 | • | 499 | 50.1% | 47.0% | 53.2% | 53.9% | 54.8% |
| 2014 | • | 539 | 52.3% | 49.2% | 55.3% | 53.2% | 55.1% |
| 2015 | • | 450 | 46.5% | 43.4% | 49.7% | 53.0% | 54.8% |
| 2016 | • | 507 | 50.4% | 47.4% | 53.5% | 52.7% | 54.6% |
| 2017 | • | 534 | 48.5% | 45.5% | 51.4% | 51.9% | 54.3% |
| 2018 | • | 546 | 51.3% | 48.3% | 54.3% | 52.4% | 54.6% |
| 2019 | • | 537 | 53.2% | 50.1% | 56.2% | 53.4% | 54.9% |
| 2020 | • | 457 | 48.6% | 45.4% | 51.8% | 50.7% | 52.3% |
| 2021 | • | 519 | 48.1% | 45.1% | 51.1% | 52.6% | 54.4% |
| 2022 | • | 573 | 53.1% | 50.1% | 56.1% | 54.2% | 56.8% |
Source: NHS England, National Disease Registration Service
NHS Digital also provide information on the percentage of cancers diagnosed at stage 1 and 2.
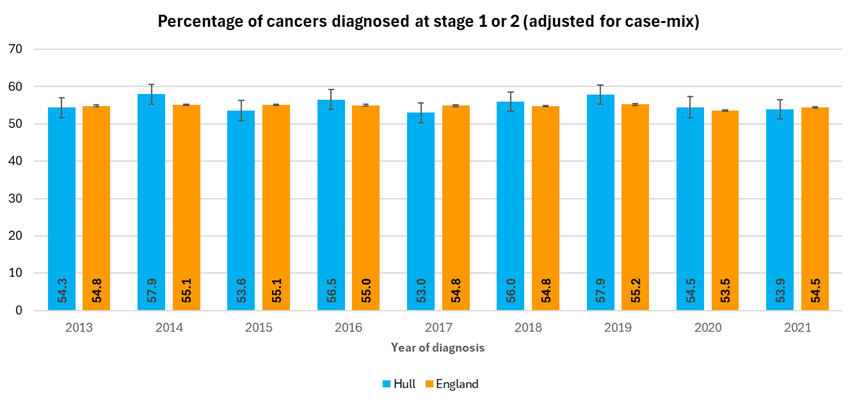
However, some cancers are more likely to be detected at an early stage, so the percentage of cancers diagnosed at a late stage can be depend on the distribution of the types of cancer. NHS Digital provides an estimate of the percentage of cancers diagnosed at an early stage adjusted for the differing case mix of patients with regard to diagnosis, socio-economic factors, and other variables (although only up until 2021 at sub-ICB level).
NHS Digital include staging information on oropharynx, oral cavity, oesophagus, colorectal, pancreas, lung, melanoma of the skin, breast, uterus, ovary, prostate, testis, kidney, bladder, Hodgkin lymphoma and non-Hodgkin lymphoma.
For all years, the percentage of these cancers diagnosed at an early stage is lower in Hull compared to England. However, once the difference in the case-mix of the patients is taken into consideration, then the percentage of cancers diagnosed at an early stage is generally higher or comparable to England.
Hospital Activity
Fingertips gives the number of emergency admissions for cancer per 100,000 population as well as the number of people diagnosed with cancer via an emergency route per 100,000 GP practice population (“number of emergency presentations”) and diagnosed via a non-emergency route per 100,000 GP practice population (“number of other presentations”) for the sub Integrated Care Board areas which include Hull within the Humber and North Yorkshire Integrated Care Board. The sub-ICB area referenced by 03F relates to Hull (see Integrated Care Board for the codes relating to the other local sub-ICB areas). Whilst the descriptors of the last two indicators do not mention cancer, the definitions on Fingertips do.
For 2024/25, the rates of emergency admissions relating to cancer is significantly higher in Hull compared to England and the rate of cancers diagnosed through an emergency route is also significantly higher in Hull. The rate of cancers diagnosed through other (non-emergency) routes is similar to England.
Given the higher incidence of cancer, it would be anticipated that admission rates would be higher. As expected, there is a higher proportion of people in Hull that are diagnosed with cancer through an emergency route which likely means that fewer people are being diagnosed through primary care, which has an impact on stage of diagnosis and the commencement of treatment, with the potential to affect mortality and survival rates.
Compared with benchmark
| Indicator | Period | England | NHS Humber and North Yorkshire Integrated Care Board - QOQ | Humber and North Yorkshire ICB - 02Y | Humber and North Yorkshire ICB - 03F | Humber and North Yorkshire ICB - 03H | Humber and North Yorkshire ICB - 03K | Humber and North Yorkshire ICB - 03Q | Humber and North Yorkshire ICB - 42D |
|---|---|---|---|---|---|---|---|---|---|
Number of emergency admissions with cancer (Persons All ages) | 2024/25 | 518 | 731 | 886 | 723 | 698 | 813 | 488 | 739 |
Number of emergency presentations (Persons All ages) | 2024/25 | 89 | 121 | 123 | 108 | 132 | 138 | 100 | 127 |
Number of other (non-emergency) presentations (Persons All ages) | 2024/25 | 435 | 554 | 658 | 421 | 464 | 513 | 494 | 636 |
The rate of emergency admissions with cancer had been between 500 and 600 per 100,000 population between 2009/10 and 2017/18, but increased sharply to 691 and to 760 for 2018/19 and 2019/20 respectively. There was since been a sharp fall to 634 per 100,000 population for 2020/21 and it is likely that the COVID-19 pandemic is influential in the change in the rate. The rate increased for both 2021/22 and 2022/23, followed by a sharp decrease for 2023/24, but with an even larger increase in 2024/25. The current admission rate in Hull is the second highest since 2009/10 with only 2019/20 higher.
During 2024/25, there were 2,277 emergency admissions for cancer among Hull residents.
Compared with benchmark
Number of emergency admissions with cancer (Persons All ages)
|
Period
|
Humber and North Yorkshire ICB - 03F |
NHS Humber and North Yorkshire Integrated Care Board - QOQ
|
England
|
||||
|---|---|---|---|---|---|---|---|
|
Count
|
Value
|
95%
Lower CI |
95%
Upper CI |
||||
| 2009/10 | • | 1689 | 587 | 560 | 616 | 569 | 527 |
| 2010/11 | • | 1596 | 557 | 530 | 585 | 563 | 528 |
| 2011/12 | • | 1531 | 528 | 502 | 555 | 559 | 531 |
| 2012/13 | • | 1672 | 576 | 549 | 604 | 598 | 529 |
| 2013/14 | • | 1723 | 597 | 570 | 626 | 600 | 528 |
| 2014/15 | • | 1745 | 601 | 573 | 630 | 596 | 544 |
| 2015/16 | • | 1575 | 532 | 507 | 559 | 580 | 544 |
| 2016/17 | • | 1647 | 534 | 508 | 560 | 609 | 547 |
| 2017/18 | • | 1695 | 567 | 540 | 594 | 599 | 545 |
| 2018/19 | • | 2147 | 691 | 662 | 721 | 693 | 554 |
| 2019/20 | • | 2303 | 760 | 730 | 791 | 737 | 559 |
| 2020/21 | • | 1375 | 484 | 458 | 510 | - | 460 |
| 2021/22 | • | 1948 | 634 | 606 | 663 | 675 | 519 |
| 2022/23 | • | 2141 | 688 | 659 | 718 | 680 | 502 |
| 2023/24 | • | 1647 | 524 | 499 | 550 | 635 | 534 |
| 2024/25 | • | 2277 | 723 | 694 | 754 | 731 | 518 |
Source: NHS England, National Disease Registration Service
Whilst the rate of emergency presentations for cancer in Hull has decreased between 2009/10 and 2015/16, the rate remained relatively unchanged between 2015/16 and 2020/21 (despite the pandemic). The rate increased sharply between 2020/21 and 2021/22 which is likely associated with a backlog (despite the relatively unchanged rate between 2019/20 and 2020/21), although the rate decreased sharply between 2021/22 and 2023/24, remaining the same in 2024/25. The rates in 2023/24 and 2024/25 are reasonably similar to the rates prior to the pandemic.
Compared with benchmark
Number of emergency presentations (Persons All ages)
|
Period
|
Humber and North Yorkshire ICB - 03F |
NHS Humber and North Yorkshire Integrated Care Board - QOQ
|
England
|
||||
|---|---|---|---|---|---|---|---|
|
Count
|
Value
|
95%
Lower CI |
95%
Upper CI |
||||
| 2009/10 | • | 392 | 136 | 123 | 150 | 113 | 98 |
| 2010/11 | • | 354 | 123 | 111 | 137 | 111 | 95 |
| 2011/12 | • | 360 | 124 | 112 | 138 | 109 | 94 |
| 2012/13 | • | 347 | 119 | 107 | 133 | 106 | 92 |
| 2013/14 | • | 347 | 120 | 108 | 134 | 106 | 90 |
| 2014/15 | • | 325 | 112 | 100 | 125 | 105 | 89 |
| 2015/16 | • | 292 | 99 | 88 | 111 | 97 | 89 |
| 2016/17 | • | 296 | 96 | 85 | 107 | 106 | 88 |
| 2017/18 | • | 301 | 101 | 90 | 113 | 104 | 85 |
| 2018/19 | • | 315 | 101 | 90 | 113 | 104 | 86 |
| 2019/20 | • | 323 | 107 | 95 | 119 | 104 | 85 |
| 2020/21 | • | 292 | 103 | 91 | 115 | 110 | 87 |
| 2021/22 | • | 417 | 136 | 123 | 149 | 126 | 98 |
| 2022/23 | • | 342 | 110 | 99 | 122 | 116 | 91 |
| 2023/24 | • | 303 | 96 | 86 | 108 | 118 | 87 |
| 2024/25 | • | 340 | 108 | 97 | 120 | 121 | 89 |
Source: NHS England, National Disease Registration Service
Between 2014/15 and 2019/20, the rate of non-emergency presentations for cancer had been relatively static in Hull at around 320-340 presentations per 100,000 population, and the rate was similar to or below the rate in England. However, the rate in Hull has increased since then, and in 2024/25 was similar to England.
Compared with benchmark
Number of other (non-emergency) presentations (Persons All ages)
|
Period
|
Humber and North Yorkshire ICB - 03F |
NHS Humber and North Yorkshire Integrated Care Board - QOQ
|
England
|
||||
|---|---|---|---|---|---|---|---|
|
Count
|
Value
|
95%
Lower CI |
95%
Upper CI |
||||
| 2009/10 | • | 833 | 289 | 270 | 310 | 355 | 327 |
| 2010/11 | • | 847 | 295 | 276 | 316 | 373 | 336 |
| 2011/12 | • | 976 | 336 | 316 | 358 | 396 | 349 |
| 2012/13 | • | 889 | 306 | 286 | 327 | 382 | 347 |
| 2013/14 | • | 1021 | 354 | 332 | 376 | 412 | 354 |
| 2014/15 | • | 991 | 341 | 320 | 363 | 399 | 360 |
| 2015/16 | • | 964 | 326 | 306 | 347 | 396 | 362 |
| 2016/17 | • | 1003 | 325 | 305 | 346 | 409 | 364 |
| 2017/18 | • | 1041 | 348 | 327 | 370 | 405 | 362 |
| 2018/19 | • | 989 | 318 | 299 | 339 | 435 | 378 |
| 2019/20 | • | 1058 | 349 | 328 | 371 | 420 | 377 |
| 2020/21 | • | 804 | 283 | 264 | 303 | 328 | 299 |
| 2021/22 | • | 1190 | 387 | 366 | 410 | 484 | 396 |
| 2022/23 | • | 1371 | 441 | 418 | 465 | 481 | 411 |
| 2023/24 | • | 1193 | 379 | 358 | 402 | 506 | 419 |
| 2024/25 | • | 1324 | 421 | 398 | 444 | 554 | 435 |
Source: NHS England, National Disease Registration Service
Mortality
Overall Mortality Rates
Fingertips present the standardised mortality ratios for cancer both for deaths for all ages and deaths which occurred prior to the age of 75 years. In 2019-23, cancer mortality rates in Hull were 30% higher than England for all ages and 32% higher for those aged under 75 years.
Compared with benchmark
| Indicator | Period | England | Yorkshire and the Humber region (statistical) | Kingston upon Hull | East Riding of Yorkshire | North East Lincolnshire | North Lincolnshire | York | North Yorkshire UA | Barnsley | Doncaster | Rotherham | Sheffield | Bradford | Calderdale | Kirklees | Leeds | Wakefield |
|---|---|---|---|---|---|---|---|---|---|---|---|---|---|---|---|---|---|---|
Mortality from cancer (Persons All ages) | 2019 - 23 | 100.0 | 105.6 | 130.3 | 99.2 | 114.6 | 105.5 | 101.6 | 93.2 | 114.8 | 113.9 | 112.0 | 107.8 | 101.5 | 104.4 | 102.8 | 106.0 | 111.5 |
Mortality from cancer (aged under 75) (Persons <75 yrs) | 2019 - 23 | 100.0 | 106.9 | 132.2 | 95.6 | 120.4 | 108.5 | 105.1 | 90.8 | 115.5 | 119.4 | 116.0 | 108.0 | 107.4 | 101.9 | 103.2 | 107.1 | 111.5 |
For deaths registered during 2023-25, the under 75 directly standardised mortality rate per 100,000 population (standardised to the European Standard Population) for Hull was 34% higher than England and was the highest amongst local authorities in Yorkshire and Humber.
Compared to England, the cancer mortality rates in Hull were around one-third higher for both men (39%) and women (29%).
Compared with benchmark
| Indicator | Period | England | Yorkshire and the Humber region (statistical) | Kingston upon Hull | East Riding of Yorkshire | North East Lincolnshire | North Lincolnshire | York | North Yorkshire UA | Barnsley | Doncaster | Rotherham | Sheffield | Bradford | Calderdale | Kirklees | Leeds | Wakefield |
|---|---|---|---|---|---|---|---|---|---|---|---|---|---|---|---|---|---|---|
Under 75 mortality rate from cancer (Persons <75 yrs) | 2023 - 25 | 117.7 | 126.6 | 157.6 | 113.5 | 145.5 | 135.9 | 113.2 | 104.0 | 141.4 | 143.1 | 142.0 | 130.8 | 130.3 | 125.7 | 116.3 | 125.9 | 131.0 |
Under 75 mortality rate from cancer (Male <75 yrs) | 2023 - 25 | 130.3 | 138.6 | 180.6 | 122.1 | 164.4 | 137.8 | 121.9 | 111.2 | 156.2 | 164.6 | 150.8 | 139.7 | 145.4 | 138.9 | 126.1 | 137.5 | 148.2 |
Under 75 mortality rate from cancer (Female <75 yrs) | 2023 - 25 | 106.0 | 115.4 | 135.3 | 105.2 | 127.6 | 134.2 | 105.2 | 97.2 | 127.3 | 122.6 | 133.8 | 122.5 | 115.9 | 113.3 | 106.9 | 115.5 | 114.8 |
There were 1,021 premature deaths from cancer among Hull residents that were registered during the three year period 2023-25.
Compared with benchmark
Under 75 mortality rate from cancer (Persons <75 yrs) 2023 - 25
| Area |
Recent
Trend |
Count
|
Value
|
95%
Lower CI |
95%
Upper CI |
|
|---|---|---|---|---|---|---|
| England | 175292 | 117.7 | 117.2 | 118.3 | ||
| Yorkshire and the Humber region (statistical) | 18753 | 126.6 | 124.8 | 128.4 | ||
| Kingston upon Hull | 1021 | 157.6 | 148.0 | 167.6 | ||
| East Riding of Yorkshire | 1331 | 113.5 | 107.4 | 119.8 | ||
| North East Lincolnshire | 663 | 145.5 | 134.6 | 157.1 | ||
| North Lincolnshire | 693 | 135.9 | 125.9 | 146.5 | ||
| York | 579 | 113.2 | 104.2 | 122.8 | ||
| North Yorkshire UA | 2146 | 104.0 | 99.6 | 108.5 | ||
| Barnsley | 989 | 141.4 | 132.7 | 150.6 | ||
| Doncaster | 1240 | 143.1 | 135.2 | 151.3 | ||
| Rotherham | 1038 | 142.0 | 133.5 | 150.9 | ||
| Sheffield | 1733 | 130.8 | 124.7 | 137.1 | ||
| Bradford | 1671 | 130.3 | 124.1 | 136.7 | ||
| Calderdale | 724 | 125.7 | 116.6 | 135.2 | ||
| Kirklees | 1314 | 116.3 | 110.1 | 122.7 | ||
| Leeds | 2328 | 125.9 | 120.8 | 131.2 | ||
| Wakefield | 1283 | 131.0 | 123.9 | 138.4 |
Source: OHID, based on Office for National Statistics data
Among men, there were 579 premature deaths from cancer among Hull residents that were registered during the three year period 2023-25.
The mortality rate was considerably higher than all other local authorities in the region for 2023-25, and the second highest in England.
Compared with benchmark
Under 75 mortality rate from cancer (Male <75 yrs) 2023 - 25
| Area |
Recent
Trend |
Count
|
Value
|
95%
Lower CI |
95%
Upper CI |
|
|---|---|---|---|---|---|---|
| England | 93804 | 130.3 | 129.5 | 131.2 | ||
| Yorkshire and the Humber region (statistical) | 10010 | 138.6 | 135.9 | 141.3 | ||
| Kingston upon Hull | 579 | 180.6 | 166.1 | 196.0 | ||
| East Riding of Yorkshire | 702 | 122.1 | 113.1 | 131.6 | ||
| North East Lincolnshire | 368 | 164.4 | 148.0 | 182.2 | ||
| North Lincolnshire | 346 | 137.8 | 123.6 | 153.2 | ||
| York | 301 | 121.9 | 108.5 | 136.5 | ||
| North Yorkshire UA | 1122 | 111.2 | 104.7 | 117.9 | ||
| Barnsley | 537 | 156.2 | 143.2 | 170.1 | ||
| Doncaster | 699 | 164.6 | 152.6 | 177.3 | ||
| Rotherham | 537 | 150.8 | 138.3 | 164.2 | ||
| Sheffield | 902 | 139.7 | 130.7 | 149.1 | ||
| Bradford | 910 | 145.4 | 136.1 | 155.2 | ||
| Calderdale | 387 | 138.9 | 125.3 | 153.4 | ||
| Kirklees | 695 | 126.1 | 116.9 | 135.9 | ||
| Leeds | 1219 | 137.5 | 129.8 | 145.5 | ||
| Wakefield | 706 | 148.2 | 137.4 | 159.6 |
Source: OHID, based on Office for National Statistics data
For women, there were 442 premature deaths from cancer among Hull residents that were registered during the three year period 2023-25, with Hull having the highest mortality rate among Yorkshire and Humber local authorities, and the seventh highest across England.
Compared with benchmark
Under 75 mortality rate from cancer (Female <75 yrs) 2023 - 25
| Area |
Recent
Trend |
Count
|
Value
|
95%
Lower CI |
95%
Upper CI |
|
|---|---|---|---|---|---|---|
| England | 81488 | 106.0 | 105.3 | 106.7 | ||
| Yorkshire and the Humber region (statistical) | 8743 | 115.4 | 112.9 | 117.8 | ||
| Kingston upon Hull | 442 | 135.3 | 122.9 | 148.5 | ||
| East Riding of Yorkshire | 629 | 105.2 | 97.0 | 113.8 | ||
| North East Lincolnshire | 295 | 127.6 | 113.3 | 143.1 | ||
| North Lincolnshire | 347 | 134.2 | 120.4 | 149.2 | ||
| York | 278 | 105.2 | 93.2 | 118.3 | ||
| North Yorkshire UA | 1024 | 97.2 | 91.3 | 103.5 | ||
| Barnsley | 452 | 127.3 | 115.8 | 139.7 | ||
| Doncaster | 541 | 122.6 | 112.4 | 133.4 | ||
| Rotherham | 501 | 133.8 | 122.3 | 146.1 | ||
| Sheffield | 831 | 122.5 | 114.3 | 131.1 | ||
| Bradford | 761 | 115.9 | 107.8 | 124.4 | ||
| Calderdale | 337 | 113.3 | 101.5 | 126.1 | ||
| Kirklees | 619 | 106.9 | 98.7 | 115.7 | ||
| Leeds | 1109 | 115.5 | 108.7 | 122.5 | ||
| Wakefield | 577 | 114.8 | 105.6 | 124.6 |
Source: OHID, based on Office for National Statistics data
The premature mortality rate from cancer in Hull has been consistently decreasing between 2001-03 and 2017-19 with a relatively sharp decrease between 2015-17 and 2016-18. Whilst the mortality rate decreased between 2017-19 and 2018-20 and increased between 2018-20 and 2019-21 in Hull, no such pattern was observed for either England or across the region. There were differences in the total number of deaths where cancer was the underlying cause of death or a secondary cause (see Causes of Deaths within Population for more information), although the number was higher in Hull in 2020-21 compared to 2018-19 which does not particularly explain the pattern in the mortality rate in Hull. It is possible that some cancers were diagnosed later during the pandemic which could influence the mortality rate. Hull also has higher rates of lung cancer compared to England which has a lower survival rate compare to cancers of other sites so the cancer site will influence the overall morality rate comparison. Since 2019-21 the trend in Hull appears relatively consistent with the trend until 2015-17, with small decreases annually.
Compared with benchmark
Under 75 mortality rate from cancer (Persons <75 yrs)
|
Period
|
Kingston upon Hull |
Yorkshire and the Humber region (statistical)
|
England
|
||||
|---|---|---|---|---|---|---|---|
|
Count
|
Value
|
95%
Lower CI |
95%
Upper CI |
||||
| 2001 - 03 | • | 1095 | 206.2 | 194.1 | 218.8 | 178.7 | 169.4 |
| 2002 - 04 | • | 1107 | 207.7 | 195.6 | 220.4 | 176.3 | 166.2 |
| 2003 - 05 | • | 1071 | 200.4 | 188.5 | 212.9 | 170.6 | 162.7 |
| 2004 - 06 | • | 1088 | 203.6 | 191.6 | 216.2 | 167.0 | 160.0 |
| 2005 - 07 | • | 1065 | 199.5 | 187.7 | 212.0 | 165.2 | 157.8 |
| 2006 - 08 | • | 1089 | 204.7 | 192.6 | 217.3 | 164.2 | 155.7 |
| 2007 - 09 | • | 1081 | 202.9 | 190.9 | 215.5 | 161.6 | 153.2 |
| 2008 - 10 | • | 1064 | 198.5 | 186.7 | 210.9 | 159.1 | 150.6 |
| 2009 - 11 | • | 1062 | 197.2 | 185.4 | 209.6 | 158.3 | 148.5 |
| 2010 - 12 | • | 1046 | 192.6 | 181.0 | 204.8 | 157.4 | 146.5 |
| 2011 - 13 | • | 1058 | 191.7 | 180.2 | 203.8 | 155.0 | 144.4 |
| 2012 - 14 | • | 1043 | 186.2 | 175.0 | 198.0 | 151.7 | 141.6 |
| 2013 - 15 | • | 1063 | 187.9 | 176.6 | 199.6 | 148.5 | 138.9 |
| 2014 - 16 | • | 1031 | 179.4 | 168.5 | 190.8 | 146.4 | 137.1 |
| 2015 - 17 | • | 1053 | 179.5 | 168.7 | 190.8 | 143.7 | 134.9 |
| 2016 - 18 | • | 963 | 159.9 | 149.9 | 170.4 | 141.4 | 132.7 |
| 2017 - 19 | • | 988 | 160.8 | 150.9 | 171.2 | 137.9 | 129.7 |
| 2018 - 20 | • | 979 | 156.2 | 146.5 | 166.3 | 136.0 | 127.6 |
| 2019 - 21 | • | 1062 | 166.7 | 156.8 | 177.0 | 133.5 | 124.8 |
| 2020 - 22 | • | 1062 | 165.4 | 155.5 | 175.6 | 132.4 | 123.2 |
| 2021 - 23 | • | 1037 | 161.3 | 151.6 | 171.5 | 130.1 | 121.5 |
| 2022 - 24 | • | 1037 | 161.0 | 151.3 | 171.1 | 128.4 | 120.3 |
| 2023 - 25 | • | 1021 | 157.6 | 148.0 | 167.6 | 126.6 | 117.7 |
Source: OHID, based on Office for National Statistics data
For men, there had been a decreasing trend in the premature cancer mortality rate between 2001-03 and 2021-23 although some year-on-year variability, but with small increases for the past three years.
The inequalities gap between Hull and England has remained relatively constant over time.
Compared with benchmark
Under 75 mortality rate from cancer (Male <75 yrs)
|
Period
|
Kingston upon Hull |
Yorkshire and the Humber region (statistical)
|
England
|
||||
|---|---|---|---|---|---|---|---|
|
Count
|
Value
|
95%
Lower CI |
95%
Upper CI |
||||
| 2001 - 03 | • | 645 | 253.7 | 234.4 | 274.1 | 206.0 | 193.6 |
| 2002 - 04 | • | 644 | 252.7 | 233.5 | 273.2 | 203.7 | 189.7 |
| 2003 - 05 | • | 615 | 239.4 | 220.7 | 259.2 | 195.2 | 184.7 |
| 2004 - 06 | • | 610 | 236.9 | 218.4 | 256.7 | 190.1 | 181.0 |
| 2005 - 07 | • | 587 | 227.6 | 209.4 | 247.0 | 185.2 | 177.7 |
| 2006 - 08 | • | 591 | 229.5 | 211.2 | 248.9 | 183.6 | 174.9 |
| 2007 - 09 | • | 597 | 230.4 | 212.1 | 249.8 | 180.3 | 171.8 |
| 2008 - 10 | • | 583 | 223.1 | 205.2 | 242.2 | 178.5 | 168.9 |
| 2009 - 11 | • | 572 | 219.3 | 201.4 | 238.2 | 178.1 | 166.3 |
| 2010 - 12 | • | 541 | 205.8 | 188.6 | 224.1 | 176.8 | 163.6 |
| 2011 - 13 | • | 564 | 210.3 | 193.1 | 228.7 | 173.7 | 160.9 |
| 2012 - 14 | • | 565 | 207.5 | 190.5 | 225.7 | 169.8 | 157.7 |
| 2013 - 15 | • | 573 | 209.3 | 192.3 | 227.5 | 166.8 | 155.0 |
| 2014 - 16 | • | 554 | 198.9 | 182.4 | 216.5 | 163.8 | 152.4 |
| 2015 - 17 | • | 578 | 201.0 | 184.8 | 218.3 | 160.8 | 150.0 |
| 2016 - 18 | • | 547 | 184.0 | 168.8 | 200.2 | 156.5 | 147.1 |
| 2017 - 19 | • | 570 | 186.9 | 171.8 | 203.0 | 154.0 | 143.9 |
| 2018 - 20 | • | 552 | 177.6 | 163.1 | 193.1 | 150.9 | 141.0 |
| 2019 - 21 | • | 593 | 187.3 | 172.5 | 203.1 | 147.8 | 137.7 |
| 2020 - 22 | • | 582 | 182.4 | 167.8 | 197.8 | 144.8 | 136.0 |
| 2021 - 23 | • | 569 | 178.4 | 164.0 | 193.8 | 142.0 | 134.2 |
| 2022 - 24 | • | 574 | 180.1 | 165.6 | 195.5 | 140.9 | 133.3 |
| 2023 - 25 | • | 579 | 180.6 | 166.1 | 196.0 | 138.6 | 130.3 |
Source: OHID, based on Office for National Statistics data
For women, the premature cancer mortality rate was 10% higher in Hull compared to England in 2001-03 but increased gradually to a difference of 32% in 2006-08. This relatively large inequalities gap was maintained until 2015-17, but there was a relatively sharp decrease in the mortality rate between 2015-17 and 2016-18. This narrowed the inequalities gap, and in 2016-18, the premature cancer mortality rate was 15% higher in Hull compared to England for women. However, the mortality rate subsequently increased to 34% higher than England in 2020-22, and has remained reasonably similar since (currently 28% higher among Hull women compare to women in England).
Compared with benchmark
Under 75 mortality rate from cancer (Female <75 yrs)
|
Period
|
Kingston upon Hull |
Yorkshire and the Humber region (statistical)
|
England
|
||||
|---|---|---|---|---|---|---|---|
|
Count
|
Value
|
95%
Lower CI |
95%
Upper CI |
||||
| 2001 - 03 | • | 450 | 162.7 | 148.0 | 178.5 | 154.8 | 147.9 |
| 2002 - 04 | • | 463 | 166.4 | 151.6 | 182.4 | 152.1 | 145.4 |
| 2003 - 05 | • | 456 | 164.3 | 149.5 | 180.1 | 148.7 | 143.0 |
| 2004 - 06 | • | 478 | 173.0 | 157.8 | 189.3 | 146.5 | 141.2 |
| 2005 - 07 | • | 478 | 174.0 | 158.6 | 190.3 | 147.3 | 139.7 |
| 2006 - 08 | • | 498 | 182.0 | 166.3 | 198.8 | 147.0 | 138.2 |
| 2007 - 09 | • | 484 | 177.2 | 161.7 | 193.8 | 144.8 | 136.3 |
| 2008 - 10 | • | 481 | 175.4 | 160.0 | 191.9 | 141.6 | 133.8 |
| 2009 - 11 | • | 490 | 177.1 | 161.6 | 193.6 | 140.4 | 132.1 |
| 2010 - 12 | • | 505 | 181.1 | 165.5 | 197.7 | 139.8 | 130.8 |
| 2011 - 13 | • | 494 | 174.8 | 159.6 | 191.0 | 138.0 | 129.2 |
| 2012 - 14 | • | 478 | 166.7 | 152.0 | 182.4 | 135.1 | 126.7 |
| 2013 - 15 | • | 490 | 168.5 | 153.8 | 184.2 | 131.5 | 124.1 |
| 2014 - 16 | • | 477 | 161.7 | 147.4 | 177.1 | 130.1 | 122.9 |
| 2015 - 17 | • | 475 | 159.3 | 145.2 | 174.3 | 127.7 | 121.0 |
| 2016 - 18 | • | 416 | 136.6 | 123.8 | 150.5 | 127.4 | 119.3 |
| 2017 - 19 | • | 418 | 135.2 | 122.5 | 148.8 | 122.7 | 116.5 |
| 2018 - 20 | • | 427 | 135.2 | 122.7 | 148.7 | 122.1 | 115.0 |
| 2019 - 21 | • | 469 | 146.5 | 133.6 | 160.4 | 120.0 | 112.7 |
| 2020 - 22 | • | 480 | 148.8 | 135.8 | 162.8 | 120.8 | 111.4 |
| 2021 - 23 | • | 468 | 144.6 | 131.8 | 158.4 | 118.9 | 109.7 |
| 2022 - 24 | • | 463 | 142.3 | 129.6 | 156.0 | 116.6 | 108.3 |
| 2023 - 25 | • | 442 | 135.3 | 122.9 | 148.5 | 115.4 | 106.0 |
Source: OHID, based on Office for National Statistics data
Mortality Rates Across Hull’s Wards
Using the local deaths from the local Primary Care Mortality Database and resident population estimates from the Office for National Statistics, it is possible to calculate the directly standardised mortality rate for all cancer deaths across Hull’s 21 electoral wards and across geographical areas within Hull based on deprivation (Index of Multiple Deprivation). Due the relatively small number of deaths at ward level, four years of data have been combined, and 95% confidence intervals are also given to illustrate the degree of uncertainty associated with the directly standardised mortality rate. The directly standardised mortality rates are given as the number of deaths per 100,000 population standardised to the European Standard Population so are comparable to the mortality rates on Fingertips albeit for a different period of time.
The directly standardised mortality rates for cancers which occurred under the age of 75 years registered during 2022-25 were highest in Central (250 deaths per 100,000 population), Marfleet (227), North Carr (223), St Andrew’s & Docklands (209) and Orchard Park (204), with the rates in each of these five wards statistically significantly higher than the Hull average (160 per 100,00 population). Under 75 mortality rates were statistically significantly lower than the Hull average for three wards, Bricknell (106 deaths per 100,000 population), Holderness (115) and West Carr (124).
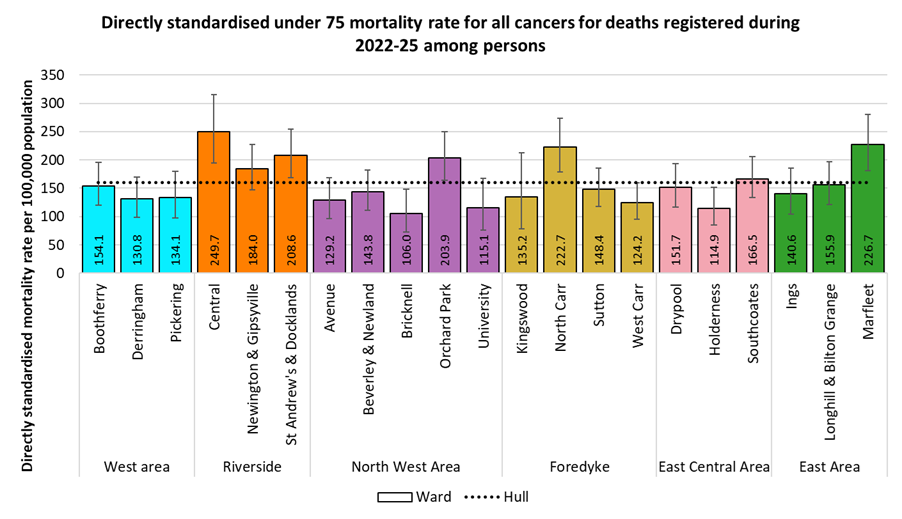
Among men aged under 75 years, the mortality rates for cancer were highest in Central (285 per 100,000 population), Orchard Park (250), Marfleet (235), North Carr (229) and Southcoates (200) with the rates in Central and Orchard Park statistically significantly higher than the Hull average (182 per 100,00 population). Under 75 mortality rates were statistically significantly lower than the Hull average for males in two wards, Holderness (120 deaths per 100,000 population) and West Carr (124).
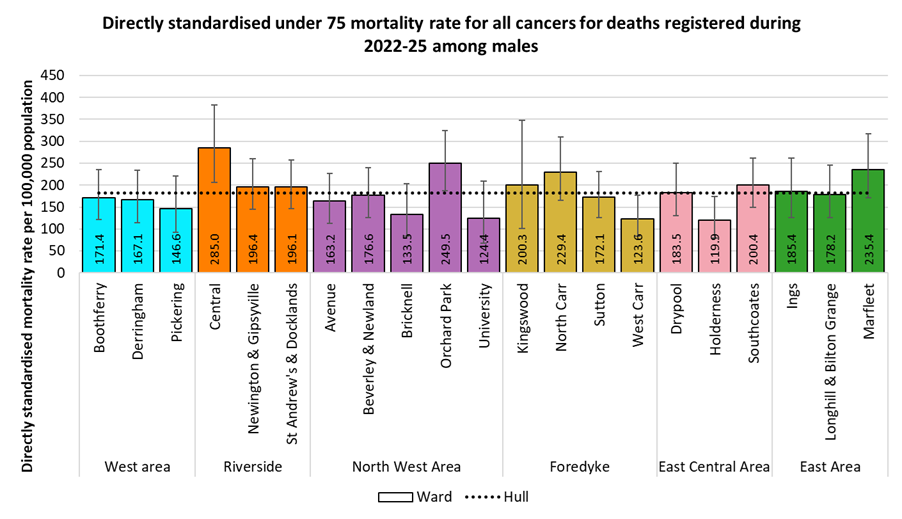
Premature mortality rates from cancer were highest in St Andrews & Docklands ward for women (223 per 100,000 population) with the next highest rates for North Carr (217), Marfleet (215), Central (213) and Newington & Gipsyville (166) with the rates in St Andrew’s & Docklands, North Carr, Marfleet and Central statistically significantly higher than the Hull average (138 per 100,00 population). The under 75 mortality rate was statistically significantly lower than the Hull average for females in just one ward, Bricknell (75 deaths per 100,000 population).
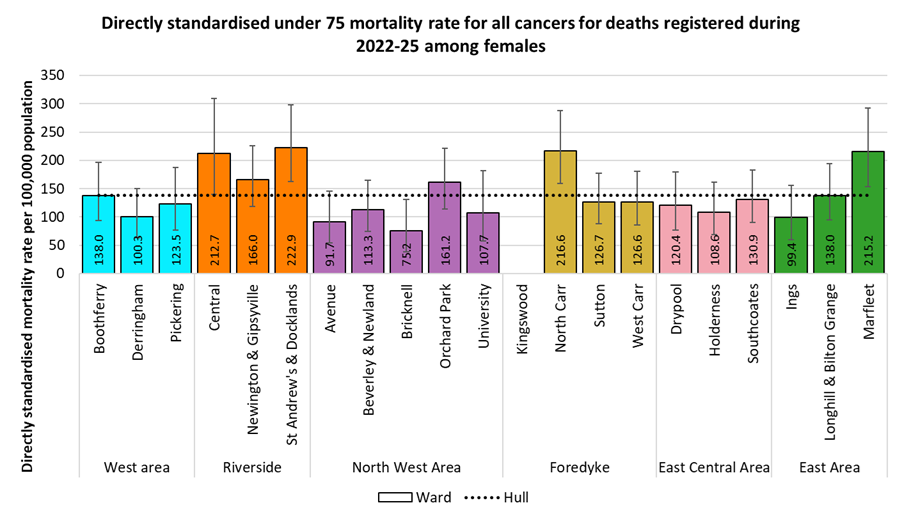
Again using data from the Primary Care Mortality Dataset for Hull, and the NOMIS tool for England, and mid-year population estimates from ONS, it is possible to calculate the cancer standardised mortality ratios (SMRs) for each electoral ward in Hull, both for all ages and for deaths under the age of 75 years. The data presented below relates to the same four- year period as above (2022-25) and the SMRs are given together with 95% confidence intervals. The SMRs are standardised to England so that any ratio above 100 denotes that the ward has a higher mortality rate for the specific age group compared to England, and a ratio below 100 denotes a lower mortality rate.
If the 95% confidence interval does not contain the value of 100, this means that the mortality rate for the ward is statistically significantly different from England after allowing for differences in the age structure between Hull and England.
Mortality rates from cancer for all ages are significantly higher in Hull compared to England for the vast majority of wards in Hull with only Bricknell ward not having a cancer mortality rate statistically significantly higher than England.
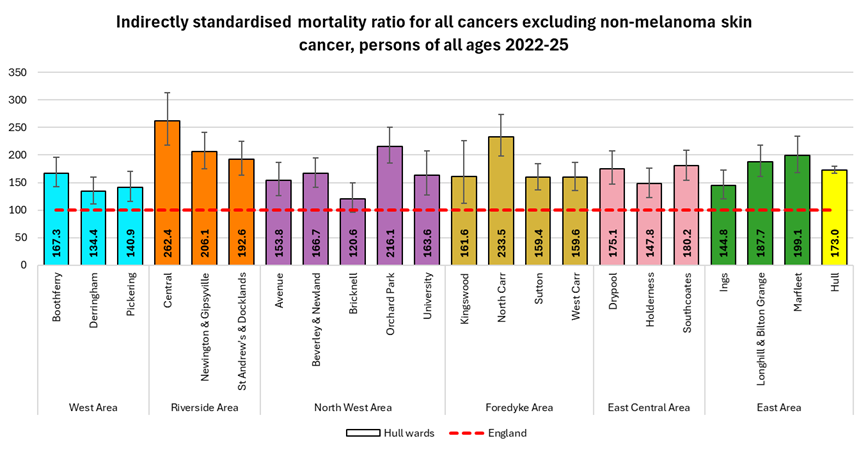
For deaths under the age of 75 years, the SMRs are significantly higher in Hull for the majority of Hull’s 21 wards. Only Bricknell, University, Holderness and Kingswood wards had cancer mortality rates that were not statistically significantly higher than England.
The differences in SMRs between wards were quite marked. Amongst the 17 wards with under 75 mortality rates significantly higher than England, the SMRs ranged between 140 for West Carr ward (that is 40% higher than England) to 275 for Central ward (almost three times higher than the rate for England). Central was one of six wards with premature cancer mortality rates more than double those for England, the others being North Carr, Marfleet, St Andrew’s & Docklands, Orchard Park and Newington & Gipsyville.
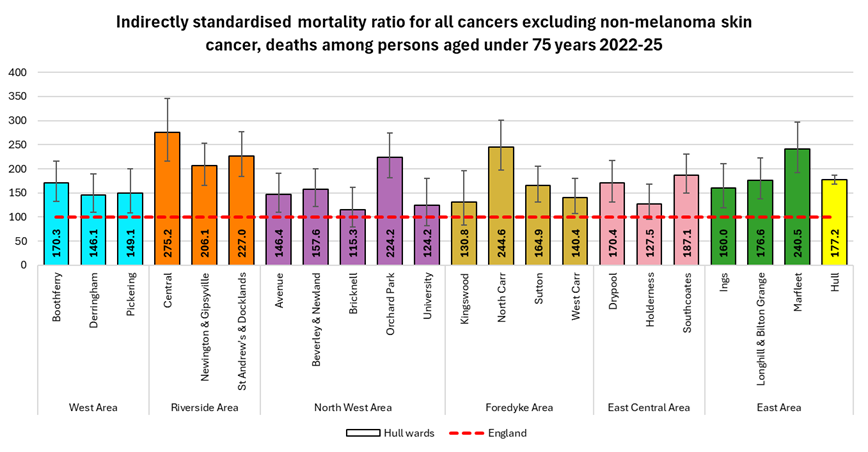
Mortality Rates By Local Deprivation Fifth
There was a large difference in the directly standardised mortality rates for cancer deaths occurring under the age of 75 years among people living in the most deprived fifth of areas compared to the least deprived fifth of areas of Hull with mortality rates 1.9 times higher in the most deprived fifth of areas of Hull (208 versus 107 deaths per 100,000 population).
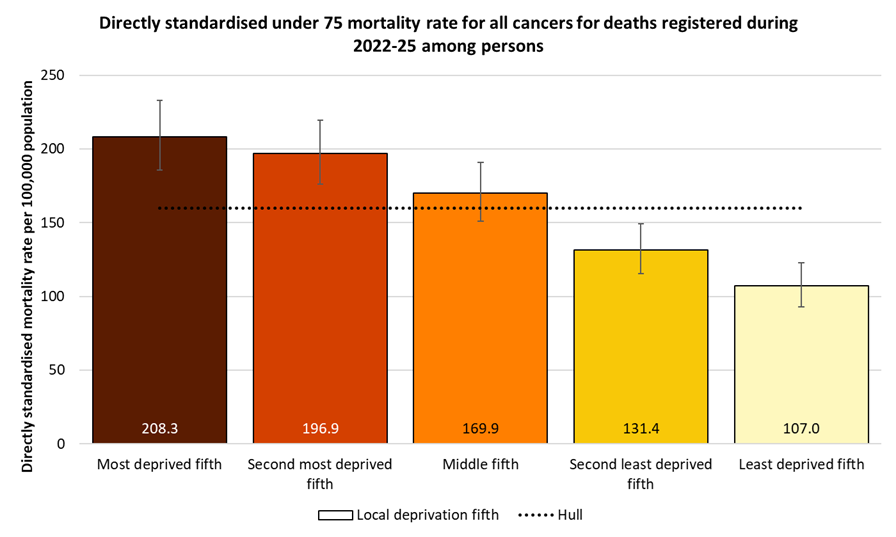
Similar differences between males living in the most deprived fifth of areas of Hull, and those living in the least deprived fifth of areas were also apparent, with males in the most deprived fifth of areas having a cancer mortality rate 1.7 times higher than males living in the most deprived fifth of areas of Hull (223 versus 129 per 100,000 population).
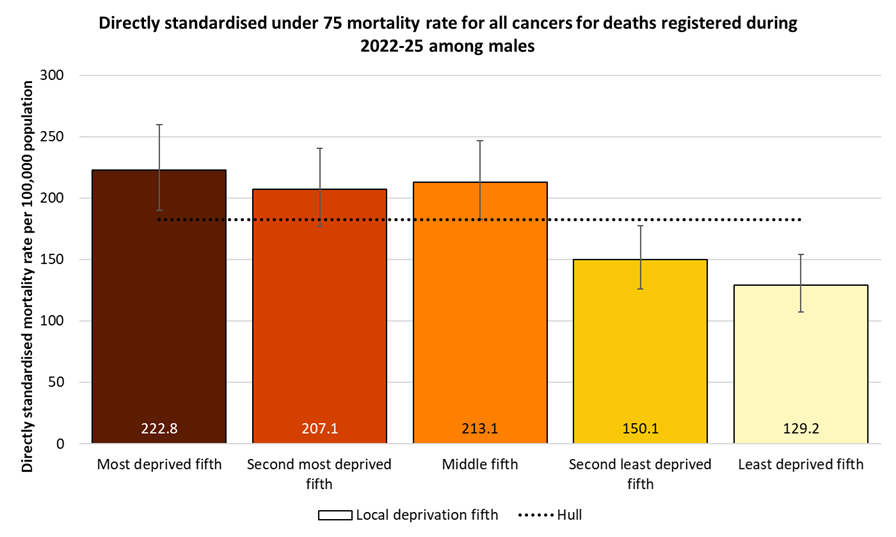
A larger difference was evident for females with the mortality rate 2.3 times higher among females living in the most deprived fifth of areas compared to the least deprived fifth of areas of Hull (193 versus 86 per 100,000 population).
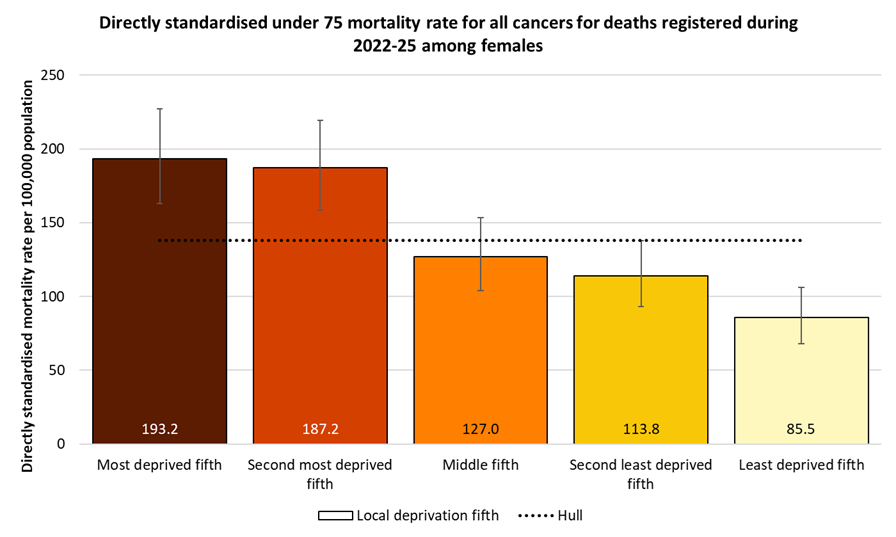
Cancers Considered Preventable
The Office for Health Improvement & Disparities’ Fingertips also gives the mortality rates for cancers that occur prior to the age of 75 years that are considered to be preventable.
For 2022-24, the under 75 standardised mortality rate is 34% higher in Hull than England, but the under 75 mortality rate from causes considered preventable is 51% higher in Hull. Thus, more of the premature cancer deaths in Hull are considered to be preventable.
Compared with benchmark
| Indicator | Period | England | Yorkshire and the Humber region (statistical) | Kingston upon Hull | East Riding of Yorkshire | North East Lincolnshire | North Lincolnshire | York | North Yorkshire UA | Barnsley | Doncaster | Rotherham | Sheffield | Bradford | Calderdale | Kirklees | Leeds | Wakefield |
|---|---|---|---|---|---|---|---|---|---|---|---|---|---|---|---|---|---|---|
Under 75 mortality rate from cancer considered preventable (Persons <75 yrs) | 2022 - 24 | 48.6 | 54.3 | 73.4 | 43.7 | 61.3 | 59.8 | 46.1 | 41.4 | 63.1 | 68.7 | 59.4 | 53.3 | 60.0 | 56.1 | 53.9 | 51.2 | 57.2 |
Under 75 mortality rate from cancer considered preventable (Male <75 yrs) | 2022 - 24 | 61.1 | 66.6 | 87.9 | 53.6 | 73.9 | 74.1 | 54.5 | 52.0 | 79.3 | 82.2 | 72.9 | 65.5 | 73.3 | 65.5 | 66.9 | 65.0 | 66.5 |
Under 75 mortality rate from cancer considered preventable (Female <75 yrs) | 2022 - 24 | 36.9 | 42.7 | 59.2 | 34.3 | 49.5 | 46.1 | 38.3 | 31.4 | 47.5 | 55.7 | 46.7 | 41.7 | 47.3 | 47.2 | 41.5 | 38.3 | 48.4 |
Of the 1,037 cancer deaths under the age of 75 years which were registered during 2022-24, 468 (45%) of them were considered to be preventable.
Compared with benchmark
Under 75 mortality rate from cancer considered preventable (Persons <75 yrs) 2022 - 24
| Area |
Recent
Trend |
Count
|
Value
|
95%
Lower CI |
95%
Upper CI |
|
|---|---|---|---|---|---|---|
| England | 71743 | 48.6 | 48.2 | 49.0 | ||
| Yorkshire and the Humber region (statistical) | 8015 | 54.3 | 53.2 | 55.5 | ||
| Kingston upon Hull | 468 | 73.4 | 66.9 | 80.4 | ||
| East Riding of Yorkshire | 521 | 43.7 | 40.0 | 47.7 | ||
| North East Lincolnshire | 278 | 61.3 | 54.3 | 69.0 | ||
| North Lincolnshire | 311 | 59.8 | 53.3 | 66.8 | ||
| York | 236 | 46.1 | 40.4 | 52.4 | ||
| North Yorkshire UA | 857 | 41.4 | 38.6 | 44.3 | ||
| Barnsley | 439 | 63.1 | 57.3 | 69.3 | ||
| Doncaster | 594 | 68.7 | 63.2 | 74.4 | ||
| Rotherham | 435 | 59.4 | 54.0 | 65.3 | ||
| Sheffield | 698 | 53.3 | 49.4 | 57.4 | ||
| Bradford | 755 | 60.0 | 55.8 | 64.4 | ||
| Calderdale | 325 | 56.1 | 50.1 | 62.5 | ||
| Kirklees | 606 | 53.9 | 49.7 | 58.4 | ||
| Leeds | 931 | 51.2 | 47.9 | 54.6 | ||
| Wakefield | 558 | 57.2 | 52.6 | 62.2 |
Source: OHID, based on Office for National Statistics data
For men, of the 574 cancer deaths under the age of 75 years which were registered during 2022-24, 278 (48%) of them were considered to be preventable.
Compared with benchmark
Under 75 mortality rate from cancer considered preventable (Male <75 yrs) 2022 - 24
| Area |
Recent
Trend |
Count
|
Value
|
95%
Lower CI |
95%
Upper CI |
|
|---|---|---|---|---|---|---|
| England | 43621 | 61.1 | 60.5 | 61.7 | ||
| Yorkshire and the Humber region (statistical) | 4789 | 66.6 | 64.7 | 68.5 | ||
| Kingston upon Hull | 278 | 87.9 | 77.8 | 98.9 | ||
| East Riding of Yorkshire | 312 | 53.6 | 47.8 | 60.0 | ||
| North East Lincolnshire | 164 | 73.9 | 63.0 | 86.1 | ||
| North Lincolnshire | 189 | 74.1 | 63.9 | 85.5 | ||
| York | 134 | 54.5 | 45.7 | 64.6 | ||
| North Yorkshire UA | 526 | 52.0 | 47.6 | 56.7 | ||
| Barnsley | 271 | 79.3 | 70.1 | 89.3 | ||
| Doncaster | 348 | 82.2 | 73.8 | 91.4 | ||
| Rotherham | 260 | 72.9 | 64.3 | 82.3 | ||
| Sheffield | 418 | 65.5 | 59.4 | 72.1 | ||
| Bradford | 452 | 73.3 | 66.6 | 80.4 | ||
| Calderdale | 184 | 65.5 | 56.3 | 75.6 | ||
| Kirklees | 367 | 66.9 | 60.3 | 74.2 | ||
| Leeds | 570 | 65.0 | 59.8 | 70.6 | ||
| Wakefield | 316 | 66.5 | 59.4 | 74.3 |
Source: OHID, based on Office for National Statistics data
For women, of the 463 cancer deaths under the age of 75 years which were registered during 2022-24, 190 (41%) of them were considered to be preventable.
Compared with benchmark
Under 75 mortality rate from cancer considered preventable (Female <75 yrs) 2022 - 24
| Area |
Recent
Trend |
Count
|
Value
|
95%
Lower CI |
95%
Upper CI |
|
|---|---|---|---|---|---|---|
| England | 28122 | 36.9 | 36.5 | 37.3 | ||
| Yorkshire and the Humber region (statistical) | 3226 | 42.7 | 41.2 | 44.2 | ||
| Kingston upon Hull | 190 | 59.2 | 51.1 | 68.3 | ||
| East Riding of Yorkshire | 209 | 34.3 | 29.8 | 39.3 | ||
| North East Lincolnshire | 114 | 49.5 | 40.8 | 59.5 | ||
| North Lincolnshire | 122 | 46.1 | 38.3 | 55.1 | ||
| York | 102 | 38.3 | 31.2 | 46.5 | ||
| North Yorkshire UA | 331 | 31.4 | 28.1 | 35.0 | ||
| Barnsley | 168 | 47.5 | 40.6 | 55.3 | ||
| Doncaster | 246 | 55.7 | 49.0 | 63.1 | ||
| Rotherham | 175 | 46.7 | 40.1 | 54.2 | ||
| Sheffield | 280 | 41.7 | 36.9 | 46.9 | ||
| Bradford | 303 | 47.3 | 42.1 | 52.9 | ||
| Calderdale | 141 | 47.2 | 39.7 | 55.7 | ||
| Kirklees | 239 | 41.5 | 36.4 | 47.1 | ||
| Leeds | 361 | 38.3 | 34.5 | 42.5 | ||
| Wakefield | 242 | 48.4 | 42.5 | 55.0 |
Source: OHID, based on Office for National Statistics data
The premature mortality from cancer considered to be preventable has gradually decreased in Hull between 2001-03 and 2022-24 albeit with some year-on-year variability.
Compared with benchmark
Under 75 mortality rate from cancer considered preventable (Persons <75 yrs)
|
Period
|
Kingston upon Hull |
Yorkshire and the Humber region (statistical)
|
England
|
||||
|---|---|---|---|---|---|---|---|
|
Count
|
Value
|
95%
Lower CI |
95%
Upper CI |
||||
| 2001 - 03 | • | 562 | 106.9 | 98.2 | 116.1 | 78.1 | 69.6 |
| 2002 - 04 | • | 560 | 106.4 | 97.8 | 115.6 | 77.4 | 68.3 |
| 2003 - 05 | • | 554 | 104.9 | 96.3 | 114.0 | 74.7 | 67.0 |
| 2004 - 06 | • | 565 | 106.8 | 98.2 | 116.1 | 74.0 | 66.3 |
| 2005 - 07 | • | 535 | 101.5 | 93.1 | 110.6 | 73.7 | 65.9 |
| 2006 - 08 | • | 541 | 103.4 | 94.8 | 112.5 | 73.1 | 65.6 |
| 2007 - 09 | • | 540 | 103.3 | 94.7 | 112.4 | 72.4 | 65.2 |
| 2008 - 10 | • | 554 | 104.7 | 96.1 | 113.9 | 71.2 | 64.5 |
| 2009 - 11 | • | 560 | 105.2 | 96.6 | 114.4 | 71.6 | 64.0 |
| 2010 - 12 | • | 529 | 98.6 | 90.3 | 107.5 | 70.9 | 63.2 |
| 2011 - 13 | • | 528 | 97.0 | 88.8 | 105.7 | 70.1 | 62.6 |
| 2012 - 14 | • | 510 | 92.0 | 84.1 | 100.4 | 68.2 | 61.4 |
| 2013 - 15 | • | 530 | 94.9 | 86.9 | 103.4 | 66.9 | 60.2 |
| 2014 - 16 | • | 513 | 90.4 | 82.6 | 98.6 | 65.0 | 58.9 |
| 2015 - 17 | • | 520 | 89.9 | 82.3 | 98.0 | 63.3 | 57.5 |
| 2016 - 18 | • | 474 | 79.6 | 72.5 | 87.1 | 61.4 | 56.0 |
| 2017 - 19 | • | 477 | 78.5 | 71.6 | 85.8 | 60.0 | 54.3 |
| 2018 - 20 | • | 451 | 72.6 | 66.1 | 79.7 | 58.9 | 52.9 |
| 2019 - 21 | • | 483 | 76.4 | 69.7 | 83.5 | 58.1 | 51.5 |
| 2020 - 22 | • | 475 | 74.4 | 67.9 | 81.4 | 57.1 | 50.5 |
| 2021 - 23 | • | 481 | 75.3 | 68.7 | 82.4 | 56.2 | 49.5 |
| 2022 - 24 | • | 468 | 73.4 | 66.9 | 80.4 | 54.3 | 48.6 |
Source: OHID, based on Office for National Statistics data
This gradual decrease with some year-on-year variability has occurred for men.
Compared with benchmark
Under 75 mortality rate from cancer considered preventable (Male <75 yrs)
|
Period
|
Kingston upon Hull |
Yorkshire and the Humber region (statistical)
|
England
|
||||
|---|---|---|---|---|---|---|---|
|
Count
|
Value
|
95%
Lower CI |
95%
Upper CI |
||||
| 2001 - 03 | • | 367 | 145.9 | 131.3 | 161.7 | 104.7 | 95.5 |
| 2002 - 04 | • | 358 | 143.0 | 128.5 | 158.6 | 102.8 | 93.1 |
| 2003 - 05 | • | 348 | 137.0 | 122.9 | 152.2 | 97.8 | 90.6 |
| 2004 - 06 | • | 354 | 138.0 | 123.9 | 153.2 | 96.0 | 88.8 |
| 2005 - 07 | • | 337 | 131.1 | 117.4 | 146.0 | 94.9 | 87.6 |
| 2006 - 08 | • | 342 | 135.0 | 121.0 | 150.2 | 93.6 | 86.4 |
| 2007 - 09 | • | 335 | 131.8 | 118.0 | 146.9 | 92.2 | 85.6 |
| 2008 - 10 | • | 331 | 129.4 | 115.8 | 144.3 | 89.8 | 84.3 |
| 2009 - 11 | • | 321 | 124.6 | 111.2 | 139.2 | 90.6 | 83.2 |
| 2010 - 12 | • | 292 | 112.4 | 99.7 | 126.2 | 89.4 | 81.7 |
| 2011 - 13 | • | 303 | 113.9 | 101.3 | 127.7 | 88.5 | 80.7 |
| 2012 - 14 | • | 299 | 110.7 | 98.4 | 124.2 | 86.0 | 79.1 |
| 2013 - 15 | • | 316 | 116.4 | 103.7 | 130.2 | 84.3 | 77.3 |
| 2014 - 16 | • | 309 | 111.8 | 99.5 | 125.2 | 81.5 | 75.1 |
| 2015 - 17 | • | 315 | 110.8 | 98.8 | 123.9 | 79.3 | 73.2 |
| 2016 - 18 | • | 299 | 101.6 | 90.3 | 113.8 | 76.7 | 71.1 |
| 2017 - 19 | • | 289 | 95.6 | 84.8 | 107.3 | 75.4 | 69.0 |
| 2018 - 20 | • | 275 | 89.2 | 79.0 | 100.5 | 73.7 | 66.9 |
| 2019 - 21 | • | 301 | 95.7 | 85.2 | 107.2 | 72.4 | 65.0 |
| 2020 - 22 | • | 296 | 93.2 | 82.8 | 104.4 | 70.0 | 63.6 |
| 2021 - 23 | • | 296 | 93.3 | 82.9 | 104.6 | 68.7 | 62.2 |
| 2022 - 24 | • | 278 | 87.9 | 77.8 | 98.9 | 66.6 | 61.1 |
Source: OHID, based on Office for National Statistics data
Among women, the premature mortality from cancer considered to be preventable increased quite sharply between 2001-03 and 2009-11, before gradually decreasing between 2009-11 and 2016-18 with no substantial changes between 2016-18 and 2020-22. However, there has been an increase in the last couple of years.
Compared with benchmark
Under 75 mortality rate from cancer considered preventable (Female <75 yrs)
|
Period
|
Kingston upon Hull |
Yorkshire and the Humber region (statistical)
|
England
|
||||
|---|---|---|---|---|---|---|---|
|
Count
|
Value
|
95%
Lower CI |
95%
Upper CI |
||||
| 2001 - 03 | • | 194 | 70.3 | 60.7 | 80.9 | 54.1 | 46.1 |
| 2002 - 04 | • | 201 | 72.4 | 62.7 | 83.1 | 54.5 | 45.6 |
| 2003 - 05 | • | 205 | 74.6 | 64.7 | 85.6 | 53.7 | 45.2 |
| 2004 - 06 | • | 210 | 77.2 | 67.1 | 88.4 | 54.0 | 45.5 |
| 2005 - 07 | • | 198 | 73.5 | 63.6 | 84.5 | 54.2 | 45.8 |
| 2006 - 08 | • | 198 | 73.7 | 63.8 | 84.7 | 54.4 | 46.2 |
| 2007 - 09 | • | 205 | 76.3 | 66.2 | 87.5 | 54.0 | 46.1 |
| 2008 - 10 | • | 222 | 81.6 | 71.2 | 93.1 | 54.1 | 46.1 |
| 2009 - 11 | • | 238 | 87.1 | 76.3 | 98.9 | 54.0 | 46.1 |
| 2010 - 12 | • | 237 | 86.0 | 75.3 | 97.7 | 53.7 | 45.9 |
| 2011 - 13 | • | 224 | 81.0 | 70.7 | 92.3 | 52.9 | 45.6 |
| 2012 - 14 | • | 210 | 74.2 | 64.4 | 85.0 | 51.6 | 44.9 |
| 2013 - 15 | • | 213 | 74.5 | 64.8 | 85.3 | 50.5 | 44.2 |
| 2014 - 16 | • | 204 | 70.0 | 60.7 | 80.4 | 49.4 | 43.6 |
| 2015 - 17 | • | 205 | 69.8 | 60.5 | 80.0 | 48.1 | 42.8 |
| 2016 - 18 | • | 175 | 58.1 | 49.8 | 67.4 | 46.9 | 41.8 |
| 2017 - 19 | • | 188 | 61.6 | 53.1 | 71.0 | 45.3 | 40.4 |
| 2018 - 20 | • | 176 | 56.2 | 48.2 | 65.2 | 44.8 | 39.6 |
| 2019 - 21 | • | 182 | 57.3 | 49.2 | 66.2 | 44.6 | 38.9 |
| 2020 - 22 | • | 179 | 56.0 | 48.1 | 64.8 | 44.9 | 38.3 |
| 2021 - 23 | • | 185 | 57.7 | 49.7 | 66.7 | 44.4 | 37.6 |
| 2022 - 24 | • | 190 | 59.2 | 51.1 | 68.3 | 42.7 | 36.9 |
Source: OHID, based on Office for National Statistics data
Cancer Deaths Considered Preventable By Hull Wards
There was a two-fold difference in the directly standardised mortality rate for cancers considered to be preventable that occurred under the age of 75 years in Hull for deaths which were registered during 2022-25.
The highest rates occurred in Central (144 deaths per 100,000 population), St Andrew’s & Docklands (119), Marfleet (103), Orchard Park (99) and Newington & Gipsyville (88), with the rate statistically significantly higher than the Hull average (77 deaths per 100,000 population) for Central, St Andrew’s & Docklands and Marfleet wards.
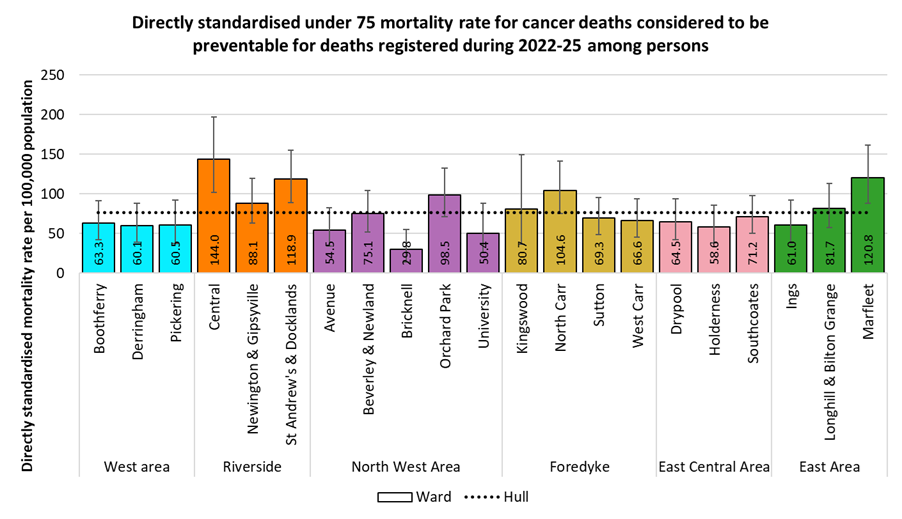
Among males, the highest mortality rates were found in Central (181 per 100,000 population), Orchard Park (125), St Andrew’s & Docklands (124), Marfleet (116) and Sutton (112), although only the rate for Central ward was statistically significantly higher than the Hull average (93 deaths per 100,000 population). There were fewer than 10 male deaths in Bricknell, Kingswood and University wards from cancers considered preventable, so no rates could be produced for these wards.
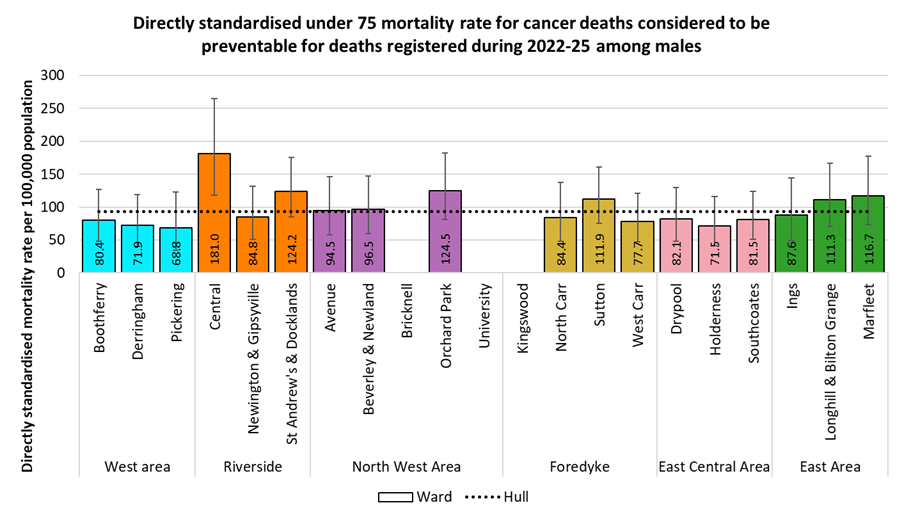
Among females, the highest mortality rates from cancers considered preventable occurred within Marfleet (124 per 100,000 population), North Carr (122), St Andrew’s & Docklands (112), Central (103) and Newington & Gipsyville (88), with the rates for Marfleet, North Carr and St Andrew’s & Docklands statistically significantly higher than the Hull average (61 per 100,000 population). Central, Marfleet, North Carr and St Andrew’s & Docklands also had the highest under 75 mortality rates among females for all cancer deaths registered during 2022-25.
There were fewer than 10 female deaths from cancers considered preventable for Avenue, Bricknell, University, Kingswood, Sutton, Drypool and Ings wards registered within the four-year period and it was not possible to calculate reliable estimates of the directly standardised mortality rates for these wards.
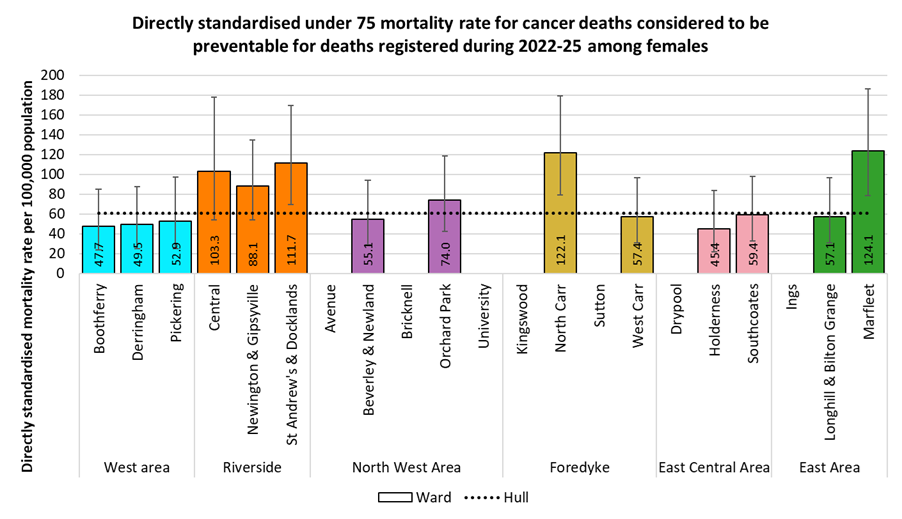
Cancer Deaths Considered Preventable By Local Deprivation Fifth
Across the different areas of Hull based on deprivation, there were large differences in the directly standardised mortality rate for deaths from cancers considered preventable that occurred under the age of 75 years and were registered during 2022-25. At 111 deaths per 100,000 population among people who lived in the most deprived fifth of areas of Hull compared to 50 deaths per 100,000 population among people who lived in the least deprived fifth of areas of Hull, the mortality rate was 2.2 times higher among people living in the most deprived fifth of areas of Hull.
The relative difference between the most and least deprived areas of Hull was greater for deaths from cancers considered preventable than it was for all cancer deaths under the age of 75 years.
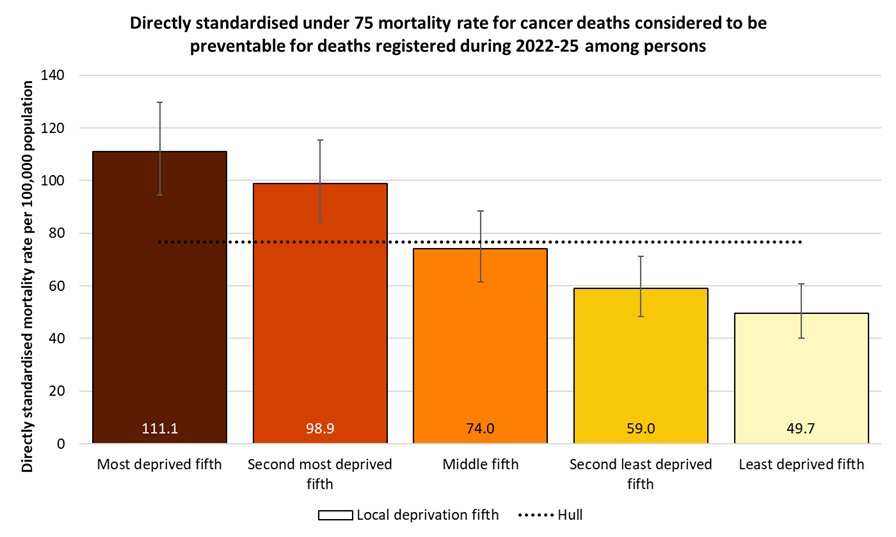
A similar pattern of mortality across the local deprivation fifths occurred for males with a wide difference in the mortality rates between the most and least deprived fifth of areas of Hull (122 versus 72 per 100,000 population). The mortality rate was 1.7 times higher among males living in the most deprived fifth of areas of Hull.
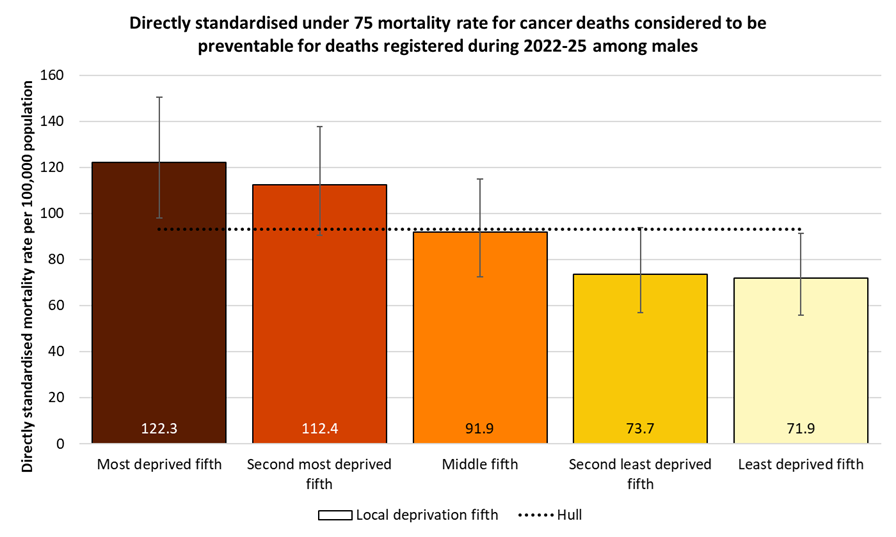
For women, the differences were even more marked with the mortality rate being 3.5 times higher among females living in the most deprived fifth of areas of Hull. The directly standardised mortality rate was 100 per 100,000 population among females living in the most deprived areas of Hull compared to 28 per 100,000 population among those resident in the least deprived areas of Hull.
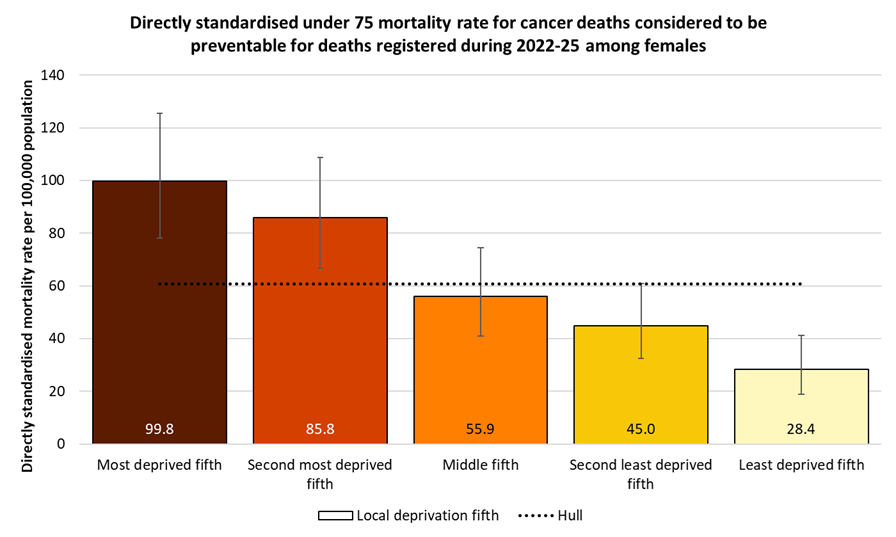
Deaths by Cancer Site
From the Primary Care Mortality Dataset, the number of deaths from different cancer sites for males and females are given for the three year period 2023-25.
Over this three year period, there were 1,168 cancer deaths among men and 948 cancer deaths among women. The highest proportion were lung cancer deaths for both men (25%) and women (28%) followed by breast cancer deaths for women (12%), prostate cancer deaths for men (11%), and colorectal deaths for men (11%) and women (10%).
| Cancer site | ICD 10 code | Males | Females | Persons |
| Oesophagus | C15 | 71 | 19 | 90 |
| Stomach | C16 | 48 | 13 | 61 |
| Colorectal | C18-C20 | 129 | 96 | 225 |
| Liver and intrahepatic bile ducts | C22 | 47 | 29 | 76 |
| Pancreas | C25 | 70 | 50 | 120 |
| Trachea, bronchus and lung | C33-C34 | 295 | 268 | 563 |
| Malignant melanoma of skin | C43 | 9 | 17 | 26 |
| Breast | C50 | 111 | ||
| Cervix uteri | C53 | 18 | ||
| Uterus | C54-C55 | 29 | ||
| Ovary | C56-C57 | 42 | ||
| Prostate | C61 | 133 | ||
| Kidney, except renal pelvis | C64 | 30 | 17 | 47 |
| Bladder | C67 | 48 | 17 | 65 |
| Multiple myeloma and plasma cell neoplasms | C90 | 18 | 14 | 32 |
| Leukaemia | C91-C95 | 33 | 14 | 47 |
| All cancers | C00-C97 excl C44 | 1,168 | 948 | 2,116 |
Using data from the Primary Care Mortality Dataset for Hull, and the NOMIS tool for England, and mid-year population estimates from ONS, the table below gives the standardised mortality rate for Hull for deaths occurring during 2023-25, alongside the mortality rate for England for deaths during 2022-24 (the most recent period available for England at time of editing). In each case, the mortality rates are age-standardised, in order to adjust for the differing age structures of the populations of Hull and England. The rates are given as the number of cancers deaths occurring over the three year period per 100,000 person-years . For most cancers, the numbers are relatively small so it is not possible to examine mortality rate for males and females separately.
The all-age mortality rates in Hull are more than 20% higher than those of England for cancer of the lung (79%), stomach (74%), bladder (34%), pancreas (25%) and kidney (23%). The mortality rate from malignant melanoma was lower in Hull.
Overall, the directly standardised mortality rate from cancer was 31% higher in Hull compared to England (29% for males and 33% for women).
| Cancer site | ICD 10 code | Gender | Hull | England |
| (2023-25) | (2022-24) | |||
| Oesophagus | C15 | Persons | 13.5 | 11.4 |
| Stomach | C16 | Persons | 9.1 | 5.2 |
| Colorectal | C18-C20 | Males | 42.9 | 31.3 |
| Colorectal | C18-C20 | Females | 26.5 | 20.8 |
| Colorectal | C18-C20 | Persons | 34.3 | 25.5 |
| Liver and intrahepatic bile ducts | C22 | Persons | 11.2 | 9.2 |
| Pancreas | C25 | Persons | 18.3 | 15.2 |
| Trachea, bronchus and lung | C33-C34 | Males | 96.3 | 53.2 |
| Trachea, bronchus and lung | C33-C34 | Females | 76.0 | 41.2 |
| Trachea, bronchus and lung | C33-C34 | Persons | 84.8 | 46.4 |
| Malignant melanoma of skin | C43 | Persons | 3.8 | 3.9 |
| Breast | C50 | Females | 30.8 | 30.3 |
| Uterus | C54-C55 | Females | 8.0 | 7.1 |
| Ovary | C56-C57 | Females | 11.7 | 11.4 |
| Prostate | C61 | Males | 50.8 | 43.0 |
| Kidney, except renal pelvis | C64 | Persons | 6.9 | 6.1 |
| Bladder | C67 | Persons | 10.3 | 8.6 |
| Multiple myeloma and plasma cell neoplasms | C90 | Persons | 4.9 | 4.7 |
| Leukaemia | C91-C95 | Persons | 6.9 | 7.5 |
| All cancers | C00-C97 excl C44 | Males | 391.6 | 293.7 |
| All cancers | C00-C97 excl C44 | Females | 265.3 | 208.2 |
| All cancers | C00-C97 excl C44 | Persons | 320.1 | 244.8 |
Lung Cancer
For deaths registered during 2022-24, compared to England, mortality rates from lung cancer (all deaths at any age) were 79% higher in Hull.
Compared with benchmark
| Indicator | Period | England | Yorkshire and the Humber region (statistical) | Kingston upon Hull | East Riding of Yorkshire | North East Lincolnshire | North Lincolnshire | York | North Yorkshire UA | Barnsley | Doncaster | Rotherham | Sheffield | Bradford | Calderdale | Kirklees | Leeds | Wakefield |
|---|---|---|---|---|---|---|---|---|---|---|---|---|---|---|---|---|---|---|
Mortality rate from lung cancer, all ages (Persons All ages) | 2022 - 24 | 46.4 | 54.9 | 83.0 | 45.6 | 63.9 | 53.8 | 43.4 | 39.2 | 64.9 | 67.6 | 57.4 | 58.4 | 57.5 | 57.3 | 56.1 | 53.3 | 59.8 |
Mortality rate from lung cancer, all ages (Male All ages) | 2022 - 24 | 53.2 | 61.5 | 93.3 | 51.4 | 75.5 | 67.5 | 43.8 | 43.2 | 74.6 | 76.9 | 61.6 | 66.9 | 63.7 | 63.8 | 63.3 | 59.7 | 63.3 |
Mortality rate from lung cancer, all ages (Female All ages) | 2022 - 24 | 41.2 | 49.8 | 75.5 | 41.1 | 54.3 | 42.2 | 44.0 | 36.3 | 56.4 | 60.9 | 53.8 | 51.7 | 52.6 | 52.5 | 50.6 | 48.4 | 57.8 |
There were 546 deaths from lung cancer among Hull residents that were registered during 2022-24 (281 men and 265 women).
It can be seen that the mortality rate from lung cancer is statistically significantly higher than all the other local authorities in the region. The mortality rate is the third highest among upper-tier local authorities in England (out of 151), and is the second highest for men and the fifth highest for women.
Compared with benchmark
Mortality rate from lung cancer, all ages (Persons All ages) 2022 - 24
| Area |
Recent
Trend |
Count
|
Value
|
95%
Lower CI |
95%
Upper CI |
|
|---|---|---|---|---|---|---|
| England | 78794 | 46.4 | 46.1 | 46.8 | ||
| Yorkshire and the Humber region (statistical) | 9226 | 54.9 | 53.8 | 56.0 | ||
| Kingston upon Hull | 546 | 83.0 | 76.1 | 90.2 | ||
| East Riding of Yorkshire | 663 | 45.6 | 42.2 | 49.2 | ||
| North East Lincolnshire | 336 | 63.9 | 57.2 | 71.1 | ||
| North Lincolnshire | 322 | 53.8 | 48.1 | 60.1 | ||
| York | 272 | 43.4 | 38.3 | 48.9 | ||
| North Yorkshire UA | 980 | 39.2 | 36.8 | 41.8 | ||
| Barnsley | 499 | 64.9 | 59.3 | 70.9 | ||
| Doncaster | 649 | 67.6 | 62.5 | 73.0 | ||
| Rotherham | 476 | 57.4 | 52.3 | 62.8 | ||
| Sheffield | 897 | 58.4 | 54.6 | 62.4 | ||
| Bradford | 778 | 57.5 | 53.5 | 61.6 | ||
| Calderdale | 361 | 57.3 | 51.5 | 63.5 | ||
| Kirklees | 700 | 56.1 | 52.0 | 60.4 | ||
| Leeds | 1095 | 53.3 | 50.2 | 56.5 | ||
| Wakefield | 652 | 59.8 | 55.3 | 64.6 |
Source: OHID, based on Office for National Statistics data
Mortality rate from lung cancer, all ages (Male All ages) 2022 - 24
| Area |
Recent
Trend |
Count
|
Value
|
95%
Lower CI |
95%
Upper CI |
|
|---|---|---|---|---|---|---|
| England | 40905 | 53.2 | 52.7 | 53.7 | ||
| Yorkshire and the Humber region (statistical) | 4699 | 61.5 | 59.7 | 63.3 | ||
| Kingston upon Hull | 281 | 93.3 | 82.4 | 105.2 | ||
| East Riding of Yorkshire | 341 | 51.4 | 46.0 | 57.2 | ||
| North East Lincolnshire | 184 | 75.5 | 64.9 | 87.2 | ||
| North Lincolnshire | 188 | 67.5 | 58.1 | 77.9 | ||
| York | 121 | 43.8 | 36.3 | 52.4 | ||
| North Yorkshire UA | 496 | 43.2 | 39.5 | 47.3 | ||
| Barnsley | 266 | 74.6 | 65.7 | 84.3 | ||
| Doncaster | 337 | 76.9 | 68.8 | 85.7 | ||
| Rotherham | 236 | 61.6 | 53.9 | 70.1 | ||
| Sheffield | 458 | 66.9 | 60.9 | 73.4 | ||
| Bradford | 394 | 63.7 | 57.5 | 70.3 | ||
| Calderdale | 180 | 63.8 | 54.6 | 74.1 | ||
| Kirklees | 357 | 63.3 | 56.8 | 70.3 | ||
| Leeds | 546 | 59.7 | 54.7 | 65.0 | ||
| Wakefield | 314 | 63.3 | 56.3 | 70.8 |
Source: OHID, based on Office for National Statistics data
Mortality rate from lung cancer, all ages (Female All ages) 2022 - 24
| Area |
Recent
Trend |
Count
|
Value
|
95%
Lower CI |
95%
Upper CI |
|
|---|---|---|---|---|---|---|
| England | 37889 | 41.2 | 40.8 | 41.6 | ||
| Yorkshire and the Humber region (statistical) | 4527 | 49.8 | 48.4 | 51.3 | ||
| Kingston upon Hull | 265 | 75.5 | 66.6 | 85.1 | ||
| East Riding of Yorkshire | 322 | 41.1 | 36.7 | 45.8 | ||
| North East Lincolnshire | 152 | 54.3 | 45.9 | 63.7 | ||
| North Lincolnshire | 134 | 42.2 | 35.3 | 50.0 | ||
| York | 151 | 44.0 | 37.2 | 51.7 | ||
| North Yorkshire UA | 484 | 36.3 | 33.1 | 39.7 | ||
| Barnsley | 233 | 56.4 | 49.4 | 64.2 | ||
| Doncaster | 312 | 60.9 | 54.3 | 68.0 | ||
| Rotherham | 240 | 53.8 | 47.2 | 61.1 | ||
| Sheffield | 439 | 51.7 | 47.0 | 56.9 | ||
| Bradford | 384 | 52.6 | 47.4 | 58.1 | ||
| Calderdale | 181 | 52.5 | 45.1 | 60.7 | ||
| Kirklees | 343 | 50.6 | 45.4 | 56.3 | ||
| Leeds | 549 | 48.4 | 44.4 | 52.7 | ||
| Wakefield | 338 | 57.8 | 51.8 | 64.3 |
Source: OHID, based on Office for National Statistics data
There has been a gradual decrease in the mortality rate from lung cancer in Hull although small changes in the last two years.
Compared with benchmark
Mortality rate from lung cancer, all ages (Persons All ages)
|
Period
|
Kingston upon Hull |
Yorkshire and the Humber region (statistical)
|
England
|
||||
|---|---|---|---|---|---|---|---|
|
Count
|
Value
|
95%
Lower CI |
95%
Upper CI |
||||
| 2001 - 03 | • | 638 | 110.3 | 101.9 | 119.2 | 76.8 | 65.1 |
| 2002 - 04 | • | 627 | 108.7 | 100.3 | 117.6 | 75.5 | 64.1 |
| 2003 - 05 | • | 626 | 108.5 | 100.2 | 117.4 | 73.9 | 63.4 |
| 2004 - 06 | • | 640 | 110.8 | 102.3 | 119.8 | 73.2 | 63.1 |
| 2005 - 07 | • | 633 | 109.9 | 101.4 | 118.8 | 74.3 | 63.4 |
| 2006 - 08 | • | 652 | 113.2 | 104.6 | 122.3 | 75.5 | 63.6 |
| 2007 - 09 | • | 660 | 114.6 | 106.0 | 123.7 | 75.4 | 63.3 |
| 2008 - 10 | • | 645 | 111.4 | 102.9 | 120.4 | 74.2 | 62.6 |
| 2009 - 11 | • | 634 | 109.2 | 100.9 | 118.2 | 73.4 | 61.7 |
| 2010 - 12 | • | 585 | 100.0 | 92.0 | 108.5 | 71.9 | 60.9 |
| 2011 - 13 | • | 579 | 97.9 | 90.0 | 106.2 | 71.3 | 60.3 |
| 2012 - 14 | • | 588 | 98.1 | 90.3 | 106.4 | 70.2 | 59.7 |
| 2013 - 15 | • | 622 | 103.0 | 95.0 | 111.5 | 69.0 | 58.9 |
| 2014 - 16 | • | 626 | 102.9 | 94.9 | 111.3 | 67.8 | 57.9 |
| 2015 - 17 | • | 641 | 105.2 | 97.1 | 113.7 | 66.0 | 56.6 |
| 2016 - 18 | • | 588 | 95.8 | 88.1 | 103.9 | 65.0 | 55.1 |
| 2017 - 19 | • | 592 | 95.0 | 87.4 | 103.0 | 62.9 | 53.4 |
| 2018 - 20 | • | 548 | 86.9 | 79.8 | 94.6 | 61.2 | 51.8 |
| 2019 - 21 | • | 579 | 90.7 | 83.4 | 98.5 | 59.0 | 50.2 |
| 2020 - 22 | • | 567 | 88.2 | 81.1 | 95.9 | 58.1 | 48.9 |
| 2021 - 23 | • | 565 | 87.1 | 80.0 | 94.6 | 56.3 | 47.5 |
| 2022 - 24 | • | 546 | 83.0 | 76.1 | 90.2 | 54.9 | 46.4 |
Source: OHID, based on Office for National Statistics data
Among Hull men, there has been a reduction in the lung cancer mortality rate, but the rate of decrease has slowed in recent years.
The inequalities gap between Hull and England has decreased between 2001-03 and 2022-24.
Compared with benchmark
Mortality rate from lung cancer, all ages (Male All ages)
|
Period
|
Kingston upon Hull |
Yorkshire and the Humber region (statistical)
|
England
|
||||
|---|---|---|---|---|---|---|---|
|
Count
|
Value
|
95%
Lower CI |
95%
Upper CI |
||||
| 2001 - 03 | • | 379 | 155.3 | 139.4 | 172.5 | 109.0 | 93.4 |
| 2002 - 04 | • | 373 | 152.0 | 136.3 | 168.9 | 105.4 | 90.6 |
| 2003 - 05 | • | 376 | 153.7 | 137.9 | 170.7 | 100.3 | 88.3 |
| 2004 - 06 | • | 378 | 154.8 | 138.8 | 171.9 | 97.4 | 86.6 |
| 2005 - 07 | • | 363 | 149.0 | 133.4 | 165.8 | 97.4 | 85.4 |
| 2006 - 08 | • | 372 | 151.6 | 136.0 | 168.4 | 97.9 | 84.6 |
| 2007 - 09 | • | 372 | 151.1 | 135.5 | 167.8 | 97.1 | 83.3 |
| 2008 - 10 | • | 358 | 142.7 | 127.9 | 158.8 | 94.3 | 81.6 |
| 2009 - 11 | • | 333 | 131.8 | 117.7 | 147.2 | 93.2 | 79.4 |
| 2010 - 12 | • | 299 | 115.7 | 102.7 | 129.8 | 90.2 | 77.3 |
| 2011 - 13 | • | 297 | 113.2 | 100.4 | 127.0 | 88.4 | 75.8 |
| 2012 - 14 | • | 311 | 116.5 | 103.6 | 130.4 | 86.1 | 74.4 |
| 2013 - 15 | • | 321 | 119.3 | 106.3 | 133.4 | 83.6 | 72.7 |
| 2014 - 16 | • | 326 | 119.2 | 106.3 | 133.2 | 81.5 | 71.0 |
| 2015 - 17 | • | 326 | 118.1 | 105.3 | 132.0 | 77.7 | 68.7 |
| 2016 - 18 | • | 314 | 112.3 | 99.9 | 125.8 | 76.6 | 66.6 |
| 2017 - 19 | • | 308 | 108.0 | 96.0 | 121.1 | 74.1 | 64.2 |
| 2018 - 20 | • | 295 | 102.2 | 90.6 | 114.9 | 72.4 | 61.9 |
| 2019 - 21 | • | 311 | 105.9 | 94.2 | 118.7 | 67.9 | 59.2 |
| 2020 - 22 | • | 308 | 104.9 | 93.2 | 117.6 | 65.2 | 56.9 |
| 2021 - 23 | • | 290 | 97.5 | 86.4 | 109.7 | 62.1 | 54.7 |
| 2022 - 24 | • | 281 | 93.3 | 82.4 | 105.2 | 61.5 | 53.2 |
Source: OHID, based on Office for National Statistics data
Among Hull women, the lung cancer mortality rate increased from 2001-03 to a peak in 2015-17, and whilst the mortality rate decreased between 2015-17 and 2018-20, there has been relatively little change in the mortality rate since then, and even a slight increase between 2018-20 and 2021-23.
Whilst the inequalities gap in the female lung cancer mortality rate has reduced from 2015-17 when the mortality rate peaked for Hull, the inequalities gap in 2022-24 is slightly higher than it was in 2001-03.
Compared with benchmark
Mortality rate from lung cancer, all ages (Female All ages)
|
Period
|
Kingston upon Hull |
Yorkshire and the Humber region (statistical)
|
England
|
||||
|---|---|---|---|---|---|---|---|
|
Count
|
Value
|
95%
Lower CI |
95%
Upper CI |
||||
| 2001 - 03 | • | 259 | 77.7 | 68.4 | 87.8 | 54.8 | 45.4 |
| 2002 - 04 | • | 254 | 76.9 | 67.7 | 87.0 | 54.8 | 45.5 |
| 2003 - 05 | • | 250 | 76.7 | 67.4 | 86.9 | 55.5 | 45.9 |
| 2004 - 06 | • | 262 | 81.2 | 71.6 | 91.7 | 56.4 | 46.5 |
| 2005 - 07 | • | 270 | 84.3 | 74.5 | 95.0 | 58.4 | 47.7 |
| 2006 - 08 | • | 280 | 87.2 | 77.2 | 98.1 | 60.0 | 48.7 |
| 2007 - 09 | • | 288 | 89.8 | 79.6 | 100.9 | 60.5 | 48.9 |
| 2008 - 10 | • | 287 | 89.3 | 79.2 | 100.4 | 60.2 | 48.9 |
| 2009 - 11 | • | 301 | 93.9 | 83.5 | 105.3 | 59.5 | 48.7 |
| 2010 - 12 | • | 286 | 88.8 | 78.7 | 99.8 | 59.0 | 48.8 |
| 2011 - 13 | • | 282 | 86.6 | 76.7 | 97.4 | 59.0 | 48.6 |
| 2012 - 14 | • | 277 | 83.8 | 74.1 | 94.4 | 58.8 | 48.6 |
| 2013 - 15 | • | 301 | 90.6 | 80.6 | 101.5 | 58.3 | 48.4 |
| 2014 - 16 | • | 300 | 89.8 | 79.8 | 100.7 | 57.7 | 48.0 |
| 2015 - 17 | • | 315 | 95.2 | 84.9 | 106.4 | 57.5 | 47.3 |
| 2016 - 18 | • | 274 | 82.8 | 73.2 | 93.3 | 56.5 | 46.2 |
| 2017 - 19 | • | 284 | 84.8 | 75.1 | 95.3 | 54.6 | 45.0 |
| 2018 - 20 | • | 253 | 74.8 | 65.8 | 84.6 | 52.5 | 43.9 |
| 2019 - 21 | • | 268 | 78.3 | 69.1 | 88.3 | 52.3 | 43.1 |
| 2020 - 22 | • | 259 | 75.5 | 66.6 | 85.4 | 52.8 | 42.7 |
| 2021 - 23 | • | 275 | 79.3 | 70.2 | 89.3 | 52.0 | 41.9 |
| 2022 - 24 | • | 265 | 75.5 | 66.6 | 85.1 | 49.8 | 41.2 |
Source: OHID, based on Office for National Statistics data
Colorectal Cancer
For deaths registered during 2022-24, the premature mortality rate from colorectal cancer (deaths under the age of 75 years) was 23% higher in Hull compared to England (35% higher for men and 3% higher for women).
Compared with benchmark
| Indicator | Period | England | Yorkshire and the Humber region (statistical) | Kingston upon Hull | East Riding of Yorkshire | North East Lincolnshire | North Lincolnshire | York | North Yorkshire UA | Barnsley | Doncaster | Rotherham | Sheffield | Bradford | Calderdale | Kirklees | Leeds | Wakefield |
|---|---|---|---|---|---|---|---|---|---|---|---|---|---|---|---|---|---|---|
Under 75 mortality rate from colorectal cancer (Persons <75 yrs) | 2022 - 24 | 11.8 | 12.0 | 14.5 | 12.2 | 13.5 | 11.1 | 12.9 | 10.4 | 11.5 | 12.4 | 10.8 | 13.0 | 11.3 | 11.9 | 10.6 | 13.5 | 13.1 |
Under 75 mortality rate from colorectal cancer (Male <75 yrs) | 2022 - 24 | 14.4 | 14.5 | 19.4 | 13.6 | 17.9 | 13.9 | 14.2 | 12.9 | 14.2 | 14.3 | 11.6 | 15.9 | 15.1 | 13.4 | 12.0 | 16.2 | 15.9 |
Under 75 mortality rate from colorectal cancer (Female <75 yrs) | 2022 - 24 | 9.4 | 9.7 | 9.7 | 10.8 | 9.3 | 8.4 | 11.7 | 8.1 | 9.0 | 10.7 | 10.0 | 10.2 | 7.6 | 10.5 | 9.3 | 11.1 | 10.4 |
There were 93 deaths prior to the age of 75 years from colorectal cancer that were registered during 2022-24 (61 men and 32 women).
Compared with benchmark
Under 75 mortality rate from colorectal cancer (Persons <75 yrs) 2022 - 24
| Area |
Recent
Trend |
Count
|
Value
|
95%
Lower CI |
95%
Upper CI |
|
|---|---|---|---|---|---|---|
| England | 17551 | 11.8 | 11.7 | 12.0 | ||
| Yorkshire and the Humber region (statistical) | 1771 | 12.0 | 11.5 | 12.6 | ||
| Kingston upon Hull | 93 | 14.5 | 11.7 | 17.8 | ||
| East Riding of Yorkshire | 141 | 12.2 | 10.2 | 14.4 | ||
| North East Lincolnshire | 62 | 13.5 | 10.3 | 17.3 | ||
| North Lincolnshire | 55 | 11.1 | 8.3 | 14.5 | ||
| York | 66 | 12.9 | 10.0 | 16.5 | ||
| North Yorkshire UA | 207 | 10.4 | 9.0 | 11.9 | ||
| Barnsley | 81 | 11.5 | 9.2 | 14.4 | ||
| Doncaster | 106 | 12.4 | 10.2 | 15.1 | ||
| Rotherham | 79 | 10.8 | 8.5 | 13.4 | ||
| Sheffield | 171 | 13.0 | 11.1 | 15.1 | ||
| Bradford | 145 | 11.3 | 9.5 | 13.3 | ||
| Calderdale | 68 | 11.9 | 9.2 | 15.1 | ||
| Kirklees | 120 | 10.6 | 8.8 | 12.7 | ||
| Leeds | 249 | 13.5 | 11.9 | 15.3 | ||
| Wakefield | 128 | 13.1 | 10.9 | 15.5 |
Source: OHID, based on Office for National Statistics data
Under 75 mortality rate from colorectal cancer (Male <75 yrs) 2022 - 24
| Area |
Recent
Trend |
Count
|
Value
|
95%
Lower CI |
95%
Upper CI |
|
|---|---|---|---|---|---|---|
| England | 10331 | 14.4 | 14.1 | 14.7 | ||
| Yorkshire and the Humber region (statistical) | 1041 | 14.5 | 13.6 | 15.4 | ||
| Kingston upon Hull | 61 | 19.4 | 14.8 | 24.9 | ||
| East Riding of Yorkshire | 78 | 13.6 | 10.7 | 17.0 | ||
| North East Lincolnshire | 40 | 17.9 | 12.8 | 24.4 | ||
| North Lincolnshire | 34 | 13.9 | 9.6 | 19.4 | ||
| York | 35 | 14.2 | 9.9 | 19.7 | ||
| North Yorkshire UA | 124 | 12.9 | 10.7 | 15.4 | ||
| Barnsley | 49 | 14.2 | 10.5 | 18.8 | ||
| Doncaster | 60 | 14.3 | 10.9 | 18.4 | ||
| Rotherham | 42 | 11.6 | 8.4 | 15.7 | ||
| Sheffield | 102 | 15.9 | 13.0 | 19.3 | ||
| Bradford | 95 | 15.1 | 12.2 | 18.5 | ||
| Calderdale | 37 | 13.4 | 9.4 | 18.5 | ||
| Kirklees | 66 | 12.0 | 9.3 | 15.3 | ||
| Leeds | 142 | 16.2 | 13.6 | 19.1 | ||
| Wakefield | 76 | 15.9 | 12.5 | 19.9 |
Source: OHID, based on Office for National Statistics data
Under 75 mortality rate from colorectal cancer (Female <75 yrs) 2022 - 24
| Area |
Recent
Trend |
Count
|
Value
|
95%
Lower CI |
95%
Upper CI |
|
|---|---|---|---|---|---|---|
| England | 7220 | 9.4 | 9.2 | 9.7 | ||
| Yorkshire and the Humber region (statistical) | 730 | 9.7 | 9.0 | 10.4 | ||
| Kingston upon Hull | 32 | 9.7 | 6.6 | 13.8 | ||
| East Riding of Yorkshire | 63 | 10.8 | 8.3 | 13.9 | ||
| North East Lincolnshire | 22 | 9.3 | 5.8 | 14.2 | ||
| North Lincolnshire | 21 | 8.4 | 5.2 | 12.9 | ||
| York | 31 | 11.7 | 8.0 | 16.7 | ||
| North Yorkshire UA | 83 | 8.1 | 6.4 | 10.0 | ||
| Barnsley | 32 | 9.0 | 6.1 | 12.7 | ||
| Doncaster | 46 | 10.7 | 7.8 | 14.3 | ||
| Rotherham | 37 | 10.0 | 7.0 | 13.8 | ||
| Sheffield | 69 | 10.2 | 7.9 | 12.9 | ||
| Bradford | 50 | 7.6 | 5.6 | 10.0 | ||
| Calderdale | 31 | 10.5 | 7.1 | 14.8 | ||
| Kirklees | 54 | 9.3 | 7.0 | 12.2 | ||
| Leeds | 107 | 11.1 | 9.1 | 13.4 | ||
| Wakefield | 52 | 10.4 | 7.7 | 13.6 |
Source: OHID, based on Office for National Statistics data
There has been a gradual decrease in the premature mortality rate from colorectal cancer in Hull between 2001-03 and 2022-24, albeit not a smooth decrease, with a small increase in 2022-24.
Compared with benchmark
Under 75 mortality rate from colorectal cancer (Persons <75 yrs)
|
Period
|
Kingston upon Hull |
Yorkshire and the Humber region (statistical)
|
England
|
||||
|---|---|---|---|---|---|---|---|
|
Count
|
Value
|
95%
Lower CI |
95%
Upper CI |
||||
| 2001 - 03 | • | 99 | 18.8 | 15.3 | 22.9 | 16.4 | 15.9 |
| 2002 - 04 | • | 101 | 19.2 | 15.6 | 23.3 | 16.2 | 15.7 |
| 2003 - 05 | • | 95 | 18.2 | 14.7 | 22.2 | 15.5 | 15.4 |
| 2004 - 06 | • | 84 | 16.4 | 13.1 | 20.3 | 14.7 | 15.0 |
| 2005 - 07 | • | 73 | 14.1 | 11.1 | 17.7 | 14.5 | 14.6 |
| 2006 - 08 | • | 87 | 16.7 | 13.3 | 20.6 | 14.4 | 14.3 |
| 2007 - 09 | • | 90 | 17.0 | 13.6 | 20.9 | 14.0 | 14.0 |
| 2008 - 10 | • | 87 | 16.3 | 13.1 | 20.2 | 13.9 | 13.7 |
| 2009 - 11 | • | 85 | 15.8 | 12.6 | 19.6 | 13.5 | 13.2 |
| 2010 - 12 | • | 88 | 16.4 | 13.1 | 20.2 | 13.6 | 13.0 |
| 2011 - 13 | • | 92 | 17.0 | 13.7 | 20.9 | 13.3 | 12.7 |
| 2012 - 14 | • | 86 | 15.8 | 12.6 | 19.6 | 12.8 | 12.3 |
| 2013 - 15 | • | 82 | 14.7 | 11.7 | 18.3 | 12.7 | 12.1 |
| 2014 - 16 | • | 88 | 15.4 | 12.4 | 19.1 | 12.4 | 12.0 |
| 2015 - 17 | • | 92 | 15.6 | 12.6 | 19.2 | 12.6 | 12.0 |
| 2016 - 18 | • | 82 | 13.5 | 10.7 | 16.8 | 12.2 | 11.9 |
| 2017 - 19 | • | 85 | 13.6 | 10.8 | 16.8 | 12.1 | 11.8 |
| 2018 - 20 | • | 90 | 14.0 | 11.2 | 17.2 | 12.2 | 11.9 |
| 2019 - 21 | • | 95 | 14.7 | 11.9 | 17.9 | 11.9 | 11.8 |
| 2020 - 22 | • | 89 | 13.7 | 11.0 | 16.9 | 11.9 | 11.9 |
| 2021 - 23 | • | 86 | 13.4 | 10.7 | 16.5 | 11.5 | 11.8 |
| 2022 - 24 | • | 93 | 14.5 | 11.7 | 17.8 | 12.0 | 11.8 |
Source: OHID, based on Office for National Statistics data
The gradual decrease has occurred for Hull men, albeit with an increase in 2022-24.
Compared with benchmark
Under 75 mortality rate from colorectal cancer (Male <75 yrs)
|
Period
|
Kingston upon Hull |
Yorkshire and the Humber region (statistical)
|
England
|
||||
|---|---|---|---|---|---|---|---|
|
Count
|
Value
|
95%
Lower CI |
95%
Upper CI |
||||
| 2001 - 03 | • | 65 | 25.3 | 19.5 | 32.2 | 21.4 | 20.4 |
| 2002 - 04 | • | 69 | 26.7 | 20.8 | 33.9 | 21.1 | 20.0 |
| 2003 - 05 | • | 68 | 26.6 | 20.6 | 33.7 | 20.1 | 19.5 |
| 2004 - 06 | • | 57 | 22.9 | 17.3 | 29.6 | 19.0 | 18.8 |
| 2005 - 07 | • | 44 | 17.5 | 12.7 | 23.5 | 18.6 | 18.3 |
| 2006 - 08 | • | 52 | 20.1 | 15.0 | 26.4 | 18.2 | 18.0 |
| 2007 - 09 | • | 57 | 21.7 | 16.4 | 28.2 | 17.7 | 17.6 |
| 2008 - 10 | • | 59 | 22.5 | 17.1 | 29.1 | 17.8 | 17.4 |
| 2009 - 11 | • | 56 | 21.4 | 16.1 | 27.8 | 17.4 | 16.8 |
| 2010 - 12 | • | 56 | 21.1 | 15.9 | 27.5 | 17.5 | 16.5 |
| 2011 - 13 | • | 56 | 20.8 | 15.7 | 27.1 | 16.8 | 15.8 |
| 2012 - 14 | • | 53 | 19.8 | 14.7 | 25.9 | 16.3 | 15.3 |
| 2013 - 15 | • | 49 | 17.8 | 13.1 | 23.6 | 16.4 | 14.9 |
| 2014 - 16 | • | 54 | 19.3 | 14.4 | 25.3 | 15.8 | 14.7 |
| 2015 - 17 | • | 55 | 18.8 | 14.1 | 24.5 | 16.0 | 14.8 |
| 2016 - 18 | • | 50 | 16.7 | 12.4 | 22.1 | 14.7 | 14.7 |
| 2017 - 19 | • | 55 | 17.7 | 13.3 | 23.1 | 14.7 | 14.6 |
| 2018 - 20 | • | 60 | 18.9 | 14.4 | 24.4 | 14.6 | 14.5 |
| 2019 - 21 | • | 63 | 19.6 | 15.0 | 25.1 | 14.6 | 14.4 |
| 2020 - 22 | • | 58 | 18.1 | 13.7 | 23.4 | 14.7 | 14.4 |
| 2021 - 23 | • | 54 | 17.1 | 12.8 | 22.3 | 14.1 | 14.4 |
| 2022 - 24 | • | 61 | 19.4 | 14.8 | 24.9 | 14.5 | 14.4 |
Source: OHID, based on Office for National Statistics data
The change among Hull women is less noticeable over time. The mortality rate has been relatively flat since 2017-19, but is lower than the mortality rates between 2001-03 and 2016-18.
Compared with benchmark
Under 75 mortality rate from colorectal cancer (Female <75 yrs)
|
Period
|
Kingston upon Hull |
Yorkshire and the Humber region (statistical)
|
England
|
||||
|---|---|---|---|---|---|---|---|
|
Count
|
Value
|
95%
Lower CI |
95%
Upper CI |
||||
| 2001 - 03 | • | 34 | 12.7 | 8.8 | 17.7 | 11.9 | 11.8 |
| 2002 - 04 | • | 32 | 11.8 | 8.1 | 16.7 | 11.7 | 11.7 |
| 2003 - 05 | • | 27 | 10.1 | 6.6 | 14.6 | 11.4 | 11.6 |
| 2004 - 06 | • | 27 | 10.3 | 6.8 | 14.9 | 10.9 | 11.4 |
| 2005 - 07 | • | 29 | 11.0 | 7.3 | 15.7 | 10.8 | 11.2 |
| 2006 - 08 | • | 35 | 13.3 | 9.3 | 18.5 | 10.9 | 11.0 |
| 2007 - 09 | • | 33 | 12.3 | 8.5 | 17.3 | 10.5 | 10.7 |
| 2008 - 10 | • | 28 | 10.4 | 6.9 | 15.0 | 10.2 | 10.4 |
| 2009 - 11 | • | 29 | 10.5 | 7.0 | 15.1 | 9.8 | 9.9 |
| 2010 - 12 | • | 32 | 11.8 | 8.1 | 16.7 | 9.9 | 9.8 |
| 2011 - 13 | • | 36 | 13.3 | 9.3 | 18.4 | 10.0 | 9.7 |
| 2012 - 14 | • | 33 | 12.0 | 8.3 | 17.0 | 9.6 | 9.5 |
| 2013 - 15 | • | 33 | 11.8 | 8.1 | 16.5 | 9.3 | 9.4 |
| 2014 - 16 | • | 34 | 11.8 | 8.1 | 16.5 | 9.2 | 9.3 |
| 2015 - 17 | • | 37 | 12.6 | 8.8 | 17.4 | 9.4 | 9.4 |
| 2016 - 18 | • | 32 | 10.4 | 7.1 | 14.6 | 9.7 | 9.3 |
| 2017 - 19 | • | 30 | 9.4 | 6.3 | 13.5 | 9.6 | 9.3 |
| 2018 - 20 | • | 30 | 9.1 | 6.1 | 13.1 | 9.8 | 9.4 |
| 2019 - 21 | • | 32 | 9.8 | 6.7 | 13.9 | 9.3 | 9.4 |
| 2020 - 22 | • | 31 | 9.4 | 6.4 | 13.4 | 9.2 | 9.4 |
| 2021 - 23 | • | 32 | 9.8 | 6.7 | 13.8 | 9.0 | 9.4 |
| 2022 - 24 | • | 32 | 9.7 | 6.6 | 13.8 | 9.7 | 9.4 |
Source: OHID, based on Office for National Statistics data
In Hull, the all age mortality rate from colorectal cancer is also statistically significantly higher among men compared to women with rates 85% higher among men for the latest period.
Breast Cancer
For deaths registered during 2022-24, the mortality rate from breast cancer was 20% higher in Hull compared to England among women aged under 75 years.
Compared with benchmark
| Indicator | Period | England | Yorkshire and the Humber region (statistical) | Kingston upon Hull | East Riding of Yorkshire | North East Lincolnshire | North Lincolnshire | York | North Yorkshire UA | Barnsley | Doncaster | Rotherham | Sheffield | Bradford | Calderdale | Kirklees | Leeds | Wakefield |
|---|---|---|---|---|---|---|---|---|---|---|---|---|---|---|---|---|---|---|
Under 75 mortality rate from breast cancer (Female) (Female <75 yrs) | 2022 - 24 | 17.8 | 18.2 | 21.3 | 18.7 | 14.6 | 20.1 | 19.3 | 19.1 | 21.1 | 14.9 | 20.4 | 20.2 | 16.2 | 15.0 | 16.1 | 17.1 | 19.1 |
There were 71 deaths from breast cancer that were registered among Hull women aged under 75 years during 2022-24.
Compared with benchmark
Under 75 mortality rate from breast cancer (Female) (Female <75 yrs) 2022 - 24
| Area |
Recent
Trend |
Count
|
Value
|
95%
Lower CI |
95%
Upper CI |
|
|---|---|---|---|---|---|---|
| England | 13652 | 17.8 | 17.5 | 18.1 | ||
| Yorkshire and the Humber region (statistical) | 1365 | 18.2 | 17.2 | 19.2 | ||
| Kingston upon Hull | 71 | 21.3 | 16.6 | 26.9 | ||
| East Riding of Yorkshire | 108 | 18.7 | 15.3 | 22.7 | ||
| North East Lincolnshire | 33 | 14.6 | 10.1 | 20.6 | ||
| North Lincolnshire | 50 | 20.1 | 14.9 | 26.5 | ||
| York | 51 | 19.3 | 14.4 | 25.4 | ||
| North Yorkshire UA | 189 | 19.1 | 16.4 | 22.0 | ||
| Barnsley | 74 | 21.1 | 16.5 | 26.5 | ||
| Doncaster | 65 | 14.9 | 11.5 | 19.0 | ||
| Rotherham | 76 | 20.4 | 16.1 | 25.5 | ||
| Sheffield | 139 | 20.2 | 17.0 | 23.8 | ||
| Bradford | 108 | 16.2 | 13.3 | 19.6 | ||
| Calderdale | 44 | 15.0 | 10.9 | 20.1 | ||
| Kirklees | 94 | 16.1 | 13.0 | 19.7 | ||
| Leeds | 168 | 17.1 | 14.6 | 19.9 | ||
| Wakefield | 95 | 19.1 | 15.4 | 23.3 |
Source: OHID, based on Office for National Statistics data
The premature mortality rate for breast cancer increased among Hull women between 2001-03 to a peak in 2006-08. Whilst there has been some significant year-on-year variability, the overall mortality rate has tended to reduce since then.
Compared with benchmark
Under 75 mortality rate from breast cancer (Female) (Female <75 yrs)
|
Period
|
Kingston upon Hull |
Yorkshire and the Humber region (statistical)
|
England
|
||||
|---|---|---|---|---|---|---|---|
|
Count
|
Value
|
95%
Lower CI |
95%
Upper CI |
||||
| 2001 - 03 | • | 63 | 23.0 | 17.7 | 29.4 | 28.5 | 29.8 |
| 2002 - 04 | • | 66 | 23.7 | 18.3 | 30.2 | 28.2 | 29.1 |
| 2003 - 05 | • | 71 | 25.1 | 19.6 | 31.7 | 27.6 | 28.4 |
| 2004 - 06 | • | 84 | 29.1 | 23.2 | 36.1 | 27.4 | 27.8 |
| 2005 - 07 | • | 93 | 32.9 | 26.5 | 40.3 | 26.7 | 27.3 |
| 2006 - 08 | • | 96 | 34.6 | 28.0 | 42.3 | 26.6 | 26.6 |
| 2007 - 09 | • | 85 | 30.7 | 24.5 | 38.0 | 25.7 | 25.9 |
| 2008 - 10 | • | 77 | 27.8 | 21.9 | 34.8 | 24.1 | 24.9 |
| 2009 - 11 | • | 78 | 27.5 | 21.7 | 34.3 | 23.9 | 24.1 |
| 2010 - 12 | • | 70 | 24.8 | 19.3 | 31.3 | 22.9 | 23.5 |
| 2011 - 13 | • | 74 | 25.1 | 19.7 | 31.6 | 22.3 | 22.9 |
| 2012 - 14 | • | 64 | 21.6 | 16.6 | 27.6 | 21.6 | 22.3 |
| 2013 - 15 | • | 85 | 28.4 | 22.7 | 35.2 | 21.4 | 21.5 |
| 2014 - 16 | • | 78 | 25.7 | 20.3 | 32.1 | 21.6 | 21.2 |
| 2015 - 17 | • | 75 | 24.4 | 19.1 | 30.6 | 21.3 | 20.9 |
| 2016 - 18 | • | 61 | 19.9 | 15.2 | 25.5 | 20.7 | 20.7 |
| 2017 - 19 | • | 63 | 20.2 | 15.6 | 25.8 | 19.3 | 20.3 |
| 2018 - 20 | • | 74 | 23.2 | 18.2 | 29.1 | 18.8 | 19.7 |
| 2019 - 21 | • | 76 | 23.4 | 18.4 | 29.3 | 18.5 | 19.0 |
| 2020 - 22 | • | 76 | 23.0 | 18.1 | 28.8 | 18.4 | 18.3 |
| 2021 - 23 | • | 64 | 19.3 | 14.9 | 24.7 | 17.9 | 18.0 |
| 2022 - 24 | • | 71 | 21.3 | 16.6 | 26.9 | 18.2 | 17.8 |
Source: OHID, based on Office for National Statistics data
Prostate Cancer
For deaths registered during 2022-24, the mortality rate from prostate cancer was 12% higher in Hull compared to England among men of all ages. The mortality rate in Hull for 2022-24 was the fifth highest in the region.
Compared with benchmark
| Indicator | Period | England | Yorkshire and the Humber region (statistical) | Kingston upon Hull | East Riding of Yorkshire | North East Lincolnshire | North Lincolnshire | York | North Yorkshire UA | Barnsley | Doncaster | Rotherham | Sheffield | Bradford | Calderdale | Kirklees | Leeds | Wakefield |
|---|---|---|---|---|---|---|---|---|---|---|---|---|---|---|---|---|---|---|
Mortality rate from prostate cancer, all ages (Male) (Male All ages) | 2022 - 24 | 43.0 | 45.0 | 48.0 | 46.2 | 50.9 | 48.5 | 42.2 | 44.5 | 45.1 | 48.1 | 47.5 | 42.2 | 38.4 | 50.9 | 45.9 | 43.7 | 45.4 |
There were 126 deaths from prostate cancer that were registered during 2022-24.
Compared with benchmark
Mortality rate from prostate cancer, all ages (Male) (Male All ages) 2022 - 24
| Area |
Recent
Trend |
Count
|
Value
|
95%
Lower CI |
95%
Upper CI |
|
|---|---|---|---|---|---|---|
| England | 30774 | 43.0 | 42.5 | 43.4 | ||
| Yorkshire and the Humber region (statistical) | 3151 | 45.0 | 43.4 | 46.7 | ||
| Kingston upon Hull | 126 | 48.0 | 39.7 | 57.5 | ||
| East Riding of Yorkshire | 292 | 46.2 | 41.0 | 52.0 | ||
| North East Lincolnshire | 114 | 50.9 | 41.8 | 61.3 | ||
| North Lincolnshire | 124 | 48.5 | 40.2 | 58.1 | ||
| York | 113 | 42.2 | 34.7 | 50.8 | ||
| North Yorkshire UA | 477 | 44.5 | 40.6 | 48.8 | ||
| Barnsley | 139 | 45.1 | 37.6 | 53.7 | ||
| Doncaster | 188 | 48.1 | 41.3 | 55.7 | ||
| Rotherham | 172 | 47.5 | 40.5 | 55.4 | ||
| Sheffield | 278 | 42.2 | 37.3 | 47.5 | ||
| Bradford | 211 | 38.4 | 33.3 | 44.1 | ||
| Calderdale | 121 | 50.9 | 41.8 | 61.2 | ||
| Kirklees | 234 | 45.9 | 40.1 | 52.4 | ||
| Leeds | 372 | 43.7 | 39.3 | 48.4 | ||
| Wakefield | 190 | 45.4 | 38.9 | 52.8 |
Source: OHID, based on Office for National Statistics data
Between 2001-03 and 2014-16, the mortality rate for prostate cancer in Hull was similar to or below that of England, but the mortality rate since then has been consistently higher in Hull compared to England.
Compared with benchmark
Mortality rate from prostate cancer, all ages (Male) (Male All ages)
|
Period
|
Kingston upon Hull |
Yorkshire and the Humber region (statistical)
|
England
|
||||
|---|---|---|---|---|---|---|---|
|
Count
|
Value
|
95%
Lower CI |
95%
Upper CI |
||||
| 2001 - 03 | • | 107 | 54.4 | 43.6 | 66.9 | 56.7 | 58.4 |
| 2002 - 04 | • | 111 | 56.4 | 45.5 | 69.0 | 58.3 | 58.1 |
| 2003 - 05 | • | 110 | 56.4 | 45.4 | 69.1 | 57.3 | 57.2 |
| 2004 - 06 | • | 116 | 56.1 | 45.7 | 68.1 | 54.9 | 55.9 |
| 2005 - 07 | • | 119 | 57.7 | 47.2 | 69.8 | 53.1 | 54.9 |
| 2006 - 08 | • | 117 | 53.1 | 43.5 | 64.2 | 52.7 | 54.0 |
| 2007 - 09 | • | 103 | 46.4 | 37.5 | 56.7 | 52.1 | 53.3 |
| 2008 - 10 | • | 98 | 42.7 | 34.4 | 52.3 | 52.3 | 52.9 |
| 2009 - 11 | • | 106 | 46.6 | 37.8 | 56.6 | 51.8 | 52.6 |
| 2010 - 12 | • | 108 | 45.9 | 37.4 | 55.6 | 51.5 | 51.9 |
| 2011 - 13 | • | 113 | 48.2 | 39.5 | 58.2 | 50.4 | 50.9 |
| 2012 - 14 | • | 105 | 44.8 | 36.4 | 54.5 | 50.2 | 49.7 |
| 2013 - 15 | • | 105 | 46.0 | 37.3 | 56.0 | 49.7 | 49.4 |
| 2014 - 16 | • | 112 | 48.9 | 39.9 | 59.2 | 50.3 | 48.8 |
| 2015 - 17 | • | 130 | 56.2 | 46.5 | 67.2 | 50.0 | 48.8 |
| 2016 - 18 | • | 141 | 59.4 | 49.6 | 70.5 | 49.0 | 47.7 |
| 2017 - 19 | • | 150 | 61.9 | 52.0 | 73.0 | 48.6 | 47.2 |
| 2018 - 20 | • | 139 | 56.7 | 47.3 | 67.3 | 47.7 | 46.3 |
| 2019 - 21 | • | 140 | 57.2 | 47.8 | 67.8 | 46.1 | 45.0 |
| 2020 - 22 | • | 126 | 50.4 | 41.7 | 60.4 | 44.6 | 44.4 |
| 2021 - 23 | • | 136 | 53.7 | 44.7 | 63.8 | 44.7 | 43.7 |
| 2022 - 24 | • | 126 | 48.0 | 39.7 | 57.5 | 45.0 | 43.0 |
Source: OHID, based on Office for National Statistics data
Oral Cancer
The mortality rate from oral cancer in Hull was lower than England for deaths registered between 2020 and 2022.
Compared with benchmark
| Indicator | Period | England | Yorkshire and the Humber region (statistical) | Kingston upon Hull | East Riding of Yorkshire | North East Lincolnshire | North Lincolnshire | York | North Yorkshire UA | Barnsley | Doncaster | Rotherham | Sheffield | Bradford | Calderdale | Kirklees | Leeds | Wakefield |
|---|---|---|---|---|---|---|---|---|---|---|---|---|---|---|---|---|---|---|
Mortality rate from oral cancer, all ages (Persons All ages) | 2020 - 22 | 5.2 | 5.2 | 4.4 | 4.2 | 6.7 | 5.5 | 4.0 | 3.8 | 5.0 | 6.5 | 4.7 | 5.9 | 6.4 | 6.3 | 6.0 | 5.4 | 4.9 |
There were 30 deaths from oral cancer among Hull residents registered during the three year period 2020-22. As the numbers are relatively small there has been year-on-year variability, but the numbers for the most recent two years are the lowest they have been in Hull since 2008-10, and lower than England (although not statistically significantly lower).
Compared with benchmark
Mortality rate from oral cancer, all ages (Persons All ages)
|
Period
|
Kingston upon Hull |
Yorkshire and the Humber region (statistical)
|
England
|
||||
|---|---|---|---|---|---|---|---|
|
Count
|
Value
|
95%
Lower CI |
95%
Upper CI |
||||
| 2008 - 10 | • | 29 | 4.7 | 3.1 | 6.7 | 4.1 | 3.9 |
| 2009 - 11 | • | 30 | 4.8 | 3.2 | 6.8 | 4.2 | 4.0 |
| 2010 - 12 | • | 31 | 4.8 | 3.3 | 6.8 | 4.1 | 4.0 |
| 2011 - 13 | • | 42 | 6.6 | 4.8 | 9.0 | 4.2 | 4.1 |
| 2012 - 14 | • | 36 | 5.7 | 4.0 | 7.9 | 4.3 | 4.3 |
| 2013 - 15 | • | 43 | 6.8 | 4.9 | 9.1 | 4.5 | 4.4 |
| 2014 - 16 | • | 36 | 5.7 | 4.0 | 7.9 | 4.8 | 4.6 |
| 2015 - 17 | • | 43 | 6.7 | 4.9 | 9.1 | 5.0 | 4.7 |
| 2016 - 18 | • | 43 | 6.7 | 4.9 | 9.1 | 5.1 | 4.7 |
| 2017 - 19 | • | 37 | 5.7 | 4.0 | 7.9 | 4.9 | 4.7 |
| 2018 - 20 | • | 35 | 5.4 | 3.8 | 7.5 | 4.8 | 4.8 |
| 2019 - 21 | • | 26 | 4.0 | 2.6 | 5.9 | 4.9 | 5.0 |
| 2020 - 22 | • | 30 | 4.4 | 3.0 | 6.3 | 5.2 | 5.2 |
Source: OHID, based on Office for National Statistics data
Survival
All Cancers
NHS Digital produce an index of cancer survival for one year survival for Integrated Care Boards (ICBs) and sub-ICBs. The index represents a single summary measure of the overall pattern of net cancer survival. It combines net survival estimates for breast cancer (women only), colorectal cancer, lung cancer and all other invasive cancers (excluding non-melanoma skin cancer and prostate cancer). Net survival is the survival of cancer patients compared to the expected survival of the general population. The estimates are for adults diagnosed with cancer between 2005 and 2020 who were followed-up for one year to the 31 December 2021. These statistics are used to compare the overall pattern of cancer survival over time for each area. NHS Digital state that it may not be statistically appropriate to compare survival estimates across geographical areas due to the differences in the incidence of different cancers. However, when presenting the information, it is difficult to not do this, although there are clear reasons why this is not recommended.
Cancer survival in Hull has continued to improve. For cancers diagnosed in 2005, 65.0% of patients survived one year following their diagnosis, but this had increased to 70.6% for cancers diagnosed in 2020. The figures for Humber and North Yorkshire ICB and England are also given.
| Diagnosis year | Hull | HNY ICB | England |
| 2005 | 65.0 | 67.2 | 65.6 |
| 2006 | 65.5 | 67.6 | 66.2 |
| 2007 | 65.8 | 68.1 | 66.9 |
| 2008 | 66.0 | 68.4 | 67.5 |
| 2009 | 66.4 | 68.9 | 68.1 |
| 2010 | 66.7 | 69.2 | 68.7 |
| 2011 | 67.1 | 69.7 | 69.3 |
| 2012 | 67.8 | 70.3 | 70.0 |
| 2013 | 68.1 | 70.8 | 70.6 |
| 2014 | 68.6 | 71.2 | 71.2 |
| 2015 | 68.8 | 71.7 | 71.8 |
| 2016 | 69.2 | 72.0 | 72.3 |
| 2017 | 69.6 | 72.4 | 72.9 |
| 2018 | 70.1 | 72.9 | 73.5 |
| 2019 | 70.4 | 73.4 | 74.1 |
| 2020 | 70.6 | 73.7 | 74.6 |
The trends in one year survival for cancer are also presented below graphically.
The one year survival in Hull has increased by 5.6 percentage points or by 9% between 2005 and 2020.
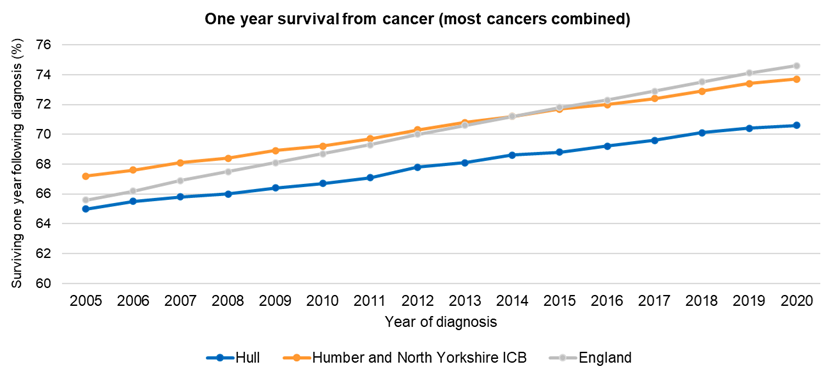
As NHS Digital state, a comparison should not be made is because of the difference in the incidence and survival rates for different cancer sites both between different geographical areas and any changes in incidence and survival over time which affect the value of the survival index. As detailed above, the incidence of lung cancer is much higher in Hull compared to England, and as this cancer has a particularly low survival rate compared to some other cancer sites, the percentage of lung cancer cases in Hull within this ‘index’ survival measure of cancer will be greater, and thus the value of the survival index will be lower. This could be one reason why the inequalities gap between Hull and England has increased over time with one year survival from cancer improving in Hull between 2005 and 2020, but not to the same extent as for England. If the percentage of lung cancers within all cancers considered within the survival index has increased over time in Hull then this may explain the observed pattern in the inequalities gap. If this were the case, it would be difficult to form conclusions as to the relative survival of cancer in Hull compared to England as one would not really be comparing like-with-like.
Lung Cancer
For cancers diagnosed between 2005 and 2011, one year survival from lung cancer was consistently higher in Hull compared to England, but from 2012 onwards the percentage surviving one year after diagnosis of lung cancer was lower in Hull compared to England.
Over the entire period 2005 to 2020, there has been a substantial increase in the one year survival from lung cancer in Hull with the percentage surviving at least one-year increasing from 32.0% for cancers diagnosed during 2005 to 44.5% for cancers diagnosed during 2020. One year survival from lung cancer in Hull increased by 12.5 percentage points or by 39% between 2005 and 2020.
For the latest period, for lung cancers diagn0sed during 2020, 44.5% survived one year in Hull c0mpared to 48.1% for England. So for every 100 people diagnosed with lung cancer in 2020, 3-4 more people survive to one year in England compared to Hull.
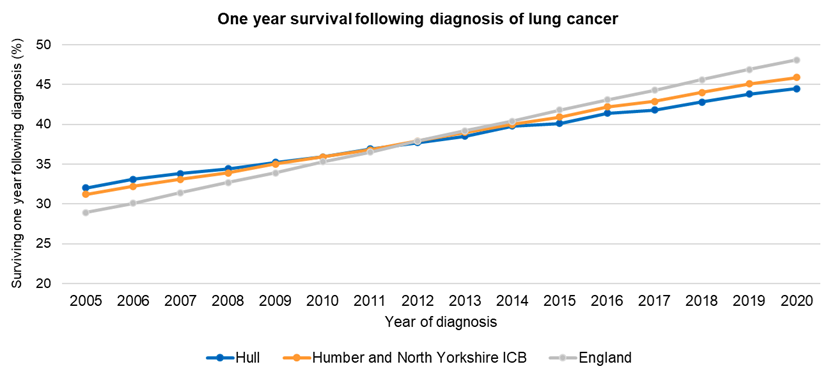
Colorectal Cancer
One year survival from colorectal cancer has increased over time in Hull by 4.3 percentage points or by 6% between 2005 and 2020. However, over the entire period the percentage surviving one year following colorectal cancer diagnosis was considerably lower than the Humber and North Yorkshire ICB and England, although the inequalities gap between Hull and England has reduced slightly over time. For colorectal cancers diagnosed during 2005, 72.9% survived one year in Hull compared to 76.5% for England (3.6 percentage points and 4.7% lower than England), but for cancers diagnosed during 2020, 77.2% survived one year in Hull compared to 80.5% for England (3.3 percentage points and 4.3% lower than England). For every 100 people diagnosed with colorectal cancer in 2020, more people survive to one year in England compared to Hull.
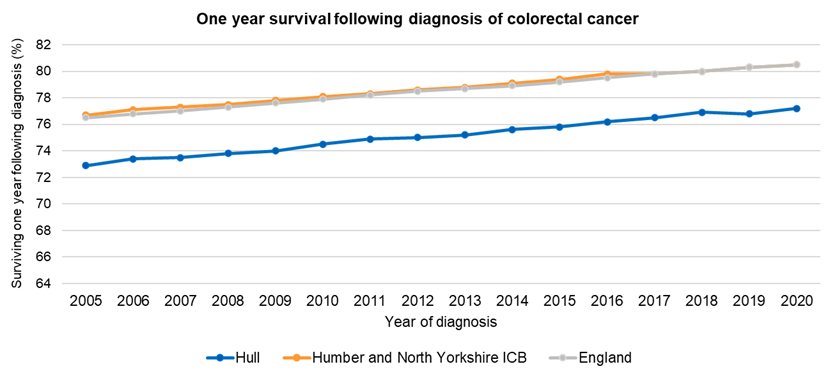
Breast Cancer
There has been a small decrease in one year survival after diagnosis of breast cancer in Hull over the period 2005 to 2020, whereas one year survival continued increasing across the Humber and North Yorkshire ICB and England.
The inequalities gap between Hull and England has increased over time for breast cancer one year survival. For breast cancers diagnosed during 2005, 94.8% survived one year in Hull compared to 94.7% for England (0.4 percentage points and 0.1% higher in Hull), but for cancers diagnosed during 2020, 93.5% survived one year in Hull compared to 97.3% for England (3.8 percentage points and 4.0% lower than England). So for every 100 women diagnosed with breast cancer in 2020, four more women survive to one year in England compared to Hull.
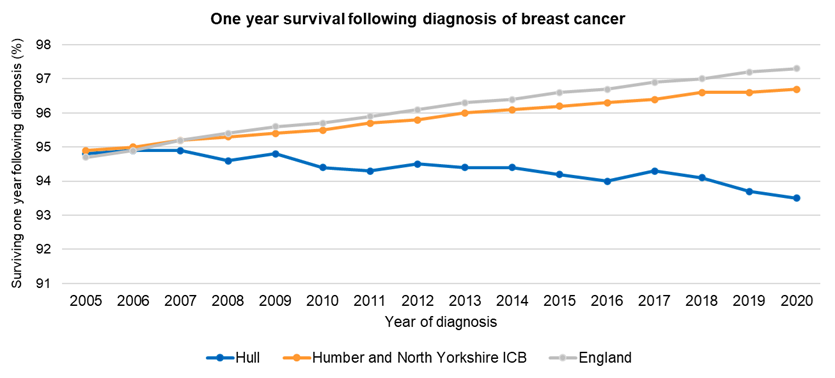
Strategic Need and Service Provision
All Cancers
It is necessary to work together to ensure people understand the benefit of positive life choices and know how to access information and seek early support to change. In order to do this effectively, health care organisations need to work together with different communities to use existing assets to realise the benefit of positive life changes, and treating people as individuals. In relation to poor diet, the family or household environment can have a strong influence, so any approach to improving diet which involves the entire family is more likely to have a better degree of success than dealing with just the individuals. People need to have the knowledge and confidence to cook cheap, healthy meals, and further education or training may be necessary to help with this. People need to be able to access good quality fresh fruit and vegetables. Maintaining a healthy weight and improving diet should be tackled using a life course whole system approach looking at a combination of strategies and settings.
Everybody should know the importance of early diagnosis, and should be encouraged to seek medical help early if they experience symptoms, and undertake screening for cancer when eligible. People need to know that stopping smoking has immediate health effects and substantially reduces the risk of most cancers within 5-10 years. Maintaining a healthy weight is also very important.
It is clear based on the information presented above in relation to the two-week wait, elective investigations, emergency presentations and stage of cancer at diagnosis, that people in Hull are more likely to present with their cancer in an emergency setting and later than people throughout the rest of England. This clearly has an impact on survival and mortality rates from cancer. Premature mortality rates are already high in Hull from preventable cancers, and from the high incidence of lung cancer due to high current and historical smoking levels in Hull.
Lung Cancer
Survival rates from most lung cancers are relatively low so prevention is extremely important. Not smoking should be seen as the norm, with the aim of creating a smoke free generation. It is necessary to work together to ensure people understand the benefit of positive life choices and know how to access information and seek early support to change. Health care providers need to work together within communities to realise the benefit of positive life changes. People need to know that stopping smoking has immediate health effects and substantially reduces the risk of lung cancer within 5-10 years, and that coughing up blood, pain when coughing, and persistent chest infections, breathlessness and a cough can be a sign of lung cancer.
Prostate Cancer
Men who are of African-Caribbean or African descent and men who have first degree male relatives affected by prostate cancer should be aware that they are at a slightly higher risk of developing prostate cancer. Men should also be aware of the symptoms (such as an increased need to urinate, straining while urinating and a feeling that the bladder has not fully emptied) and get promptly investigated, although such symptoms could be a sign of benign prostatic hyperplasia or prostate enlargement rather than cancer. Support should be given to men living with prostate cancer as, whilst they can live for decades without symptoms or needing treatment, it still can have an effect on their lives causing physical problems such as erectile dysfunction and urinary incontinence, as well causing anxiety and worry.
Breast Cancer
As mentioned above, a number of approaches are required to help people improve their diets, undertake physical activity and maintain a healthy weight.
As survival rates are high for most types of breast cancer provided it is detected in its early stages, it is vital that women check their breasts regularly for any changes and always get any changes examined by their GP. They should also attend screening when invited as this is the best available method of detecting an early breast lesion. Healthcare providers and women need to be aware that family history of breast cancer is an important risk factor, and that the National Institute for Health and Clinical Excellence have produced guidelines in relation to breast cancer screening for women with a family history of breast cancer.
Colorectal Cancer
As mentioned above, a number of approaches are required to help people improve their diets, undertake physical activity and maintain a healthy weight. With regard to colorectal cancer specifically, it is important that people are encouraged to participate in the screening programme and be aware of symptoms as early detection of cancer improves survival rates.
Resources
NHS. Cancer information and useful links. www.nhs.uk. 2014, NHS Choices: London.
Cancer Research UK, Why is early diagnosis important? www.cancerresearchuk.org. 2009, Cancer Research UK: London.
World Health Organisation, Early detection of cancer. www.who.int/cancer/detection/en/. 2015, World Health Organisation: Geneva.
Cancer Research UK, Ageing cells could be ticking cancer time bomb. www.cancerresearchuk.org. 2013, Cancer Research UK: London.
Cancer Research UK, Growing ageing population drives global cancer rise. www.cancerresearchuk.org. 2005, Cancer Research UK: London.
Action on Smoking and Health, Factsheet 02: Smoking Statistics: Illness and death. www.ash.org.uk. 2015, Action on Smoking and Health: London.
Newton, J.N., et al., Changes in health in England, with analysis by English regions and areas of deprivation, 1990-2013: a systematic analysis for the Global Burden of Disease Study 2013. The Lancet, 2015. 386(10010): p. 2257-2274.
NHS. Lung cancer – symptoms. www.nhs.uk. 2013, NHS Choices: London.
NHS. Prostate cancer. www.nhs.uk. 2015, NHS Choices: London.
NHS. Bowel cancer. www.nhs.uk. 2014, NHS Choices: London.
NHS. Breast cancer (female). www.nhs.uk. 2015, NHS Choices: London.
Cancer Research UK, Definite breast cancer risks. www.cancerresearchuk.org. 2014, Cancer Research UK: London.
National Institute for Health and Care Excellence, Familial breast cancer: Classification and care of people at risk of familial breast cancer and management of breast cancer and related risks in people with a family history of breast cancer. www.nice.org.uk. 2013, National Institute for Health and Care Excellence: London.
National Cancer Registration and Analysis Service: https://www.cancerdata.nhs.uk/
The Office for Health Improvement & Disparities’ Fingertips: https://fingertips.phe.org.uk/
Updates
This page was last updated / checked on 1 June 2026.
This page is due to be updated / checked in December 2026.