Search Results for: climate
Climate Change
This topic area covers statistics and information relating to climate change in Hull including local strategic need and service provision. Further information is also available about Hull and the environment can be found under Geographical Area within Place, and under Air Pollution within Health and Wellbeing Influences.
Headlines
- Humans interact with the environment constantly. These interactions affect quality of life, years of healthy life lived, and health disparities.
- The Intergovernmental Panel on Climate Change state that we are currently experiencing the greatest change in the natural environment in human history.
- Climate change impacts on biodiversity strips with a decline of global biodiversity of 69% between 1970 and 2018.
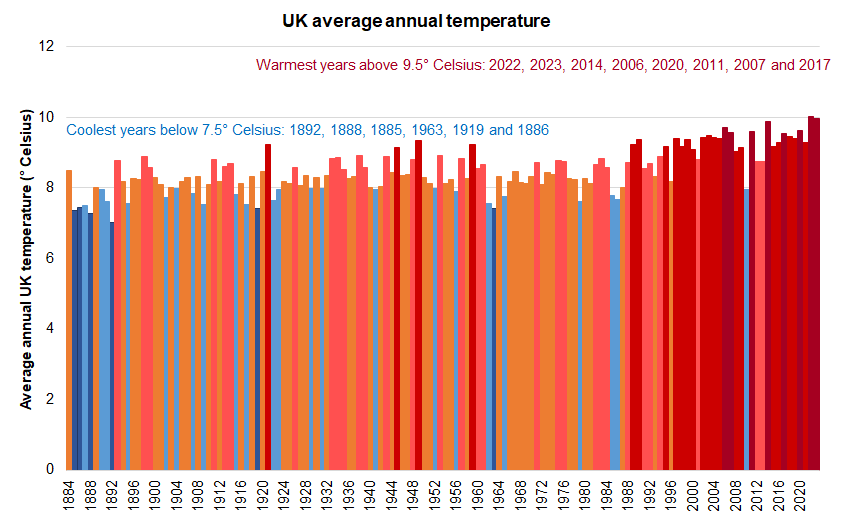
- The hottest eight years since records began in 1884 were between 2006 and 2023 and all had an average annual temperature above 9.5° Celsius with the latest two years 2022 and 2023 having the highest average annual temperature of 10.0° Celsius. In contrast, four of the six coolest years were between 1885 and 1892 which all had an average annual temperature of below 7.5° Celsius (as did 1919 and 1963).
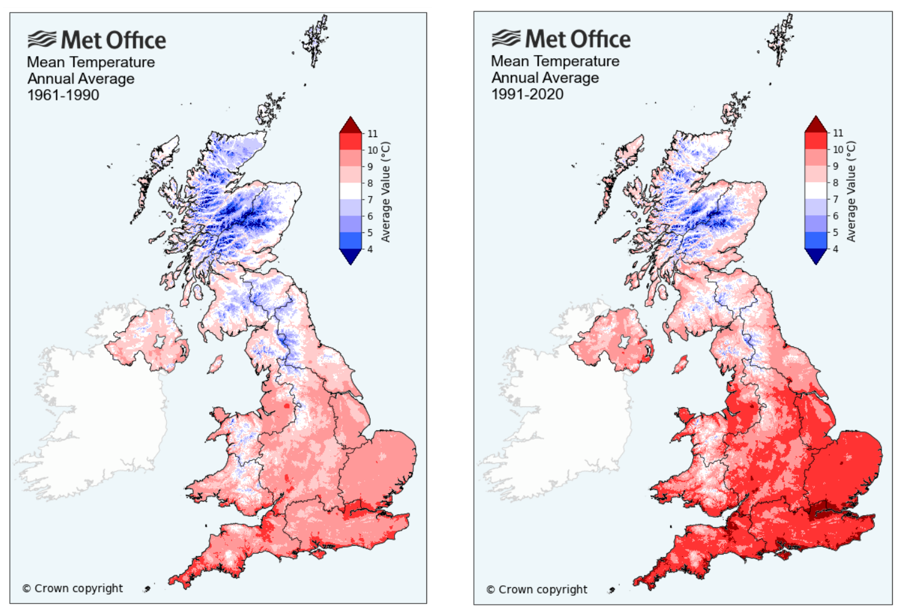
- The average annual temperature in Hull has increased from between 9° Celsius and 10° Celsius for the period 1961 to 1990 to between 10° Celsius and 11° Celsius for the period 1991 to 2020.
- There were severe flooding events in Hull in 2007 and 2013 which had a significant impact on individuals and communities. The likelihood of these flooding events has increased because of global heating.
- In July 2019, Hull had a new temperature record of 35° Celsius, and only three years later in July 2022, this was broken with a new record of 37° Celsius. These high temperature records are the consequences of only a 1.1° Celsius increase in global temperatures.
- The number of climate risks requiring adaptation are increasing with significant impacts on people’s health, life support systems, and health and care providers.
- There is the potential for measures introduced to resolve one problem to be detrimental to other strategies, so full consultation and engagement between the different areas and an assessment of the impacts of any council actions is essential to ensure strategies complement each other.
The Population Affected – Why Is It Important?
Climate change is the greatest threat faced by humanity and the natural world. Emissions from the burning of fossil fuels has seen global temperature increase by 1.1° Celsius since the industrial revolution and under current “business as usual” we are on course for a global temperature increase of 3° Celsius.
The Paris Agreement set a global target to limit global heating to not more than 2° Celsius with an aim to keep temperature increase to no more than 1.5° Celsius. The science indicates that at global temperatures of 2° Celsius there is an increased danger of feedback loops in the natural world and the risk of cascade effects. For example, the melting of permafrost releases methane into the atmosphere which drives further temperature increase which drives increased permafrost melting.
The science of climate change clearly shows that actions by humans are driving these changes through a robust evidence contained in a number of reports published in 2021 and 2022 by the United Nations.
As a result of this the world is passing a number of tipping points for planetary boundaries covering air quality, climate change, water, and natural environment and other life supporting systems provided by earth. More information on planetary boundaries can be found here https://www.stockholmresilience.org/research/planetary-boundaries.html
The Intergovernmental Panel on Climate Change state that we are currently experiencing the greatest change in the natural environment in human history. The threat of climate change as a result of the increase of greenhouse gases by human activity is pushing known planetary boundaries in areas such as species loss, air quality, natural resources and extreme weather events. The increasing global population expansion and dietary change to a more meat-based diet is putting pressure on agriculture and land use.
Climate change impacts on biodiversity (trees, plants, birds, animals, oceans, fish, corals, etc) with a decline of global biodiversity of 69% between 1970 and 2018.
Climate change is affecting the frequency and intensity of extreme weather events such as flooding, storms, forest and moorland fires and heat waves. These weather events impact the most vulnerable in society for example the young and old, and this with lifelong limiting illness, and those most economically disadvantaged, who are least able to recover from such events. We are seeing increased global carbon dioxide concentrations each year and even during the global COVID-19 pandemic concentrations in 2020 set a new record. This is driving increased temperature and new records being set for warmest years on record. Current scientific evidence published by the United Nations Intergovernmental Panel on Climate Change show that the climate impacts we are experiencing are a result of only a 1.1° Celsius rise in global temperatures and the Paris Agreement has set a target to restrict global heating to well below 2° Celsius with an ambition to restrict to 1.5° Celsius.
In the 140 years from 1884 to 2023 inclusive, there has been a clear increase in the average annual temperature in the UK as a result of human activity.
There have been six years where the average annual temperature was below 7.5° Celsius. The lowest three temperatures all occurred in the 1800s (7.02° Celsius in 1892, 7.28° Celsius in 1888 and 7.36° Celsius in 1885) with the most recent year being 1963 which had the fourth coolest temperature since records began in 1884 (7.42° Celsius in 1919 and 7.45° Celsius in 1886 complete the list of the lowest six average annual UK temperatures).
There have been eight years where the average annual temperature was greater than 9.5° Celsius. All eight of these years were between 2006 and 2023 with the latest two years 2022 and 2023 having the highest average annual temperatures recorded at 10.03° Celsius for 2022 and 9.97° Celsius for 2023 (9.88° Celsius in 2014, 9.70° Celsius in 2006, 9.62° Celsius in 2020, 9.61° Celsius in 2011, 9.56° Celsius in 2007 and 9.53° Celsius in 2017 were the remaining years where the temperature was above 9.5° Celsius).
The averages of the average annual temperatures were:
- 7.95° Celsius for the 16 years from 1884 to 1899 (range 7.02° Celsius to 8.88° Celsius)
- 8.29° Celsius for the 50 years from 1900 to 1949 (range 7.42° Celsius to 9.34° Celsius)
- 8.43° Celsius for the 50 years from 1950 to 1999 (range 7.41° Celsius to 9.41° Celsius)
- 9.32° Celsius for the 24 years from 2000 to 2023 (range 7.94° Celsius to 10.03° Celsius).
The average annual temperature varies throughout the UK depending on numerous factors such as latitude (the average annual temperature ranges from about 7° Celsius in the Shetlands to over 11° Celsius in Cornwall and the Channel Islands), altitude (decrease of about 0.5° Celsius for each 100 metres increase in altitude), and to some extent proximity to the coast. There is also a seasonal variation (over the year) and diurnal variation (over the day).
The average annual temperatures have increased between 1961-1990 and 1991-2020 for most areas of the UK.
The UK Climate Change Act 2008 (2050 Target Amendment) Order 2019 has set a target to reduce carbon emissions by 100% by 2050 (from a 1990 baseline). In 2020 the UK’s average surface temperature had risen by 1.2° Celsius. Further, in 2022 the Government published the latest Climate Change Risk Assessment following advice from the Committee on Climate Change. The risk assessment looked at the impact of the risks and opportunities from climate change under a 2° Celsius and 4° Celsius global heating scenario.
This identified sixty-one risks and opportunities with thirty-four of them requiring more action within the next five years, to 2027. Twenty-two where more research was needed, four where we needed to sustain current action and three where we needed to maintain a watching brief.
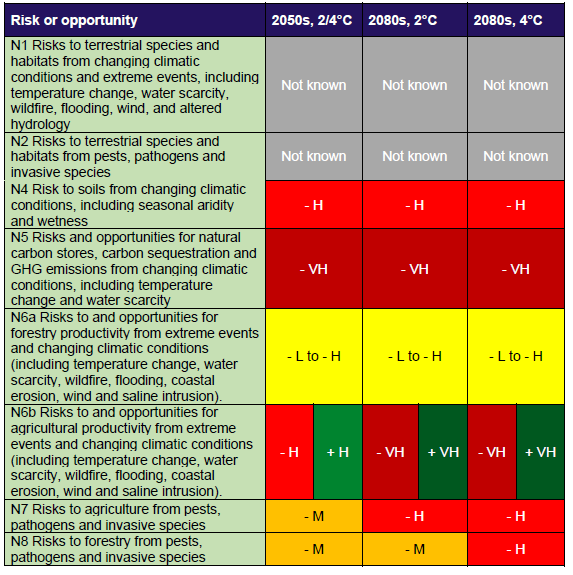
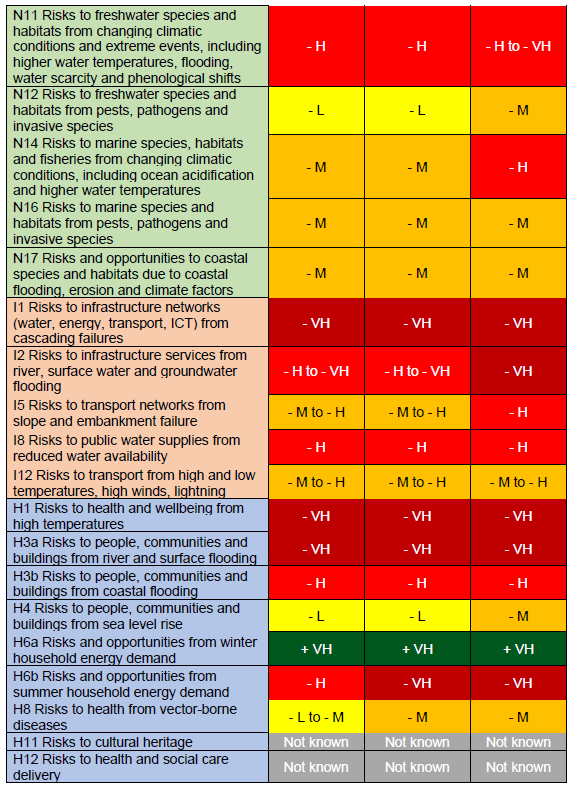
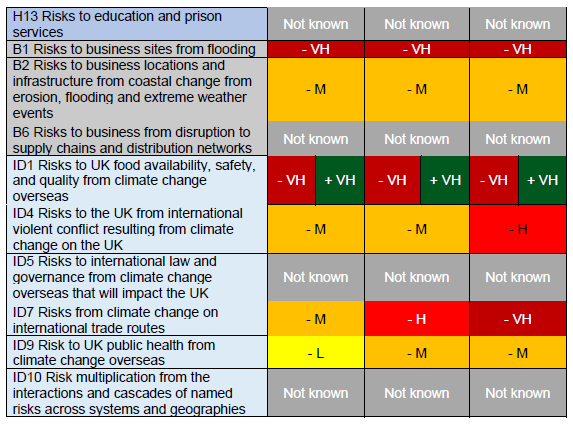
Many of the risks either have a direct effect on people’s health such as heatwaves, flooding and increase in pathogens, or an indirect impact through affecting health functions to operate such as flooding of roads, buildings etc. The table below from the UK Climate Change Risk Assessment 2022 provides a good starting point to understand the risks over the rest of the century.
The potential costs and damages (economic costs or forgone opportunities) are denoted with a negative sign, and possible opportunities are denoted with a positive sign. Where uncertainty exists over the category, the range has been indicated. For some of the risks and opportunities, there are both potential costs and benefits. The risks and benefits are denoted as follows:
- Very High (VH) is over £1 billion per year.
- High (H) is over hundreds of millions of pounds per year.
- Medium (M) is over tens of millions of pounds per year.
- Low (L) is less than ten million pounds per year.
There is therefore an imperative to increase the scale and pace of action to reduce carbon emissions, and to significantly increase adaptation activity to prepare for the inevitable consequences of climate change.
A third National Adaptation Programme was published in July 2023 that provides the action plan to address the risks identified, and covers the period 2024-2028. This risk assessment and Programme provide a sound strategic focus for joint strategic needs action.
In 2014, the Joseph Rowntree Foundation produced an evidence review of climate change and social justice. Their review identified five different forms of climate injustice in the UK context, and found that lower income and other disadvantaged groups contributed the least to causing climate change yet they were the most likely to be negatively impacted by its effects. They were also less able to participate in decision-making around policy responses.
In 2018, a revised webtool developed by the Joseph Rowntree Foundation and University of Manchester, Climate Just, demonstrated that residents who were already vulnerable due to age, long term life limiting illnesses and poverty are least able to be resilient to the impacts of climate change and are more adversely affected than the average resident.
The Hull Picture
The city of Hull has experienced several extreme weather events over the last twenty years that have put increased pressure on public health services. The floods in 2007 affected significant parts of the city with some families not being able to return to their homes for up to two years. The tidal surge in December 2013 closed the A63 and the Transpennine rail line, and the snow and ice winters in 2010 and 2011 affected roads with some impassable for weeks and increased the number of people suffering falls. Hull has experienced significant heatwaves in July 2019 with a new temperature record of 35° Celsius and only three years later in July 2022 this was broken with a new record of 37° Celsius. These heatwaves are likely to increase in intensity and frequency as the century progresses with increased pressure on health and care services.
The impacts of climate change will disproportionately affect the most vulnerable and therefore put increased pressure on public health and health services in Hull.
In response to the increasing impacts of climate change and global heating Hull City Council declared a Climate Emergency in 2019 and produced the Hull 2030 Carbon Neutral Strategy in 2020 setting out the key challenges faced and an initial suite of actions.
In 2022 the Council agreed a 2045 net zero target for the city and a 2040 net zero target for the Council to bring the cities and Council’s ambitions in line with national climate action. This followed extensive research with the Carbon Trust to establish a science-based target for the city under a high ambition reduction scenario. This includes several carbon pathways for key sectors to meet the net zero target.
Strategic Need and Service Provision
Since January 2013, Hull City Council has held the highest Green Accreditation for its environmental management system, Investors in the Environment and undertaken work to reduce its carbon emissions in line with its corporate targets.
There is a need to better understand the extent of climate risk to public health and the wider health services in the City. The development of effective climate adaptation for services and facilities would ensure that they are more resilient to extreme weather events and therefore reduce the emergency impact on public health services.
It is necessary to work with partners to reduce the impact of extreme weather events and wider emergency events and seek assurance of preparedness, response and recovery when events happen. To create a natural and physical environment that is resilient to climate change.
The cost of extreme weather events to public health services is not well understood and there is a need to better understand the financial and human impacts so that this can support timely and effective climate adaptation investment. The experience of the significant flooding events have shaped how we build homes, support vulnerable residents and business and undertake resilience work at the city and community level. We have a greater understanding of how we interact with our environment and the key role it plays in improving public health as well as how it can affect people’s life chances. We also have a greater understanding and working relationship across service providers in how our actions impact each other and how through greater project integration we can build a whole system approach to the challenges.
Resources
Climate Change Explained. https://assets.publishing.service.gov.uk/government/uploads/system/uploads/attachment_data/file/1163722/climate-change-explained.pdf
The Paris Agreement. United Nations, Climate Change. https://unfccc.int/process-and-meetings/the-paris-agreement/the-paris-agreement
Climate Action. United Nations. https://www.un.org/en/climatechange/reports
Average annual temperatures in the UK. Met Office, 1884 to 2023. https://www.metoffice.gov.uk/pub/data/weather/uk/climate/datasets/Tmean/date/UK.txt
UK climate averages. Average maps. Met Office, 1961-1990 and 1991-2020. https://www.metoffice.gov.uk/research/climate/maps-and-data/uk-climate-averages/gcxdqnhwn
Climate change impacts on biodiversity strips. https://biodiversitystripes.info/global/
UK Climate Change Risk Assessment 2022. UK Government. https://www.gov.uk/government/publications/uk-climate-change-risk-assessment-2022
Independent Assessment of UK Climate Risk. Climate Change Committee, 2021. https://www.theccc.org.uk/publication/independent-assessment-of-uk-climate-risk/
Climate change: second national adaptation programme (2018 to 2023). UK Government, 2018. https://www.gov.uk/government/publications/climate-change-second-national-adaptation-programme-2018-to-2023
Climate change: Atmospheric Carbon Dioxide. https://www.climate.gov/news-features/understanding-climate/climate-change-atmospheric-carbon-dioxide#:~:text=October%207%2C%202021-,Highlights,2020%3A%20412.5%20parts%20per%20million
2021 Tied for 6th Warmest Year in Continued Trend, NASA Analysis Shows. Global Climate Change, 2022. https://climate.nasa.gov/news/3140/2021-tied-for-6th-warmest-year-in-continued-trend-nasa-analysis-shows/
What is climate change? Met Office. https://www.metoffice.gov.uk/weather/climate-change/what-is-climate-change
The Climate Change Act 2008 (2050 Target Amendment) Order 2019. https://www.legislation.gov.uk/uksi/2019/1056/contents/made
Intergovernmental Panel on Climate Change. Climate Change 2023: Synthesis Report – Summary for Policymakers. https://www.ipcc.ch/report/ar6/syr/downloads/report/IPCC_AR6_SYR_SPM.pdf
Climate Change 2021: The Physical Science Basis. Intergovernmental Panel on Climate Change. https://www.ipcc.ch/report/ar6/wg1/downloads/report/IPCC_AR6_WGI_Full_Report.pdf
Climate change and social justice: an evidence review. Joseph Rowntree Foundation, 2014. https://www.jrf.org.uk/climate-change-and-social-justice-an-evidence-review
Climate Just. Climate UK, Joseph Rowntree Foundation, Environmental Agency, University of Manchester, 2018.
National Adaptation Programme 2023. HM Government https://www.gov.uk/government/publications/third-national-adaptation-programme-nap3
Updates
This page was last updated / checked on 16 September 2025.
This page is due to be updated / checked in September 2026.
Infectious Diseases
This topic area covers statistics and information relating to infectious diseases in Hull including local strategic need and service provision. This section of the JSNA only includes statistics and information from a small number of infectious diseases where data is available on Office for Health Improvement & Disparities’ Fingertips. There are many more infectious diseases, but information is not necessarily available on these. Further information on some other infectious diseases within this JSNA can be found under Coronavirus (COVID-19), Respiratory Diseases and Sexually Transmitted Infectious under Health Factors within Adults. Information relating to vaccinations can be found within Vaccinations under Prevention for Adults, and within Screening and Vaccinations under Health Factors for Children and Young People.
This page includes information on the number of new laboratory confirmed cases of escherichia coli (e coli), methicillin-resistant staphylococcus aureus (MRSA), clostridium difficile (c difficile), klebsiella and pseudomonas aeruginosa (p aeruginosa) as well as information on tuberculosis (TB), mortality from communicable diseases, and antibiotic prescribing in primary care in order to reduce antimicrobial resistance.
If you need to report an infectious diseases, contact your local Health Protection Team.
This page contains information from the Office for Health Improvement & Disparities’ Fingertips. Information is taken ‘live’ from the site so uses the latest available data from Fingertips and displays it on this page. As a result, some comments on this page may relate to an earlier period of time until this page is next updated (see review dates at the end of this page). This is particularly the case for this JSNA page, as the indicators relating to infections are updated more regularly on Fingertips than the update schedule for this page.
Headlines
- Some infectious diseases can cause high levels of mortality and disability whereas the effects from others can be relatively mild. However, there are available measures to reduce spread such as limiting contact with others, making occupied spaces well ventilated, maintaining good hygiene, taking up vaccinations, and reporting infectious diseases where appropriate so potential outbreaks can be managed. A communicable disease is a contagious infectious disease.
- In 2024/25, there were 247 laboratory confirmed cases of Escherichia coli (E. coli) in Hull which equates to a rate of 92 cases per 100,000 population. This was higher than England (77 cases per 100,000 population). The majority of the cases (188; 76%) were community-onset cases. This represents a decrease on 2023/24 when there had been a relatively sharp increase in the number of infections in Hull.
- The number of laboratory confirmed cases of methicillin-resistant straphylococcus aureus (MRSA) are low in Hull as they are across England and the region. In 2024/25, there were four laboratory confirmed cases and the confirmed case rate was slightly lower than England (1.5 versus 1.9 cases per 100,000 population). Two of these cases were community-onset in Hull in 2024/25. The rate in Hull has generally been lower than England.
- During 2024/25, there were 59 laboratory confirmed cases of Clostridium difficile (C. difficle) in Hull, which was much lower than England (22 versus 33 cases per 100,000 population). 15 of these cases were community-onset healthcare associated cases and 10 were community-onset cases community associated cases. The rate in Hull has been consistently lower than England.
- During 2024/25, there were 55 laboratory confirmed cases of Klebsiella Spp. and the rate was lower in Hull than England (20.5 versus 23.6 cases per 100,000 population. Overall, 41 (75%) of these cases were community-onset. There is year-on-year variability in the confirmed infection rate in Hull, but the rate has increased quite sharply in Hull in the last year.
- During 2024/25, there were 23 laboratory confirmed cases of pseudomonas aeurginosa (P. aeruginosa) in Hull. The infection rate was higher in Hull compared to England (8.6 versus 7.8 per 100,000 population). There has been some year-on-year variability, but on the whole, the rate in Hull has been higher than England. In 2024/25, 12 (52%) of these cases were community-onset.
- Over the three year period 2022 to 2024, there were 59 new cases of tuberculosis (TB) in Hull which gave an incidence rate of 7.2 per 100,000 population. In 2001-03, the incidence rate in Hull was less than half that of England (5.1 versus 13.1 per 100,000 population), but has increased over time in Hull as the make up of Hull’s population has changed. For the period 2001-03 to 2016-18, the rate in Hull was statistically significantly lower than England but since then there has been no statistically significant difference between Hull and England (although the rate in Hull has continued to be lower than England). The number of people in Hull with drug sensitive TB is relatively low, and there is considerable variability in the percentages who completed a full course of treatment within 12 months. For the last three years (2021 to 2023), 20 out of 49 (43%) did not complete the full course of treatment in Hull compared to around 15% of cases in England.
- There were 113 deaths among Hull residents from communicable diseases (certain infectious and parasitic diseases and influenza) that were registered during the three year period 2022-24 which gave a mortality rate of 17.6 deaths per 100,000 population. higher than the England rate of 15.2 deaths per 100,000 population. The rate in Hull over the last decade or so had been around 10-11 deaths per 100,000 population, so the latest rate of 17.6 deaths per 100,000 population represents an increase in Hull (on tope of the increase for 2021-23. The mortality rates illustrate year-on-year variability in Hull with a higher number of deaths from sepsis for some years. Whilst the number of deaths from communicable diseases reduced considerably for 2020 due to the COVID-19 pandemic, the total numbers have increased slightly since then with a higher number from flu, although the flu deaths only made up around 21% of all communicable deaths in Hull in the last six years (2019 to 2024), but 27% in the last three years (2022-24) without the impact of social distancing rules during the pandemic.
- Reduction in antibiotic consumption is a well-recognised target in antimicrobial resistance (AMR) policies both nationally and internationally. In Hull, for 2024, after adjusting for the age-sex structure of the population, there was a higher rate of antibiotic prescribing in primary care within the NHS compared to England (0.90 versus 0.85 annual total items per STAR PU (Specific Therapeutic group Age sex weightings Related Prescribing Units – using these ‘weighted units’ is a way in which the measure takes into account the differences in the population). For 2015, the rate in Hull was 11% higher than England (1.22 versus 1.10 annual total items per STAR PU) and is currently 6% higher than England. Thus the antibiotic prescribing rate has reduced in Hull and at a faster rate than the prescribing rate for England.
The Population Affected – Why Is It Important?
From Very Well Health, an infectious disease is an infection, when a microorganism enters the body. For bacteria or fungi, this means dividing and growing new cells at an exponential rate. Viruses have the added hurdle of entering human cells and taking over their control centres so they can make more of themselves. While all communicable diseases are infectious, not all infections are communicable, for example, tetanus can cause an infection, but a person with tetanus cannot spread it to other people. A communicable disease is a contagious one. If someone catches the illness, they can get ill and spread the pathogen onto the next person. This can be transmitted through respiratory droplets from coughing or sneezing, sexual activity, contact with blood, from mother to child during pregnancy, birth or breastfeeding, or ingestion of toxins usually from spoilt and contaminated food. Active illness where a person is coughing or sneezing a lot can give the microbe more opportunities to spread, but a person can still be contagious without symptoms. For instance, measles can be transmitted up to four days before the rash develops, and the virus can stay in the air for as long as two hours after an infected person leaves the room. Other microbes spread through an intermediatory, for instance, malaria is spread by mosquitoes who become infected after biting someone with the disease, and then they, in turn, pass the parasite onto the next person they bite. Some diseases can remain on surfaces such as door handles, and food poisoning in particular can be spread through the faecal-oral route when people don’t wash hands after using the toilet and touch surfaces, that others touch later.
From the World Health Organisation, infectious diseases are caused by pathogenic microorganisms, such as bacteria, viruses, parasites or fungi; the diseases can be spread, directly or indirectly, from one person to another. These diseases can be grouped in three categories: diseases which cause high levels of mortality; diseases which place on populations heavy burdens of disability; and diseases which owing to the rapid and unexpected nature of their spread can have serious global repercussions. Many of the key determinants of health and the causes of infectious diseases lie outside the direct control of the health sector. Other sectors involved are those dealing with sanitation and water supply, environmental and climate change, education, agriculture, trade, tourism, transport, industrial development and housing.
Therefore, it is important to prevent the spread of infectious diseases as much as possible, particularly those infections that have a higher likelihood of causing death and disability.
From the UK Health Security Agency, the general advice for managing outbreaks of infectious diseases in a particular setting or establishment is to encourage people who are unwell to not attend or remain separate from others, ensuring all eligible groups are enabled and supported to take up the offer of vaccinations, ensuring occupied spaces are well ventilated, reinforcing good hygiene practice, and requesting that infectious diseases are reported to the setting or establishment. There are recommendations on how long people should remain away from a setting such as work, school or nursery for specific diseases, and certain infections need to be reported to the Health Protection Teams. The UK Health Security Agency also has advice for Managing Specific Infectious Diseases.
This section of the JSNA only includes statistics and information from a small number of infectious diseases where data is available on Office for Health Improvement & Disparities’ Fingertips. There are many more infectious diseases, but information is not necessarily available on these. Further information on some other infectious diseases within this JSNA can be found under Coronavirus (COVID-19), Respiratory Diseases and Sexually Transmitted Infectious under Health Factors within Adults. Information relating to vaccinations can be found within Vaccinations under Prevention for Adults, and within Screening and Vaccinations under Health Factors for Children and Young People.
E. Coli (Escherichia Coli) Bacteraemia
Escherichia coli (abbreviated as E. coli) bacteria are frequently found in the intestines of humans and animals. There are many different types of E. coli, and while some live in the intestine quite harmlessly, others may cause a variety of diseases.
The bacterium is found in faeces and can survive in the environment. E. coli bacteria can cause a range of infections including urinary tract infection, cystitis (infection of the bladder), and intestinal infection. E. coli bacteraemia (blood stream infection) may be caused by primary infections spreading to the blood.
MRSA (Methicillin-Resistant Staphylococcus Aureus)
Staphylococcus aureus (S. aureus) is a bacterium that commonly colonises human skin and mucosa without causing any problems. It can also cause disease, particularly if there is an opportunity for the bacteria to enter the body, for example through broken skin or a medical procedure.
If the bacteria enter the body, illnesses which range from mild to life-threatening may then develop. These include skin and wound infections, infected eczema, abscesses or joint infections, infections of the heart valves (endocarditis), pneumonia and bacteraemia (blood stream infection).
Most strains of S. aureus are sensitive to the more commonly used antibiotics, and infections can be effectively treated. Some S. aureus bacteria are more resistant. Those resistant to the antibiotic meticillin are termed meticillin resistant Staphylococcus aureus (MRSA) and often require different types of antibiotic to treat them. Those that are sensitive to meticillin are termed meticillin susceptible Staphylococcus aureus (MSSA). MRSA and MSSA only differ in their degree of antibiotic resistance: other than that there is no real difference between them.
Clostridium Difficile (C. Difficile) Infection
Clostridioides difficile (C. difficile) is a bacterium that’s found in people’s intestines. It can be found in healthy people, where it causes no symptoms (up to 3% of adults and 66% of babies).
C. difficile causes disease when the normal bacteria in the gut are disadvantaged, usually by someone taking antibiotics. This allows C. difficile to grow to unusually high levels. It also allows the toxin that some strains of C. difficile produce to reach levels where it attacks the intestines and causes mild to severe diarrhoea.
C. difficile can lead to more serious infections of the intestines with severe inflammation of the bowel (pseudomembranous colitis). C. difficile is the biggest cause of infectious diarrhoea in hospitalised patients.
You can become infected with C. difficile if you ingest the bacterium (through contact with a contaminated environment or person). People who become infected with C. difficile are usually those who’ve taken antibiotics, particularly the elderly and people whose immune systems are compromised.
Klebsiella Spp. Bacteraemia
Klebsiella species are a Gram-negative rod shaped bacteria belonging to the Enterobacteriaceae family. They are commonly found in the environment and in the human intestinal tract (where they do not normally cause disease).
These species can cause a range of healthcare-associated infections, including pneumonia, bloodstream infections, wound or surgical site infections and meningitis. Acquired endogenously (from the patient’s own gut flora) or exogenously from the healthcare environment.
Patient to patient spread occurs through contaminated hands of healthcare workers or less commonly by contamination of the environment. Vulnerable patients, like the immune compromised, are most at risk. Infections can be associated with use of invasive devices or medical procedures.
Klebsiella spp. can become resistant to a wide range of antibiotics through a variety of mechanisms.
Pseudomonas Aeruginosa (P. Aeruginosa) Bacteraemia
Pseudomonas aeruginosa (P. aeruginosa) is a Gram-negative bacterium often found in soil and ground water. P. aeruginosa is an opportunistic pathogen and it rarely affects healthy individuals. It can cause a wide range of infections, particularly in those with a weakened immune system, for example cancer patients, newborns and people with severe burns, diabetes mellitus or cystic fibrosis.
P. aeruginosa infections are sometimes associated with contact with contaminated water. In hospitals, the organism can contaminate devices that are left inside the body, such as respiratory equipment and catheters. P. aeruginosa is resistant to many commonly-used antibiotics.
Tuberculosis (TB)
From the World Health Organisation, tuberculosis (TB) is caused by bacteria (Mycobacterium tuberculosis) and it most often affects the lungs. TB is spread through the air when people with lung TB cough, sneeze or spit. A person needs to inhale only a few germs to become infected. Every year, 10 million people fall ill with TB. Despite being a preventable and curable disease, 1.5 million people die from TB each year – making it the world’s top infectious killer. TB is the leading cause of death of people with HIV and also a major contributor to antimicrobial resistance. Most of the people who fall ill with TB live in low- and middle-income countries, but TB is present all over the world. About half of all people with TB can be found in eight countries: Bangladesh, China, India, Indonesia, Nigeria, Pakistan, Philippines and South Africa. About a quarter of the global population is estimated to have been infected with TB bacteria, but most people will not go on to develop TB disease and some will clear the infection. Those who are infected but not (yet) ill with the disease cannot transmit it. People infected with TB bacteria have a 5–10% lifetime risk of falling ill with TB. Those with compromised immune systems, such as people living with HIV, malnutrition or diabetes, or people who use tobacco, have a higher risk of falling ill.
From the NHS, the main treatment for TB is to take antibiotics for at least six months (or 3-6 months if the person does not have symptoms and has latent TB). If TB has spread to the brain, spinal cord or the area around the heart, then steroid medicine may also be necessary for a few weeks. If the person does not take the antibiotics correctly and complete the full course of treatment, TB can come back. There is a vaccination available for TB called the BCG (Bacillus Calmette-Guérin) vaccine and it is recommended for some people who are at a higher risk of catching TB or getting seriously ill from it.
Data Considerations
Data is available on the Office for Health Improvement & Disparities’ Fingertips for the rate of laboratory confirmed cases of various bacteraemia. For some specific bacteraemia, the numbers are small and in some cases very small with only a handful of cases each year. This means that there will be month-to-month and year-to-year variability in the trends over time, particularly for smaller geographical areas like Hull relative to larger geographical areas like the region or England. It can also mean that it is more tricky to interpret the trends over time as it is possible that a ‘blip’ of one or two fewer or additional cases can impact on the overall rate by a relatively large degree. See Small Numbers in the Glossary for more information.
The rates are given as laboratory confirmed cases, and will not include all cases of the infection. It is also possible that numbers increase over time if there is better detection, testing and/or recording of the specific infection over time. This appears to be the case for some bacteraemia where there were few cases in early 2017 and a more constant number of cases within a year or two (particularly for England where the trends in the infection rates are more stable over time).
On Fingertips, the number of reported cases of infections are given as as a total over a financial year and as a rolling 12-month rate of the number of cases by month for each sub-Integrated Care Board. Hull is within the Humber and North Yorkshire Integrated Care Board, and is coded as ’03F’. Both rates are given as the number of laboratory confirmed cases per 100,000 population.
The 12 month rolling rate is calculated as the total number of cases which occurred in the specified month and the preceding 11 months divided by population of the sub-ICB for the current month and the preceding 11 months. This rate is then multiplied by 100,000 to present as the number of laboratory confirmed cases per 100,000 population.
With the figures quoted as 12-month rolling count, it does mean that a new case will remain in the ‘count’ for a whole 12 month period. For instance, in the case of Methicillin-Resistant Staphylococcus aureus (MRSA), there were three cases in Hull for the year November 2017 to October 2018, and these occurred in November 2017, March 2018 and October 2018 (as the counts increased by one for each of these months). In the year prior to this covering the period, November 2016 to October 2017, there had been no cases in the previous 12 months in Hull. There were two cases in the year December 2017 to November 2018 and these occurred during November 2017 and March 2018 (the case in November 2017 was more than a year ago so dropped out of the 12-month rolling count). There was a new case in January 2019 which increased the annual count to three again. Therefore, the counts for each month should not be summed as this has already been done and this would result in ‘double counting’.
The Hull Picture
E. Coli (Escherichia Coli) Bacteraemia
Cases by Financial Year
The number of laboratory confirmed cases of E. coli is given below for Hull (03F) over the most recent financial year compared to the others within the Humber and North Yorkshire Integrated Care Board, as well as the rate based on those that were community-onset. The rates are given as the number of cases over the year per 100,000 population.
The rate of cases of E. coli over the year for 2024/25 was 20% higher than England and 13% higher than England for community-onset cases.
Compared with benchmark
Better
Similar
Worse
Not Compared
Lower
Similar
Higher
| Indicator | Period | England | NHS Humber and North Yorkshire Integrated Care Board - QOQ | Humber and North Yorkshire ICB - 02Y | Humber and North Yorkshire ICB - 03F | Humber and North Yorkshire ICB - 03H | Humber and North Yorkshire ICB - 03K | Humber and North Yorkshire ICB - 03Q | Humber and North Yorkshire ICB - 42D |
|---|---|---|---|---|---|---|---|---|---|
E. coli bacteraemia case counts and rates by Sub ICB locations (SICBL) and financial year (Persons All ages) | 2024/25 | 76.6 | 93.2 | 100.6 | 92.1 | 57.8 | 84.8 | 96.3 | 101.9 |
E. coli bacteraemia case counts and rates of community-onset, by sub ICB location (SICBL) and financial year (Persons All ages) | 2024/25 | 61.8 | 74.8 | 73.2 | 70.1 | 47.6 | 73.1 | 80.1 | 85.2 |
| Indicator | Period | England | NHS Humber and North Yorkshire Integrated Care Board - QOQ | Humber and North Yorkshire ICB - 02Y | Humber and North Yorkshire ICB - 03F | Humber and North Yorkshire ICB - 03H | Humber and North Yorkshire ICB - 03K | Humber and North Yorkshire ICB - 03Q | Humber and North Yorkshire ICB - 42D |
|---|---|---|---|---|---|---|---|---|---|
E. coli bacteraemia case counts and rates by Sub ICB locations (SICBL) and financial year (Persons All ages) | 2024/25 | 76.6 | 93.2 | 100.6 | 92.1 | 57.8 | 84.8 | 96.3 | 101.9 |
E. coli bacteraemia case counts and rates of community-onset, by sub ICB location (SICBL) and financial year (Persons All ages) | 2024/25 | 61.8 | 74.8 | 73.2 | 70.1 | 47.6 | 73.1 | 80.1 | 85.2 |
The rate of E. coli cases in Hull had been increasing between 2014/15 and 2019/20 from 70 to 96 cases per 100,000 population, although this might have occurred by chance as there is some year-on-year variability and the rate in 2014/15 was particularly low (the rate in 2013/14 was nearly as high as the peak in 2018/19). The rate decreased to 76 per 100,000 population in 2020/21 due to the pandemic and presumably fewer hospital-onset cases due to the lower admission rates for non-COVID conditions. The rate then increased slightly in 2021/22 and 2022/23 before a large increase in 2023/24 to 100 cases per 100,000 population, although the rate fell back a bit in 2024/25 to 92 cases per 100,000 population.
Despite a few extreme peaks in some years, between 2012/13 and 2024/25, the rate of E. coli cases has followed a similar pattern to England, although there has been less variability in England and the rate in Hull has been consistently higher than England.
Over the year 20243/25, there were 247 cases of E. coli reported in Hull.
Compared with benchmark
Better
Similar
Worse
Not Compared
Lower
Similar
Higher
E. coli bacteraemia case counts and rates by Sub ICB locations (SICBL) and financial year (Persons All ages)
|
Period
|
Humber and North Yorkshire ICB - 03F |
NHS Humber and North Yorkshire Integrated Care Board - QOQ
|
England
|
||||
|---|---|---|---|---|---|---|---|
|
Count
|
Value
|
95%
Lower CI |
95%
Upper CI |
||||
| 2012/13 | • | 200 | 77.6 | - | - | 73.3 | 60.4 |
| 2013/14 | • | 245 | 94.4 | - | - | 78.6 | 63.5 |
| 2014/15 | • | 179 | 68.5 | - | - | 78.1 | 65.8 |
| 2015/16 | • | 211 | 80.0 | - | - | 81.2 | 69.6 |
| 2016/17 | • | 235 | 88.6 | - | - | 88.6 | 73.6 |
| 2017/18 | • | 238 | 88.9 | - | - | 88.8 | 73.9 |
| 2018/19 | • | 255 | 95.0 | - | - | 93.9 | 77.3 |
| 2019/20 | • | 249 | 92.6 | - | - | 93.6 | 77.0 |
| 2020/21 | • | 197 | 73.8 | - | - | 78.8 | 65.4 |
| 2021/22 | • | 203 | 76.0 | - | - | 76.7 | 67.1 |
| 2022/23 | • | 214 | 79.6 | - | - | 83.3 | 67.9 |
| 2023/24 | • | 269 | 99.9 | - | - | 89.4 | 73.8 |
| 2024/25 | • | 247 | 92.1 | - | - | 93.2 | 76.6 |
Source: UK Health Security Agency
As around three-quarters of E. coli cases are community-onset, the trends over time for community-onset E. coli follow a similar pattern with an increase between 2014/15 and 2019/20 with a decrease in 2020/21 due to the pandemic and less population mixing, and an increase subsequently, with the latest rate around the same as the peak prior to the pandemic.
A reasonably similar pattern of change has occurred for England, but again the rate of variability has been much greater in Hull. The infection rate has increased since the low of 2020/21 for both Hull and England, but the rate of increase was particularly high in 2023/24, although a decrease was seen for 2024/25.
Over the year 2024/25, there were 188 cases of E. coli reported in Hull which were community-onset, which is 76% of all cases reported.
Compared with benchmark
Better
Similar
Worse
Not Compared
Lower
Similar
Higher
E. coli bacteraemia case counts and rates of community-onset, by sub ICB location (SICBL) and financial year (Persons All ages)
|
Period
|
Humber and North Yorkshire ICB - 03F |
NHS Humber and North Yorkshire Integrated Care Board - QOQ
|
England
|
||||
|---|---|---|---|---|---|---|---|
|
Count
|
Value
|
95%
Lower CI |
95%
Upper CI |
||||
| 2012/13 | • | 155 | 60.1 | - | - | 54.2 | 46.3 |
| 2013/14 | • | 183 | 70.5 | - | - | 59.0 | 49.5 |
| 2014/15 | • | 136 | 52.0 | - | - | 60.5 | 52.2 |
| 2015/16 | • | 155 | 58.7 | - | - | 63.9 | 55.5 |
| 2016/17 | • | 196 | 73.9 | - | - | 71.8 | 59.4 |
| 2017/18 | • | 186 | 69.5 | - | - | 72.0 | 60.1 |
| 2018/19 | • | 205 | 76.4 | - | - | 76.6 | 63.7 |
| 2019/20 | • | 197 | 73.2 | - | - | 76.3 | 63.1 |
| 2020/21 | • | 146 | 54.7 | - | - | 65.6 | 53.8 |
| 2021/22 | • | 155 | 58.0 | - | - | 62.6 | 54.6 |
| 2022/23 | • | 157 | 58.4 | - | - | 66.7 | 54.1 |
| 2023/24 | • | 208 | 77.3 | - | - | 73.8 | 59.5 |
| 2024/25 | • | 188 | 70.1 | - | - | 74.8 | 61.8 |
Source: UK Health Security Agency
Cases by Month (12-Month Rolling Total)
The 12-month rolling total count of the number of laboratory confirmed cases of E. coli is given below for Hull (03F) compared to the others within the Humber and North Yorkshire Integrated Care Board, as well as the rate based on those that were hospital-onset or community-onset.
For October 2025, the rates in Hull are considerably higher than England particularly for hospital-onset (63% higher in Hull) and overall (20% higher in Hull).
Compared with benchmark
Better
Similar
Worse
Not Compared
Lower
Similar
Higher
| Indicator | Period | England | NHS Humber and North Yorkshire Integrated Care Board - QOQ | Humber and North Yorkshire ICB - 02Y | Humber and North Yorkshire ICB - 03F | Humber and North Yorkshire ICB - 03H | Humber and North Yorkshire ICB - 03K | Humber and North Yorkshire ICB - 03Q | Humber and North Yorkshire ICB - 42D |
|---|---|---|---|---|---|---|---|---|---|
E. coli bacteraemia 12-month rolling case counts and rates, by Sub ICB Location (SICBL) and month (Persons All ages) | Apr 2026 | 76.5 | 88.5 | 98.4 | 83.9 | 65.0 | 82.3 | 84.0 | 98.6 |
E. coli bacteraemia 12-month rolling case counts and rates of hospital-onset, by Sub ICB Location (SICBL) and month (Persons All ages) | Apr 2026 | 14.0 | 15.5 | 17.6 | 17.4 | 16.3 | 15.2 | 13.6 | 14.1 |
E. coli bacteraemia 12-month rolling case counts and rates of community-onset, by Sub ICB Location (SICBL) and month (Persons All ages) | Apr 2026 | 62.5 | 73.0 | 80.8 | 66.4 | 48.8 | 67.1 | 70.4 | 84.4 |
| Indicator | Period | England | NHS Humber and North Yorkshire Integrated Care Board - QOQ | Humber and North Yorkshire ICB - 02Y | Humber and North Yorkshire ICB - 03F | Humber and North Yorkshire ICB - 03H | Humber and North Yorkshire ICB - 03K | Humber and North Yorkshire ICB - 03Q | Humber and North Yorkshire ICB - 42D |
|---|---|---|---|---|---|---|---|---|---|
E. coli bacteraemia 12-month rolling case counts and rates, by Sub ICB Location (SICBL) and month (Persons All ages) | Apr 2026 | 76.5 | 88.5 | 98.4 | 83.9 | 65.0 | 82.3 | 84.0 | 98.6 |
E. coli bacteraemia 12-month rolling case counts and rates of hospital-onset, by Sub ICB Location (SICBL) and month (Persons All ages) | Apr 2026 | 14.0 | 15.5 | 17.6 | 17.4 | 16.3 | 15.2 | 13.6 | 14.1 |
E. coli bacteraemia 12-month rolling case counts and rates of community-onset, by Sub ICB Location (SICBL) and month (Persons All ages) | Apr 2026 | 62.5 | 73.0 | 80.8 | 66.4 | 48.8 | 67.1 | 70.4 | 84.4 |
During early 2015, there were around 200 cases of E. coli per year when examining the rolling 12-monthly figures equating to around 17 cases on average per month. This gradually increased to reach a peak of around 260 cases per year (so around 22 per month) prior to the COVID-19 pandemic (lockdown commenced March 2020). The rates fell quite sharply during 2020 and early 2021 to reach a low of around 190 cases per year (around 16 per month). However, rates have gradually increased over time to reach to around 250-270 cases for October 2023 to October 2025 (around 21-22 cases per month).
The rates in Hull have been consistently higher than those across England, and was consistently higher than the regional average between May 2023 and February 2025. The rates have increased for both England and the region since the low rates during the pandemic, but the rate of increase has been greater in Hull particularly since May 2023.
This has increased the inequalities gap between Hull and England. The infection rate has not reached the pre-pandemic peak of 102 cases per 100,000 population for the 12 months up to February 2020, and is at 94 cases per 100,000 population in October 2025.
In the latest period, November 2024 to October 2025, there were 253 cases of E. coli bacteraemia in Hull.
Compared with benchmark
Better
Similar
Worse
Not Compared
Lower
Similar
Higher
E. coli bacteraemia 12-month rolling case counts and rates, by Sub ICB Location (SICBL) and month (Persons All ages)
|
Period
|
Humber and North Yorkshire ICB - 03F |
NHS Humber and North Yorkshire Integrated Care Board - QOQ
|
England
|
||||
|---|---|---|---|---|---|---|---|
|
Count
|
Value
|
95%
Lower CI |
95%
Upper CI |
||||
| Dec 2014 | • | 202 | 77.4 | - | - | 78.9 | 65.6 |
| Jan 2015 | • | 192 | 73.5 | - | - | 78.3 | 65.6 |
| Feb 2015 | • | 188 | 72.0 | - | - | 78.3 | 65.7 |
| Mar 2015 | • | 179 | 68.5 | - | - | 78.1 | 65.8 |
| Apr 2015 | • | 179 | 68.5 | - | - | 77.9 | 65.8 |
| May 2015 | • | 184 | 70.3 | - | - | 78.0 | 65.8 |
| Jun 2015 | • | 188 | 71.8 | - | - | 79.2 | 66.2 |
| Jul 2015 | • | 185 | 70.6 | - | - | 78.9 | 66.4 |
| Aug 2015 | • | 182 | 69.4 | - | - | 77.7 | 66.6 |
| Sep 2015 | • | 184 | 70.2 | - | - | 78.0 | 67.1 |
| Oct 2015 | • | 192 | 73.2 | - | - | 79.4 | 67.5 |
| Nov 2015 | • | 200 | 76.2 | - | - | 78.9 | 67.9 |
| Dec 2015 | • | 205 | 78.0 | - | - | 78.1 | 68.3 |
| Jan 2016 | • | 214 | 81.4 | - | - | 79.6 | 68.9 |
| Feb 2016 | • | 208 | 78.9 | - | - | 80.5 | 69.1 |
| Mar 2016 | • | 210 | 79.6 | - | - | 81.0 | 69.6 |
| Apr 2016 | • | 218 | 82.6 | - | - | 81.1 | 69.8 |
| May 2016 | • | 218 | 82.5 | - | - | 80.2 | 70.4 |
| Jun 2016 | • | 218 | 82.4 | - | - | 80.3 | 70.7 |
| Jul 2016 | • | 218 | 82.4 | - | - | 82.6 | 71.2 |
| Aug 2016 | • | 225 | 85.0 | - | - | 85.5 | 71.9 |
| Sep 2016 | • | 226 | 85.3 | - | - | 86.1 | 72.0 |
| Oct 2016 | • | 228 | 86.0 | - | - | 86.2 | 72.4 |
| Nov 2016 | • | 235 | 88.6 | - | - | 87.6 | 72.6 |
| Dec 2016 | • | 233 | 87.7 | - | - | 86.9 | 73.0 |
| Jan 2017 | • | 232 | 87.3 | - | - | 86.1 | 72.9 |
| Feb 2017 | • | 231 | 87.1 | - | - | 87.8 | 73.3 |
| Mar 2017 | • | 235 | 88.6 | - | - | 88.5 | 73.6 |
| Apr 2017 | • | 232 | 87.4 | - | - | 89.4 | 74.0 |
| May 2017 | • | 231 | 86.9 | - | - | 90.8 | 74.0 |
| Jun 2017 | • | 240 | 90.2 | - | - | 91.6 | 74.1 |
| Jul 2017 | • | 239 | 89.8 | - | - | 90.2 | 74.2 |
| Aug 2017 | • | 238 | 89.4 | - | - | 89.8 | 74.2 |
| Sep 2017 | • | 242 | 90.8 | - | - | 90.5 | 74.2 |
| Oct 2017 | • | 231 | 86.6 | - | - | 90.7 | 74.3 |
| Nov 2017 | • | 218 | 81.7 | - | - | 89.9 | 74.5 |
| Dec 2017 | • | 221 | 82.7 | - | - | 91.1 | 74.4 |
| Jan 2018 | • | 231 | 86.4 | - | - | 91.9 | 74.4 |
| Feb 2018 | • | 241 | 90.1 | - | - | 90.0 | 74.1 |
| Mar 2018 | • | 237 | 88.5 | - | - | 88.9 | 73.9 |
| Apr 2018 | • | 245 | 91.5 | - | - | 89.7 | 74.0 |
| May 2018 | • | 243 | 90.7 | - | - | 89.9 | 74.4 |
| Jun 2018 | • | 241 | 90.0 | - | - | 89.9 | 74.7 |
| Jul 2018 | • | 249 | 92.9 | - | - | 91.6 | 74.9 |
| Aug 2018 | • | 244 | 91.0 | - | - | 91.1 | 75.2 |
| Sep 2018 | • | 244 | 91.0 | - | - | 91.4 | 75.6 |
| Oct 2018 | • | 244 | 91.0 | - | - | 90.4 | 75.9 |
| Nov 2018 | • | 248 | 92.5 | - | - | 90.3 | 75.9 |
| Dec 2018 | • | 252 | 94.0 | - | - | 90.5 | 76.1 |
| Jan 2019 | • | 243 | 90.6 | - | - | 90.6 | 76.5 |
| Feb 2019 | • | 241 | 89.8 | - | - | 91.3 | 76.8 |
| Mar 2019 | • | 256 | 95.4 | - | - | 93.8 | 77.3 |
| Apr 2019 | • | 254 | 94.7 | - | - | 93.4 | 77.6 |
| May 2019 | • | 259 | 96.5 | - | - | 93.6 | 77.8 |
| Jun 2019 | • | 263 | 98.0 | - | - | 93.2 | 77.7 |
| Jul 2019 | • | 257 | 95.8 | - | - | 91.9 | 77.8 |
| Aug 2019 | • | 262 | 97.6 | - | - | 93.7 | 78.1 |
| Sep 2019 | • | 256 | 95.4 | - | - | 93.2 | 77.9 |
| Oct 2019 | • | 264 | 98.4 | - | - | 94.4 | 77.9 |
| Nov 2019 | • | 268 | 99.9 | - | - | 95.8 | 77.9 |
| Dec 2019 | • | 262 | 97.7 | - | - | 96.2 | 77.9 |
| Jan 2020 | • | 268 | 99.9 | - | - | 96.7 | 78.1 |
| Feb 2020 | • | 266 | 98.9 | - | - | 96.3 | 78.1 |
| Mar 2020 | • | 250 | 92.9 | - | - | 93.3 | 77.0 |
| Apr 2020 | • | 242 | 90.0 | - | - | 91.5 | 75.0 |
| May 2020 | • | 235 | 87.4 | - | - | 90.3 | 73.4 |
| Jun 2020 | • | 228 | 84.9 | - | - | 89.6 | 72.4 |
| Jul 2020 | • | 228 | 84.9 | - | - | 89.4 | 71.3 |
| Aug 2020 | • | 221 | 82.3 | - | - | 86.9 | 70.2 |
| Sep 2020 | • | 219 | 81.6 | - | - | 86.0 | 69.6 |
| Oct 2020 | • | 210 | 78.3 | - | - | 84.4 | 68.6 |
| Nov 2020 | • | 202 | 75.4 | - | - | 81.8 | 67.9 |
| Dec 2020 | • | 205 | 76.5 | - | - | 80.3 | 67.2 |
| Jan 2021 | • | 194 | 72.5 | - | - | 78.8 | 65.8 |
| Feb 2021 | • | 187 | 70.1 | - | - | 77.1 | 65.0 |
| Mar 2021 | • | 195 | 73.1 | - | - | 78.7 | 65.4 |
| Apr 2021 | • | 198 | 74.2 | - | - | 80.1 | 66.8 |
| May 2021 | • | 200 | 75.0 | - | - | 80.4 | 67.3 |
| Jun 2021 | • | 193 | 72.3 | - | - | 80.9 | 67.6 |
| Jul 2021 | • | 193 | 72.3 | - | - | 80.5 | 67.8 |
| Aug 2021 | • | 199 | 74.6 | - | - | 79.9 | 67.5 |
| Sep 2021 | • | 202 | 75.7 | - | - | 80.4 | 67.3 |
| Oct 2021 | • | 206 | 77.2 | - | - | 80.0 | 66.9 |
| Nov 2021 | • | 203 | 76.0 | - | - | 80.1 | 66.9 |
| Dec 2021 | • | 197 | 73.8 | - | - | 79.7 | 66.9 |
| Jan 2022 | • | 201 | 75.3 | - | - | 78.3 | 67.3 |
| Feb 2022 | • | 202 | 75.6 | - | - | 78.0 | 67.4 |
| Mar 2022 | • | 204 | 76.4 | - | - | 76.8 | 67.1 |
| Apr 2022 | • | 207 | 77.4 | - | - | 77.4 | 66.9 |
| May 2022 | • | 207 | 77.4 | - | - | 77.2 | 66.8 |
| Jun 2022 | • | 213 | 79.5 | - | - | 76.5 | 66.7 |
| Jul 2022 | • | 211 | 78.7 | - | - | 76.0 | 66.5 |
| Aug 2022 | • | 208 | 77.5 | - | - | 76.6 | 66.7 |
| Sep 2022 | • | 211 | 78.6 | - | - | 76.7 | 67.1 |
| Oct 2022 | • | 205 | 76.3 | - | - | 78.0 | 67.4 |
| Nov 2022 | • | 212 | 78.8 | - | - | 78.8 | 67.6 |
| Dec 2022 | • | 212 | 78.8 | - | - | 79.8 | 67.3 |
| Jan 2023 | • | 214 | 79.4 | - | - | 82.0 | 67.2 |
| Feb 2023 | • | 220 | 81.6 | - | - | 83.2 | 67.4 |
| Mar 2023 | • | 214 | 79.3 | - | - | 83.0 | 67.6 |
| Apr 2023 | • | 222 | 82.2 | - | - | 82.6 | 67.8 |
| May 2023 | • | 227 | 83.9 | - | - | 82.7 | 68.1 |
| Jun 2023 | • | 232 | 85.7 | - | - | 84.2 | 68.6 |
| Jul 2023 | • | 233 | 86.0 | - | - | 84.7 | 69.2 |
| Aug 2023 | • | 233 | 85.9 | - | - | 83.6 | 69.5 |
| Sep 2023 | • | 233 | 85.8 | - | - | 83.9 | 69.6 |
| Oct 2023 | • | 246 | 90.5 | - | - | 85.0 | 70.1 |
| Nov 2023 | • | 249 | 91.5 | - | - | 85.4 | 70.3 |
| Dec 2023 | • | 251 | 92.1 | - | - | 85.8 | 71.2 |
| Jan 2024 | • | 250 | 91.6 | - | - | 86.4 | 71.8 |
| Feb 2024 | • | 262 | 95.7 | - | - | 87.6 | 72.1 |
| Mar 2024 | • | 269 | 98.1 | - | - | 88.1 | 72.5 |
| Apr 2024 | • | 263 | 95.9 | - | - | 88.2 | 73.0 |
| May 2024 | • | 255 | 92.9 | - | - | 89.0 | 73.3 |
| Jun 2024 | • | 249 | 90.7 | - | - | 89.5 | 73.6 |
| Jul 2024 | • | 262 | 95.4 | - | - | 90.3 | 73.6 |
| Aug 2024 | • | 262 | 95.3 | - | - | 91.6 | 74.0 |
| Sep 2024 | • | 257 | 93.5 | - | - | 91.5 | 74.0 |
| Oct 2024 | • | 256 | 93.1 | - | - | 90.3 | 74.3 |
| Nov 2024 | • | 254 | 92.3 | - | - | 90.6 | 74.5 |
| Dec 2024 | • | 265 | 96.3 | - | - | 91.1 | 74.5 |
| Jan 2025 | • | 267 | 97.0 | - | - | 90.5 | 74.5 |
| Feb 2025 | • | 257 | 93.6 | - | - | 90.9 | 74.5 |
| Mar 2025 | • | 247 | 89.9 | - | - | 91.3 | 74.6 |
| Apr 2025 | • | 249 | 90.6 | - | - | 91.4 | 74.7 |
| May 2025 | • | 255 | 92.8 | - | - | 91.5 | 75.0 |
| Jun 2025 | • | 268 | 97.5 | - | - | 91.7 | 75.0 |
| Jul 2025 | • | 258 | 93.8 | - | - | 92.5 | 75.8 |
| Aug 2025 | • | 255 | 92.7 | - | - | 92.9 | 76.1 |
| Sep 2025 | • | 257 | 93.4 | - | - | 94.0 | 76.3 |
| Oct 2025 | • | 253 | 91.9 | - | - | 93.8 | 76.4 |
| Nov 2025 | • | 251 | 91.2 | - | - | 93.6 | 76.5 |
| Dec 2025 | • | 245 | 89.0 | - | - | 92.6 | 76.5 |
| Jan 2026 | • | 238 | 86.4 | - | - | 91.3 | 76.4 |
| Feb 2026 | • | 236 | 85.7 | - | - | 89.7 | 76.5 |
| Mar 2026 | • | 236 | 85.7 | - | - | 89.5 | 76.6 |
| Apr 2026 | • | 231 | 83.9 | - | - | 88.5 | 76.5 |
Source: UK Health Security Agency
There is more month-to-month variability in the rate of hospital-onset cases of E. coli bacteraemia as the total number of cases are smaller. However, there is an overall slight increasing trend in the hospital-onset infection rate between 2015 and 2024. The rate has consistently been higher than England.
The number of hospital-onset cases of E. coli has tended to vary in Hull from around 15 to around 25 cases per 100,000 population with the highest value of 25.3 cases per 100,000 for the year January to December 2023. Since then the number of cases decreased to reach 17.5 cases per 100,000 population for the year December 2023 to November 2024, but then increased at a relatively fast rate to reach 27.2 cases per 100,000 population for the August 2024 to July 2025, although has decreased since, to 23.9 cases per 100,000 population for the 12-month period November 2024 to October 2025.
In the latest period, November 2024 to October 2025, there were 64 cases of E. coli bacteraemia in Hull that were hospital-onset. One-quarter of all E. coli cases that were laboratory confirmed were hospital-onset.
Compared with benchmark
Better
Similar
Worse
Not Compared
Lower
Similar
Higher
E. coli bacteraemia 12-month rolling case counts and rates of hospital-onset, by Sub ICB Location (SICBL) and month (Persons All ages)
|
Period
|
Humber and North Yorkshire ICB - 03F |
NHS Humber and North Yorkshire Integrated Care Board - QOQ
|
England
|
||||
|---|---|---|---|---|---|---|---|
|
Count
|
Value
|
95%
Lower CI |
95%
Upper CI |
||||
| Dec 2014 | • | 43 | 16.5 | - | - | 18.5 | 13.6 |
| Jan 2015 | • | 46 | 17.6 | - | - | 18.2 | 13.6 |
| Feb 2015 | • | 46 | 17.6 | - | - | 18.0 | 13.5 |
| Mar 2015 | • | 43 | 16.5 | - | - | 17.7 | 13.5 |
| Apr 2015 | • | 43 | 16.4 | - | - | 17.0 | 13.6 |
| May 2015 | • | 45 | 17.2 | - | - | 16.6 | 13.5 |
| Jun 2015 | • | 49 | 18.7 | - | - | 17.5 | 13.6 |
| Jul 2015 | • | 48 | 18.3 | - | - | 16.6 | 13.6 |
| Aug 2015 | • | 49 | 18.7 | - | - | 16.7 | 13.7 |
| Sep 2015 | • | 51 | 19.4 | - | - | 16.8 | 13.8 |
| Oct 2015 | • | 53 | 20.2 | - | - | 17.3 | 13.9 |
| Nov 2015 | • | 56 | 21.3 | - | - | 16.8 | 14.0 |
| Dec 2015 | • | 56 | 21.3 | - | - | 16.6 | 13.9 |
| Jan 2016 | • | 56 | 21.3 | - | - | 16.6 | 14.0 |
| Feb 2016 | • | 55 | 20.9 | - | - | 17.4 | 14.0 |
| Mar 2016 | • | 55 | 20.8 | - | - | 17.2 | 14.1 |
| Apr 2016 | • | 54 | 20.4 | - | - | 17.1 | 14.0 |
| May 2016 | • | 55 | 20.8 | - | - | 17.1 | 14.1 |
| Jun 2016 | • | 53 | 20.0 | - | - | 16.9 | 14.3 |
| Jul 2016 | • | 52 | 19.7 | - | - | 17.3 | 14.4 |
| Aug 2016 | • | 46 | 17.4 | - | - | 17.5 | 14.4 |
| Sep 2016 | • | 41 | 15.5 | - | - | 17.5 | 14.4 |
| Oct 2016 | • | 39 | 14.7 | - | - | 16.9 | 14.3 |
| Nov 2016 | • | 39 | 14.7 | - | - | 17.4 | 14.3 |
| Dec 2016 | • | 41 | 15.4 | - | - | 17.3 | 14.3 |
| Jan 2017 | • | 40 | 15.1 | - | - | 16.9 | 14.3 |
| Feb 2017 | • | 39 | 14.7 | - | - | 16.9 | 14.3 |
| Mar 2017 | • | 39 | 14.7 | - | - | 16.8 | 14.3 |
| Apr 2017 | • | 40 | 15.1 | - | - | 16.8 | 14.3 |
| May 2017 | • | 35 | 13.2 | - | - | 16.8 | 14.3 |
| Jun 2017 | • | 38 | 14.3 | - | - | 17.1 | 14.2 |
| Jul 2017 | • | 39 | 14.7 | - | - | 16.8 | 14.1 |
| Aug 2017 | • | 44 | 16.5 | - | - | 16.4 | 14.0 |
| Sep 2017 | • | 47 | 17.6 | - | - | 16.3 | 14.1 |
| Oct 2017 | • | 46 | 17.2 | - | - | 16.6 | 14.0 |
| Nov 2017 | • | 45 | 16.9 | - | - | 16.7 | 14.1 |
| Dec 2017 | • | 43 | 16.1 | - | - | 17.0 | 14.0 |
| Jan 2018 | • | 48 | 18.0 | - | - | 17.5 | 14.0 |
| Feb 2018 | • | 52 | 19.4 | - | - | 16.6 | 13.9 |
| Mar 2018 | • | 52 | 19.4 | - | - | 17.0 | 13.8 |
| Apr 2018 | • | 54 | 20.2 | - | - | 17.5 | 13.8 |
| May 2018 | • | 57 | 21.3 | - | - | 17.3 | 13.7 |
| Jun 2018 | • | 57 | 21.3 | - | - | 16.8 | 13.7 |
| Jul 2018 | • | 60 | 22.4 | - | - | 17.2 | 13.6 |
| Aug 2018 | • | 58 | 21.6 | - | - | 17.5 | 13.7 |
| Sep 2018 | • | 55 | 20.5 | - | - | 17.3 | 13.7 |
| Oct 2018 | • | 52 | 19.4 | - | - | 16.8 | 13.6 |
| Nov 2018 | • | 51 | 19.0 | - | - | 16.4 | 13.6 |
| Dec 2018 | • | 53 | 19.8 | - | - | 16.9 | 13.6 |
| Jan 2019 | • | 47 | 17.5 | - | - | 16.4 | 13.6 |
| Feb 2019 | • | 43 | 16.0 | - | - | 17.0 | 13.5 |
| Mar 2019 | • | 50 | 18.6 | - | - | 17.4 | 13.6 |
| Apr 2019 | • | 51 | 19.0 | - | - | 17.2 | 13.6 |
| May 2019 | • | 48 | 17.9 | - | - | 17.4 | 13.7 |
| Jun 2019 | • | 47 | 17.5 | - | - | 17.0 | 13.6 |
| Jul 2019 | • | 42 | 15.7 | - | - | 16.7 | 13.7 |
| Aug 2019 | • | 43 | 16.0 | - | - | 16.7 | 13.7 |
| Sep 2019 | • | 51 | 19.0 | - | - | 17.2 | 13.7 |
| Oct 2019 | • | 56 | 20.9 | - | - | 17.4 | 13.8 |
| Nov 2019 | • | 58 | 21.6 | - | - | 17.7 | 13.8 |
| Dec 2019 | • | 56 | 20.9 | - | - | 17.0 | 13.9 |
| Jan 2020 | • | 57 | 21.2 | - | - | 17.8 | 14.0 |
| Feb 2020 | • | 57 | 21.2 | - | - | 17.3 | 14.0 |
| Mar 2020 | • | 52 | 19.3 | - | - | 17.3 | 13.9 |
| Apr 2020 | • | 47 | 17.5 | - | - | 16.8 | 13.5 |
| May 2020 | • | 50 | 18.6 | - | - | 16.4 | 13.0 |
| Jun 2020 | • | 48 | 17.9 | - | - | 16.2 | 12.9 |
| Jul 2020 | • | 50 | 18.6 | - | - | 16.6 | 12.6 |
| Aug 2020 | • | 53 | 19.7 | - | - | 16.4 | 12.4 |
| Sep 2020 | • | 48 | 17.9 | - | - | 15.7 | 12.2 |
| Oct 2020 | • | 48 | 17.9 | - | - | 15.6 | 12.0 |
| Nov 2020 | • | 45 | 16.8 | - | - | 14.9 | 11.9 |
| Dec 2020 | • | 47 | 17.5 | - | - | 14.4 | 11.8 |
| Jan 2021 | • | 48 | 17.9 | - | - | 13.9 | 11.7 |
| Feb 2021 | • | 48 | 18.0 | - | - | 13.5 | 11.6 |
| Mar 2021 | • | 51 | 19.1 | - | - | 13.2 | 11.6 |
| Apr 2021 | • | 54 | 20.2 | - | - | 13.5 | 11.8 |
| May 2021 | • | 52 | 19.5 | - | - | 13.3 | 12.0 |
| Jun 2021 | • | 52 | 19.5 | - | - | 13.8 | 12.1 |
| Jul 2021 | • | 53 | 19.9 | - | - | 13.4 | 12.2 |
| Aug 2021 | • | 52 | 19.5 | - | - | 13.5 | 12.3 |
| Sep 2021 | • | 51 | 19.1 | - | - | 14.0 | 12.4 |
| Oct 2021 | • | 52 | 19.5 | - | - | 14.4 | 12.3 |
| Nov 2021 | • | 53 | 19.9 | - | - | 14.5 | 12.4 |
| Dec 2021 | • | 51 | 19.1 | - | - | 14.6 | 12.5 |
| Jan 2022 | • | 50 | 18.7 | - | - | 14.2 | 12.5 |
| Feb 2022 | • | 52 | 19.5 | - | - | 14.5 | 12.5 |
| Mar 2022 | • | 48 | 18.0 | - | - | 14.1 | 12.5 |
| Apr 2022 | • | 48 | 18.0 | - | - | 14.3 | 12.7 |
| May 2022 | • | 50 | 18.7 | - | - | 14.5 | 12.7 |
| Jun 2022 | • | 54 | 20.2 | - | - | 15.1 | 12.9 |
| Jul 2022 | • | 53 | 19.8 | - | - | 15.2 | 13.1 |
| Aug 2022 | • | 53 | 19.8 | - | - | 15.3 | 13.2 |
| Sep 2022 | • | 55 | 20.5 | - | - | 15.2 | 13.3 |
| Oct 2022 | • | 50 | 18.6 | - | - | 14.9 | 13.5 |
| Nov 2022 | • | 50 | 18.6 | - | - | 14.9 | 13.5 |
| Dec 2022 | • | 51 | 18.9 | - | - | 15.5 | 13.5 |
| Jan 2023 | • | 54 | 20.0 | - | - | 15.8 | 13.6 |
| Feb 2023 | • | 55 | 20.4 | - | - | 15.9 | 13.7 |
| Mar 2023 | • | 57 | 21.1 | - | - | 16.5 | 13.7 |
| Apr 2023 | • | 59 | 21.8 | - | - | 16.8 | 13.8 |
| May 2023 | • | 56 | 20.7 | - | - | 16.8 | 14.0 |
| Jun 2023 | • | 57 | 21.1 | - | - | 16.4 | 13.9 |
| Jul 2023 | • | 57 | 21.0 | - | - | 16.0 | 13.9 |
| Aug 2023 | • | 54 | 19.9 | - | - | 15.6 | 13.9 |
| Sep 2023 | • | 54 | 19.9 | - | - | 15.5 | 13.8 |
| Oct 2023 | • | 63 | 23.2 | - | - | 15.8 | 13.8 |
| Nov 2023 | • | 66 | 24.2 | - | - | 16.4 | 13.9 |
| Dec 2023 | • | 68 | 24.9 | - | - | 16.0 | 13.9 |
| Jan 2024 | • | 63 | 23.1 | - | - | 16.0 | 13.9 |
| Feb 2024 | • | 62 | 22.6 | - | - | 15.8 | 14.0 |
| Mar 2024 | • | 61 | 22.2 | - | - | 15.4 | 14.0 |
| Apr 2024 | • | 60 | 21.9 | - | - | 15.3 | 14.1 |
| May 2024 | • | 62 | 22.6 | - | - | 16.1 | 14.1 |
| Jun 2024 | • | 57 | 20.8 | - | - | 16.2 | 14.1 |
| Jul 2024 | • | 56 | 20.4 | - | - | 16.5 | 14.0 |
| Aug 2024 | • | 56 | 20.4 | - | - | 16.3 | 14.2 |
| Sep 2024 | • | 53 | 19.3 | - | - | 16.7 | 14.2 |
| Oct 2024 | • | 50 | 18.2 | - | - | 16.3 | 14.2 |
| Nov 2024 | • | 47 | 17.1 | - | - | 16.3 | 14.2 |
| Dec 2024 | • | 53 | 19.3 | - | - | 16.7 | 14.2 |
| Jan 2025 | • | 53 | 19.2 | - | - | 16.8 | 14.3 |
| Feb 2025 | • | 59 | 21.5 | - | - | 17.8 | 14.3 |
| Mar 2025 | • | 59 | 21.5 | - | - | 18.0 | 14.4 |
| Apr 2025 | • | 63 | 22.9 | - | - | 18.3 | 14.3 |
| May 2025 | • | 65 | 23.6 | - | - | 17.6 | 14.3 |
| Jun 2025 | • | 71 | 25.8 | - | - | 17.9 | 14.3 |
| Jul 2025 | • | 73 | 26.5 | - | - | 18.2 | 14.4 |
| Aug 2025 | • | 71 | 25.8 | - | - | 18.3 | 14.4 |
| Sep 2025 | • | 69 | 25.1 | - | - | 18.0 | 14.4 |
| Oct 2025 | • | 64 | 23.3 | - | - | 18.1 | 14.3 |
| Nov 2025 | • | 64 | 23.3 | - | - | 17.7 | 14.3 |
| Dec 2025 | • | 56 | 20.3 | - | - | 17.9 | 14.3 |
| Jan 2026 | • | 58 | 21.1 | - | - | 17.7 | 14.2 |
| Feb 2026 | • | 52 | 18.9 | - | - | 16.8 | 14.2 |
| Mar 2026 | • | 50 | 18.2 | - | - | 16.4 | 14.1 |
| Apr 2026 | • | 48 | 17.4 | - | - | 15.5 | 14.0 |
Source: UK Health Security Agency
The rate of community-onset cases of E. coli has been consistently higher than the rate of hospital-onset cases, and with the majority of the cases having community-onset.
Between 2015 and 2025, the rate has varied from around 50 to just over 80 cases per 100,000 population. The rate increased from 2014 to 2019 reaching a peak of 84 cases per 100,000 population for the year September 2018 to August 2019. The rate remained around 80 cases per 100,000 population for the next few months, but fell sharply during the COVID-19 pandemic (lockdown commenced March 2020) to reach a low of 53 cases per 100,000 population for the year August 2020 to July 2021. Since then the rate has increased but at a gradual rate almost reaching the peak previously observed (for September 2018 to August 2019) with 79.6 cases per 100,000 population for the year February 2024 to January 2025. The rate has decreased since then with the latest rate being 70.5 cases per 100,000 population for the period November 2024 to October 2025.
In the latest period, November 2024 to October 2025, there were 189 cases of E. coli bacteraemia in Hull that were community-onset. Three-quarters of all E. coli cases that were laboratory confirmed were community-onset.
Compared with benchmark
Better
Similar
Worse
Not Compared
Lower
Similar
Higher
E. coli bacteraemia 12-month rolling case counts and rates of community-onset, by Sub ICB Location (SICBL) and month (Persons All ages)
|
Period
|
Humber and North Yorkshire ICB - 03F |
NHS Humber and North Yorkshire Integrated Care Board - QOQ
|
England
|
||||
|---|---|---|---|---|---|---|---|
|
Count
|
Value
|
95%
Lower CI |
95%
Upper CI |
||||
| Dec 2014 | • | 159 | 60.9 | - | - | 60.5 | 52.0 |
| Jan 2015 | • | 146 | 55.9 | - | - | 60.1 | 52.0 |
| Feb 2015 | • | 142 | 54.4 | - | - | 60.2 | 52.2 |
| Mar 2015 | • | 136 | 52.0 | - | - | 60.4 | 52.2 |
| Apr 2015 | • | 136 | 52.0 | - | - | 60.9 | 52.3 |
| May 2015 | • | 139 | 53.1 | - | - | 61.3 | 52.3 |
| Jun 2015 | • | 139 | 53.1 | - | - | 61.8 | 52.5 |
| Jul 2015 | • | 137 | 52.3 | - | - | 62.3 | 52.8 |
| Aug 2015 | • | 133 | 50.7 | - | - | 61.0 | 52.9 |
| Sep 2015 | • | 133 | 50.7 | - | - | 61.2 | 53.4 |
| Oct 2015 | • | 139 | 53.0 | - | - | 62.2 | 53.6 |
| Nov 2015 | • | 144 | 54.8 | - | - | 62.1 | 54.0 |
| Dec 2015 | • | 149 | 56.7 | - | - | 61.5 | 54.3 |
| Jan 2016 | • | 158 | 60.1 | - | - | 63.0 | 54.9 |
| Feb 2016 | • | 153 | 58.0 | - | - | 63.1 | 55.1 |
| Mar 2016 | • | 155 | 58.7 | - | - | 63.9 | 55.5 |
| Apr 2016 | • | 164 | 62.1 | - | - | 64.0 | 55.8 |
| May 2016 | • | 163 | 61.7 | - | - | 63.1 | 56.2 |
| Jun 2016 | • | 165 | 62.4 | - | - | 63.4 | 56.4 |
| Jul 2016 | • | 166 | 62.7 | - | - | 65.3 | 56.8 |
| Aug 2016 | • | 179 | 67.6 | - | - | 68.0 | 57.4 |
| Sep 2016 | • | 185 | 69.8 | - | - | 68.7 | 57.6 |
| Oct 2016 | • | 189 | 71.3 | - | - | 69.2 | 58.1 |
| Nov 2016 | • | 196 | 73.9 | - | - | 70.2 | 58.4 |
| Dec 2016 | • | 192 | 72.3 | - | - | 69.6 | 58.6 |
| Jan 2017 | • | 192 | 72.3 | - | - | 69.2 | 58.5 |
| Feb 2017 | • | 192 | 72.4 | - | - | 70.9 | 59.0 |
| Mar 2017 | • | 196 | 73.9 | - | - | 71.7 | 59.3 |
| Apr 2017 | • | 192 | 72.3 | - | - | 72.6 | 59.7 |
| May 2017 | • | 196 | 73.8 | - | - | 74.1 | 59.7 |
| Jun 2017 | • | 202 | 76.0 | - | - | 74.5 | 59.9 |
| Jul 2017 | • | 200 | 75.1 | - | - | 73.4 | 60.1 |
| Aug 2017 | • | 194 | 72.8 | - | - | 73.4 | 60.2 |
| Sep 2017 | • | 195 | 73.2 | - | - | 74.2 | 60.2 |
| Oct 2017 | • | 185 | 69.4 | - | - | 74.1 | 60.3 |
| Nov 2017 | • | 173 | 64.8 | - | - | 73.1 | 60.4 |
| Dec 2017 | • | 178 | 66.6 | - | - | 74.1 | 60.4 |
| Jan 2018 | • | 183 | 68.5 | - | - | 74.4 | 60.4 |
| Feb 2018 | • | 189 | 70.6 | - | - | 73.4 | 60.2 |
| Mar 2018 | • | 185 | 69.1 | - | - | 71.9 | 60.1 |
| Apr 2018 | • | 191 | 71.3 | - | - | 72.3 | 60.1 |
| May 2018 | • | 186 | 69.4 | - | - | 72.5 | 60.7 |
| Jun 2018 | • | 184 | 68.7 | - | - | 73.1 | 61.0 |
| Jul 2018 | • | 189 | 70.5 | - | - | 74.4 | 61.2 |
| Aug 2018 | • | 186 | 69.4 | - | - | 73.6 | 61.5 |
| Sep 2018 | • | 189 | 70.5 | - | - | 74.0 | 61.9 |
| Oct 2018 | • | 192 | 71.6 | - | - | 73.6 | 62.3 |
| Nov 2018 | • | 197 | 73.5 | - | - | 73.9 | 62.3 |
| Dec 2018 | • | 199 | 74.2 | - | - | 73.6 | 62.5 |
| Jan 2019 | • | 196 | 73.1 | - | - | 74.1 | 63.0 |
| Feb 2019 | • | 198 | 73.8 | - | - | 74.3 | 63.3 |
| Mar 2019 | • | 206 | 76.8 | - | - | 76.4 | 63.7 |
| Apr 2019 | • | 203 | 75.6 | - | - | 76.2 | 64.0 |
| May 2019 | • | 211 | 78.6 | - | - | 76.2 | 64.1 |
| Jun 2019 | • | 216 | 80.5 | - | - | 76.2 | 64.0 |
| Jul 2019 | • | 215 | 80.1 | - | - | 75.2 | 64.1 |
| Aug 2019 | • | 219 | 81.6 | - | - | 77.0 | 64.4 |
| Sep 2019 | • | 205 | 76.4 | - | - | 76.0 | 64.2 |
| Oct 2019 | • | 208 | 77.5 | - | - | 77.0 | 64.1 |
| Nov 2019 | • | 210 | 78.3 | - | - | 78.0 | 64.0 |
| Dec 2019 | • | 206 | 76.8 | - | - | 79.1 | 64.0 |
| Jan 2020 | • | 211 | 78.6 | - | - | 79.0 | 64.1 |
| Feb 2020 | • | 209 | 77.7 | - | - | 79.0 | 64.0 |
| Mar 2020 | • | 198 | 73.6 | - | - | 76.0 | 63.1 |
| Apr 2020 | • | 195 | 72.5 | - | - | 74.7 | 61.5 |
| May 2020 | • | 185 | 68.8 | - | - | 74.0 | 60.4 |
| Jun 2020 | • | 180 | 67.0 | - | - | 73.4 | 59.6 |
| Jul 2020 | • | 178 | 66.3 | - | - | 72.9 | 58.8 |
| Aug 2020 | • | 168 | 62.6 | - | - | 70.4 | 57.9 |
| Sep 2020 | • | 171 | 63.7 | - | - | 70.2 | 57.4 |
| Oct 2020 | • | 162 | 60.4 | - | - | 68.8 | 56.6 |
| Nov 2020 | • | 157 | 58.6 | - | - | 66.9 | 56.0 |
| Dec 2020 | • | 158 | 59.0 | - | - | 65.8 | 55.3 |
| Jan 2021 | • | 146 | 54.5 | - | - | 64.9 | 54.1 |
| Feb 2021 | • | 139 | 52.1 | - | - | 63.6 | 53.4 |
| Mar 2021 | • | 144 | 54.0 | - | - | 65.4 | 53.8 |
| Apr 2021 | • | 144 | 54.0 | - | - | 66.5 | 54.9 |
| May 2021 | • | 148 | 55.5 | - | - | 67.1 | 55.3 |
| Jun 2021 | • | 141 | 52.8 | - | - | 67.1 | 55.6 |
| Jul 2021 | • | 140 | 52.5 | - | - | 67.1 | 55.6 |
| Aug 2021 | • | 147 | 55.1 | - | - | 66.4 | 55.2 |
| Sep 2021 | • | 151 | 56.6 | - | - | 66.5 | 54.9 |
| Oct 2021 | • | 154 | 57.7 | - | - | 65.6 | 54.6 |
| Nov 2021 | • | 150 | 56.2 | - | - | 65.6 | 54.5 |
| Dec 2021 | • | 146 | 54.7 | - | - | 65.1 | 54.4 |
| Jan 2022 | • | 151 | 56.5 | - | - | 64.1 | 54.8 |
| Feb 2022 | • | 150 | 56.2 | - | - | 63.5 | 54.9 |
| Mar 2022 | • | 156 | 58.4 | - | - | 62.7 | 54.6 |
| Apr 2022 | • | 159 | 59.5 | - | - | 63.1 | 54.2 |
| May 2022 | • | 157 | 58.7 | - | - | 62.7 | 54.0 |
| Jun 2022 | • | 159 | 59.4 | - | - | 61.4 | 53.7 |
| Jul 2022 | • | 158 | 59.0 | - | - | 60.8 | 53.4 |
| Aug 2022 | • | 155 | 57.8 | - | - | 61.3 | 53.5 |
| Sep 2022 | • | 156 | 58.1 | - | - | 61.5 | 53.8 |
| Oct 2022 | • | 155 | 57.7 | - | - | 63.0 | 53.9 |
| Nov 2022 | • | 162 | 60.2 | - | - | 64.0 | 54.1 |
| Dec 2022 | • | 161 | 59.8 | - | - | 64.4 | 53.7 |
| Jan 2023 | • | 160 | 59.4 | - | - | 66.3 | 53.6 |
| Feb 2023 | • | 165 | 61.2 | - | - | 67.3 | 53.7 |
| Mar 2023 | • | 157 | 58.2 | - | - | 66.5 | 53.9 |
| Apr 2023 | • | 163 | 60.3 | - | - | 65.8 | 54.0 |
| May 2023 | • | 171 | 63.2 | - | - | 65.8 | 54.2 |
| Jun 2023 | • | 175 | 64.6 | - | - | 67.8 | 54.6 |
| Jul 2023 | • | 176 | 64.9 | - | - | 68.7 | 55.3 |
| Aug 2023 | • | 179 | 66.0 | - | - | 68.0 | 55.6 |
| Sep 2023 | • | 179 | 65.9 | - | - | 68.4 | 55.8 |
| Oct 2023 | • | 183 | 67.3 | - | - | 69.2 | 56.3 |
| Nov 2023 | • | 183 | 67.2 | - | - | 68.9 | 56.4 |
| Dec 2023 | • | 183 | 67.1 | - | - | 69.8 | 57.3 |
| Jan 2024 | • | 187 | 68.5 | - | - | 70.4 | 57.9 |
| Feb 2024 | • | 200 | 73.0 | - | - | 71.8 | 58.2 |
| Mar 2024 | • | 208 | 75.9 | - | - | 72.7 | 58.5 |
| Apr 2024 | • | 203 | 74.0 | - | - | 72.9 | 59.0 |
| May 2024 | • | 193 | 70.3 | - | - | 72.8 | 59.2 |
| Jun 2024 | • | 192 | 69.9 | - | - | 73.3 | 59.6 |
| Jul 2024 | • | 206 | 75.0 | - | - | 73.8 | 59.5 |
| Aug 2024 | • | 206 | 75.0 | - | - | 75.3 | 59.8 |
| Sep 2024 | • | 204 | 74.2 | - | - | 74.8 | 59.8 |
| Oct 2024 | • | 206 | 74.9 | - | - | 74.1 | 60.0 |
| Nov 2024 | • | 207 | 75.2 | - | - | 74.3 | 60.3 |
| Dec 2024 | • | 212 | 77.0 | - | - | 74.4 | 60.3 |
| Jan 2025 | • | 214 | 77.7 | - | - | 73.7 | 60.3 |
| Feb 2025 | • | 198 | 72.1 | - | - | 73.1 | 60.2 |
| Mar 2025 | • | 188 | 68.4 | - | - | 73.3 | 60.2 |
| Apr 2025 | • | 186 | 67.7 | - | - | 73.0 | 60.4 |
| May 2025 | • | 190 | 69.1 | - | - | 73.8 | 60.7 |
| Jun 2025 | • | 197 | 71.6 | - | - | 73.8 | 60.7 |
| Jul 2025 | • | 185 | 67.3 | - | - | 74.3 | 61.4 |
| Aug 2025 | • | 184 | 66.9 | - | - | 74.5 | 61.7 |
| Sep 2025 | • | 188 | 68.3 | - | - | 76.0 | 62.0 |
| Oct 2025 | • | 189 | 68.7 | - | - | 75.7 | 62.1 |
| Nov 2025 | • | 187 | 67.9 | - | - | 75.8 | 62.2 |
| Dec 2025 | • | 189 | 68.7 | - | - | 74.7 | 62.2 |
| Jan 2026 | • | 180 | 65.4 | - | - | 73.6 | 62.2 |
| Feb 2026 | • | 184 | 66.8 | - | - | 73.0 | 62.3 |
| Mar 2026 | • | 186 | 67.5 | - | - | 73.1 | 62.4 |
| Apr 2026 | • | 183 | 66.4 | - | - | 73.0 | 62.5 |
Source: UK Health Security Agency
MRSA (Methicillin-Resistant Staphylococcus Aureus)
The number of laboratory confirmed cases of MRSA are very low, and this impacts on trends over time and national comparisons as an increase of only one or two cases within the year can make a relatively large difference to the infection rate per 100,000 population. See Small Numbers within the Glossary for more information.
Cases by Financial Year
The number of laboratory confirmed cases of MRSA is given below for Hull (03F) over a financial year compared to the others within the Humber and North Yorkshire Integrated Care Board, as well as the rate based on those that were community-onset. The rates are given as the number of cases over the year per 100,000 population.
For 2024/25, the number of cases of MRSA was very low with 1.5 cases per 100,000 population over the year in Hull, with just under half of these community-onset cases of MRSA (0.7 cases per 100,000 population).
The infection rate in Hull is lower than England.
Compared with benchmark
Better
Similar
Worse
Not Compared
Lower
Similar
Higher
| Indicator | Period | England | NHS Humber and North Yorkshire Integrated Care Board - QOQ | Humber and North Yorkshire ICB - 02Y | Humber and North Yorkshire ICB - 03F | Humber and North Yorkshire ICB - 03H | Humber and North Yorkshire ICB - 03K | Humber and North Yorkshire ICB - 03Q | Humber and North Yorkshire ICB - 42D |
|---|---|---|---|---|---|---|---|---|---|
MRSA bacteraemia case counts and rates by sub ICB location (SICBL) and financial year (Persons All ages) | 2024/25 | 1.9 | 1.6 | 2.2 | 1.5 | 0.6 | 2.4 | 1.9 | 0.9 |
MRSA bacteraemia case counts and rates of community-onset, by sub ICB location (SICBL) and financial year (Persons All ages) | 2024/25 | 1.2 | 0.7 | 0.6 | 0.7 | 0.0 | 0.6 | 0.8 | 0.9 |
| Indicator | Period | England | NHS Humber and North Yorkshire Integrated Care Board - QOQ | Humber and North Yorkshire ICB - 02Y | Humber and North Yorkshire ICB - 03F | Humber and North Yorkshire ICB - 03H | Humber and North Yorkshire ICB - 03K | Humber and North Yorkshire ICB - 03Q | Humber and North Yorkshire ICB - 42D |
|---|---|---|---|---|---|---|---|---|---|
MRSA bacteraemia case counts and rates by sub ICB location (SICBL) and financial year (Persons All ages) | 2024/25 | 1.9 | 1.6 | 2.2 | 1.5 | 0.6 | 2.4 | 1.9 | 0.9 |
MRSA bacteraemia case counts and rates of community-onset, by sub ICB location (SICBL) and financial year (Persons All ages) | 2024/25 | 1.2 | 0.7 | 0.6 | 0.7 | 0.0 | 0.6 | 0.8 | 0.9 |
In 2009/10 and 2010/11 there were 12 and 16 cases of MRSA in Hull respectively, but since then the numbers have been much smaller with most years having only one or two cases in total. The exceptions were 2011/12 when there were five cases, and recently from 2021/22 to 2024/25 when there have been three or four cases of MRSA in Hull in each of these years.
In the latest year 2024/25, there have been four cases in Hull.
Compared with benchmark
Better
Similar
Worse
Not Compared
Lower
Similar
Higher
MRSA bacteraemia case counts and rates by sub ICB location (SICBL) and financial year (Persons All ages)
|
Period
|
Humber and North Yorkshire ICB - 03F |
NHS Humber and North Yorkshire Integrated Care Board - QOQ
|
England
|
||||
|---|---|---|---|---|---|---|---|
|
Count
|
Value
|
95%
Lower CI |
95%
Upper CI |
||||
| 2009/10 | • | 12 | 4.7 | - | - | 4.2 | 3.6 |
| 2010/11 | • | 16 | 6.2 | - | - | 3.7 | 2.8 |
| 2011/12 | • | 5 | 1.9 | - | - | 2.2 | 2.1 |
| 2012/13 | • | 1 | 0.4 | - | - | 1.7 | 1.7 |
| 2013/14 | • | 2 | 0.8 | - | - | 2.2 | 1.6 |
| 2014/15 | • | 2 | 0.8 | - | - | 1.4 | 1.5 |
| 2015/16 | • | 2 | 0.8 | - | - | 1.0 | 1.5 |
| 2016/17 | • | 1 | 0.4 | - | - | 1.2 | 1.5 |
| 2017/18 | • | 2 | 0.7 | - | - | 1.4 | 1.5 |
| 2018/19 | • | 2 | 0.7 | - | - | 1.5 | 1.4 |
| 2019/20 | • | 2 | 0.7 | - | - | 1.0 | 1.4 |
| 2020/21 | • | 1 | 0.4 | - | - | 0.4 | 1.2 |
| 2021/22 | • | 4 | 1.5 | - | - | 0.9 | 1.2 |
| 2022/23 | • | 4 | 1.5 | - | - | 1.1 | 1.4 |
| 2023/24 | • | 3 | 1.1 | - | - | 0.9 | 1.6 |
| 2024/25 | • | 4 | 1.5 | - | - | 1.6 | 1.9 |
Source: UK Health Security Agency
Since 2012/13, there has been zero, one or two cases of community-onset MRSA each year in Hull with the exception being 2021/22 when there were four cases of community-onset MRSA in Hull. There were two cases of community-onset MRSA in Hull for the latest year 2024/25.
Compared with benchmark
Better
Similar
Worse
Not Compared
Lower
Similar
Higher
MRSA bacteraemia case counts and rates of community-onset, by sub ICB location (SICBL) and financial year (Persons All ages)
|
Period
|
Humber and North Yorkshire ICB - 03F |
NHS Humber and North Yorkshire Integrated Care Board - QOQ
|
England
|
||||
|---|---|---|---|---|---|---|---|
|
Count
|
Value
|
95%
Lower CI |
95%
Upper CI |
||||
| 2012/13 | • | 1 | 0.4 | - | - | 1.0 | 1.0 |
| 2013/14 | • | 1 | 0.4 | - | - | 1.6 | 0.9 |
| 2014/15 | • | 2 | 0.8 | - | - | 1.1 | 0.9 |
| 2015/16 | • | 1 | 0.4 | - | - | 0.5 | 1.0 |
| 2016/17 | • | 1 | 0.4 | - | - | 0.5 | 0.9 |
| 2017/18 | • | 2 | 0.7 | - | - | 1.0 | 1.0 |
| 2018/19 | • | - | 0.0 | - | - | 1.1 | 1.0 |
| 2019/20 | • | 1 | 0.4 | - | - | 0.6 | 1.0 |
| 2020/21 | • | 1 | 0.4 | - | - | 0.3 | 0.7 |
| 2021/22 | • | 4 | 1.5 | - | - | 0.7 | 0.8 |
| 2022/23 | • | - | 0.0 | - | - | 0.6 | 0.9 |
| 2023/24 | • | - | 0.0 | - | - | 0.3 | 1.0 |
| 2024/25 | • | 2 | 0.7 | - | - | 0.7 | 1.2 |
Source: UK Health Security Agency
Cases by Month (12-Month Rolling Total)
The 12-month rolling total count of the number of laboratory confirmed cases of MRSA for October 2025 is slightly lower in Hull (03F) compared to England. The hospital-onset rate is slightly higher in Hull than England. However, the numbers are very small with fewer than two cases per 100,000 population. This means that there is likely considerable month-to-month variability.
The rates are also given separately for hospital-onset or community-onset infections.
Compared with benchmark
Better
Similar
Worse
Not Compared
Lower
Similar
Higher
| Indicator | Period | England | NHS Humber and North Yorkshire Integrated Care Board - QOQ | Humber and North Yorkshire ICB - 02Y | Humber and North Yorkshire ICB - 03F | Humber and North Yorkshire ICB - 03H | Humber and North Yorkshire ICB - 03K | Humber and North Yorkshire ICB - 03Q | Humber and North Yorkshire ICB - 42D |
|---|---|---|---|---|---|---|---|---|---|
MRSA bacteraemia 12-month rolling case counts and rates, by Sub ICB Location (SICBL) and month (Persons All ages) | Apr 2026 | 1.9 | 1.5 | 1.2 | 0.7 | 0.6 | 4.7 | 0.8 | 2.1 |
MRSA bacteraemia 12-month rolling case counts and rates of hospital-onset, by Sub ICB Location (SICBL) and month (Persons All ages) | Apr 2026 | 0.6 | 0.6 | 0.6 | 0.4 | 0.6 | 1.2 | 0.5 | 0.5 |
MRSA bacteraemia 12-month rolling case counts and rates of community-onset, by Sub ICB Location (SICBL) and month (Persons All ages) | Apr 2026 | 1.3 | 1.0 | 0.6 | 0.4 | 0.0 | 3.5 | 0.3 | 1.6 |
| Indicator | Period | England | NHS Humber and North Yorkshire Integrated Care Board - QOQ | Humber and North Yorkshire ICB - 02Y | Humber and North Yorkshire ICB - 03F | Humber and North Yorkshire ICB - 03H | Humber and North Yorkshire ICB - 03K | Humber and North Yorkshire ICB - 03Q | Humber and North Yorkshire ICB - 42D |
|---|---|---|---|---|---|---|---|---|---|
MRSA bacteraemia 12-month rolling case counts and rates, by Sub ICB Location (SICBL) and month (Persons All ages) | Apr 2026 | 1.9 | 1.5 | 1.2 | 0.7 | 0.6 | 4.7 | 0.8 | 2.1 |
MRSA bacteraemia 12-month rolling case counts and rates of hospital-onset, by Sub ICB Location (SICBL) and month (Persons All ages) | Apr 2026 | 0.6 | 0.6 | 0.6 | 0.4 | 0.6 | 1.2 | 0.5 | 0.5 |
MRSA bacteraemia 12-month rolling case counts and rates of community-onset, by Sub ICB Location (SICBL) and month (Persons All ages) | Apr 2026 | 1.3 | 1.0 | 0.6 | 0.4 | 0.0 | 3.5 | 0.3 | 1.6 |
The number of MRSA cases in Hull is very low. Examining the 12- monthly rolling figures, from 2015 to October 2025, there were between zero and six cases of of MRSA each year (as the figures are given as a 12-month rolling average). There were no cases of MRSA at all in Hull during the 16-month period July 2016 to October 2017.
The number of cases are very small in Hull so there is month-on-month variability (see Small Numbers), and it is important to note with the 12 month rolling average number of cases being presented that the same case will appear in the count for 12 whole months. In the 12 months up to October 2025 there were 5 cases of MRSA in Hull.
Compared with benchmark
Better
Similar
Worse
Not Compared
Lower
Similar
Higher
MRSA bacteraemia 12-month rolling case counts and rates, by Sub ICB Location (SICBL) and month (Persons All ages)
|
Period
|
Humber and North Yorkshire ICB - 03F |
NHS Humber and North Yorkshire Integrated Care Board - QOQ
|
England
|
||||
|---|---|---|---|---|---|---|---|
|
Count
|
Value
|
95%
Lower CI |
95%
Upper CI |
||||
| Dec 2014 | • | 2 | 0.8 | - | - | 1.2 | 1.4 |
| Jan 2015 | • | 2 | 0.8 | - | - | 1.3 | 1.5 |
| Feb 2015 | • | 2 | 0.8 | - | - | 1.3 | 1.5 |
| Mar 2015 | • | 2 | 0.8 | - | - | 1.4 | 1.5 |
| Apr 2015 | • | 1 | 0.4 | - | - | 1.5 | 1.5 |
| May 2015 | • | 2 | 0.8 | - | - | 1.7 | 1.5 |
| Jun 2015 | • | 3 | 1.1 | - | - | 1.7 | 1.5 |
| Jul 2015 | • | 3 | 1.1 | - | - | 1.7 | 1.5 |
| Aug 2015 | • | 3 | 1.1 | - | - | 1.7 | 1.6 |
| Sep 2015 | • | 3 | 1.1 | - | - | 1.8 | 1.6 |
| Oct 2015 | • | 2 | 0.8 | - | - | 1.6 | 1.6 |
| Nov 2015 | • | 2 | 0.8 | - | - | 1.6 | 1.6 |
| Dec 2015 | • | 2 | 0.8 | - | - | 1.5 | 1.5 |
| Jan 2016 | • | 2 | 0.8 | - | - | 1.5 | 1.5 |
| Feb 2016 | • | 2 | 0.8 | - | - | 1.3 | 1.5 |
| Mar 2016 | • | 2 | 0.8 | - | - | 1.0 | 1.5 |
| Apr 2016 | • | 2 | 0.8 | - | - | 0.8 | 1.5 |
| May 2016 | • | 1 | 0.4 | - | - | 0.6 | 1.5 |
| Jun 2016 | • | 1 | 0.4 | - | - | 0.5 | 1.5 |
| Jul 2016 | • | 1 | 0.4 | - | - | 0.4 | 1.5 |
| Aug 2016 | • | 1 | 0.4 | - | - | 0.6 | 1.5 |
| Sep 2016 | • | 1 | 0.4 | - | - | 0.6 | 1.5 |
| Oct 2016 | • | 1 | 0.4 | - | - | 0.8 | 1.4 |
| Nov 2016 | • | 1 | 0.4 | - | - | 0.9 | 1.4 |
| Dec 2016 | • | 1 | 0.4 | - | - | 1.0 | 1.4 |
| Jan 2017 | • | 1 | 0.4 | - | - | 1.1 | 1.5 |
| Feb 2017 | • | 1 | 0.4 | - | - | 1.1 | 1.5 |
| Mar 2017 | • | 1 | 0.4 | - | - | 1.2 | 1.5 |
| Apr 2017 | • | 1 | 0.4 | - | - | 1.3 | 1.5 |
| May 2017 | • | 1 | 0.4 | - | - | 1.4 | 1.5 |
| Jun 2017 | • | - | 0.0 | - | - | 1.3 | 1.5 |
| Jul 2017 | • | - | 0.0 | - | - | 1.5 | 1.5 |
| Aug 2017 | • | - | 0.0 | - | - | 1.5 | 1.5 |
| Sep 2017 | • | - | 0.0 | - | - | 1.6 | 1.6 |
| Oct 2017 | • | - | 0.0 | - | - | 1.5 | 1.5 |
| Nov 2017 | • | 1 | 0.4 | - | - | 1.6 | 1.5 |
| Dec 2017 | • | 1 | 0.4 | - | - | 1.5 | 1.5 |
| Jan 2018 | • | 1 | 0.4 | - | - | 1.5 | 1.5 |
| Feb 2018 | • | 1 | 0.4 | - | - | 1.4 | 1.5 |
| Mar 2018 | • | 2 | 0.7 | - | - | 1.4 | 1.5 |
| Apr 2018 | • | 2 | 0.7 | - | - | 1.4 | 1.5 |
| May 2018 | • | 2 | 0.7 | - | - | 1.5 | 1.5 |
| Jun 2018 | • | 2 | 0.7 | - | - | 1.5 | 1.5 |
| Jul 2018 | • | 2 | 0.7 | - | - | 1.5 | 1.5 |
| Aug 2018 | • | 2 | 0.7 | - | - | 1.4 | 1.5 |
| Sep 2018 | • | 2 | 0.7 | - | - | 1.2 | 1.5 |
| Oct 2018 | • | 3 | 1.1 | - | - | 1.1 | 1.5 |
| Nov 2018 | • | 2 | 0.7 | - | - | 1.1 | 1.5 |
| Dec 2018 | • | 2 | 0.7 | - | - | 1.3 | 1.6 |
| Jan 2019 | • | 3 | 1.1 | - | - | 1.4 | 1.5 |
| Feb 2019 | • | 3 | 1.1 | - | - | 1.5 | 1.5 |
| Mar 2019 | • | 2 | 0.7 | - | - | 1.5 | 1.4 |
| Apr 2019 | • | 2 | 0.7 | - | - | 1.4 | 1.4 |
| May 2019 | • | 2 | 0.7 | - | - | 1.4 | 1.4 |
| Jun 2019 | • | 2 | 0.7 | - | - | 1.4 | 1.4 |
| Jul 2019 | • | 2 | 0.7 | - | - | 1.5 | 1.4 |
| Aug 2019 | • | 2 | 0.7 | - | - | 1.5 | 1.4 |
| Sep 2019 | • | 2 | 0.7 | - | - | 1.6 | 1.4 |
| Oct 2019 | • | 1 | 0.4 | - | - | 1.7 | 1.4 |
| Nov 2019 | • | 2 | 0.7 | - | - | 1.7 | 1.4 |
| Dec 2019 | • | 2 | 0.7 | - | - | 1.4 | 1.4 |
| Jan 2020 | • | 1 | 0.4 | - | - | 1.2 | 1.4 |
| Feb 2020 | • | 1 | 0.4 | - | - | 1.0 | 1.4 |
| Mar 2020 | • | 2 | 0.7 | - | - | 1.0 | 1.4 |
| Apr 2020 | • | 2 | 0.7 | - | - | 0.9 | 1.4 |
| May 2020 | • | 2 | 0.7 | - | - | 0.8 | 1.4 |
| Jun 2020 | • | 2 | 0.7 | - | - | 0.8 | 1.4 |
| Jul 2020 | • | 2 | 0.7 | - | - | 0.6 | 1.4 |
| Aug 2020 | • | 2 | 0.7 | - | - | 0.5 | 1.4 |
| Sep 2020 | • | 2 | 0.7 | - | - | 0.4 | 1.3 |
| Oct 2020 | • | 2 | 0.7 | - | - | 0.2 | 1.3 |
| Nov 2020 | • | 1 | 0.4 | - | - | 0.1 | 1.2 |
| Dec 2020 | • | 1 | 0.4 | - | - | 0.2 | 1.2 |
| Jan 2021 | • | 1 | 0.4 | - | - | 0.3 | 1.2 |
| Feb 2021 | • | 1 | 0.4 | - | - | 0.4 | 1.3 |
| Mar 2021 | • | 1 | 0.4 | - | - | 0.4 | 1.2 |
| Apr 2021 | • | 1 | 0.4 | - | - | 0.4 | 1.2 |
| May 2021 | • | 1 | 0.4 | - | - | 0.4 | 1.2 |
| Jun 2021 | • | 1 | 0.4 | - | - | 0.4 | 1.2 |
| Jul 2021 | • | 1 | 0.4 | - | - | 0.4 | 1.2 |
| Aug 2021 | • | 1 | 0.4 | - | - | 0.5 | 1.2 |
| Sep 2021 | • | 1 | 0.4 | - | - | 0.5 | 1.2 |
| Oct 2021 | • | 2 | 0.7 | - | - | 0.6 | 1.2 |
| Nov 2021 | • | 2 | 0.7 | - | - | 0.6 | 1.2 |
| Dec 2021 | • | 3 | 1.1 | - | - | 0.8 | 1.2 |
| Jan 2022 | • | 4 | 1.5 | - | - | 0.8 | 1.2 |
| Feb 2022 | • | 4 | 1.5 | - | - | 0.8 | 1.2 |
| Mar 2022 | • | 4 | 1.5 | - | - | 0.9 | 1.2 |
| Apr 2022 | • | 5 | 1.9 | - | - | 1.1 | 1.2 |
| May 2022 | • | 5 | 1.9 | - | - | 1.2 | 1.3 |
| Jun 2022 | • | 5 | 1.9 | - | - | 1.2 | 1.2 |
| Jul 2022 | • | 5 | 1.9 | - | - | 1.2 | 1.2 |
| Aug 2022 | • | 6 | 2.2 | - | - | 1.2 | 1.3 |
| Sep 2022 | • | 6 | 2.2 | - | - | 1.3 | 1.3 |
| Oct 2022 | • | 5 | 1.9 | - | - | 1.3 | 1.3 |
| Nov 2022 | • | 6 | 2.2 | - | - | 1.3 | 1.3 |
| Dec 2022 | • | 5 | 1.9 | - | - | 1.2 | 1.3 |
| Jan 2023 | • | 5 | 1.9 | - | - | 1.2 | 1.4 |
| Feb 2023 | • | 5 | 1.9 | - | - | 1.0 | 1.4 |
| Mar 2023 | • | 4 | 1.5 | - | - | 1.1 | 1.4 |
| Apr 2023 | • | 3 | 1.1 | - | - | 1.0 | 1.4 |
| May 2023 | • | 5 | 1.8 | - | - | 1.0 | 1.4 |
| Jun 2023 | • | 5 | 1.8 | - | - | 1.0 | 1.4 |
| Jul 2023 | • | 5 | 1.8 | - | - | 1.0 | 1.4 |
| Aug 2023 | • | 4 | 1.5 | - | - | 0.9 | 1.4 |
| Sep 2023 | • | 4 | 1.5 | - | - | 0.8 | 1.4 |
| Oct 2023 | • | 4 | 1.5 | - | - | 0.9 | 1.5 |
| Nov 2023 | • | 3 | 1.1 | - | - | 0.9 | 1.5 |
| Dec 2023 | • | 3 | 1.1 | - | - | 0.8 | 1.5 |
| Jan 2024 | • | 3 | 1.1 | - | - | 0.8 | 1.5 |
| Feb 2024 | • | 3 | 1.1 | - | - | 1.0 | 1.5 |
| Mar 2024 | • | 3 | 1.1 | - | - | 0.9 | 1.6 |
| Apr 2024 | • | 4 | 1.5 | - | - | 0.9 | 1.6 |
| May 2024 | • | 3 | 1.1 | - | - | 0.9 | 1.6 |
| Jun 2024 | • | 3 | 1.1 | - | - | 1.0 | 1.7 |
| Jul 2024 | • | 3 | 1.1 | - | - | 1.1 | 1.7 |
| Aug 2024 | • | 3 | 1.1 | - | - | 1.1 | 1.7 |
| Sep 2024 | • | 3 | 1.1 | - | - | 1.1 | 1.8 |
| Oct 2024 | • | 3 | 1.1 | - | - | 1.1 | 1.7 |
| Nov 2024 | • | 3 | 1.1 | - | - | 1.2 | 1.8 |
| Dec 2024 | • | 4 | 1.5 | - | - | 1.4 | 1.8 |
| Jan 2025 | • | 3 | 1.1 | - | - | 1.5 | 1.8 |
| Feb 2025 | • | 4 | 1.5 | - | - | 1.6 | 1.8 |
| Mar 2025 | • | 4 | 1.5 | - | - | 1.5 | 1.8 |
| Apr 2025 | • | 5 | 1.8 | - | - | 1.7 | 1.8 |
| May 2025 | • | 4 | 1.5 | - | - | 1.6 | 1.8 |
| Jun 2025 | • | 4 | 1.5 | - | - | 1.6 | 1.8 |
| Jul 2025 | • | 5 | 1.8 | - | - | 1.5 | 1.9 |
| Aug 2025 | • | 5 | 1.8 | - | - | 1.7 | 1.9 |
| Sep 2025 | • | 5 | 1.8 | - | - | 1.8 | 1.9 |
| Oct 2025 | • | 5 | 1.8 | - | - | 1.9 | 1.9 |
| Nov 2025 | • | 5 | 1.8 | - | - | 1.9 | 1.9 |
| Dec 2025 | • | 4 | 1.5 | - | - | 1.9 | 1.9 |
| Jan 2026 | • | 4 | 1.5 | - | - | 1.7 | 1.9 |
| Feb 2026 | • | 3 | 1.1 | - | - | 1.5 | 1.9 |
| Mar 2026 | • | 4 | 1.5 | - | - | 1.7 | 2.0 |
| Apr 2026 | • | 2 | 0.7 | - | - | 1.5 | 1.9 |
Source: UK Health Security Agency
There were only three cases of hospital-onset MRSA cases between May 2016 and March 2022. There were then new cases in April 2022, August 2022, November 2022 and January 2023 with two new cases in May 2023, then one case in January 2024, April 2024, December 2024 and April 2025. So the number of cases are very small in Hull so there is month-on-month variability (see Small Numbers). The latest rate in Hull is the same as England.
Compared with benchmark
Better
Similar
Worse
Not Compared
Lower
Similar
Higher
MRSA bacteraemia 12-month rolling case counts and rates of hospital-onset, by Sub ICB Location (SICBL) and month (Persons All ages)
|
Period
|
Humber and North Yorkshire ICB - 03F |
NHS Humber and North Yorkshire Integrated Care Board - QOQ
|
England
|
||||
|---|---|---|---|---|---|---|---|
|
Count
|
Value
|
95%
Lower CI |
95%
Upper CI |
||||
| Apr 2017 | • | - | 0.0 | - | - | 0.7 | 0.6 |
| May 2017 | • | - | 0.0 | - | - | 0.8 | 0.6 |
| Jun 2017 | • | - | 0.0 | - | - | 0.7 | 0.6 |
| Jul 2017 | • | - | 0.0 | - | - | 0.7 | 0.6 |
| Aug 2017 | • | - | 0.0 | - | - | 0.7 | 0.6 |
| Sep 2017 | • | - | 0.0 | - | - | 0.7 | 0.6 |
| Oct 2017 | • | - | 0.0 | - | - | 0.7 | 0.6 |
| Nov 2017 | • | - | 0.0 | - | - | 0.7 | 0.6 |
| Dec 2017 | • | - | 0.0 | - | - | 0.6 | 0.6 |
| Jan 2018 | • | - | 0.0 | - | - | 0.5 | 0.5 |
| Feb 2018 | • | - | 0.0 | - | - | 0.4 | 0.5 |
| Mar 2018 | • | - | 0.0 | - | - | 0.4 | 0.5 |
| Apr 2018 | • | - | 0.0 | - | - | 0.4 | 0.5 |
| May 2018 | • | - | 0.0 | - | - | 0.4 | 0.5 |
| Jun 2018 | • | - | 0.0 | - | - | 0.4 | 0.5 |
| Jul 2018 | • | - | 0.0 | - | - | 0.4 | 0.5 |
| Aug 2018 | • | - | 0.0 | - | - | 0.4 | 0.5 |
| Sep 2018 | • | - | 0.0 | - | - | 0.4 | 0.5 |
| Oct 2018 | • | 1 | 0.4 | - | - | 0.3 | 0.5 |
| Nov 2018 | • | 1 | 0.4 | - | - | 0.3 | 0.5 |
| Dec 2018 | • | 1 | 0.4 | - | - | 0.4 | 0.5 |
| Jan 2019 | • | 2 | 0.7 | - | - | 0.4 | 0.5 |
| Feb 2019 | • | 2 | 0.7 | - | - | 0.4 | 0.5 |
| Mar 2019 | • | 2 | 0.7 | - | - | 0.4 | 0.5 |
| Apr 2019 | • | 2 | 0.7 | - | - | 0.4 | 0.5 |
| May 2019 | • | 2 | 0.7 | - | - | 0.4 | 0.5 |
| Jun 2019 | • | 2 | 0.7 | - | - | 0.4 | 0.4 |
| Jul 2019 | • | 2 | 0.7 | - | - | 0.5 | 0.4 |
| Aug 2019 | • | 2 | 0.7 | - | - | 0.5 | 0.4 |
| Sep 2019 | • | 2 | 0.7 | - | - | 0.5 | 0.4 |
| Oct 2019 | • | 1 | 0.4 | - | - | 0.5 | 0.4 |
| Nov 2019 | • | 1 | 0.4 | - | - | 0.4 | 0.4 |
| Dec 2019 | • | 1 | 0.4 | - | - | 0.4 | 0.4 |
| Jan 2020 | • | - | 0.0 | - | - | 0.3 | 0.5 |
| Feb 2020 | • | - | 0.0 | - | - | 0.3 | 0.5 |
| Mar 2020 | • | 1 | 0.4 | - | - | 0.4 | 0.5 |
| Apr 2020 | • | 1 | 0.4 | - | - | 0.3 | 0.5 |
| May 2020 | • | 1 | 0.4 | - | - | 0.3 | 0.5 |
| Jun 2020 | • | 1 | 0.4 | - | - | 0.2 | 0.5 |
| Jul 2020 | • | 1 | 0.4 | - | - | 0.1 | 0.5 |
| Aug 2020 | • | 1 | 0.4 | - | - | 0.1 | 0.5 |
| Sep 2020 | • | 1 | 0.4 | - | - | 0.1 | 0.4 |
| Oct 2020 | • | 1 | 0.4 | - | - | 0.1 | 0.4 |
| Nov 2020 | • | 1 | 0.4 | - | - | 0.1 | 0.4 |
| Dec 2020 | • | 1 | 0.4 | - | - | 0.1 | 0.4 |
| Jan 2021 | • | 1 | 0.4 | - | - | 0.1 | 0.5 |
| Feb 2021 | • | 1 | 0.4 | - | - | 0.1 | 0.5 |
| Mar 2021 | • | - | 0.0 | - | - | 0.1 | 0.5 |
| Apr 2021 | • | - | 0.0 | - | - | 0.1 | 0.5 |
| May 2021 | • | - | 0.0 | - | - | 0.1 | 0.5 |
| Jun 2021 | • | - | 0.0 | - | - | 0.1 | 0.5 |
| Jul 2021 | • | - | 0.0 | - | - | 0.1 | 0.5 |
| Aug 2021 | • | - | 0.0 | - | - | 0.2 | 0.5 |
| Sep 2021 | • | - | 0.0 | - | - | 0.2 | 0.5 |
| Oct 2021 | • | - | 0.0 | - | - | 0.2 | 0.5 |
| Nov 2021 | • | - | 0.0 | - | - | 0.2 | 0.5 |
| Dec 2021 | • | - | 0.0 | - | - | 0.2 | 0.5 |
| Jan 2022 | • | - | 0.0 | - | - | 0.2 | 0.5 |
| Feb 2022 | • | - | 0.0 | - | - | 0.2 | 0.4 |
| Mar 2022 | • | - | 0.0 | - | - | 0.2 | 0.4 |
| Apr 2022 | • | 1 | 0.4 | - | - | 0.2 | 0.4 |
| May 2022 | • | 1 | 0.4 | - | - | 0.2 | 0.4 |
| Jun 2022 | • | 1 | 0.4 | - | - | 0.2 | 0.4 |
| Jul 2022 | • | 1 | 0.4 | - | - | 0.2 | 0.4 |
| Aug 2022 | • | 2 | 0.7 | - | - | 0.4 | 0.5 |
| Sep 2022 | • | 2 | 0.7 | - | - | 0.4 | 0.5 |
| Oct 2022 | • | 2 | 0.7 | - | - | 0.4 | 0.5 |
| Nov 2022 | • | 3 | 1.1 | - | - | 0.4 | 0.5 |
| Dec 2022 | • | 3 | 1.1 | - | - | 0.4 | 0.5 |
| Jan 2023 | • | 4 | 1.5 | - | - | 0.5 | 0.5 |
| Feb 2023 | • | 4 | 1.5 | - | - | 0.5 | 0.5 |
| Mar 2023 | • | 4 | 1.5 | - | - | 0.5 | 0.5 |
| Apr 2023 | • | 3 | 1.1 | - | - | 0.5 | 0.5 |
| May 2023 | • | 5 | 1.8 | - | - | 0.5 | 0.5 |
| Jun 2023 | • | 5 | 1.8 | - | - | 0.5 | 0.5 |
| Jul 2023 | • | 5 | 1.8 | - | - | 0.6 | 0.5 |
| Aug 2023 | • | 4 | 1.5 | - | - | 0.5 | 0.5 |
| Sep 2023 | • | 4 | 1.5 | - | - | 0.5 | 0.5 |
| Oct 2023 | • | 4 | 1.5 | - | - | 0.5 | 0.5 |
| Nov 2023 | • | 3 | 1.1 | - | - | 0.5 | 0.5 |
| Dec 2023 | • | 3 | 1.1 | - | - | 0.4 | 0.6 |
| Jan 2024 | • | 3 | 1.1 | - | - | 0.4 | 0.6 |
| Feb 2024 | • | 3 | 1.1 | - | - | 0.5 | 0.6 |
| Mar 2024 | • | 3 | 1.1 | - | - | 0.5 | 0.6 |
| Apr 2024 | • | 4 | 1.5 | - | - | 0.6 | 0.6 |
| May 2024 | • | 2 | 0.7 | - | - | 0.6 | 0.6 |
| Jun 2024 | • | 2 | 0.7 | - | - | 0.7 | 0.6 |
| Jul 2024 | • | 2 | 0.7 | - | - | 0.6 | 0.6 |
| Aug 2024 | • | 2 | 0.7 | - | - | 0.6 | 0.6 |
| Sep 2024 | • | 2 | 0.7 | - | - | 0.6 | 0.6 |
| Oct 2024 | • | 2 | 0.7 | - | - | 0.7 | 0.6 |
| Nov 2024 | • | 2 | 0.7 | - | - | 0.7 | 0.7 |
| Dec 2024 | • | 3 | 1.1 | - | - | 0.9 | 0.7 |
| Jan 2025 | • | 2 | 0.7 | - | - | 1.0 | 0.6 |
| Feb 2025 | • | 2 | 0.7 | - | - | 0.9 | 0.6 |
| Mar 2025 | • | 2 | 0.7 | - | - | 0.9 | 0.6 |
| Apr 2025 | • | 2 | 0.7 | - | - | 1.0 | 0.6 |
| May 2025 | • | 2 | 0.7 | - | - | 0.9 | 0.6 |
| Jun 2025 | • | 2 | 0.7 | - | - | 0.8 | 0.6 |
| Jul 2025 | • | 2 | 0.7 | - | - | 0.8 | 0.6 |
| Aug 2025 | • | 2 | 0.7 | - | - | 0.8 | 0.6 |
| Sep 2025 | • | 2 | 0.7 | - | - | 0.9 | 0.6 |
| Oct 2025 | • | 2 | 0.7 | - | - | 0.9 | 0.6 |
| Nov 2025 | • | 2 | 0.7 | - | - | 0.9 | 0.6 |
| Dec 2025 | • | 1 | 0.4 | - | - | 0.9 | 0.6 |
| Jan 2026 | • | 1 | 0.4 | - | - | 0.7 | 0.6 |
| Feb 2026 | • | 1 | 0.4 | - | - | 0.7 | 0.7 |
| Mar 2026 | • | 2 | 0.7 | - | - | 0.7 | 0.7 |
| Apr 2026 | • | 1 | 0.4 | - | - | 0.6 | 0.6 |
Source: UK Health Security Agency
The number of community-onset cases of MRSA is also very small. There was one new case in each of months June 2016, November 2017, March 2018, November 2019, March 2021, October 2021, December 2021, January 2022, March 2022, May 2024, February 2025, April 2025 and July 2025.
Compared with benchmark
Better
Similar
Worse
Not Compared
Lower
Similar
Higher
MRSA bacteraemia 12-month rolling case counts and rates of community-onset, by Sub ICB Location (SICBL) and month (Persons All ages)
|
Period
|
Humber and North Yorkshire ICB - 03F |
NHS Humber and North Yorkshire Integrated Care Board - QOQ
|
England
|
||||
|---|---|---|---|---|---|---|---|
|
Count
|
Value
|
95%
Lower CI |
95%
Upper CI |
||||
| Apr 2017 | • | 1 | 0.4 | - | - | 0.6 | 0.9 |
| May 2017 | • | 1 | 0.4 | - | - | 0.6 | 0.9 |
| Jun 2017 | • | - | 0.0 | - | - | 0.6 | 0.9 |
| Jul 2017 | • | - | 0.0 | - | - | 0.8 | 0.9 |
| Aug 2017 | • | - | 0.0 | - | - | 0.8 | 1.0 |
| Sep 2017 | • | - | 0.0 | - | - | 0.9 | 1.0 |
| Oct 2017 | • | - | 0.0 | - | - | 0.8 | 1.0 |
| Nov 2017 | • | 1 | 0.4 | - | - | 0.9 | 1.0 |
| Dec 2017 | • | 1 | 0.4 | - | - | 0.9 | 1.0 |
| Jan 2018 | • | 1 | 0.4 | - | - | 1.0 | 1.0 |
| Feb 2018 | • | 1 | 0.4 | - | - | 1.0 | 1.0 |
| Mar 2018 | • | 2 | 0.7 | - | - | 1.0 | 1.0 |
| Apr 2018 | • | 2 | 0.7 | - | - | 1.0 | 1.0 |
| May 2018 | • | 2 | 0.7 | - | - | 1.1 | 1.1 |
| Jun 2018 | • | 2 | 0.7 | - | - | 1.1 | 1.0 |
| Jul 2018 | • | 2 | 0.7 | - | - | 1.1 | 1.0 |
| Aug 2018 | • | 2 | 0.7 | - | - | 0.9 | 1.0 |
| Sep 2018 | • | 2 | 0.7 | - | - | 0.9 | 1.0 |
| Oct 2018 | • | 2 | 0.7 | - | - | 0.8 | 1.0 |
| Nov 2018 | • | 1 | 0.4 | - | - | 0.8 | 1.0 |
| Dec 2018 | • | 1 | 0.4 | - | - | 0.9 | 1.1 |
| Jan 2019 | • | 1 | 0.4 | - | - | 1.0 | 1.0 |
| Feb 2019 | • | 1 | 0.4 | - | - | 1.1 | 1.0 |
| Mar 2019 | • | - | 0.0 | - | - | 1.1 | 1.0 |
| Apr 2019 | • | - | 0.0 | - | - | 1.0 | 0.9 |
| May 2019 | • | - | 0.0 | - | - | 1.0 | 0.9 |
| Jun 2019 | • | - | 0.0 | - | - | 1.0 | 1.0 |
| Jul 2019 | • | - | 0.0 | - | - | 0.9 | 1.0 |
| Aug 2019 | • | - | 0.0 | - | - | 0.9 | 1.0 |
| Sep 2019 | • | - | 0.0 | - | - | 1.1 | 0.9 |
| Oct 2019 | • | - | 0.0 | - | - | 1.2 | 1.0 |
| Nov 2019 | • | 1 | 0.4 | - | - | 1.2 | 1.0 |
| Dec 2019 | • | 1 | 0.4 | - | - | 1.1 | 1.0 |
| Jan 2020 | • | 1 | 0.4 | - | - | 0.9 | 1.0 |
| Feb 2020 | • | 1 | 0.4 | - | - | 0.7 | 1.0 |
| Mar 2020 | • | 1 | 0.4 | - | - | 0.6 | 1.0 |
| Apr 2020 | • | 1 | 0.4 | - | - | 0.6 | 1.0 |
| May 2020 | • | 1 | 0.4 | - | - | 0.5 | 1.0 |
| Jun 2020 | • | 1 | 0.4 | - | - | 0.5 | 1.0 |
| Jul 2020 | • | 1 | 0.4 | - | - | 0.5 | 0.9 |
| Aug 2020 | • | 1 | 0.4 | - | - | 0.5 | 0.9 |
| Sep 2020 | • | 1 | 0.4 | - | - | 0.3 | 0.9 |
| Oct 2020 | • | 1 | 0.4 | - | - | 0.2 | 0.8 |
| Nov 2020 | • | - | 0.0 | - | - | 0.1 | 0.8 |
| Dec 2020 | • | - | 0.0 | - | - | 0.1 | 0.8 |
| Jan 2021 | • | - | 0.0 | - | - | 0.2 | 0.8 |
| Feb 2021 | • | - | 0.0 | - | - | 0.2 | 0.8 |
| Mar 2021 | • | 1 | 0.4 | - | - | 0.3 | 0.7 |
| Apr 2021 | • | 1 | 0.4 | - | - | 0.3 | 0.7 |
| May 2021 | • | 1 | 0.4 | - | - | 0.3 | 0.7 |
| Jun 2021 | • | 1 | 0.4 | - | - | 0.2 | 0.7 |
| Jul 2021 | • | 1 | 0.4 | - | - | 0.3 | 0.7 |
| Aug 2021 | • | 1 | 0.4 | - | - | 0.4 | 0.7 |
| Sep 2021 | • | 1 | 0.4 | - | - | 0.4 | 0.7 |
| Oct 2021 | • | 2 | 0.7 | - | - | 0.4 | 0.7 |
| Nov 2021 | • | 2 | 0.7 | - | - | 0.5 | 0.7 |
| Dec 2021 | • | 3 | 1.1 | - | - | 0.6 | 0.7 |
| Jan 2022 | • | 4 | 1.5 | - | - | 0.6 | 0.8 |
| Feb 2022 | • | 4 | 1.5 | - | - | 0.6 | 0.8 |
| Mar 2022 | • | 4 | 1.5 | - | - | 0.7 | 0.8 |
| Apr 2022 | • | 4 | 1.5 | - | - | 0.8 | 0.8 |
| May 2022 | • | 4 | 1.5 | - | - | 0.9 | 0.8 |
| Jun 2022 | • | 4 | 1.5 | - | - | 0.9 | 0.8 |
| Jul 2022 | • | 4 | 1.5 | - | - | 0.9 | 0.8 |
| Aug 2022 | • | 4 | 1.5 | - | - | 0.9 | 0.8 |
| Sep 2022 | • | 4 | 1.5 | - | - | 1.0 | 0.8 |
| Oct 2022 | • | 3 | 1.1 | - | - | 0.9 | 0.9 |
| Nov 2022 | • | 3 | 1.1 | - | - | 0.9 | 0.9 |
| Dec 2022 | • | 2 | 0.7 | - | - | 0.8 | 0.9 |
| Jan 2023 | • | 1 | 0.4 | - | - | 0.7 | 0.9 |
| Feb 2023 | • | 1 | 0.4 | - | - | 0.6 | 0.9 |
| Mar 2023 | • | - | 0.0 | - | - | 0.6 | 0.9 |
| Apr 2023 | • | - | 0.0 | - | - | 0.5 | 0.9 |
| May 2023 | • | - | 0.0 | - | - | 0.5 | 0.9 |
| Jun 2023 | • | - | 0.0 | - | - | 0.5 | 0.9 |
| Jul 2023 | • | - | 0.0 | - | - | 0.5 | 0.9 |
| Aug 2023 | • | - | 0.0 | - | - | 0.5 | 0.9 |
| Sep 2023 | • | - | 0.0 | - | - | 0.3 | 0.9 |
| Oct 2023 | • | - | 0.0 | - | - | 0.4 | 0.9 |
| Nov 2023 | • | - | 0.0 | - | - | 0.4 | 0.9 |
| Dec 2023 | • | - | 0.0 | - | - | 0.4 | 0.9 |
| Jan 2024 | • | - | 0.0 | - | - | 0.4 | 0.9 |
| Feb 2024 | • | - | 0.0 | - | - | 0.5 | 0.9 |
| Mar 2024 | • | - | 0.0 | - | - | 0.3 | 1.0 |
| Apr 2024 | • | - | 0.0 | - | - | 0.3 | 1.0 |
| May 2024 | • | 1 | 0.4 | - | - | 0.3 | 1.0 |
| Jun 2024 | • | 1 | 0.4 | - | - | 0.3 | 1.0 |
| Jul 2024 | • | 1 | 0.4 | - | - | 0.5 | 1.1 |
| Aug 2024 | • | 1 | 0.4 | - | - | 0.5 | 1.1 |
| Sep 2024 | • | 1 | 0.4 | - | - | 0.5 | 1.1 |
| Oct 2024 | • | 1 | 0.4 | - | - | 0.5 | 1.1 |
| Nov 2024 | • | 1 | 0.4 | - | - | 0.5 | 1.1 |
| Dec 2024 | • | 1 | 0.4 | - | - | 0.5 | 1.2 |
| Jan 2025 | • | 1 | 0.4 | - | - | 0.6 | 1.2 |
| Feb 2025 | • | 2 | 0.7 | - | - | 0.7 | 1.2 |
| Mar 2025 | • | 2 | 0.7 | - | - | 0.7 | 1.2 |
| Apr 2025 | • | 3 | 1.1 | - | - | 0.7 | 1.2 |
| May 2025 | • | 2 | 0.7 | - | - | 0.7 | 1.2 |
| Jun 2025 | • | 2 | 0.7 | - | - | 0.8 | 1.2 |
| Jul 2025 | • | 3 | 1.1 | - | - | 0.7 | 1.3 |
| Aug 2025 | • | 3 | 1.1 | - | - | 0.9 | 1.3 |
| Sep 2025 | • | 3 | 1.1 | - | - | 0.9 | 1.3 |
| Oct 2025 | • | 3 | 1.1 | - | - | 1.0 | 1.3 |
| Nov 2025 | • | 3 | 1.1 | - | - | 1.0 | 1.3 |
| Dec 2025 | • | 3 | 1.1 | - | - | 1.0 | 1.3 |
| Jan 2026 | • | 3 | 1.1 | - | - | 1.0 | 1.3 |
| Feb 2026 | • | 2 | 0.7 | - | - | 0.9 | 1.3 |
| Mar 2026 | • | 2 | 0.7 | - | - | 1.0 | 1.3 |
| Apr 2026 | • | 1 | 0.4 | - | - | 1.0 | 1.3 |
Source: UK Health Security Agency
Clostridium Difficile (C. Difficile) Infection
The number of laboratory confirmed cases of C. difficile that are healthcare associated or community associated that were community-onset are small, and this impacts on trends over time and national comparisons as an increase of only one or two cases within the year can make a relatively large difference to the infection rate per 100,000 population. See Small Numbers within the Glossary for more information.
Cases by Financial Year
The infection rates for C. difficile in Hull (03F) are much lower than England for 2024/25 at 16.0 compared to 22.0 per 100,000 population (34% lower). The rate of community-onset healthcare associated C. difficile cases was similar to England while the rate of community-onset community associated C. difficile cases was much lower the England (60% lower).
Compared with benchmark
Better
Similar
Worse
Not Compared
Lower
Similar
Higher
| Indicator | Period | England | NHS Humber and North Yorkshire Integrated Care Board - QOQ | Humber and North Yorkshire ICB - 02Y | Humber and North Yorkshire ICB - 03F | Humber and North Yorkshire ICB - 03H | Humber and North Yorkshire ICB - 03K | Humber and North Yorkshire ICB - 03Q | Humber and North Yorkshire ICB - 42D |
|---|---|---|---|---|---|---|---|---|---|
C. difficile infection case counts and rates by Sub ICB Location (SICBL) and financial year (Persons 2+ yrs) | 2024/25 | 33.3 | 30.1 | 29.0 | 22.0 | 17.2 | 14.1 | 42.1 | 36.8 |
C. difficile infection case counts and rates of community onset-healthcare associated, by Sub ICB Location (SICBL) and financial year (Persons 2+ yrs) | 2024/25 | 5.8 | 6.6 | 5.3 | 5.6 | 4.4 | 1.8 | 10.7 | 7.2 |
C. difficile infection case counts and rates of community onset-community associated, by Sub ICB Location (SICBL) and financial year (Persons 2+ yrs) | 2024/25 | 9.3 | 6.6 | 5.6 | 3.7 | 1.9 | 2.9 | 10.2 | 9.1 |
| Indicator | Period | England | NHS Humber and North Yorkshire Integrated Care Board - QOQ | Humber and North Yorkshire ICB - 02Y | Humber and North Yorkshire ICB - 03F | Humber and North Yorkshire ICB - 03H | Humber and North Yorkshire ICB - 03K | Humber and North Yorkshire ICB - 03Q | Humber and North Yorkshire ICB - 42D |
|---|---|---|---|---|---|---|---|---|---|
C. difficile infection case counts and rates by Sub ICB Location (SICBL) and financial year (Persons 2+ yrs) | 2024/25 | 33.3 | 30.1 | 29.0 | 22.0 | 17.2 | 14.1 | 42.1 | 36.8 |
C. difficile infection case counts and rates of community onset-healthcare associated, by Sub ICB Location (SICBL) and financial year (Persons 2+ yrs) | 2024/25 | 5.8 | 6.6 | 5.3 | 5.6 | 4.4 | 1.8 | 10.7 | 7.2 |
C. difficile infection case counts and rates of community onset-community associated, by Sub ICB Location (SICBL) and financial year (Persons 2+ yrs) | 2024/25 | 9.3 | 6.6 | 5.6 | 3.7 | 1.9 | 2.9 | 10.2 | 9.1 |
In 2009/10, there were 110 cases of C. difficile in Hull, although the infection rate in Hull was lower than England. However, since then there has been a general decreasing trend in Hull albeit with some year-on-year variability. There were 59 cases of C. difficile in Hull for the latest period 2024/25.
There has also been a decrease in England over the period 2009/10 to 2022/23, but the infection rate in Hull has been lower than England since 2016/17.
Compared with benchmark
Better
Similar
Worse
Not Compared
Lower
Similar
Higher
C. difficile infection case counts and rates by Sub ICB Location (SICBL) and financial year (Persons 2+ yrs)
|
Period
|
Humber and North Yorkshire ICB - 03F |
NHS Humber and North Yorkshire Integrated Care Board - QOQ
|
England
|
||||
|---|---|---|---|---|---|---|---|
|
Count
|
Value
|
95%
Lower CI |
95%
Upper CI |
||||
| 2007/08 | • | - | 0.0 | - | - | 0.0 | 0.0 |
| 2008/09 | • | - | 0.0 | - | - | 0.0 | 0.0 |
| 2009/10 | • | 110 | 43.0 | - | - | 39.1 | 49.0 |
| 2010/11 | • | 72 | 28.1 | - | - | 37.1 | 41.1 |
| 2011/12 | • | 121 | 47.1 | - | - | 37.0 | 33.8 |
| 2012/13 | • | 73 | 28.3 | - | - | 26.7 | 27.5 |
| 2013/14 | • | 72 | 27.7 | - | - | 27.4 | 24.7 |
| 2014/15 | • | 97 | 37.1 | - | - | 27.2 | 26.1 |
| 2015/16 | • | 72 | 27.3 | - | - | 26.5 | 25.7 |
| 2016/17 | • | 50 | 18.8 | - | - | 22.1 | 23.3 |
| 2017/18 | • | 50 | 18.7 | - | - | 22.0 | 23.9 |
| 2018/19 | • | 51 | 19.0 | - | - | 21.1 | 21.9 |
| 2019/20 | • | 50 | 18.6 | - | - | 24.5 | 23.4 |
| 2020/21 | • | 45 | 16.9 | - | - | 22.7 | 22.2 |
| 2021/22 | • | 39 | 14.6 | - | - | 26.8 | 25.2 |
| 2022/23 | • | 42 | 15.6 | - | - | 27.4 | 27.2 |
| 2023/24 | • | 43 | 16.0 | - | - | 26.2 | 29.4 |
| 2024/25 | • | 59 | 22.0 | - | - | 30.1 | 33.3 |
Source: UK Health Security Agency
The number of cases of C. difficile that were healthcare associated with community-onset were small in Hull with 15 cases in 2024/25.
Compared with benchmark
Better
Similar
Worse
Not Compared
Lower
Similar
Higher
C. difficile infection case counts and rates of community onset-healthcare associated, by Sub ICB Location (SICBL) and financial year (Persons 2+ yrs)
|
Period
|
Humber and North Yorkshire ICB - 03F |
NHS Humber and North Yorkshire Integrated Care Board - QOQ
|
England
|
||||
|---|---|---|---|---|---|---|---|
|
Count
|
Value
|
95%
Lower CI |
95%
Upper CI |
||||
| 2017/18 | • | 5 | 1.9 | - | - | 3.0 | 3.4 |
| 2018/19 | • | 18 | 6.7 | - | - | 4.9 | 4.1 |
| 2019/20 | • | 10 | 3.7 | - | - | 5.1 | 4.4 |
| 2020/21 | • | 11 | 4.1 | - | - | 4.2 | 3.9 |
| 2021/22 | • | 7 | 2.6 | - | - | 5.8 | 4.3 |
| 2022/23 | • | 9 | 3.3 | - | - | 6.0 | 4.4 |
| 2023/24 | • | 7 | 2.6 | - | - | 4.9 | 4.9 |
| 2024/25 | • | 15 | 5.6 | - | - | 6.6 | 5.8 |
Source: UK Health Security Agency
The number of cases of C. difficile that were community associated with community-onset were small in Hull with ten cases in 2024/25. The infection rate of community-onset community associated cases has been consistently lower in Hull than England for the period 2017/18 to 2024/25.
Compared with benchmark
Better
Similar
Worse
Not Compared
Lower
Similar
Higher
C. difficile infection case counts and rates of community onset-community associated, by Sub ICB Location (SICBL) and financial year (Persons 2+ yrs)
|
Period
|
Humber and North Yorkshire ICB - 03F |
NHS Humber and North Yorkshire Integrated Care Board - QOQ
|
England
|
||||
|---|---|---|---|---|---|---|---|
|
Count
|
Value
|
95%
Lower CI |
95%
Upper CI |
||||
| 2017/18 | • | 1 | 0.4 | - | - | 3.8 | 5.1 |
| 2018/19 | • | 10 | 3.7 | - | - | 5.4 | 6.1 |
| 2019/20 | • | 12 | 4.5 | - | - | 5.2 | 6.7 |
| 2020/21 | • | 6 | 2.2 | - | - | 6.1 | 7.0 |
| 2021/22 | • | 8 | 3.0 | - | - | 6.3 | 7.4 |
| 2022/23 | • | 10 | 3.7 | - | - | 6.4 | 7.5 |
| 2023/24 | • | 7 | 2.6 | - | - | 5.6 | 8.2 |
| 2024/25 | • | 10 | 3.7 | - | - | 6.6 | 9.3 |
Source: UK Health Security Agency
Cases by Month (12-Month Rolling Total)
The number of laboratory confirmed cases of C. difficile is given below for Hull (03F) compared to the other sub-ICBs within the Humber and North Yorkshire ICB.
The rates are also given separately for community-onset associated with healthcare and community-onset associated with community, so are slightly different to the infections given above which have rates separately for hospital-onset or community-onset infections.
For the year November 2024 to October 2025, the rate in Hull for community onset-healthcare associated were similar to England, but the rate of community onset-community associated in Hull was less than half that of England. For all cases, the rate was one third lower for Hull compared to England (20.1 versus 30.9 cases per 100,000 population).
Compared with benchmark
Better
Similar
Worse
Not Compared
Lower
Similar
Higher
| Indicator | Period | England | NHS Humber and North Yorkshire Integrated Care Board - QOQ | Humber and North Yorkshire ICB - 02Y | Humber and North Yorkshire ICB - 03F | Humber and North Yorkshire ICB - 03H | Humber and North Yorkshire ICB - 03K | Humber and North Yorkshire ICB - 03Q | Humber and North Yorkshire ICB - 42D |
|---|---|---|---|---|---|---|---|---|---|
C. difficile infection 12-month rolling counts and rates, by Sub ICB Location (SICBL)
and month (Persons 2+ yrs) | Apr 2026 | 29.2 | 28.4 | 35.1 | 26.9 | 11.9 | 18.7 | 26.8 | 35.4 |
C. difficile infection 12-month rolling counts and rates of community onset-healthcare associated, by Sub ICB Location (SICBL) and month (Persons 2+ yrs) | Apr 2026 | 5.2 | 6.3 | 7.6 | 6.9 | 1.9 | 3.5 | 8.0 | 6.4 |
C. difficile infection 12-month rolling counts and rates of community onset-community associated, by Sub ICB Location (SICBL) and month (Persons 2+ yrs) | Apr 2026 | 8.2 | 5.8 | 7.6 | 3.6 | 3.1 | 2.3 | 4.0 | 9.8 |
| Indicator | Period | England | NHS Humber and North Yorkshire Integrated Care Board - QOQ | Humber and North Yorkshire ICB - 02Y | Humber and North Yorkshire ICB - 03F | Humber and North Yorkshire ICB - 03H | Humber and North Yorkshire ICB - 03K | Humber and North Yorkshire ICB - 03Q | Humber and North Yorkshire ICB - 42D |
|---|---|---|---|---|---|---|---|---|---|
C. difficile infection 12-month rolling counts and rates, by Sub ICB Location (SICBL)
and month (Persons 2+ yrs) | Apr 2026 | 29.2 | 28.4 | 35.1 | 26.9 | 11.9 | 18.7 | 26.8 | 35.4 |
C. difficile infection 12-month rolling counts and rates of community onset-healthcare associated, by Sub ICB Location (SICBL) and month (Persons 2+ yrs) | Apr 2026 | 5.2 | 6.3 | 7.6 | 6.9 | 1.9 | 3.5 | 8.0 | 6.4 |
C. difficile infection 12-month rolling counts and rates of community onset-community associated, by Sub ICB Location (SICBL) and month (Persons 2+ yrs) | Apr 2026 | 8.2 | 5.8 | 7.6 | 3.6 | 3.1 | 2.3 | 4.0 | 9.8 |
Between 2015 and mid-2016, the rates of C. difficile infections was higher in Hull compared to England, but since then the rates have been consistently lower than England except for Spring and Summer of 2019 when rates were similar in Hull as England.
Over the three year period from the year May 2020 to April 2021 to the year May 2023 to April 2024, the rates in Hull have been around 14-16 cases per year per 100,000 population. In contrast, over the same period the rate in England has increased gradually from 22 to 30 cases per 100,000 population.
After April 2024, the rate in Hull started to increase from 16 to 23 cases per 100,000 population for the period November 2023 to October 2024. However, the rate has decreased slightly since then to remain around 21 per 100,000 population over the last year.
In the latest period, December 2024 to November 2025, there has been 58 cases of C. difficile in Hull.
This indicator is currently not showing on our JSNA website (as at 5 February), but the trends over time can be seen directly on the Office for Health Improvement & Disparities’ Fingertips tool at 12-month rolling counts for C. difficile.
Compared with benchmark
Better
Similar
Worse
Not Compared
Lower
Similar
Higher
The number of community-onset healthcare associated cases of C. difficile is relatively low in Hull (see Small Numbers within the Glossary for more information).
Except for the period September 2018 to December 2019 when rates in Hull were considerably higher and March to August 2021 where rates in Hull were marginally higher, the rates of community-onset healthcare associated cases of C. difficile has been lower in Hull compared to England, although there is some month-to-month variability in Hull.
The number of cases is very small in Hull, but has increased in the last year or so. Toward the end of 2023, in the previous 12 month period, there has been around 2.2 cases per 100,000 population (or six cases in total) over the year, but this has gradually increased in Hull to reach 6.0 cases per 100,000 population for the 12 months to July 2025, although has decreases slightly since, to 5.2 cases per 100,000 population for the latest period November 2024 to October 2025. The latest rate is slightly lower than the rate in England.
In the latest period November 2024 to October 2025, there had been 14 cases of C. difficile that were community-onset in Hull that were associated with healthcare.
Compared with benchmark
Better
Similar
Worse
Not Compared
Lower
Similar
Higher
C. difficile infection 12-month rolling counts and rates of community onset-healthcare associated, by Sub ICB Location (SICBL) and month (Persons 2+ yrs)
|
Period
|
Humber and North Yorkshire ICB - 03F |
NHS Humber and North Yorkshire Integrated Care Board - QOQ
|
England
|
||||
|---|---|---|---|---|---|---|---|
|
Count
|
Value
|
95%
Lower CI |
95%
Upper CI |
||||
| Apr 2017 | • | - | 0.0 | - | - | 0.4 | 0.2 |
| May 2017 | • | - | 0.0 | - | - | 0.6 | 0.4 |
| Jun 2017 | • | - | 0.0 | - | - | 0.7 | 0.6 |
| Jul 2017 | • | - | 0.0 | - | - | 0.8 | 0.8 |
| Aug 2017 | • | - | 0.0 | - | - | 0.9 | 1.2 |
| Sep 2017 | • | - | 0.0 | - | - | 1.2 | 1.5 |
| Oct 2017 | • | - | 0.0 | - | - | 1.4 | 1.8 |
| Nov 2017 | • | 1 | 0.4 | - | - | 1.8 | 2.1 |
| Dec 2017 | • | 2 | 0.7 | - | - | 2.1 | 2.4 |
| Jan 2018 | • | 4 | 1.5 | - | - | 2.4 | 2.8 |
| Feb 2018 | • | 5 | 1.9 | - | - | 2.7 | 3.1 |
| Mar 2018 | • | 5 | 1.9 | - | - | 3.0 | 3.4 |
| Apr 2018 | • | 6 | 2.2 | - | - | 3.1 | 3.6 |
| May 2018 | • | 8 | 3.0 | - | - | 3.3 | 3.8 |
| Jun 2018 | • | 9 | 3.4 | - | - | 3.5 | 3.9 |
| Jul 2018 | • | 10 | 3.7 | - | - | 3.7 | 4.1 |
| Aug 2018 | • | 11 | 4.1 | - | - | 4.0 | 4.2 |
| Sep 2018 | • | 13 | 4.9 | - | - | 4.1 | 4.3 |
| Oct 2018 | • | 16 | 6.0 | - | - | 4.5 | 4.3 |
| Nov 2018 | • | 18 | 6.7 | - | - | 4.7 | 4.3 |
| Dec 2018 | • | 18 | 6.7 | - | - | 4.8 | 4.3 |
| Jan 2019 | • | 18 | 6.7 | - | - | 4.9 | 4.2 |
| Feb 2019 | • | 17 | 6.3 | - | - | 4.8 | 4.2 |
| Mar 2019 | • | 18 | 6.7 | - | - | 4.9 | 4.1 |
| Apr 2019 | • | 19 | 7.1 | - | - | 5.2 | 4.1 |
| May 2019 | • | 19 | 7.1 | - | - | 5.6 | 4.1 |
| Jun 2019 | • | 18 | 6.7 | - | - | 5.5 | 4.1 |
| Jul 2019 | • | 19 | 7.1 | - | - | 5.8 | 4.1 |
| Aug 2019 | • | 18 | 6.7 | - | - | 5.9 | 4.2 |
| Sep 2019 | • | 17 | 6.3 | - | - | 6.0 | 4.2 |
| Oct 2019 | • | 14 | 5.2 | - | - | 5.8 | 4.3 |
| Nov 2019 | • | 13 | 4.8 | - | - | 5.6 | 4.3 |
| Dec 2019 | • | 12 | 4.5 | - | - | 5.4 | 4.3 |
| Jan 2020 | • | 10 | 3.7 | - | - | 5.4 | 4.3 |
| Feb 2020 | • | 11 | 4.1 | - | - | 5.3 | 4.4 |
| Mar 2020 | • | 10 | 3.7 | - | - | 5.1 | 4.4 |
| Apr 2020 | • | 8 | 3.0 | - | - | 4.7 | 4.3 |
| May 2020 | • | 7 | 2.6 | - | - | 4.2 | 4.2 |
| Jun 2020 | • | 7 | 2.6 | - | - | 4.1 | 4.2 |
| Jul 2020 | • | 7 | 2.6 | - | - | 4.2 | 4.2 |
| Aug 2020 | • | 7 | 2.6 | - | - | 4.1 | 4.2 |
| Sep 2020 | • | 8 | 3.0 | - | - | 4.1 | 4.1 |
| Oct 2020 | • | 9 | 3.4 | - | - | 3.9 | 4.0 |
| Nov 2020 | • | 9 | 3.4 | - | - | 4.0 | 4.0 |
| Dec 2020 | • | 10 | 3.7 | - | - | 4.2 | 4.1 |
| Jan 2021 | • | 10 | 3.7 | - | - | 4.1 | 4.0 |
| Feb 2021 | • | 10 | 3.7 | - | - | 4.0 | 3.9 |
| Mar 2021 | • | 11 | 4.1 | - | - | 4.2 | 3.9 |
| Apr 2021 | • | 11 | 4.1 | - | - | 4.1 | 4.0 |
| May 2021 | • | 11 | 4.1 | - | - | 4.5 | 4.1 |
| Jun 2021 | • | 12 | 4.5 | - | - | 4.9 | 4.2 |
| Jul 2021 | • | 11 | 4.1 | - | - | 4.9 | 4.2 |
| Aug 2021 | • | 12 | 4.5 | - | - | 5.2 | 4.2 |
| Sep 2021 | • | 11 | 4.1 | - | - | 5.2 | 4.2 |
| Oct 2021 | • | 11 | 4.1 | - | - | 5.5 | 4.3 |
| Nov 2021 | • | 9 | 3.4 | - | - | 5.3 | 4.3 |
| Dec 2021 | • | 8 | 3.0 | - | - | 5.5 | 4.3 |
| Jan 2022 | • | 8 | 3.0 | - | - | 5.7 | 4.4 |
| Feb 2022 | • | 7 | 2.6 | - | - | 5.9 | 4.4 |
| Mar 2022 | • | 7 | 2.6 | - | - | 5.9 | 4.3 |
| Apr 2022 | • | 7 | 2.6 | - | - | 6.0 | 4.3 |
| May 2022 | • | 6 | 2.2 | - | - | 5.7 | 4.3 |
| Jun 2022 | • | 5 | 1.9 | - | - | 5.7 | 4.3 |
| Jul 2022 | • | 6 | 2.2 | - | - | 5.7 | 4.2 |
| Aug 2022 | • | 5 | 1.9 | - | - | 5.6 | 4.3 |
| Sep 2022 | • | 6 | 2.2 | - | - | 5.3 | 4.3 |
| Oct 2022 | • | 6 | 2.2 | - | - | 5.4 | 4.3 |
| Nov 2022 | • | 7 | 2.6 | - | - | 5.9 | 4.3 |
| Dec 2022 | • | 8 | 3.0 | - | - | 5.9 | 4.3 |
| Jan 2023 | • | 8 | 3.0 | - | - | 5.8 | 4.3 |
| Feb 2023 | • | 10 | 3.7 | - | - | 5.6 | 4.3 |
| Mar 2023 | • | 9 | 3.3 | - | - | 5.9 | 4.4 |
| Apr 2023 | • | 9 | 3.3 | - | - | 5.9 | 4.5 |
| May 2023 | • | 9 | 3.3 | - | - | 5.7 | 4.5 |
| Jun 2023 | • | 9 | 3.3 | - | - | 5.6 | 4.5 |
| Jul 2023 | • | 9 | 3.3 | - | - | 5.5 | 4.5 |
| Aug 2023 | • | 9 | 3.3 | - | - | 5.1 | 4.5 |
| Sep 2023 | • | 7 | 2.6 | - | - | 5.3 | 4.5 |
| Oct 2023 | • | 6 | 2.2 | - | - | 4.9 | 4.5 |
| Nov 2023 | • | 6 | 2.2 | - | - | 4.6 | 4.6 |
| Dec 2023 | • | 6 | 2.2 | - | - | 4.4 | 4.7 |
| Jan 2024 | • | 8 | 2.9 | - | - | 4.7 | 4.7 |
| Feb 2024 | • | 6 | 2.2 | - | - | 5.1 | 4.8 |
| Mar 2024 | • | 7 | 2.6 | - | - | 4.8 | 4.9 |
| Apr 2024 | • | 8 | 2.9 | - | - | 5.3 | 5.0 |
| May 2024 | • | 10 | 3.6 | - | - | 5.5 | 5.0 |
| Jun 2024 | • | 11 | 4.0 | - | - | 5.8 | 5.0 |
| Jul 2024 | • | 10 | 3.6 | - | - | 5.9 | 5.2 |
| Aug 2024 | • | 11 | 4.0 | - | - | 6.1 | 5.3 |
| Sep 2024 | • | 12 | 4.4 | - | - | 6.0 | 5.5 |
| Oct 2024 | • | 13 | 4.7 | - | - | 6.5 | 5.6 |
| Nov 2024 | • | 13 | 4.7 | - | - | 6.6 | 5.6 |
| Dec 2024 | • | 12 | 4.4 | - | - | 6.6 | 5.7 |
| Jan 2025 | • | 11 | 4.0 | - | - | 6.3 | 5.7 |
| Feb 2025 | • | 15 | 5.5 | - | - | 6.5 | 5.7 |
| Mar 2025 | • | 15 | 5.5 | - | - | 6.4 | 5.7 |
| Apr 2025 | • | 15 | 5.5 | - | - | 5.9 | 5.6 |
| May 2025 | • | 13 | 4.7 | - | - | 6.0 | 5.5 |
| Jun 2025 | • | 13 | 4.7 | - | - | 5.8 | 5.5 |
| Jul 2025 | • | 16 | 5.8 | - | - | 5.8 | 5.5 |
| Aug 2025 | • | 15 | 5.5 | - | - | 5.6 | 5.4 |
| Sep 2025 | • | 15 | 5.5 | - | - | 5.5 | 5.3 |
| Oct 2025 | • | 14 | 5.1 | - | - | 5.4 | 5.3 |
| Nov 2025 | • | 14 | 5.1 | - | - | 5.3 | 5.2 |
| Dec 2025 | • | 16 | 5.8 | - | - | 5.5 | 5.1 |
| Jan 2026 | • | 18 | 6.5 | - | - | 5.7 | 5.1 |
| Feb 2026 | • | 15 | 5.4 | - | - | 5.4 | 5.1 |
| Mar 2026 | • | 17 | 6.2 | - | - | 5.8 | 5.2 |
| Apr 2026 | • | 19 | 6.9 | - | - | 6.3 | 5.2 |
Source: UK Health Security Agency
The rate of community onset-community associated infections of C. difficile has increased over time in Hull between the beginning of 2017 and the beginning of 2019, but then remained relatively consistent with 3-4 cases over the year per 100,000 population. The numbers dropped at the start of the COVID-19 pandemic from a high of 4.6 cases per year per 100,000 population in March 2020 to a low of 1.5 cases per year per 100,000 population for the year to July 2021. The numbers increased since then back to around 3-4 cases per year per 100,000 population in 2022, falling to just over two cases per year per 100,000 population towards the end of 2023. Since then though, the rate has increased to almost six cases per 100,000 population for the period January 2024 to December 2024, although has fallen to 3.7 cases per 100,000 population for the latest period November 2024 to October 2025.
The absolute number of cases in the year are still relatively low at 10 infections of C. difficile in the community that were community-onset for the latest period November 2024 to October 2025.
The infection rate in Hull has been consistently lower than England, as well as lower than the average across the Humber and North Yorkshire ICB.
Compared with benchmark
Better
Similar
Worse
Not Compared
Lower
Similar
Higher
C. difficile infection 12-month rolling counts and rates of community onset-community associated, by Sub ICB Location (SICBL) and month (Persons 2+ yrs)
|
Period
|
Humber and North Yorkshire ICB - 03F |
NHS Humber and North Yorkshire Integrated Care Board - QOQ
|
England
|
||||
|---|---|---|---|---|---|---|---|
|
Count
|
Value
|
95%
Lower CI |
95%
Upper CI |
||||
| Apr 2017 | • | - | 0.0 | - | - | 0.2 | 0.3 |
| May 2017 | • | - | 0.0 | - | - | 0.6 | 0.6 |
| Jun 2017 | • | - | 0.0 | - | - | 0.8 | 0.9 |
| Jul 2017 | • | - | 0.0 | - | - | 1.1 | 1.3 |
| Aug 2017 | • | - | 0.0 | - | - | 1.4 | 1.8 |
| Sep 2017 | • | - | 0.0 | - | - | 1.8 | 2.2 |
| Oct 2017 | • | - | 0.0 | - | - | 2.3 | 2.8 |
| Nov 2017 | • | 1 | 0.4 | - | - | 2.4 | 3.3 |
| Dec 2017 | • | 1 | 0.4 | - | - | 2.8 | 3.7 |
| Jan 2018 | • | 1 | 0.4 | - | - | 3.4 | 4.2 |
| Feb 2018 | • | 1 | 0.4 | - | - | 3.9 | 4.7 |
| Mar 2018 | • | 1 | 0.4 | - | - | 3.8 | 5.1 |
| Apr 2018 | • | 3 | 1.1 | - | - | 4.3 | 5.4 |
| May 2018 | • | 5 | 1.9 | - | - | 4.5 | 5.7 |
| Jun 2018 | • | 6 | 2.2 | - | - | 4.9 | 6.0 |
| Jul 2018 | • | 7 | 2.6 | - | - | 5.0 | 6.2 |
| Aug 2018 | • | 7 | 2.6 | - | - | 5.1 | 6.4 |
| Sep 2018 | • | 9 | 3.4 | - | - | 5.0 | 6.5 |
| Oct 2018 | • | 9 | 3.4 | - | - | 5.1 | 6.5 |
| Nov 2018 | • | 9 | 3.4 | - | - | 5.4 | 6.4 |
| Dec 2018 | • | 9 | 3.4 | - | - | 5.4 | 6.4 |
| Jan 2019 | • | 10 | 3.7 | - | - | 5.1 | 6.3 |
| Feb 2019 | • | 10 | 3.7 | - | - | 5.0 | 6.2 |
| Mar 2019 | • | 10 | 3.7 | - | - | 5.5 | 6.1 |
| Apr 2019 | • | 11 | 4.1 | - | - | 5.6 | 6.2 |
| May 2019 | • | 10 | 3.7 | - | - | 5.3 | 6.1 |
| Jun 2019 | • | 11 | 4.1 | - | - | 5.1 | 6.1 |
| Jul 2019 | • | 11 | 4.1 | - | - | 5.1 | 6.1 |
| Aug 2019 | • | 11 | 4.1 | - | - | 5.3 | 6.1 |
| Sep 2019 | • | 10 | 3.7 | - | - | 5.4 | 6.2 |
| Oct 2019 | • | 10 | 3.7 | - | - | 5.2 | 6.3 |
| Nov 2019 | • | 9 | 3.4 | - | - | 5.1 | 6.4 |
| Dec 2019 | • | 9 | 3.4 | - | - | 5.1 | 6.5 |
| Jan 2020 | • | 10 | 3.7 | - | - | 5.3 | 6.6 |
| Feb 2020 | • | 11 | 4.1 | - | - | 5.4 | 6.7 |
| Mar 2020 | • | 12 | 4.5 | - | - | 5.2 | 6.7 |
| Apr 2020 | • | 9 | 3.3 | - | - | 4.8 | 6.6 |
| May 2020 | • | 9 | 3.3 | - | - | 5.0 | 6.7 |
| Jun 2020 | • | 8 | 3.0 | - | - | 5.1 | 6.8 |
| Jul 2020 | • | 8 | 3.0 | - | - | 5.3 | 6.8 |
| Aug 2020 | • | 8 | 3.0 | - | - | 5.3 | 6.9 |
| Sep 2020 | • | 8 | 3.0 | - | - | 5.2 | 6.8 |
| Oct 2020 | • | 9 | 3.4 | - | - | 5.4 | 6.8 |
| Nov 2020 | • | 10 | 3.7 | - | - | 5.5 | 6.8 |
| Dec 2020 | • | 10 | 3.7 | - | - | 5.5 | 6.9 |
| Jan 2021 | • | 8 | 3.0 | - | - | 5.7 | 6.8 |
| Feb 2021 | • | 7 | 2.6 | - | - | 5.7 | 6.9 |
| Mar 2021 | • | 6 | 2.2 | - | - | 6.1 | 7.0 |
| Apr 2021 | • | 6 | 2.2 | - | - | 6.1 | 7.1 |
| May 2021 | • | 5 | 1.9 | - | - | 6.0 | 7.1 |
| Jun 2021 | • | 5 | 1.9 | - | - | 5.8 | 7.2 |
| Jul 2021 | • | 4 | 1.5 | - | - | 5.7 | 7.2 |
| Aug 2021 | • | 7 | 2.6 | - | - | 5.8 | 7.2 |
| Sep 2021 | • | 6 | 2.2 | - | - | 6.1 | 7.3 |
| Oct 2021 | • | 5 | 1.9 | - | - | 6.1 | 7.3 |
| Nov 2021 | • | 5 | 1.9 | - | - | 6.4 | 7.4 |
| Dec 2021 | • | 5 | 1.9 | - | - | 6.5 | 7.4 |
| Jan 2022 | • | 7 | 2.6 | - | - | 6.6 | 7.4 |
| Feb 2022 | • | 8 | 3.0 | - | - | 6.5 | 7.3 |
| Mar 2022 | • | 8 | 3.0 | - | - | 6.3 | 7.4 |
| Apr 2022 | • | 8 | 3.0 | - | - | 6.4 | 7.4 |
| May 2022 | • | 9 | 3.4 | - | - | 6.7 | 7.4 |
| Jun 2022 | • | 9 | 3.4 | - | - | 6.9 | 7.4 |
| Jul 2022 | • | 10 | 3.7 | - | - | 6.9 | 7.3 |
| Aug 2022 | • | 7 | 2.6 | - | - | 6.8 | 7.5 |
| Sep 2022 | • | 8 | 3.0 | - | - | 6.5 | 7.5 |
| Oct 2022 | • | 9 | 3.3 | - | - | 6.5 | 7.5 |
| Nov 2022 | • | 9 | 3.3 | - | - | 6.3 | 7.5 |
| Dec 2022 | • | 9 | 3.3 | - | - | 6.2 | 7.4 |
| Jan 2023 | • | 9 | 3.3 | - | - | 6.1 | 7.5 |
| Feb 2023 | • | 8 | 3.0 | - | - | 6.2 | 7.5 |
| Mar 2023 | • | 10 | 3.7 | - | - | 6.3 | 7.4 |
| Apr 2023 | • | 10 | 3.7 | - | - | 6.1 | 7.4 |
| May 2023 | • | 9 | 3.3 | - | - | 5.9 | 7.5 |
| Jun 2023 | • | 8 | 3.0 | - | - | 5.9 | 7.5 |
| Jul 2023 | • | 7 | 2.6 | - | - | 5.7 | 7.5 |
| Aug 2023 | • | 7 | 2.6 | - | - | 5.8 | 7.4 |
| Sep 2023 | • | 6 | 2.2 | - | - | 5.5 | 7.4 |
| Oct 2023 | • | 7 | 2.6 | - | - | 5.7 | 7.5 |
| Nov 2023 | • | 6 | 2.2 | - | - | 5.7 | 7.6 |
| Dec 2023 | • | 6 | 2.2 | - | - | 5.7 | 7.7 |
| Jan 2024 | • | 6 | 2.2 | - | - | 5.9 | 7.8 |
| Feb 2024 | • | 7 | 2.6 | - | - | 5.8 | 7.9 |
| Mar 2024 | • | 7 | 2.6 | - | - | 5.5 | 8.1 |
| Apr 2024 | • | 7 | 2.6 | - | - | 5.9 | 8.3 |
| May 2024 | • | 9 | 3.3 | - | - | 6.3 | 8.5 |
| Jun 2024 | • | 11 | 4.0 | - | - | 6.1 | 8.6 |
| Jul 2024 | • | 11 | 4.0 | - | - | 6.5 | 8.8 |
| Aug 2024 | • | 12 | 4.4 | - | - | 6.4 | 9.0 |
| Sep 2024 | • | 14 | 5.1 | - | - | 6.9 | 9.1 |
| Oct 2024 | • | 12 | 4.4 | - | - | 6.7 | 9.2 |
| Nov 2024 | • | 13 | 4.7 | - | - | 6.6 | 9.2 |
| Dec 2024 | • | 15 | 5.4 | - | - | 6.8 | 9.1 |
| Jan 2025 | • | 13 | 4.7 | - | - | 6.4 | 9.2 |
| Feb 2025 | • | 12 | 4.4 | - | - | 6.5 | 9.1 |
| Mar 2025 | • | 10 | 3.6 | - | - | 6.4 | 9.0 |
| Apr 2025 | • | 11 | 4.0 | - | - | 6.6 | 9.0 |
| May 2025 | • | 12 | 4.4 | - | - | 6.5 | 8.8 |
| Jun 2025 | • | 11 | 4.0 | - | - | 6.6 | 8.7 |
| Jul 2025 | • | 12 | 4.4 | - | - | 6.2 | 8.6 |
| Aug 2025 | • | 11 | 4.0 | - | - | 6.1 | 8.5 |
| Sep 2025 | • | 10 | 3.6 | - | - | 6.2 | 8.4 |
| Oct 2025 | • | 10 | 3.6 | - | - | 6.0 | 8.3 |
| Nov 2025 | • | 12 | 4.4 | - | - | 6.1 | 8.3 |
| Dec 2025 | • | 10 | 3.6 | - | - | 5.9 | 8.3 |
| Jan 2026 | • | 10 | 3.6 | - | - | 5.9 | 8.3 |
| Feb 2026 | • | 10 | 3.6 | - | - | 5.8 | 8.3 |
| Mar 2026 | • | 11 | 4.0 | - | - | 6.0 | 8.4 |
| Apr 2026 | • | 10 | 3.6 | - | - | 5.8 | 8.2 |
Source: UK Health Security Agency
Klebsiella Spp. Bacteraemia
Cases by Financial Year
For 2024/25, the rate of cases of klebsiella spp. bacteraemia infection cases per 100,000 population was lower in Hull (03F) compared to England both overall and for community-onset cases.
Compared with benchmark
Better
Similar
Worse
Not Compared
Lower
Similar
Higher
| Indicator | Period | England | NHS Humber and North Yorkshire Integrated Care Board - QOQ | Humber and North Yorkshire ICB - 02Y | Humber and North Yorkshire ICB - 03F | Humber and North Yorkshire ICB - 03H | Humber and North Yorkshire ICB - 03K | Humber and North Yorkshire ICB - 03Q | Humber and North Yorkshire ICB - 42D |
|---|---|---|---|---|---|---|---|---|---|
Klebsiella spp. bacteraemia case counts and rates, by sub ICB location (SICBL) and financial year (Persons All ages) | 2024/25 | 23.6 | 25.3 | 30.5 | 20.5 | 26.0 | 25.9 | 22.8 | 26.1 |
Klebsiella spp. bacteraemia case counts and rates of community-onset, by sub ICB location (SICBL) and financial year (Persons All ages) | 2024/25 | 16.2 | 19.1 | 21.5 | 15.3 | 17.8 | 19.4 | 18.2 | 20.9 |
| Indicator | Period | England | NHS Humber and North Yorkshire Integrated Care Board - QOQ | Humber and North Yorkshire ICB - 02Y | Humber and North Yorkshire ICB - 03F | Humber and North Yorkshire ICB - 03H | Humber and North Yorkshire ICB - 03K | Humber and North Yorkshire ICB - 03Q | Humber and North Yorkshire ICB - 42D |
|---|---|---|---|---|---|---|---|---|---|
Klebsiella spp. bacteraemia case counts and rates, by sub ICB location (SICBL) and financial year (Persons All ages) | 2024/25 | 23.6 | 25.3 | 30.5 | 20.5 | 26.0 | 25.9 | 22.8 | 26.1 |
Klebsiella spp. bacteraemia case counts and rates of community-onset, by sub ICB location (SICBL) and financial year (Persons All ages) | 2024/25 | 16.2 | 19.1 | 21.5 | 15.3 | 17.8 | 19.4 | 18.2 | 20.9 |
There is year-on-year variability in the number of cases of klebsiella spp. infections in Hull, but the pattern of change between 2017/18 and 2022/23 in Hull is similar to that of England, albeit with much larger annual variation.
During the 2024/25 financial year, there were 55 cases of klebsiella spp. infections in Hull.
Compared with benchmark
Better
Similar
Worse
Not Compared
Lower
Similar
Higher
Klebsiella spp. bacteraemia case counts and rates, by sub ICB location (SICBL) and financial year (Persons All ages)
|
Period
|
Humber and North Yorkshire ICB - 03F |
NHS Humber and North Yorkshire Integrated Care Board - QOQ
|
England
|
||||
|---|---|---|---|---|---|---|---|
|
Count
|
Value
|
95%
Lower CI |
95%
Upper CI |
||||
| 2017/18 | • | 42 | 15.7 | - | - | 20.8 | 17.6 |
| 2018/19 | • | 54 | 20.1 | - | - | 21.0 | 19.2 |
| 2019/20 | • | 52 | 19.3 | - | - | 22.3 | 19.7 |
| 2020/21 | • | 45 | 16.9 | - | - | 20.4 | 19.9 |
| 2021/22 | • | 63 | 23.6 | - | - | 22.5 | 20.2 |
| 2022/23 | • | 48 | 17.9 | - | - | 22.4 | 20.8 |
| 2023/24 | • | 81 | 30.1 | - | - | 26.9 | 22.9 |
| 2024/25 | • | 55 | 20.5 | - | - | 25.3 | 23.6 |
Source: UK Health Security Agency
There is year-on-year variability in the number of cases of klebsiella spp. infections that are community-onset in Hull, but the pattern of change between 2017/18 and 2024/25 in Hull is similar to that of England with a small increase over time, albeit again with greater annual variation, to be expected given the relatively low number of cases.
The rate in Hull has generally been lower than England with the exception of 2021/22 and 2023/24.
During the 2024/25 financial year, there were 41 cases of klebsiella spp. infections that were community-onset in Hull so around three-quarters of cases of klebiella spp. infections in Hull are community-onset.
Compared with benchmark
Better
Similar
Worse
Not Compared
Lower
Similar
Higher
Klebsiella spp. bacteraemia case counts and rates of community-onset, by sub ICB location (SICBL) and financial year (Persons All ages)
|
Period
|
Humber and North Yorkshire ICB - 03F |
NHS Humber and North Yorkshire Integrated Care Board - QOQ
|
England
|
||||
|---|---|---|---|---|---|---|---|
|
Count
|
Value
|
95%
Lower CI |
95%
Upper CI |
||||
| 2017/18 | • | 26 | 9.7 | - | - | 15.3 | 12.4 |
| 2018/19 | • | 34 | 12.7 | - | - | 15.3 | 13.4 |
| 2019/20 | • | 30 | 11.2 | - | - | 16.4 | 14.0 |
| 2020/21 | • | 29 | 10.9 | - | - | 15.3 | 13.2 |
| 2021/22 | • | 43 | 16.1 | - | - | 16.0 | 13.7 |
| 2022/23 | • | 31 | 11.5 | - | - | 15.1 | 13.9 |
| 2023/24 | • | 53 | 19.7 | - | - | 18.8 | 15.9 |
| 2024/25 | • | 41 | 15.3 | - | - | 19.1 | 16.2 |
Source: UK Health Security Agency
Cases by Month (12-Month Rolling Total)
For the year to October 2025, the rate of klebsiella spp. infections is very similar in Hull (03F) as England being slightly higher for hospital-onset cases and slightly lower for community-onset cases.
Compared with benchmark
Better
Similar
Worse
Not Compared
Lower
Similar
Higher
| Indicator | Period | England | NHS Humber and North Yorkshire Integrated Care Board - QOQ | Humber and North Yorkshire ICB - 02Y | Humber and North Yorkshire ICB - 03F | Humber and North Yorkshire ICB - 03H | Humber and North Yorkshire ICB - 03K | Humber and North Yorkshire ICB - 03Q | Humber and North Yorkshire ICB - 42D |
|---|---|---|---|---|---|---|---|---|---|
Klebsiella spp. bacteraemia 12-month rolling case counts and rates, by Sub ICB Location (SICBL) and month (Persons All ages) | Apr 2026 | 23.9 | 28.2 | 26.6 | 25.4 | 30.6 | 33.3 | 26.0 | 30.1 |
Klebsiella spp. bacteraemia 12-month rolling case counts and rates of hospital-onset, by Sub ICB Location (SICBL) and month (Persons All ages) | Apr 2026 | 6.9 | 8.1 | 7.0 | 7.3 | 10.0 | 11.1 | 8.8 | 7.1 |
Klebsiella spp. bacteraemia 12-month rolling case counts and rates of community-onset, by Sub ICB Location (SICBL) and month (Persons All ages) | Apr 2026 | 17.0 | 20.1 | 19.7 | 18.2 | 20.6 | 22.2 | 17.1 | 23.0 |
| Indicator | Period | England | NHS Humber and North Yorkshire Integrated Care Board - QOQ | Humber and North Yorkshire ICB - 02Y | Humber and North Yorkshire ICB - 03F | Humber and North Yorkshire ICB - 03H | Humber and North Yorkshire ICB - 03K | Humber and North Yorkshire ICB - 03Q | Humber and North Yorkshire ICB - 42D |
|---|---|---|---|---|---|---|---|---|---|
Klebsiella spp. bacteraemia 12-month rolling case counts and rates, by Sub ICB Location (SICBL) and month (Persons All ages) | Apr 2026 | 23.9 | 28.2 | 26.6 | 25.4 | 30.6 | 33.3 | 26.0 | 30.1 |
Klebsiella spp. bacteraemia 12-month rolling case counts and rates of hospital-onset, by Sub ICB Location (SICBL) and month (Persons All ages) | Apr 2026 | 6.9 | 8.1 | 7.0 | 7.3 | 10.0 | 11.1 | 8.8 | 7.1 |
Klebsiella spp. bacteraemia 12-month rolling case counts and rates of community-onset, by Sub ICB Location (SICBL) and month (Persons All ages) | Apr 2026 | 17.0 | 20.1 | 19.7 | 18.2 | 20.6 | 22.2 | 17.1 | 23.0 |
There were four cases of klebsiella spp. infection in Hull for the year May 2016 to April 2017 giving a rate of 1.5 cases per 100,000 population, but this steadily increased to around 40 cases by February 2018 (for the year March 2017 to February 2018) giving a rate of around 15 cases per 100,000 population. The rate gradually increased over quite a long period of time between 20018 and mid-2023 to around 20 cases per 100,000 population although there was a slight decrease in 2020 and early 2021 due to the COVID-19 pandemic. Since mid-2023, the rate has increased in Hull to a high of 30 cases per 100,000 population for March 2024 (for the year April 2023 to March 2024) although there has been reduction to 21 per 100,000 population for April 2025 (for the year May 2024 to April 2025).
Over the period April 2017 to Autumn 2023, the infection rate in Hull has been reasonably similar to England, although since late 2023, the rate in Hull has increased at a faster rate than the increase for England so that the rate in Hull was 30% higher than England for the year April 2023 to March 2024. With the recent decrease in the infection rate in Hull combined with no real change in England, the rate in Hull is again similar to England for the latest period November 2024 to October 2025.
The increased rate could be due to increased testing, detection and/or recording of klebsiella spp. infections over time.
Over the period November 2024 to October 2025, there were 65 cases of klebsiella spp. infection in Hull.
Compared with benchmark
Better
Similar
Worse
Not Compared
Lower
Similar
Higher
Klebsiella spp. bacteraemia 12-month rolling case counts and rates, by Sub ICB Location (SICBL) and month (Persons All ages)
|
Period
|
Humber and North Yorkshire ICB - 03F |
NHS Humber and North Yorkshire Integrated Care Board - QOQ
|
England
|
||||
|---|---|---|---|---|---|---|---|
|
Count
|
Value
|
95%
Lower CI |
95%
Upper CI |
||||
| Apr 2017 | • | 4 | 1.5 | - | - | 2.0 | 1.4 |
| May 2017 | • | 7 | 2.6 | - | - | 4.0 | 2.8 |
| Jun 2017 | • | 10 | 3.8 | - | - | 5.3 | 4.2 |
| Jul 2017 | • | 16 | 6.0 | - | - | 7.7 | 6.0 |
| Aug 2017 | • | 21 | 7.9 | - | - | 9.5 | 7.5 |
| Sep 2017 | • | 23 | 8.6 | - | - | 11.2 | 9.1 |
| Oct 2017 | • | 28 | 10.5 | - | - | 13.1 | 10.7 |
| Nov 2017 | • | 32 | 12.0 | - | - | 15.0 | 12.2 |
| Dec 2017 | • | 36 | 13.5 | - | - | 16.4 | 13.6 |
| Jan 2018 | • | 38 | 14.2 | - | - | 17.8 | 15.0 |
| Feb 2018 | • | 40 | 15.0 | - | - | 19.1 | 16.2 |
| Mar 2018 | • | 42 | 15.7 | - | - | 20.7 | 17.6 |
| Apr 2018 | • | 44 | 16.4 | - | - | 20.8 | 17.7 |
| May 2018 | • | 45 | 16.8 | - | - | 20.7 | 17.8 |
| Jun 2018 | • | 48 | 17.9 | - | - | 21.1 | 17.9 |
| Jul 2018 | • | 46 | 17.2 | - | - | 20.3 | 18.0 |
| Aug 2018 | • | 44 | 16.4 | - | - | 20.2 | 18.1 |
| Sep 2018 | • | 48 | 17.9 | - | - | 20.5 | 18.3 |
| Oct 2018 | • | 48 | 17.9 | - | - | 20.5 | 18.3 |
| Nov 2018 | • | 50 | 18.6 | - | - | 20.3 | 18.4 |
| Dec 2018 | • | 50 | 18.6 | - | - | 20.3 | 18.6 |
| Jan 2019 | • | 52 | 19.4 | - | - | 21.0 | 18.8 |
| Feb 2019 | • | 52 | 19.4 | - | - | 20.8 | 19.0 |
| Mar 2019 | • | 54 | 20.1 | - | - | 20.9 | 19.2 |
| Apr 2019 | • | 52 | 19.4 | - | - | 20.9 | 19.3 |
| May 2019 | • | 52 | 19.4 | - | - | 21.2 | 19.2 |
| Jun 2019 | • | 50 | 18.6 | - | - | 21.6 | 19.1 |
| Jul 2019 | • | 49 | 18.3 | - | - | 22.0 | 19.2 |
| Aug 2019 | • | 53 | 19.8 | - | - | 22.5 | 19.3 |
| Sep 2019 | • | 51 | 19.0 | - | - | 22.6 | 19.3 |
| Oct 2019 | • | 49 | 18.3 | - | - | 22.4 | 19.5 |
| Nov 2019 | • | 49 | 18.3 | - | - | 22.6 | 19.7 |
| Dec 2019 | • | 50 | 18.6 | - | - | 22.9 | 19.7 |
| Jan 2020 | • | 49 | 18.3 | - | - | 22.4 | 19.7 |
| Feb 2020 | • | 50 | 18.6 | - | - | 22.6 | 19.7 |
| Mar 2020 | • | 52 | 19.3 | - | - | 22.3 | 19.6 |
| Apr 2020 | • | 49 | 18.2 | - | - | 21.2 | 19.5 |
| May 2020 | • | 50 | 18.6 | - | - | 20.6 | 19.4 |
| Jun 2020 | • | 46 | 17.1 | - | - | 19.9 | 19.4 |
| Jul 2020 | • | 45 | 16.8 | - | - | 19.7 | 19.3 |
| Aug 2020 | • | 44 | 16.4 | - | - | 19.7 | 19.2 |
| Sep 2020 | • | 46 | 17.1 | - | - | 19.3 | 19.3 |
| Oct 2020 | • | 47 | 17.5 | - | - | 19.9 | 19.2 |
| Nov 2020 | • | 45 | 16.8 | - | - | 19.9 | 19.1 |
| Dec 2020 | • | 45 | 16.8 | - | - | 19.8 | 19.2 |
| Jan 2021 | • | 48 | 17.9 | - | - | 20.4 | 19.5 |
| Feb 2021 | • | 48 | 18.0 | - | - | 20.2 | 19.7 |
| Mar 2021 | • | 45 | 16.9 | - | - | 20.4 | 19.9 |
| Apr 2021 | • | 50 | 18.7 | - | - | 21.5 | 19.9 |
| May 2021 | • | 53 | 19.9 | - | - | 21.7 | 20.0 |
| Jun 2021 | • | 55 | 20.6 | - | - | 21.9 | 20.1 |
| Jul 2021 | • | 57 | 21.4 | - | - | 21.9 | 20.3 |
| Aug 2021 | • | 55 | 20.6 | - | - | 21.6 | 20.3 |
| Sep 2021 | • | 54 | 20.2 | - | - | 22.3 | 20.3 |
| Oct 2021 | • | 54 | 20.2 | - | - | 21.6 | 20.5 |
| Nov 2021 | • | 59 | 22.1 | - | - | 22.3 | 20.7 |
| Dec 2021 | • | 58 | 21.7 | - | - | 22.2 | 20.7 |
| Jan 2022 | • | 55 | 20.6 | - | - | 21.3 | 20.3 |
| Feb 2022 | • | 58 | 21.7 | - | - | 21.7 | 20.1 |
| Mar 2022 | • | 63 | 23.6 | - | - | 22.4 | 20.2 |
| Apr 2022 | • | 60 | 22.4 | - | - | 21.9 | 20.2 |
| May 2022 | • | 57 | 21.3 | - | - | 21.6 | 20.3 |
| Jun 2022 | • | 57 | 21.3 | - | - | 21.6 | 20.3 |
| Jul 2022 | • | 55 | 20.5 | - | - | 21.5 | 20.3 |
| Aug 2022 | • | 61 | 22.7 | - | - | 22.9 | 20.4 |
| Sep 2022 | • | 58 | 21.6 | - | - | 22.4 | 20.5 |
| Oct 2022 | • | 58 | 21.6 | - | - | 22.4 | 20.4 |
| Nov 2022 | • | 51 | 19.0 | - | - | 21.8 | 20.4 |
| Dec 2022 | • | 54 | 20.1 | - | - | 22.1 | 20.4 |
| Jan 2023 | • | 57 | 21.2 | - | - | 22.7 | 20.5 |
| Feb 2023 | • | 55 | 20.4 | - | - | 22.9 | 20.6 |
| Mar 2023 | • | 48 | 17.8 | - | - | 22.3 | 20.6 |
| Apr 2023 | • | 52 | 19.3 | - | - | 23.0 | 20.7 |
| May 2023 | • | 51 | 18.9 | - | - | 23.2 | 20.8 |
| Jun 2023 | • | 54 | 19.9 | - | - | 23.8 | 21.1 |
| Jul 2023 | • | 60 | 22.1 | - | - | 24.0 | 21.3 |
| Aug 2023 | • | 57 | 21.0 | - | - | 23.6 | 21.4 |
| Sep 2023 | • | 61 | 22.5 | - | - | 24.2 | 21.5 |
| Oct 2023 | • | 68 | 25.0 | - | - | 25.0 | 21.7 |
| Nov 2023 | • | 70 | 25.7 | - | - | 24.8 | 21.8 |
| Dec 2023 | • | 72 | 26.4 | - | - | 25.3 | 22.0 |
| Jan 2024 | • | 71 | 26.0 | - | - | 25.5 | 22.1 |
| Feb 2024 | • | 72 | 26.3 | - | - | 25.4 | 22.2 |
| Mar 2024 | • | 80 | 29.2 | - | - | 26.5 | 22.5 |
| Apr 2024 | • | 77 | 28.1 | - | - | 25.8 | 22.7 |
| May 2024 | • | 74 | 27.0 | - | - | 26.0 | 22.7 |
| Jun 2024 | • | 71 | 25.9 | - | - | 26.4 | 22.7 |
| Jul 2024 | • | 66 | 24.0 | - | - | 26.6 | 22.8 |
| Aug 2024 | • | 66 | 24.0 | - | - | 25.5 | 22.9 |
| Sep 2024 | • | 63 | 22.9 | - | - | 25.6 | 23.0 |
| Oct 2024 | • | 62 | 22.5 | - | - | 25.3 | 22.9 |
| Nov 2024 | • | 67 | 24.4 | - | - | 25.3 | 22.9 |
| Dec 2024 | • | 62 | 22.5 | - | - | 25.6 | 23.0 |
| Jan 2025 | • | 63 | 22.9 | - | - | 25.6 | 23.0 |
| Feb 2025 | • | 62 | 22.6 | - | - | 26.1 | 23.1 |
| Mar 2025 | • | 55 | 20.0 | - | - | 24.8 | 23.0 |
| Apr 2025 | • | 56 | 20.4 | - | - | 25.3 | 22.9 |
| May 2025 | • | 57 | 20.7 | - | - | 25.4 | 23.1 |
| Jun 2025 | • | 62 | 22.5 | - | - | 25.1 | 23.1 |
| Jul 2025 | • | 68 | 24.7 | - | - | 25.9 | 23.3 |
| Aug 2025 | • | 65 | 23.6 | - | - | 26.2 | 23.4 |
| Sep 2025 | • | 68 | 24.7 | - | - | 26.4 | 23.4 |
| Oct 2025 | • | 65 | 23.6 | - | - | 26.7 | 23.5 |
| Nov 2025 | • | 65 | 23.6 | - | - | 27.9 | 23.6 |
| Dec 2025 | • | 66 | 24.0 | - | - | 27.8 | 23.6 |
| Jan 2026 | • | 66 | 24.0 | - | - | 27.9 | 23.6 |
| Feb 2026 | • | 65 | 23.6 | - | - | 27.3 | 23.6 |
| Mar 2026 | • | 70 | 25.4 | - | - | 28.6 | 23.8 |
| Apr 2026 | • | 70 | 25.4 | - | - | 28.2 | 23.9 |
Source: UK Health Security Agency
The number of hospital-onset cases of klebsiella spp. infections has generally been higher in Hull compared to England when examining the 12-month rolling total number of infections.
In the year May 2016 to April 2017, there had been no hospital-onset klebsiella spp. infections in Hull but this has gradually increased in Hull. An increase has also been observed for England and the region, and it is possible that the increase is associated with better testing, detection and/or recording of klebsiella spp. infections over time.
The infection rate has shown considerably month-to-month variability over time, but since the end of 2017, the hospital-onset infection rate in Hull has generally been higher than England except for mid-2023 and the most recent few months.
The rate in Hull reached a peak of 10 cases per 100,000 population for the year April 2023 to March 2024 with a total of 27 cases, but the rate has decreased since then to 7.8 cases per 100,000 population for the latest period November 2024 to October 2025.
There have been 21 hospital-onset cases of klebsiella spp. infections in Hull over the year November 2024 to October 2025.
Compared with benchmark
Better
Similar
Worse
Not Compared
Lower
Similar
Higher
Klebsiella spp. bacteraemia 12-month rolling case counts and rates of hospital-onset, by Sub ICB Location (SICBL) and month (Persons All ages)
|
Period
|
Humber and North Yorkshire ICB - 03F |
NHS Humber and North Yorkshire Integrated Care Board - QOQ
|
England
|
||||
|---|---|---|---|---|---|---|---|
|
Count
|
Value
|
95%
Lower CI |
95%
Upper CI |
||||
| Apr 2017 | • | - | 0.0 | - | - | 0.5 | 0.4 |
| May 2017 | • | - | 0.0 | - | - | 1.0 | 0.8 |
| Jun 2017 | • | 2 | 0.8 | - | - | 1.4 | 1.2 |
| Jul 2017 | • | 2 | 0.8 | - | - | 2.0 | 1.7 |
| Aug 2017 | • | 4 | 1.5 | - | - | 2.3 | 2.2 |
| Sep 2017 | • | 5 | 1.9 | - | - | 2.7 | 2.6 |
| Oct 2017 | • | 8 | 3.0 | - | - | 3.4 | 3.1 |
| Nov 2017 | • | 12 | 4.5 | - | - | 4.0 | 3.6 |
| Dec 2017 | • | 14 | 5.2 | - | - | 4.3 | 4.0 |
| Jan 2018 | • | 15 | 5.6 | - | - | 4.8 | 4.5 |
| Feb 2018 | • | 16 | 6.0 | - | - | 5.0 | 4.8 |
| Mar 2018 | • | 16 | 6.0 | - | - | 5.5 | 5.3 |
| Apr 2018 | • | 17 | 6.3 | - | - | 5.7 | 5.3 |
| May 2018 | • | 18 | 6.7 | - | - | 5.9 | 5.3 |
| Jun 2018 | • | 18 | 6.7 | - | - | 5.9 | 5.4 |
| Jul 2018 | • | 20 | 7.5 | - | - | 5.7 | 5.4 |
| Aug 2018 | • | 18 | 6.7 | - | - | 5.9 | 5.4 |
| Sep 2018 | • | 20 | 7.5 | - | - | 6.0 | 5.6 |
| Oct 2018 | • | 17 | 6.3 | - | - | 5.7 | 5.6 |
| Nov 2018 | • | 16 | 6.0 | - | - | 5.5 | 5.6 |
| Dec 2018 | • | 18 | 6.7 | - | - | 5.8 | 5.7 |
| Jan 2019 | • | 19 | 7.1 | - | - | 5.9 | 5.6 |
| Feb 2019 | • | 19 | 7.1 | - | - | 5.8 | 5.7 |
| Mar 2019 | • | 20 | 7.5 | - | - | 5.7 | 5.7 |
| Apr 2019 | • | 21 | 7.8 | - | - | 5.7 | 5.8 |
| May 2019 | • | 21 | 7.8 | - | - | 5.4 | 5.8 |
| Jun 2019 | • | 21 | 7.8 | - | - | 5.4 | 5.8 |
| Jul 2019 | • | 20 | 7.5 | - | - | 5.4 | 5.7 |
| Aug 2019 | • | 23 | 8.6 | - | - | 5.6 | 5.8 |
| Sep 2019 | • | 22 | 8.2 | - | - | 5.8 | 5.7 |
| Oct 2019 | • | 23 | 8.6 | - | - | 5.7 | 5.7 |
| Nov 2019 | • | 23 | 8.6 | - | - | 5.8 | 5.8 |
| Dec 2019 | • | 22 | 8.2 | - | - | 5.7 | 5.8 |
| Jan 2020 | • | 20 | 7.5 | - | - | 5.4 | 5.8 |
| Feb 2020 | • | 21 | 7.8 | - | - | 5.8 | 5.8 |
| Mar 2020 | • | 22 | 8.2 | - | - | 5.8 | 5.7 |
| Apr 2020 | • | 20 | 7.4 | - | - | 5.4 | 5.8 |
| May 2020 | • | 19 | 7.1 | - | - | 5.2 | 5.8 |
| Jun 2020 | • | 17 | 6.3 | - | - | 5.1 | 5.8 |
| Jul 2020 | • | 16 | 6.0 | - | - | 5.2 | 5.7 |
| Aug 2020 | • | 14 | 5.2 | - | - | 5.2 | 5.6 |
| Sep 2020 | • | 13 | 4.8 | - | - | 4.9 | 5.6 |
| Oct 2020 | • | 14 | 5.2 | - | - | 5.1 | 5.7 |
| Nov 2020 | • | 13 | 4.9 | - | - | 5.3 | 5.8 |
| Dec 2020 | • | 14 | 5.2 | - | - | 5.2 | 5.9 |
| Jan 2021 | • | 18 | 6.7 | - | - | 5.3 | 6.4 |
| Feb 2021 | • | 18 | 6.7 | - | - | 5.4 | 6.6 |
| Mar 2021 | • | 16 | 6.0 | - | - | 5.1 | 6.7 |
| Apr 2021 | • | 16 | 6.0 | - | - | 5.5 | 6.6 |
| May 2021 | • | 17 | 6.4 | - | - | 5.7 | 6.7 |
| Jun 2021 | • | 17 | 6.4 | - | - | 5.7 | 6.7 |
| Jul 2021 | • | 19 | 7.1 | - | - | 5.8 | 6.9 |
| Aug 2021 | • | 20 | 7.5 | - | - | 6.0 | 7.0 |
| Sep 2021 | • | 21 | 7.9 | - | - | 6.1 | 7.1 |
| Oct 2021 | • | 19 | 7.1 | - | - | 6.2 | 7.2 |
| Nov 2021 | • | 21 | 7.9 | - | - | 6.4 | 7.2 |
| Dec 2021 | • | 19 | 7.1 | - | - | 6.5 | 7.2 |
| Jan 2022 | • | 17 | 6.4 | - | - | 6.5 | 6.8 |
| Feb 2022 | • | 16 | 6.0 | - | - | 6.3 | 6.6 |
| Mar 2022 | • | 20 | 7.5 | - | - | 6.5 | 6.5 |
| Apr 2022 | • | 22 | 8.2 | - | - | 6.5 | 6.6 |
| May 2022 | • | 25 | 9.3 | - | - | 6.9 | 6.6 |
| Jun 2022 | • | 25 | 9.3 | - | - | 7.0 | 6.7 |
| Jul 2022 | • | 24 | 9.0 | - | - | 7.1 | 6.6 |
| Aug 2022 | • | 26 | 9.7 | - | - | 7.5 | 6.6 |
| Sep 2022 | • | 24 | 8.9 | - | - | 7.5 | 6.7 |
| Oct 2022 | • | 25 | 9.3 | - | - | 7.5 | 6.7 |
| Nov 2022 | • | 21 | 7.8 | - | - | 7.2 | 6.6 |
| Dec 2022 | • | 21 | 7.8 | - | - | 7.3 | 6.7 |
| Jan 2023 | • | 21 | 7.8 | - | - | 7.2 | 6.8 |
| Feb 2023 | • | 21 | 7.8 | - | - | 7.3 | 6.8 |
| Mar 2023 | • | 17 | 6.3 | - | - | 7.3 | 6.9 |
| Apr 2023 | • | 17 | 6.3 | - | - | 7.5 | 6.8 |
| May 2023 | • | 14 | 5.2 | - | - | 7.1 | 6.8 |
| Jun 2023 | • | 18 | 6.6 | - | - | 7.5 | 6.8 |
| Jul 2023 | • | 19 | 7.0 | - | - | 7.1 | 6.9 |
| Aug 2023 | • | 17 | 6.3 | - | - | 6.9 | 6.8 |
| Sep 2023 | • | 21 | 7.7 | - | - | 7.0 | 6.8 |
| Oct 2023 | • | 21 | 7.7 | - | - | 7.2 | 6.8 |
| Nov 2023 | • | 23 | 8.4 | - | - | 7.2 | 6.8 |
| Dec 2023 | • | 22 | 8.1 | - | - | 7.2 | 6.8 |
| Jan 2024 | • | 20 | 7.3 | - | - | 7.2 | 6.7 |
| Feb 2024 | • | 23 | 8.4 | - | - | 7.4 | 6.8 |
| Mar 2024 | • | 27 | 9.8 | - | - | 7.9 | 6.8 |
| Apr 2024 | • | 25 | 9.1 | - | - | 7.3 | 6.9 |
| May 2024 | • | 24 | 8.7 | - | - | 7.4 | 7.0 |
| Jun 2024 | • | 21 | 7.6 | - | - | 7.2 | 7.0 |
| Jul 2024 | • | 19 | 6.9 | - | - | 7.3 | 7.0 |
| Aug 2024 | • | 18 | 6.6 | - | - | 6.8 | 7.1 |
| Sep 2024 | • | 14 | 5.1 | - | - | 6.7 | 7.2 |
| Oct 2024 | • | 15 | 5.5 | - | - | 6.4 | 7.1 |
| Nov 2024 | • | 15 | 5.5 | - | - | 6.2 | 7.0 |
| Dec 2024 | • | 15 | 5.4 | - | - | 6.3 | 7.1 |
| Jan 2025 | • | 18 | 6.5 | - | - | 6.6 | 7.2 |
| Feb 2025 | • | 16 | 5.8 | - | - | 6.5 | 7.1 |
| Mar 2025 | • | 14 | 5.1 | - | - | 6.1 | 7.2 |
| Apr 2025 | • | 17 | 6.2 | - | - | 6.6 | 7.1 |
| May 2025 | • | 18 | 6.5 | - | - | 6.6 | 7.2 |
| Jun 2025 | • | 17 | 6.2 | - | - | 6.5 | 7.1 |
| Jul 2025 | • | 22 | 8.0 | - | - | 7.3 | 7.2 |
| Aug 2025 | • | 22 | 8.0 | - | - | 7.4 | 7.2 |
| Sep 2025 | • | 22 | 8.0 | - | - | 7.3 | 7.1 |
| Oct 2025 | • | 21 | 7.6 | - | - | 7.3 | 7.1 |
| Nov 2025 | • | 23 | 8.4 | - | - | 8.0 | 7.1 |
| Dec 2025 | • | 23 | 8.4 | - | - | 8.0 | 7.0 |
| Jan 2026 | • | 24 | 8.7 | - | - | 8.2 | 7.0 |
| Feb 2026 | • | 22 | 8.0 | - | - | 8.1 | 7.0 |
| Mar 2026 | • | 22 | 8.0 | - | - | 8.5 | 6.9 |
| Apr 2026 | • | 20 | 7.3 | - | - | 8.1 | 6.9 |
Source: UK Health Security Agency
The number of community-onset cases of klebsiella spp. infections as shown a similar pattern to that for hospital-onset cases, and it is again possible that the increase is due to better testing, detection and/or recording over time.
The community-onset klebsiella spp. infection rate was generally been lower in Hull compared to England until mid-2023.
Since then, the rate in Hull has increased quite sharply compared to only a small increase for England and the rate had been consistently higher than England from July 2023 (year August 2022 to July 2023), excluding and February 2025 (year March 2024 to February 2025). The 12 month rolling average number of cases in Hull decreased in the year to October 2025 and is slightly lower than England for this period.
Over the November 2024 to October 2025 financial year, there were 44 klebsiella spp. infections in Hull that were community-onset.
Compared with benchmark
Better
Similar
Worse
Not Compared
Lower
Similar
Higher
Klebsiella spp. bacteraemia 12-month rolling case counts and rates of community-onset, by Sub ICB Location (SICBL) and month (Persons All ages)
|
Period
|
Humber and North Yorkshire ICB - 03F |
NHS Humber and North Yorkshire Integrated Care Board - QOQ
|
England
|
||||
|---|---|---|---|---|---|---|---|
|
Count
|
Value
|
95%
Lower CI |
95%
Upper CI |
||||
| Apr 2017 | • | 4 | 1.5 | - | - | 1.5 | 1.0 |
| May 2017 | • | 7 | 2.6 | - | - | 3.0 | 2.0 |
| Jun 2017 | • | 8 | 3.0 | - | - | 3.9 | 3.0 |
| Jul 2017 | • | 14 | 5.3 | - | - | 5.6 | 4.2 |
| Aug 2017 | • | 17 | 6.4 | - | - | 7.2 | 5.3 |
| Sep 2017 | • | 18 | 6.8 | - | - | 8.5 | 6.4 |
| Oct 2017 | • | 20 | 7.5 | - | - | 9.7 | 7.6 |
| Nov 2017 | • | 20 | 7.5 | - | - | 11.0 | 8.6 |
| Dec 2017 | • | 22 | 8.2 | - | - | 12.2 | 9.6 |
| Jan 2018 | • | 23 | 8.6 | - | - | 13.0 | 10.5 |
| Feb 2018 | • | 24 | 9.0 | - | - | 14.1 | 11.4 |
| Mar 2018 | • | 26 | 9.7 | - | - | 15.2 | 12.3 |
| Apr 2018 | • | 27 | 10.1 | - | - | 15.2 | 12.4 |
| May 2018 | • | 27 | 10.1 | - | - | 14.8 | 12.5 |
| Jun 2018 | • | 30 | 11.2 | - | - | 15.2 | 12.6 |
| Jul 2018 | • | 26 | 9.7 | - | - | 14.6 | 12.6 |
| Aug 2018 | • | 26 | 9.7 | - | - | 14.3 | 12.7 |
| Sep 2018 | • | 28 | 10.4 | - | - | 14.4 | 12.7 |
| Oct 2018 | • | 31 | 11.6 | - | - | 14.8 | 12.6 |
| Nov 2018 | • | 34 | 12.7 | - | - | 14.8 | 12.8 |
| Dec 2018 | • | 32 | 11.9 | - | - | 14.5 | 12.9 |
| Jan 2019 | • | 33 | 12.3 | - | - | 15.1 | 13.2 |
| Feb 2019 | • | 33 | 12.3 | - | - | 15.0 | 13.3 |
| Mar 2019 | • | 34 | 12.7 | - | - | 15.2 | 13.4 |
| Apr 2019 | • | 31 | 11.6 | - | - | 15.1 | 13.5 |
| May 2019 | • | 31 | 11.6 | - | - | 15.8 | 13.5 |
| Jun 2019 | • | 29 | 10.8 | - | - | 16.1 | 13.4 |
| Jul 2019 | • | 29 | 10.8 | - | - | 16.6 | 13.4 |
| Aug 2019 | • | 30 | 11.2 | - | - | 16.9 | 13.5 |
| Sep 2019 | • | 29 | 10.8 | - | - | 16.8 | 13.6 |
| Oct 2019 | • | 26 | 9.7 | - | - | 16.7 | 13.8 |
| Nov 2019 | • | 26 | 9.7 | - | - | 16.8 | 13.9 |
| Dec 2019 | • | 28 | 10.4 | - | - | 17.3 | 13.9 |
| Jan 2020 | • | 29 | 10.8 | - | - | 17.0 | 13.9 |
| Feb 2020 | • | 29 | 10.8 | - | - | 16.8 | 13.9 |
| Mar 2020 | • | 30 | 11.2 | - | - | 16.4 | 13.9 |
| Apr 2020 | • | 29 | 10.8 | - | - | 15.8 | 13.7 |
| May 2020 | • | 31 | 11.5 | - | - | 15.4 | 13.6 |
| Jun 2020 | • | 29 | 10.8 | - | - | 14.8 | 13.7 |
| Jul 2020 | • | 29 | 10.8 | - | - | 14.5 | 13.6 |
| Aug 2020 | • | 30 | 11.2 | - | - | 14.6 | 13.6 |
| Sep 2020 | • | 33 | 12.3 | - | - | 14.4 | 13.6 |
| Oct 2020 | • | 33 | 12.3 | - | - | 14.9 | 13.5 |
| Nov 2020 | • | 32 | 11.9 | - | - | 14.6 | 13.3 |
| Dec 2020 | • | 31 | 11.6 | - | - | 14.5 | 13.3 |
| Jan 2021 | • | 30 | 11.2 | - | - | 15.1 | 13.1 |
| Feb 2021 | • | 30 | 11.2 | - | - | 14.8 | 13.1 |
| Mar 2021 | • | 29 | 10.9 | - | - | 15.3 | 13.1 |
| Apr 2021 | • | 34 | 12.7 | - | - | 16.0 | 13.3 |
| May 2021 | • | 36 | 13.5 | - | - | 16.1 | 13.4 |
| Jun 2021 | • | 38 | 14.2 | - | - | 16.2 | 13.4 |
| Jul 2021 | • | 38 | 14.2 | - | - | 16.1 | 13.4 |
| Aug 2021 | • | 35 | 13.1 | - | - | 15.6 | 13.3 |
| Sep 2021 | • | 33 | 12.4 | - | - | 16.2 | 13.2 |
| Oct 2021 | • | 35 | 13.1 | - | - | 15.4 | 13.3 |
| Nov 2021 | • | 38 | 14.2 | - | - | 15.9 | 13.5 |
| Dec 2021 | • | 39 | 14.6 | - | - | 15.7 | 13.5 |
| Jan 2022 | • | 38 | 14.2 | - | - | 14.8 | 13.5 |
| Feb 2022 | • | 42 | 15.7 | - | - | 15.4 | 13.6 |
| Mar 2022 | • | 43 | 16.1 | - | - | 16.0 | 13.6 |
| Apr 2022 | • | 38 | 14.2 | - | - | 15.4 | 13.6 |
| May 2022 | • | 32 | 12.0 | - | - | 14.8 | 13.7 |
| Jun 2022 | • | 32 | 12.0 | - | - | 14.6 | 13.7 |
| Jul 2022 | • | 31 | 11.6 | - | - | 14.5 | 13.6 |
| Aug 2022 | • | 35 | 13.0 | - | - | 15.4 | 13.7 |
| Sep 2022 | • | 34 | 12.7 | - | - | 14.8 | 13.8 |
| Oct 2022 | • | 33 | 12.3 | - | - | 14.8 | 13.8 |
| Nov 2022 | • | 30 | 11.2 | - | - | 14.6 | 13.7 |
| Dec 2022 | • | 33 | 12.3 | - | - | 14.8 | 13.7 |
| Jan 2023 | • | 36 | 13.4 | - | - | 15.4 | 13.8 |
| Feb 2023 | • | 34 | 12.6 | - | - | 15.6 | 13.8 |
| Mar 2023 | • | 31 | 11.5 | - | - | 15.0 | 13.8 |
| Apr 2023 | • | 35 | 13.0 | - | - | 15.5 | 13.9 |
| May 2023 | • | 37 | 13.7 | - | - | 16.0 | 14.0 |
| Jun 2023 | • | 36 | 13.3 | - | - | 16.3 | 14.3 |
| Jul 2023 | • | 41 | 15.1 | - | - | 16.8 | 14.4 |
| Aug 2023 | • | 40 | 14.7 | - | - | 16.7 | 14.6 |
| Sep 2023 | • | 40 | 14.7 | - | - | 17.2 | 14.7 |
| Oct 2023 | • | 47 | 17.3 | - | - | 17.8 | 14.9 |
| Nov 2023 | • | 47 | 17.3 | - | - | 17.5 | 15.0 |
| Dec 2023 | • | 50 | 18.3 | - | - | 18.1 | 15.2 |
| Jan 2024 | • | 51 | 18.7 | - | - | 18.4 | 15.4 |
| Feb 2024 | • | 49 | 17.9 | - | - | 18.0 | 15.4 |
| Mar 2024 | • | 53 | 19.3 | - | - | 18.6 | 15.6 |
| Apr 2024 | • | 52 | 19.0 | - | - | 18.5 | 15.8 |
| May 2024 | • | 50 | 18.2 | - | - | 18.6 | 15.7 |
| Jun 2024 | • | 50 | 18.2 | - | - | 19.2 | 15.7 |
| Jul 2024 | • | 47 | 17.1 | - | - | 19.3 | 15.7 |
| Aug 2024 | • | 48 | 17.5 | - | - | 18.8 | 15.8 |
| Sep 2024 | • | 49 | 17.8 | - | - | 18.9 | 15.8 |
| Oct 2024 | • | 47 | 17.1 | - | - | 18.9 | 15.9 |
| Nov 2024 | • | 52 | 18.9 | - | - | 19.1 | 15.9 |
| Dec 2024 | • | 47 | 17.1 | - | - | 19.3 | 15.9 |
| Jan 2025 | • | 45 | 16.3 | - | - | 19.0 | 15.9 |
| Feb 2025 | • | 46 | 16.7 | - | - | 19.6 | 16.0 |
| Mar 2025 | • | 41 | 14.9 | - | - | 18.7 | 15.8 |
| Apr 2025 | • | 39 | 14.2 | - | - | 18.7 | 15.8 |
| May 2025 | • | 39 | 14.2 | - | - | 18.8 | 15.9 |
| Jun 2025 | • | 45 | 16.4 | - | - | 18.6 | 15.9 |
| Jul 2025 | • | 46 | 16.7 | - | - | 18.6 | 16.1 |
| Aug 2025 | • | 43 | 15.6 | - | - | 18.8 | 16.2 |
| Sep 2025 | • | 46 | 16.7 | - | - | 19.2 | 16.3 |
| Oct 2025 | • | 44 | 16.0 | - | - | 19.4 | 16.4 |
| Nov 2025 | • | 42 | 15.3 | - | - | 20.0 | 16.5 |
| Dec 2025 | • | 43 | 15.6 | - | - | 19.8 | 16.6 |
| Jan 2026 | • | 42 | 15.3 | - | - | 19.7 | 16.6 |
| Feb 2026 | • | 43 | 15.6 | - | - | 19.2 | 16.7 |
| Mar 2026 | • | 48 | 17.4 | - | - | 20.1 | 16.9 |
| Apr 2026 | • | 50 | 18.2 | - | - | 20.1 | 17.0 |
Source: UK Health Security Agency
Pseudomonas Aeruginosa (P. Aeruginosa) Bacteraemia
Cases by Financial Year
The rate of P. aeruginosa bacteraemia infections in Hull (03F) was higher than England for 2024/25 both overall but slightly lower for community-onset cases. The number of cases of infection are relatively small.
Compared with benchmark
Better
Similar
Worse
Not Compared
Lower
Similar
Higher
| Indicator | Period | England | NHS Humber and North Yorkshire Integrated Care Board - QOQ | Humber and North Yorkshire ICB - 02Y | Humber and North Yorkshire ICB - 03F | Humber and North Yorkshire ICB - 03H | Humber and North Yorkshire ICB - 03K | Humber and North Yorkshire ICB - 03Q | Humber and North Yorkshire ICB - 42D |
|---|---|---|---|---|---|---|---|---|---|
P. aeruginosa bacteraemia case counts and rates, by sub ICB location (SICBL) and financial year (Persons All ages) | 2024/25 | 7.8 | 9.2 | 9.3 | 8.6 | 10.2 | 7.1 | 9.4 | 10.0 |
P. aeruginosa bacteraemia case counts and rates of community-onset, by sub ICB location (SICBL) and financial year (Persons All ages) | 2024/25 | 4.8 | 6.2 | 6.5 | 4.5 | 6.4 | 3.5 | 6.9 | 7.4 |
| Indicator | Period | England | NHS Humber and North Yorkshire Integrated Care Board - QOQ | Humber and North Yorkshire ICB - 02Y | Humber and North Yorkshire ICB - 03F | Humber and North Yorkshire ICB - 03H | Humber and North Yorkshire ICB - 03K | Humber and North Yorkshire ICB - 03Q | Humber and North Yorkshire ICB - 42D |
|---|---|---|---|---|---|---|---|---|---|
P. aeruginosa bacteraemia case counts and rates, by sub ICB location (SICBL) and financial year (Persons All ages) | 2024/25 | 7.8 | 9.2 | 9.3 | 8.6 | 10.2 | 7.1 | 9.4 | 10.0 |
P. aeruginosa bacteraemia case counts and rates of community-onset, by sub ICB location (SICBL) and financial year (Persons All ages) | 2024/25 | 4.8 | 6.2 | 6.5 | 4.5 | 6.4 | 3.5 | 6.9 | 7.4 |
There has been year-on-year variability in the P. aeruginosa infection rate in Hull, but in general the rate has been higher in Hull than England.
During 2024/25, there were relatively few cases of P. aeruginosa in Hull with 23 in total over the year.
Compared with benchmark
Better
Similar
Worse
Not Compared
Lower
Similar
Higher
P. aeruginosa bacteraemia case counts and rates, by sub ICB location (SICBL) and financial year (Persons All ages)
|
Period
|
Humber and North Yorkshire ICB - 03F |
NHS Humber and North Yorkshire Integrated Care Board - QOQ
|
England
|
||||
|---|---|---|---|---|---|---|---|
|
Count
|
Value
|
95%
Lower CI |
95%
Upper CI |
||||
| 2017/18 | • | 22 | 8.2 | - | - | 8.7 | 7.7 |
| 2018/19 | • | 22 | 8.2 | - | - | 8.5 | 7.5 |
| 2019/20 | • | 26 | 9.7 | - | - | 9.7 | 7.7 |
| 2020/21 | • | 20 | 7.5 | - | - | 7.3 | 7.6 |
| 2021/22 | • | 18 | 6.7 | - | - | 9.3 | 7.7 |
| 2022/23 | • | 25 | 9.3 | - | - | 8.6 | 7.7 |
| 2023/24 | • | 27 | 10.0 | - | - | 8.4 | 7.8 |
| 2024/25 | • | 23 | 8.6 | - | - | 9.2 | 7.8 |
Source: UK Health Security Agency
There has been year-on-year variability in the community-onset P. aeruginosa infection rate in Hull, but in general the rate has been higher in Hull than England.
During 2024/25, there were only 12 cases of P. aeruginosa in Hull that were community-onset so the number of cases is relatively small.
Compared with benchmark
Better
Similar
Worse
Not Compared
Lower
Similar
Higher
P. aeruginosa bacteraemia case counts and rates of community-onset, by sub ICB location (SICBL) and financial year (Persons All ages)
|
Period
|
Humber and North Yorkshire ICB - 03F |
NHS Humber and North Yorkshire Integrated Care Board - QOQ
|
England
|
||||
|---|---|---|---|---|---|---|---|
|
Count
|
Value
|
95%
Lower CI |
95%
Upper CI |
||||
| 2017/18 | • | 13 | 4.9 | - | - | 5.2 | 4.8 |
| 2018/19 | • | 16 | 6.0 | - | - | 5.3 | 4.8 |
| 2019/20 | • | 16 | 5.9 | - | - | 6.4 | 4.9 |
| 2020/21 | • | 10 | 3.7 | - | - | 4.8 | 4.7 |
| 2021/22 | • | 11 | 4.1 | - | - | 6.0 | 4.8 |
| 2022/23 | • | 17 | 6.3 | - | - | 5.6 | 4.8 |
| 2023/24 | • | 15 | 5.6 | - | - | 5.4 | 4.8 |
| 2024/25 | • | 12 | 4.5 | - | - | 6.2 | 4.8 |
Source: UK Health Security Agency
Cases by Month (12-Month Rolling Total)
For the year to October 2025, the number of hospital-onset cases of P. aeruginosa was higher in Hull compared to England, but the number of community-onset cases has been lower. The number of cases overall in Hull at 7.8 cases per 100,000 population for November 2024 to October 2025 is similar to England.
Compared with benchmark
Better
Similar
Worse
Not Compared
Lower
Similar
Higher
| Indicator | Period | England | NHS Humber and North Yorkshire Integrated Care Board - QOQ | Humber and North Yorkshire ICB - 02Y | Humber and North Yorkshire ICB - 03F | Humber and North Yorkshire ICB - 03H | Humber and North Yorkshire ICB - 03K | Humber and North Yorkshire ICB - 03Q | Humber and North Yorkshire ICB - 42D |
|---|---|---|---|---|---|---|---|---|---|
P. aeruginosa bacteraemia 12-month rolling case counts and rates, by Sub ICB Location (SICBL) and month (Persons All ages) | Apr 2026 | 8.0 | 8.9 | 10.3 | 7.3 | 7.5 | 9.9 | 9.6 | 8.2 |
P. aeruginosa bacteraemia 12-month rolling case counts and rates of hospital-onset, by Sub ICB Location (SICBL) and month (Persons All ages) | Apr 2026 | 2.9 | 2.6 | 3.0 | 2.9 | 3.1 | 4.1 | 2.4 | 1.4 |
P. aeruginosa bacteraemia 12-month rolling case counts and rates of community-onset, by Sub ICB Location (SICBL) and month (Persons All ages) | Apr 2026 | 5.1 | 6.3 | 7.3 | 4.4 | 4.4 | 5.8 | 7.2 | 6.8 |
| Indicator | Period | England | NHS Humber and North Yorkshire Integrated Care Board - QOQ | Humber and North Yorkshire ICB - 02Y | Humber and North Yorkshire ICB - 03F | Humber and North Yorkshire ICB - 03H | Humber and North Yorkshire ICB - 03K | Humber and North Yorkshire ICB - 03Q | Humber and North Yorkshire ICB - 42D |
|---|---|---|---|---|---|---|---|---|---|
P. aeruginosa bacteraemia 12-month rolling case counts and rates, by Sub ICB Location (SICBL) and month (Persons All ages) | Apr 2026 | 8.0 | 8.9 | 10.3 | 7.3 | 7.5 | 9.9 | 9.6 | 8.2 |
P. aeruginosa bacteraemia 12-month rolling case counts and rates of hospital-onset, by Sub ICB Location (SICBL) and month (Persons All ages) | Apr 2026 | 2.9 | 2.6 | 3.0 | 2.9 | 3.1 | 4.1 | 2.4 | 1.4 |
P. aeruginosa bacteraemia 12-month rolling case counts and rates of community-onset, by Sub ICB Location (SICBL) and month (Persons All ages) | Apr 2026 | 5.1 | 6.3 | 7.3 | 4.4 | 4.4 | 5.8 | 7.2 | 6.8 |
The number of cases of P. aeruginosa showed a steady increase from the year May 2016 to April 2017 to the year April 2018 to March 2019 for both Hull and England with the rate in Hull increasing from 0.8 to 8.8 per 100,000 population. The increased rate could be due to increased testing, detection and/or recording of P. aeruginosa infections over time.
The rate remained relatively constant for England at just under eight cases per 100,000 population, but for Hull the infection rate has been more variable ranging from 6.5 to 11.9 cases per 100,000 population. The rate in Hull has generally been higher than England with the exception of 2022 where the rate in Hull was lower. Since a low of 5.6 cases per 100,o00 population for the year November 2021 to October 2022 in Hull, the rate in Hull increased sharply to 11.9 cases per 100,000 population for the year October 2022 to September 2023. Between then and the year to February 2025 the rate varied from around 9 to 11 cases per 100,000 population but has been lower since then, with 7.8 cases per 100,000 population in the latest period November 2024 to October 2025.
For the latest period November 2024 to October 2025, there were only 21 cases of P. aeruginosa in Hull so the number of cases is relatively small.
Compared with benchmark
Better
Similar
Worse
Not Compared
Lower
Similar
Higher
P. aeruginosa bacteraemia 12-month rolling case counts and rates, by Sub ICB Location (SICBL) and month (Persons All ages)
|
Period
|
Humber and North Yorkshire ICB - 03F |
NHS Humber and North Yorkshire Integrated Care Board - QOQ
|
England
|
||||
|---|---|---|---|---|---|---|---|
|
Count
|
Value
|
95%
Lower CI |
95%
Upper CI |
||||
| Apr 2017 | • | 2 | 0.8 | - | - | 0.7 | 0.5 |
| May 2017 | • | 4 | 1.5 | - | - | 1.5 | 1.2 |
| Jun 2017 | • | 7 | 2.6 | - | - | 2.0 | 1.8 |
| Jul 2017 | • | 9 | 3.4 | - | - | 2.9 | 2.5 |
| Aug 2017 | • | 11 | 4.1 | - | - | 3.2 | 3.3 |
| Sep 2017 | • | 15 | 5.6 | - | - | 4.5 | 4.0 |
| Oct 2017 | • | 18 | 6.7 | - | - | 5.6 | 4.7 |
| Nov 2017 | • | 19 | 7.1 | - | - | 6.3 | 5.4 |
| Dec 2017 | • | 20 | 7.5 | - | - | 6.8 | 6.0 |
| Jan 2018 | • | 20 | 7.5 | - | - | 7.5 | 6.7 |
| Feb 2018 | • | 22 | 8.2 | - | - | 8.2 | 7.2 |
| Mar 2018 | • | 23 | 8.6 | - | - | 8.6 | 7.7 |
| Apr 2018 | • | 22 | 8.2 | - | - | 8.5 | 7.8 |
| May 2018 | • | 21 | 7.8 | - | - | 8.3 | 7.7 |
| Jun 2018 | • | 19 | 7.1 | - | - | 8.3 | 7.6 |
| Jul 2018 | • | 18 | 6.7 | - | - | 8.0 | 7.6 |
| Aug 2018 | • | 20 | 7.5 | - | - | 8.3 | 7.6 |
| Sep 2018 | • | 18 | 6.7 | - | - | 8.2 | 7.6 |
| Oct 2018 | • | 17 | 6.3 | - | - | 8.0 | 7.6 |
| Nov 2018 | • | 18 | 6.7 | - | - | 8.0 | 7.5 |
| Dec 2018 | • | 21 | 7.8 | - | - | 8.5 | 7.5 |
| Jan 2019 | • | 24 | 8.9 | - | - | 8.7 | 7.5 |
| Feb 2019 | • | 22 | 8.2 | - | - | 8.4 | 7.5 |
| Mar 2019 | • | 22 | 8.2 | - | - | 8.5 | 7.5 |
| Apr 2019 | • | 23 | 8.6 | - | - | 8.3 | 7.5 |
| May 2019 | • | 24 | 8.9 | - | - | 8.6 | 7.6 |
| Jun 2019 | • | 25 | 9.3 | - | - | 9.5 | 7.6 |
| Jul 2019 | • | 27 | 10.1 | - | - | 10.5 | 7.7 |
| Aug 2019 | • | 24 | 8.9 | - | - | 10.6 | 7.7 |
| Sep 2019 | • | 26 | 9.7 | - | - | 10.2 | 7.7 |
| Oct 2019 | • | 28 | 10.4 | - | - | 10.2 | 7.6 |
| Nov 2019 | • | 28 | 10.4 | - | - | 10.2 | 7.7 |
| Dec 2019 | • | 26 | 9.7 | - | - | 10.0 | 7.7 |
| Jan 2020 | • | 25 | 9.3 | - | - | 9.8 | 7.7 |
| Feb 2020 | • | 26 | 9.7 | - | - | 9.7 | 7.8 |
| Mar 2020 | • | 26 | 9.7 | - | - | 9.7 | 7.7 |
| Apr 2020 | • | 24 | 8.9 | - | - | 9.7 | 7.7 |
| May 2020 | • | 24 | 8.9 | - | - | 9.3 | 7.5 |
| Jun 2020 | • | 24 | 8.9 | - | - | 8.4 | 7.4 |
| Jul 2020 | • | 22 | 8.2 | - | - | 7.8 | 7.4 |
| Aug 2020 | • | 25 | 9.3 | - | - | 7.5 | 7.3 |
| Sep 2020 | • | 24 | 8.9 | - | - | 7.8 | 7.4 |
| Oct 2020 | • | 21 | 7.8 | - | - | 7.2 | 7.4 |
| Nov 2020 | • | 20 | 7.5 | - | - | 7.3 | 7.4 |
| Dec 2020 | • | 20 | 7.5 | - | - | 7.1 | 7.4 |
| Jan 2021 | • | 19 | 7.1 | - | - | 7.0 | 7.5 |
| Feb 2021 | • | 20 | 7.5 | - | - | 7.2 | 7.5 |
| Mar 2021 | • | 20 | 7.5 | - | - | 7.3 | 7.6 |
| Apr 2021 | • | 22 | 8.2 | - | - | 7.6 | 7.7 |
| May 2021 | • | 22 | 8.2 | - | - | 8.0 | 7.7 |
| Jun 2021 | • | 22 | 8.2 | - | - | 8.0 | 7.8 |
| Jul 2021 | • | 22 | 8.2 | - | - | 8.0 | 7.8 |
| Aug 2021 | • | 20 | 7.5 | - | - | 8.3 | 7.9 |
| Sep 2021 | • | 18 | 6.7 | - | - | 8.0 | 7.9 |
| Oct 2021 | • | 22 | 8.2 | - | - | 9.1 | 8.0 |
| Nov 2021 | • | 21 | 7.9 | - | - | 8.9 | 7.9 |
| Dec 2021 | • | 21 | 7.9 | - | - | 9.0 | 7.9 |
| Jan 2022 | • | 20 | 7.5 | - | - | 9.1 | 7.8 |
| Feb 2022 | • | 19 | 7.1 | - | - | 9.2 | 7.7 |
| Mar 2022 | • | 18 | 6.7 | - | - | 9.3 | 7.7 |
| Apr 2022 | • | 16 | 6.0 | - | - | 9.2 | 7.6 |
| May 2022 | • | 18 | 6.7 | - | - | 9.4 | 7.7 |
| Jun 2022 | • | 17 | 6.3 | - | - | 9.4 | 7.7 |
| Jul 2022 | • | 17 | 6.3 | - | - | 9.1 | 7.6 |
| Aug 2022 | • | 17 | 6.3 | - | - | 9.0 | 7.5 |
| Sep 2022 | • | 16 | 6.0 | - | - | 8.7 | 7.5 |
| Oct 2022 | • | 15 | 5.6 | - | - | 8.2 | 7.5 |
| Nov 2022 | • | 18 | 6.7 | - | - | 8.4 | 7.6 |
| Dec 2022 | • | 22 | 8.2 | - | - | 9.1 | 7.6 |
| Jan 2023 | • | 24 | 8.9 | - | - | 9.1 | 7.6 |
| Feb 2023 | • | 25 | 9.3 | - | - | 9.0 | 7.7 |
| Mar 2023 | • | 25 | 9.3 | - | - | 8.6 | 7.7 |
| Apr 2023 | • | 27 | 10.0 | - | - | 8.5 | 7.8 |
| May 2023 | • | 26 | 9.6 | - | - | 8.5 | 7.8 |
| Jun 2023 | • | 28 | 10.3 | - | - | 8.6 | 7.8 |
| Jul 2023 | • | 31 | 11.4 | - | - | 8.7 | 7.8 |
| Aug 2023 | • | 30 | 11.1 | - | - | 8.7 | 7.8 |
| Sep 2023 | • | 32 | 11.8 | - | - | 8.9 | 7.7 |
| Oct 2023 | • | 29 | 10.7 | - | - | 8.8 | 7.7 |
| Nov 2023 | • | 27 | 9.9 | - | - | 8.4 | 7.7 |
| Dec 2023 | • | 23 | 8.4 | - | - | 7.7 | 7.7 |
| Jan 2024 | • | 24 | 8.8 | - | - | 7.9 | 7.6 |
| Feb 2024 | • | 23 | 8.4 | - | - | 7.9 | 7.7 |
| Mar 2024 | • | 27 | 9.8 | - | - | 8.3 | 7.7 |
| Apr 2024 | • | 28 | 10.2 | - | - | 8.6 | 7.7 |
| May 2024 | • | 26 | 9.5 | - | - | 8.3 | 7.6 |
| Jun 2024 | • | 25 | 9.1 | - | - | 8.4 | 7.7 |
| Jul 2024 | • | 24 | 8.7 | - | - | 8.8 | 7.7 |
| Aug 2024 | • | 24 | 8.7 | - | - | 9.0 | 7.7 |
| Sep 2024 | • | 24 | 8.7 | - | - | 9.3 | 7.7 |
| Oct 2024 | • | 25 | 9.1 | - | - | 9.4 | 7.8 |
| Nov 2024 | • | 25 | 9.1 | - | - | 9.3 | 7.8 |
| Dec 2024 | • | 29 | 10.5 | - | - | 9.7 | 7.8 |
| Jan 2025 | • | 28 | 10.2 | - | - | 9.2 | 7.8 |
| Feb 2025 | • | 27 | 9.8 | - | - | 9.1 | 7.6 |
| Mar 2025 | • | 23 | 8.4 | - | - | 9.1 | 7.6 |
| Apr 2025 | • | 21 | 7.6 | - | - | 8.8 | 7.7 |
| May 2025 | • | 20 | 7.3 | - | - | 8.4 | 7.6 |
| Jun 2025 | • | 21 | 7.6 | - | - | 8.1 | 7.6 |
| Jul 2025 | • | 22 | 8.0 | - | - | 8.4 | 7.7 |
| Aug 2025 | • | 21 | 7.6 | - | - | 8.7 | 7.7 |
| Sep 2025 | • | 22 | 8.0 | - | - | 8.8 | 7.8 |
| Oct 2025 | • | 21 | 7.6 | - | - | 8.8 | 7.7 |
| Nov 2025 | • | 23 | 8.4 | - | - | 9.0 | 7.8 |
| Dec 2025 | • | 19 | 6.9 | - | - | 8.9 | 7.9 |
| Jan 2026 | • | 17 | 6.2 | - | - | 9.1 | 7.9 |
| Feb 2026 | • | 18 | 6.5 | - | - | 9.0 | 8.0 |
| Mar 2026 | • | 19 | 6.9 | - | - | 9.0 | 8.1 |
| Apr 2026 | • | 20 | 7.3 | - | - | 8.9 | 8.0 |
Source: UK Health Security Agency
There were no cases of hospital-onset P. aeruginosa infections in Hull recorded from early 2014 to mid-2017 and then remaining relatively constant since then at around 2-4 cases per 100,000 population. Again, it is possible that this increase is due to better testing, detection and/or recording of P. aeruginosa infections over time.
The rate in Hull has been much more variable compared to England but the infection rate has been slightly higher in Hull for more months than it has been lower.
The highest number of cases recorded in Hull has been 5.2 cases per 100,000 population (or 14 cases in total) which was relatively recently for the period January 2024 to December 2024. The rate in Hull is 3.7 per 100,000 population for the most recent period November 2024 to October 2025.
In the latest year period from November 2024 to October 2025, there has been 10 cases of hospital-onset P. aeruginosa. So the numbers are relatively small.
Compared with benchmark
Better
Similar
Worse
Not Compared
Lower
Similar
Higher
P. aeruginosa bacteraemia 12-month rolling case counts and rates of hospital-onset, by Sub ICB Location (SICBL) and month (Persons All ages)
|
Period
|
Humber and North Yorkshire ICB - 03F |
NHS Humber and North Yorkshire Integrated Care Board - QOQ
|
England
|
||||
|---|---|---|---|---|---|---|---|
|
Count
|
Value
|
95%
Lower CI |
95%
Upper CI |
||||
| Dec 2014 | • | - | 0.0 | - | - | 0.0 | 0.0 |
| Jan 2015 | • | - | 0.0 | - | - | 0.0 | 0.0 |
| Feb 2015 | • | - | 0.0 | - | - | 0.0 | 0.0 |
| Mar 2015 | • | - | 0.0 | - | - | 0.0 | 0.0 |
| Apr 2015 | • | - | 0.0 | - | - | 0.0 | 0.0 |
| May 2015 | • | - | 0.0 | - | - | 0.0 | 0.0 |
| Jun 2015 | • | - | 0.0 | - | - | 0.0 | 0.0 |
| Jul 2015 | • | - | 0.0 | - | - | 0.0 | 0.0 |
| Aug 2015 | • | - | 0.0 | - | - | 0.0 | 0.0 |
| Sep 2015 | • | - | 0.0 | - | - | 0.0 | 0.0 |
| Oct 2015 | • | - | 0.0 | - | - | 0.0 | 0.0 |
| Nov 2015 | • | - | 0.0 | - | - | 0.0 | 0.0 |
| Dec 2015 | • | - | 0.0 | - | - | 0.0 | 0.0 |
| Jan 2016 | • | - | 0.0 | - | - | 0.0 | 0.0 |
| Feb 2016 | • | - | 0.0 | - | - | 0.0 | 0.0 |
| Mar 2016 | • | - | 0.0 | - | - | 0.0 | 0.0 |
| Apr 2016 | • | - | 0.0 | - | - | 0.0 | 0.0 |
| May 2016 | • | - | 0.0 | - | - | 0.0 | 0.0 |
| Jun 2016 | • | - | 0.0 | - | - | 0.0 | 0.0 |
| Jul 2016 | • | - | 0.0 | - | - | 0.0 | 0.0 |
| Aug 2016 | • | - | 0.0 | - | - | 0.0 | 0.0 |
| Sep 2016 | • | - | 0.0 | - | - | 0.0 | 0.0 |
| Oct 2016 | • | - | 0.0 | - | - | 0.0 | 0.0 |
| Nov 2016 | • | - | 0.0 | - | - | 0.0 | 0.0 |
| Dec 2016 | • | - | 0.0 | - | - | 0.0 | 0.0 |
| Jan 2017 | • | - | 0.0 | - | - | 0.0 | 0.0 |
| Feb 2017 | • | - | 0.0 | - | - | 0.0 | 0.0 |
| Mar 2017 | • | - | 0.0 | - | - | 0.0 | 0.0 |
| Apr 2017 | • | - | 0.0 | - | - | 0.1 | 0.2 |
| May 2017 | • | 1 | 0.4 | - | - | 0.6 | 0.4 |
| Jun 2017 | • | 3 | 1.1 | - | - | 1.0 | 0.7 |
| Jul 2017 | • | 4 | 1.5 | - | - | 1.4 | 0.9 |
| Aug 2017 | • | 5 | 1.9 | - | - | 1.5 | 1.2 |
| Sep 2017 | • | 8 | 3.0 | - | - | 2.0 | 1.4 |
| Oct 2017 | • | 8 | 3.0 | - | - | 2.3 | 1.7 |
| Nov 2017 | • | 8 | 3.0 | - | - | 2.6 | 2.0 |
| Dec 2017 | • | 8 | 3.0 | - | - | 2.7 | 2.2 |
| Jan 2018 | • | 8 | 3.0 | - | - | 3.1 | 2.5 |
| Feb 2018 | • | 9 | 3.4 | - | - | 3.4 | 2.7 |
| Mar 2018 | • | 9 | 3.4 | - | - | 3.6 | 2.9 |
| Apr 2018 | • | 9 | 3.4 | - | - | 3.7 | 3.0 |
| May 2018 | • | 9 | 3.4 | - | - | 3.4 | 2.9 |
| Jun 2018 | • | 8 | 3.0 | - | - | 3.1 | 2.9 |
| Jul 2018 | • | 7 | 2.6 | - | - | 2.9 | 2.9 |
| Aug 2018 | • | 7 | 2.6 | - | - | 3.0 | 2.8 |
| Sep 2018 | • | 5 | 1.9 | - | - | 3.2 | 2.9 |
| Oct 2018 | • | 5 | 1.9 | - | - | 3.3 | 2.9 |
| Nov 2018 | • | 5 | 1.9 | - | - | 3.1 | 2.8 |
| Dec 2018 | • | 7 | 2.6 | - | - | 3.3 | 2.8 |
| Jan 2019 | • | 7 | 2.6 | - | - | 3.1 | 2.8 |
| Feb 2019 | • | 6 | 2.2 | - | - | 3.1 | 2.7 |
| Mar 2019 | • | 6 | 2.2 | - | - | 3.2 | 2.7 |
| Apr 2019 | • | 7 | 2.6 | - | - | 3.1 | 2.7 |
| May 2019 | • | 7 | 2.6 | - | - | 3.4 | 2.8 |
| Jun 2019 | • | 6 | 2.2 | - | - | 3.6 | 2.8 |
| Jul 2019 | • | 8 | 3.0 | - | - | 3.7 | 2.8 |
| Aug 2019 | • | 7 | 2.6 | - | - | 3.6 | 2.8 |
| Sep 2019 | • | 8 | 3.0 | - | - | 3.3 | 2.8 |
| Oct 2019 | • | 10 | 3.7 | - | - | 3.4 | 2.7 |
| Nov 2019 | • | 12 | 4.5 | - | - | 3.5 | 2.8 |
| Dec 2019 | • | 10 | 3.7 | - | - | 3.6 | 2.8 |
| Jan 2020 | • | 10 | 3.7 | - | - | 3.7 | 2.8 |
| Feb 2020 | • | 10 | 3.7 | - | - | 3.5 | 2.8 |
| Mar 2020 | • | 10 | 3.7 | - | - | 3.4 | 2.8 |
| Apr 2020 | • | 9 | 3.3 | - | - | 3.2 | 2.8 |
| May 2020 | • | 8 | 3.0 | - | - | 2.9 | 2.7 |
| Jun 2020 | • | 10 | 3.7 | - | - | 2.7 | 2.6 |
| Jul 2020 | • | 9 | 3.4 | - | - | 2.8 | 2.6 |
| Aug 2020 | • | 11 | 4.1 | - | - | 2.8 | 2.6 |
| Sep 2020 | • | 10 | 3.7 | - | - | 3.0 | 2.6 |
| Oct 2020 | • | 8 | 3.0 | - | - | 2.7 | 2.6 |
| Nov 2020 | • | 7 | 2.6 | - | - | 2.7 | 2.7 |
| Dec 2020 | • | 9 | 3.4 | - | - | 2.4 | 2.7 |
| Jan 2021 | • | 10 | 3.7 | - | - | 2.4 | 2.8 |
| Feb 2021 | • | 10 | 3.7 | - | - | 2.4 | 2.9 |
| Mar 2021 | • | 10 | 3.7 | - | - | 2.5 | 3.0 |
| Apr 2021 | • | 11 | 4.1 | - | - | 2.6 | 3.0 |
| May 2021 | • | 12 | 4.5 | - | - | 2.8 | 3.0 |
| Jun 2021 | • | 11 | 4.1 | - | - | 2.8 | 3.0 |
| Jul 2021 | • | 10 | 3.7 | - | - | 2.7 | 3.1 |
| Aug 2021 | • | 9 | 3.4 | - | - | 2.8 | 3.1 |
| Sep 2021 | • | 8 | 3.0 | - | - | 2.7 | 3.2 |
| Oct 2021 | • | 11 | 4.1 | - | - | 3.0 | 3.2 |
| Nov 2021 | • | 10 | 3.7 | - | - | 3.1 | 3.2 |
| Dec 2021 | • | 8 | 3.0 | - | - | 3.1 | 3.2 |
| Jan 2022 | • | 7 | 2.6 | - | - | 3.1 | 3.0 |
| Feb 2022 | • | 7 | 2.6 | - | - | 3.1 | 2.9 |
| Mar 2022 | • | 7 | 2.6 | - | - | 3.3 | 2.9 |
| Apr 2022 | • | 6 | 2.2 | - | - | 3.4 | 2.9 |
| May 2022 | • | 8 | 3.0 | - | - | 3.6 | 3.0 |
| Jun 2022 | • | 7 | 2.6 | - | - | 3.6 | 3.0 |
| Jul 2022 | • | 7 | 2.6 | - | - | 3.6 | 2.9 |
| Aug 2022 | • | 7 | 2.6 | - | - | 3.4 | 2.9 |
| Sep 2022 | • | 7 | 2.6 | - | - | 3.3 | 2.9 |
| Oct 2022 | • | 5 | 1.9 | - | - | 3.1 | 2.9 |
| Nov 2022 | • | 6 | 2.2 | - | - | 3.2 | 2.9 |
| Dec 2022 | • | 7 | 2.6 | - | - | 3.4 | 2.9 |
| Jan 2023 | • | 7 | 2.6 | - | - | 3.3 | 2.9 |
| Feb 2023 | • | 8 | 3.0 | - | - | 3.3 | 3.0 |
| Mar 2023 | • | 8 | 3.0 | - | - | 3.0 | 3.0 |
| Apr 2023 | • | 9 | 3.3 | - | - | 3.0 | 3.0 |
| May 2023 | • | 6 | 2.2 | - | - | 2.6 | 3.0 |
| Jun 2023 | • | 7 | 2.6 | - | - | 2.7 | 3.0 |
| Jul 2023 | • | 10 | 3.7 | - | - | 2.9 | 3.0 |
| Aug 2023 | • | 9 | 3.3 | - | - | 3.0 | 3.1 |
| Sep 2023 | • | 11 | 4.0 | - | - | 3.2 | 3.0 |
| Oct 2023 | • | 10 | 3.7 | - | - | 3.1 | 3.0 |
| Nov 2023 | • | 9 | 3.3 | - | - | 2.7 | 3.0 |
| Dec 2023 | • | 9 | 3.3 | - | - | 2.7 | 3.0 |
| Jan 2024 | • | 11 | 4.0 | - | - | 2.9 | 3.0 |
| Feb 2024 | • | 11 | 4.0 | - | - | 2.9 | 3.0 |
| Mar 2024 | • | 12 | 4.4 | - | - | 3.0 | 2.9 |
| Apr 2024 | • | 11 | 4.0 | - | - | 3.0 | 3.0 |
| May 2024 | • | 11 | 4.0 | - | - | 3.0 | 3.0 |
| Jun 2024 | • | 10 | 3.6 | - | - | 2.9 | 3.0 |
| Jul 2024 | • | 8 | 2.9 | - | - | 3.0 | 3.0 |
| Aug 2024 | • | 9 | 3.3 | - | - | 3.0 | 2.9 |
| Sep 2024 | • | 8 | 2.9 | - | - | 2.8 | 3.0 |
| Oct 2024 | • | 9 | 3.3 | - | - | 3.1 | 3.0 |
| Nov 2024 | • | 9 | 3.3 | - | - | 3.0 | 3.0 |
| Dec 2024 | • | 14 | 5.1 | - | - | 3.2 | 3.0 |
| Jan 2025 | • | 13 | 4.7 | - | - | 2.9 | 3.0 |
| Feb 2025 | • | 12 | 4.4 | - | - | 2.9 | 2.9 |
| Mar 2025 | • | 11 | 4.0 | - | - | 3.0 | 3.0 |
| Apr 2025 | • | 11 | 4.0 | - | - | 2.9 | 2.9 |
| May 2025 | • | 11 | 4.0 | - | - | 2.7 | 2.9 |
| Jun 2025 | • | 11 | 4.0 | - | - | 2.5 | 2.9 |
| Jul 2025 | • | 11 | 4.0 | - | - | 2.5 | 2.9 |
| Aug 2025 | • | 10 | 3.6 | - | - | 2.6 | 2.9 |
| Sep 2025 | • | 11 | 4.0 | - | - | 2.6 | 2.9 |
| Oct 2025 | • | 10 | 3.6 | - | - | 2.5 | 2.8 |
| Nov 2025 | • | 11 | 4.0 | - | - | 2.7 | 2.9 |
| Dec 2025 | • | 7 | 2.5 | - | - | 2.7 | 2.9 |
| Jan 2026 | • | 6 | 2.2 | - | - | 2.7 | 2.9 |
| Feb 2026 | • | 6 | 2.2 | - | - | 2.8 | 2.9 |
| Mar 2026 | • | 7 | 2.5 | - | - | 2.6 | 2.9 |
| Apr 2026 | • | 8 | 2.9 | - | - | 2.6 | 2.9 |
Source: UK Health Security Agency
The community-onset cases of P. aeruginosa also increased substantially from April 2017 to February 2018 possibly due to better testing, detection and/or recording of P. aeruginosa infections over time. Since February 2018, the rate in England has remained relatively constant at just under five cases per 100,000 population, whereas there has been much greater variability in the number of cases in Hull.
The highest number of cases recorded in Hull as 21 giving a rate of 7.8 cases per 100,000 population for the year July 2022 to June 2023 (next four months has the same number and rate of infections recorded).
For the latest period November 2024 to October 2025, there have been 4.1cases per 100,000 population.
Over the November 2024 to October 2025 financial year, there were 11 cases of P. aeruginosa in Hull that were community-onset cases. So the numbers are relatively small.
Compared with benchmark
Better
Similar
Worse
Not Compared
Lower
Similar
Higher
P. aeruginosa bacteraemia 12-month rolling case counts and rates of community-onset, by Sub ICB Location (SICBL) and month (Persons All ages)
|
Period
|
Humber and North Yorkshire ICB - 03F |
NHS Humber and North Yorkshire Integrated Care Board - QOQ
|
England
|
||||
|---|---|---|---|---|---|---|---|
|
Count
|
Value
|
95%
Lower CI |
95%
Upper CI |
||||
| Apr 2017 | • | 2 | 0.8 | - | - | 0.6 | 0.4 |
| May 2017 | • | 3 | 1.1 | - | - | 0.9 | 0.7 |
| Jun 2017 | • | 4 | 1.5 | - | - | 1.0 | 1.2 |
| Jul 2017 | • | 5 | 1.9 | - | - | 1.4 | 1.6 |
| Aug 2017 | • | 6 | 2.3 | - | - | 1.7 | 2.1 |
| Sep 2017 | • | 7 | 2.6 | - | - | 2.5 | 2.5 |
| Oct 2017 | • | 10 | 3.7 | - | - | 3.4 | 3.0 |
| Nov 2017 | • | 11 | 4.1 | - | - | 3.8 | 3.4 |
| Dec 2017 | • | 12 | 4.5 | - | - | 4.0 | 3.8 |
| Jan 2018 | • | 12 | 4.5 | - | - | 4.3 | 4.2 |
| Feb 2018 | • | 13 | 4.9 | - | - | 4.8 | 4.5 |
| Mar 2018 | • | 14 | 5.2 | - | - | 5.1 | 4.8 |
| Apr 2018 | • | 13 | 4.9 | - | - | 4.9 | 4.8 |
| May 2018 | • | 12 | 4.5 | - | - | 4.9 | 4.8 |
| Jun 2018 | • | 11 | 4.1 | - | - | 5.2 | 4.8 |
| Jul 2018 | • | 11 | 4.1 | - | - | 5.1 | 4.8 |
| Aug 2018 | • | 13 | 4.9 | - | - | 5.3 | 4.7 |
| Sep 2018 | • | 13 | 4.9 | - | - | 5.0 | 4.8 |
| Oct 2018 | • | 12 | 4.5 | - | - | 4.7 | 4.7 |
| Nov 2018 | • | 13 | 4.8 | - | - | 4.9 | 4.7 |
| Dec 2018 | • | 14 | 5.2 | - | - | 5.1 | 4.7 |
| Jan 2019 | • | 17 | 6.3 | - | - | 5.6 | 4.7 |
| Feb 2019 | • | 16 | 6.0 | - | - | 5.3 | 4.7 |
| Mar 2019 | • | 16 | 6.0 | - | - | 5.3 | 4.8 |
| Apr 2019 | • | 16 | 6.0 | - | - | 5.2 | 4.8 |
| May 2019 | • | 17 | 6.3 | - | - | 5.3 | 4.8 |
| Jun 2019 | • | 19 | 7.1 | - | - | 5.9 | 4.9 |
| Jul 2019 | • | 19 | 7.1 | - | - | 6.7 | 4.9 |
| Aug 2019 | • | 17 | 6.3 | - | - | 7.0 | 4.9 |
| Sep 2019 | • | 18 | 6.7 | - | - | 6.9 | 4.9 |
| Oct 2019 | • | 18 | 6.7 | - | - | 6.8 | 4.9 |
| Nov 2019 | • | 16 | 6.0 | - | - | 6.6 | 4.9 |
| Dec 2019 | • | 16 | 6.0 | - | - | 6.4 | 4.9 |
| Jan 2020 | • | 15 | 5.6 | - | - | 6.1 | 4.9 |
| Feb 2020 | • | 16 | 5.9 | - | - | 6.2 | 5.0 |
| Mar 2020 | • | 16 | 5.9 | - | - | 6.4 | 4.9 |
| Apr 2020 | • | 15 | 5.6 | - | - | 6.4 | 4.9 |
| May 2020 | • | 16 | 6.0 | - | - | 6.4 | 4.8 |
| Jun 2020 | • | 14 | 5.2 | - | - | 5.7 | 4.8 |
| Jul 2020 | • | 13 | 4.8 | - | - | 5.1 | 4.8 |
| Aug 2020 | • | 14 | 5.2 | - | - | 4.7 | 4.7 |
| Sep 2020 | • | 14 | 5.2 | - | - | 4.8 | 4.8 |
| Oct 2020 | • | 13 | 4.8 | - | - | 4.5 | 4.8 |
| Nov 2020 | • | 13 | 4.9 | - | - | 4.7 | 4.8 |
| Dec 2020 | • | 11 | 4.1 | - | - | 4.7 | 4.7 |
| Jan 2021 | • | 9 | 3.4 | - | - | 4.6 | 4.7 |
| Feb 2021 | • | 10 | 3.7 | - | - | 4.8 | 4.6 |
| Mar 2021 | • | 10 | 3.7 | - | - | 4.8 | 4.7 |
| Apr 2021 | • | 11 | 4.1 | - | - | 5.0 | 4.7 |
| May 2021 | • | 10 | 3.7 | - | - | 5.1 | 4.7 |
| Jun 2021 | • | 11 | 4.1 | - | - | 5.2 | 4.8 |
| Jul 2021 | • | 12 | 4.5 | - | - | 5.3 | 4.8 |
| Aug 2021 | • | 11 | 4.1 | - | - | 5.4 | 4.8 |
| Sep 2021 | • | 10 | 3.7 | - | - | 5.3 | 4.7 |
| Oct 2021 | • | 11 | 4.1 | - | - | 6.1 | 4.8 |
| Nov 2021 | • | 11 | 4.1 | - | - | 5.8 | 4.8 |
| Dec 2021 | • | 13 | 4.9 | - | - | 5.9 | 4.7 |
| Jan 2022 | • | 13 | 4.9 | - | - | 6.1 | 4.8 |
| Feb 2022 | • | 12 | 4.5 | - | - | 6.2 | 4.8 |
| Mar 2022 | • | 11 | 4.1 | - | - | 6.0 | 4.8 |
| Apr 2022 | • | 10 | 3.7 | - | - | 5.8 | 4.7 |
| May 2022 | • | 10 | 3.7 | - | - | 5.7 | 4.7 |
| Jun 2022 | • | 10 | 3.7 | - | - | 5.7 | 4.7 |
| Jul 2022 | • | 10 | 3.7 | - | - | 5.6 | 4.7 |
| Aug 2022 | • | 10 | 3.7 | - | - | 5.6 | 4.7 |
| Sep 2022 | • | 9 | 3.4 | - | - | 5.4 | 4.6 |
| Oct 2022 | • | 10 | 3.7 | - | - | 5.1 | 4.6 |
| Nov 2022 | • | 12 | 4.5 | - | - | 5.2 | 4.7 |
| Dec 2022 | • | 15 | 5.6 | - | - | 5.7 | 4.7 |
| Jan 2023 | • | 17 | 6.3 | - | - | 5.9 | 4.7 |
| Feb 2023 | • | 17 | 6.3 | - | - | 5.7 | 4.7 |
| Mar 2023 | • | 17 | 6.3 | - | - | 5.6 | 4.7 |
| Apr 2023 | • | 18 | 6.7 | - | - | 5.6 | 4.8 |
| May 2023 | • | 20 | 7.4 | - | - | 5.9 | 4.8 |
| Jun 2023 | • | 21 | 7.8 | - | - | 5.9 | 4.8 |
| Jul 2023 | • | 21 | 7.7 | - | - | 5.8 | 4.8 |
| Aug 2023 | • | 21 | 7.7 | - | - | 5.7 | 4.7 |
| Sep 2023 | • | 21 | 7.7 | - | - | 5.7 | 4.7 |
| Oct 2023 | • | 19 | 7.0 | - | - | 5.7 | 4.7 |
| Nov 2023 | • | 18 | 6.6 | - | - | 5.7 | 4.7 |
| Dec 2023 | • | 14 | 5.1 | - | - | 5.1 | 4.7 |
| Jan 2024 | • | 13 | 4.8 | - | - | 5.0 | 4.7 |
| Feb 2024 | • | 12 | 4.4 | - | - | 5.0 | 4.7 |
| Mar 2024 | • | 15 | 5.5 | - | - | 5.3 | 4.7 |
| Apr 2024 | • | 17 | 6.2 | - | - | 5.6 | 4.7 |
| May 2024 | • | 15 | 5.5 | - | - | 5.3 | 4.7 |
| Jun 2024 | • | 15 | 5.5 | - | - | 5.5 | 4.7 |
| Jul 2024 | • | 16 | 5.8 | - | - | 5.8 | 4.7 |
| Aug 2024 | • | 15 | 5.5 | - | - | 6.0 | 4.7 |
| Sep 2024 | • | 16 | 5.8 | - | - | 6.5 | 4.8 |
| Oct 2024 | • | 16 | 5.8 | - | - | 6.3 | 4.8 |
| Nov 2024 | • | 16 | 5.8 | - | - | 6.4 | 4.8 |
| Dec 2024 | • | 15 | 5.4 | - | - | 6.5 | 4.8 |
| Jan 2025 | • | 15 | 5.4 | - | - | 6.3 | 4.8 |
| Feb 2025 | • | 15 | 5.5 | - | - | 6.2 | 4.7 |
| Mar 2025 | • | 12 | 4.4 | - | - | 6.1 | 4.7 |
| Apr 2025 | • | 10 | 3.6 | - | - | 6.0 | 4.7 |
| May 2025 | • | 9 | 3.3 | - | - | 5.6 | 4.7 |
| Jun 2025 | • | 10 | 3.6 | - | - | 5.6 | 4.7 |
| Jul 2025 | • | 11 | 4.0 | - | - | 5.9 | 4.8 |
| Aug 2025 | • | 11 | 4.0 | - | - | 6.1 | 4.8 |
| Sep 2025 | • | 11 | 4.0 | - | - | 6.1 | 4.9 |
| Oct 2025 | • | 11 | 4.0 | - | - | 6.3 | 4.9 |
| Nov 2025 | • | 12 | 4.4 | - | - | 6.3 | 5.0 |
| Dec 2025 | • | 12 | 4.4 | - | - | 6.2 | 5.0 |
| Jan 2026 | • | 11 | 4.0 | - | - | 6.3 | 5.0 |
| Feb 2026 | • | 12 | 4.4 | - | - | 6.2 | 5.1 |
| Mar 2026 | • | 12 | 4.4 | - | - | 6.4 | 5.1 |
| Apr 2026 | • | 12 | 4.4 | - | - | 6.3 | 5.1 |
Source: UK Health Security Agency
Tuberculosis (TB)
The incidence (new cases) of tuberculosis (TB) for the three years 2022-24 is lower in Hull compared to England (7.2 versus 8.5 new cases per 100,000 population).
Compared with benchmark
Better
Similar
Worse
Not Compared
Lower
Similar
Higher
| Indicator | Period | England | Yorkshire and the Humber region (statistical) | Kingston upon Hull | East Riding of Yorkshire | North East Lincolnshire | North Lincolnshire | York | Barnsley | Doncaster | Rotherham | Sheffield | Bradford | Calderdale | Kirklees | Leeds | Wakefield | North Yorkshire Cty |
|---|---|---|---|---|---|---|---|---|---|---|---|---|---|---|---|---|---|---|
TB incidence (three year average) (Persons All ages) | 2022 - 24 | 8.5 | 6.4 | 7.2 | 2.4 | 2.3 | 4.3 | 3.1 | 3.3 | 7.1 | 3.4 | 8.8 | 14.4 | 5.1 | 8.9 | 8.3 | 2.6 | - |
| Indicator | Period | England | Yorkshire and the Humber region (statistical) | Kingston upon Hull | East Riding of Yorkshire | North East Lincolnshire | North Lincolnshire | York | Barnsley | Doncaster | Rotherham | Sheffield | Bradford | Calderdale | Kirklees | Leeds | Wakefield | North Yorkshire Cty |
|---|---|---|---|---|---|---|---|---|---|---|---|---|---|---|---|---|---|---|
TB incidence (three year average) (Persons All ages) | 2022 - 24 | 8.5 | 6.4 | 7.2 | 2.4 | 2.3 | 4.3 | 3.1 | 3.3 | 7.1 | 3.4 | 8.8 | 14.4 | 5.1 | 8.9 | 8.3 | 2.6 | - |
The number of new cases of TB in Hull was around five per 100,000 population for the three year period 2001-03, but gradually increased to a high of 8.8 new cases per 100,000 population for 2010-12. The rate subsequently decreased to 5.9 new cases per 100,000 population for 2015-17, but increased to 7.5 new cases per 100,000 population for 2019-21. There has been a small reduction since then, with 7.2 new cases per 100,000 population for the three year period 2022-24.
The incidence rate had been statistically significantly lower in Hull compared to England prior to 2018-20, but for the last six years 2017-19 to 2022-24, the incidence rate had been comparable to England (no statistically significant difference).
Compared with benchmark
Better
Similar
Worse
Not Compared
Lower
Similar
Higher
TB incidence (three year average) (Persons All ages)
|
Period
|
Kingston upon Hull |
Yorkshire and the Humber region (statistical)
|
England
|
||||
|---|---|---|---|---|---|---|---|
|
Count
|
Value
|
95%
Lower CI |
95%
Upper CI |
||||
| 2001 - 03 | • | 38 | 5.1 | 3.6 | 6.9 | 10.7 | 13.1 |
| 2002 - 04 | • | 43 | 5.7 | 4.2 | 7.6 | 10.5 | 13.5 |
| 2003 - 05 | • | 36 | 4.7 | 3.4 | 6.5 | 10.8 | 14.1 |
| 2004 - 06 | • | 38 | 5.0 | 3.6 | 6.8 | 11.5 | 14.7 |
| 2005 - 07 | • | 40 | 5.2 | 3.8 | 7.0 | 12.0 | 15.0 |
| 2006 - 08 | • | 45 | 5.9 | 4.3 | 7.8 | 12.4 | 15.0 |
| 2007 - 09 | • | 37 | 4.8 | 3.4 | 6.6 | 12.5 | 15.1 |
| 2008 - 10 | • | 40 | 5.2 | 3.8 | 7.0 | 12.5 | 15.1 |
| 2009 - 11 | • | 52 | 6.8 | 5.1 | 8.8 | 12.6 | 15.2 |
| 2010 - 12 | • | 68 | 8.8 | 6.9 | 11.1 | 11.9 | 15.1 |
| 2011 - 13 | • | 65 | 8.4 | 6.5 | 10.6 | 11.6 | 14.7 |
| 2012 - 14 | • | 59 | 7.6 | 5.8 | 9.7 | 10.6 | 13.5 |
| 2013 - 15 | • | 51 | 6.5 | 4.9 | 8.5 | 9.6 | 11.9 |
| 2014 - 16 | • | 48 | 6.1 | 4.5 | 8.0 | 8.5 | 10.8 |
| 2015 - 17 | • | 47 | 5.9 | 4.4 | 7.8 | 7.4 | 9.9 |
| 2016 - 18 | • | 49 | 6.1 | 4.6 | 8.0 | 6.9 | 9.2 |
| 2017 - 19 | • | 54 | 6.7 | 5.1 | 8.7 | 6.4 | 8.6 |
| 2018 - 20 | • | 59 | 7.3 | 5.6 | 9.4 | 6.1 | 8.0 |
| 2019 - 21 | • | 60 | 7.5 | 5.8 | 9.6 | 5.9 | 7.8 |
| 2020 - 22 | • | 56 | 7.0 | 5.3 | 9.0 | 5.5 | 7.6 |
| 2021 - 23 | • | 52 | 6.4 | 4.9 | 8.4 | 5.9 | 7.9 |
| 2022 - 24 | • | 59 | 7.2 | 5.6 | 9.2 | 6.4 | 8.5 |
Source: UK Health Security Agency and Office for National Statistics
65% of drug sensitive TB notification cases had the full treatment course in 2023 in Hull compared to 84% for England. The rate in Hull was the lowest across the region, although data was not available for all local authorities.
The numbers of drug sensitive TB notifications are small which means that there is considerable year-on-year variability (see Small Numbers in the Glossary for more information.).
Compared with benchmark
Better
Similar
Worse
Not Compared
Lower
Similar
Higher
| Indicator | Period | England | Yorkshire and the Humber region (statistical) | Kingston upon Hull | East Riding of Yorkshire | North East Lincolnshire | North Lincolnshire | York | Barnsley | Doncaster | Rotherham | Sheffield | Bradford | Calderdale | Kirklees | Leeds | Wakefield | North Yorkshire Cty |
|---|---|---|---|---|---|---|---|---|---|---|---|---|---|---|---|---|---|---|
Proportion of drug sensitive TB notifications who had completed a full course of treatment by 12 months (Persons All ages) | 2023 | 84.4 | 80.2 | 64.7 | 83.3 | - | 71.4 | - | 100 | 91.7 | 77.8 | 93.5 | 80.5 | 75.0 | 94.6 | 77.2 | 66.7 | - |
| Indicator | Period | England | Yorkshire and the Humber region (statistical) | Kingston upon Hull | East Riding of Yorkshire | North East Lincolnshire | North Lincolnshire | York | Barnsley | Doncaster | Rotherham | Sheffield | Bradford | Calderdale | Kirklees | Leeds | Wakefield | North Yorkshire Cty |
|---|---|---|---|---|---|---|---|---|---|---|---|---|---|---|---|---|---|---|
Proportion of drug sensitive TB notifications who had completed a full course of treatment by 12 months (Persons All ages) | 2023 | 84.4 | 80.2 | 64.7 | 83.3 | - | 71.4 | - | 100 | 91.7 | 77.8 | 93.5 | 80.5 | 75.0 | 94.6 | 77.2 | 66.7 | - |
During 2023, 11 of the 17 people with drug sensitive TB had completed their full treatment within 12 months in Hull. However, with the relatively small number of drug sensitive TB notifications, there is considerable year-on-year variability in the percentages completing full treatment. In general, the treatment completion rates have been comparable to England with no statistically significant differences, but there have been four years in the last 21 years where the percentages have been statistically significantly lower in Hull compared to England including 2020 and 2021.
The percentage of people with drug sensitive TB who had completed their full treatment within 12 months has ranged from 35% to 100% in Hull over the 23 year period. Across England, the percentage gradually increased from 65% in 2001 to 87% for 2013, before decreasing to 84% for 2023.
In the last ten years or so, the rate in Hull was comparable or slightly higher than England with the exception of 2015, 2020 and 2021 when the rate was much lower in Hull. The numbers are very small in Hull though. In the last four years, the percentage in Hull has been statistically significantly lower than England for two of those four years despite the small numbers. In 2021, seven out of 17 completed their full course of treatment, as did 9 out of 13 in 2022 and 11 out of 17 in 2023, meaning a total of 20 out of 47 (43%) did not complete the full course of treatment over those three years.
Compared with benchmark
Better
Similar
Worse
Not Compared
Lower
Similar
Higher
Proportion of drug sensitive TB notifications who had completed a full course of treatment by 12 months (Persons All ages)
|
Period
|
Kingston upon Hull |
Yorkshire and the Humber region (statistical)
|
England
|
||||
|---|---|---|---|---|---|---|---|
|
Count
|
Value
|
95%
Lower CI |
95%
Upper CI |
||||
| 2001 | • | 5 | 71.4% | 30.3% | 94.9% | 78.5% | 65.0% |
| 2002 | • | 10 | 71.4% | 42.0% | 90.4% | 78.5% | 69.6% |
| 2003 | • | 12 | 80.0% | 51.4% | 94.7% | 80.9% | 72.5% |
| 2004 | • | 10 | 76.9% | 46.0% | 93.8% | 64.9% | 73.6% |
| 2006 | • | 11 | 73.3% | 44.8% | 91.1% | 77.3% | 79.8% |
| 2007 | • | 10 | 71.4% | 42.0% | 90.4% | 76.5% | 82.6% |
| 2008 | • | 9 | 75.0% | 42.8% | 93.3% | 80.4% | 84.7% |
| 2009 | • | 4 | 57.1% | 20.2% | 88.2% | 81.2% | 85.7% |
| 2010 | • | 11 | 64.7% | 38.6% | 84.7% | 81.5% | 86.6% |
| 2011 | • | 17 | 73.9% | 51.3% | 88.9% | 78.1% | 86.6% |
| 2012 | • | 22 | 100% | 81.5% | 100% | 87.4% | 87.8% |
| 2013 | • | 13 | 100% | 71.7% | 100% | 89.1% | 87.2% |
| 2014 | • | 14 | 87.5% | 60.4% | 97.8% | 89.2% | 86.4% |
| 2015 | • | 7 | 53.8% | 26.1% | 79.6% | 85.9% | 84.7% |
| 2016 | • | 10 | 76.9% | 46.0% | 93.8% | 88.3% | 85.5% |
| 2017 | • | 12 | 85.7% | 56.2% | 97.5% | 91.4% | 85.8% |
| 2018 | • | 17 | 89.5% | 65.5% | 98.2% | 90.1% | 85.2% |
| 2019 | • | 14 | 82.4% | 55.8% | 95.3% | 86.8% | 85.4% |
| 2020 | • | 11 | 57.9% | 34.0% | 78.9% | 80.3% | 85.1% |
| 2021 | • | 7 | 41.2% | 19.4% | 66.5% | 81.9% | 85.6% |
| 2022 | • | 9 | 69.2% | 38.9% | 89.6% | 86.6% | 84.5% |
| 2023 | • | 11 | 64.7% | 38.6% | 84.7% | 80.2% | 84.4% |
Source: UK Health Security Agency
Childhood Diseases
There is relatively limited information on the incidence of childhood diseases such as measles, mumps, rubella, etc, although some information relating to vaccinations of some conditions can be found within Vaccinations under Prevention for Adults, and within Screening and Vaccinations under Health Factors for Children and Young People.
COVID-19
Further information on Coronavirus (COVID-19) can be found under Health Factors within Adults.
Influenza
Further information on some other influenza can be found within Respiratory Diseases under Health Factors within Adults. Information relating to flu vaccinations can be found within Vaccinations under Prevention for Adults, and within Screening and Vaccinations under Health Factors for Children and Young People.
Sexually Transmitted Infections
Further information on Sexually Transmitted Infectious can be found under Health Factors within Adults.
Mortality from Communicable Diseases
For deaths registered during 2022-24, the directly standardised mortality rates for communicable diseases was slightly higher in Hull at 17.6 deaths per 100,000 population compared to 15.2 deaths per 100,000 population for England.
The measure includes deaths from certain infectious and parasitic diseases based on the International Classification of Diseases version 10 codes A00 to B99 as well as influenza (ICD10 codes J09-J11).
Compared with benchmark
Better
Similar
Worse
Not Compared
Lower
Similar
Higher
| Indicator | Period | England | Yorkshire and the Humber region (statistical) | Kingston upon Hull | East Riding of Yorkshire | North East Lincolnshire | North Lincolnshire | York | North Yorkshire UA | Barnsley | Doncaster | Rotherham | Sheffield | Bradford | Calderdale | Kirklees | Leeds | Wakefield |
|---|---|---|---|---|---|---|---|---|---|---|---|---|---|---|---|---|---|---|
Mortality rate from a range of specified communicable diseases, including influenza (Persons All ages) | 2022 - 24 | 15.2 | 16.1 | 17.6 | 12.7 | 8.5 | 14.6 | 16.7 | 13.8 | 17.9 | 14.8 | 18.4 | 16.6 | 14.7 | 17.2 | 17.9 | 18.6 | 20.4 |
| Indicator | Period | England | Yorkshire and the Humber region (statistical) | Kingston upon Hull | East Riding of Yorkshire | North East Lincolnshire | North Lincolnshire | York | North Yorkshire UA | Barnsley | Doncaster | Rotherham | Sheffield | Bradford | Calderdale | Kirklees | Leeds | Wakefield |
|---|---|---|---|---|---|---|---|---|---|---|---|---|---|---|---|---|---|---|
Mortality rate from a range of specified communicable diseases, including influenza (Persons All ages) | 2022 - 24 | 15.2 | 16.1 | 17.6 | 12.7 | 8.5 | 14.6 | 16.7 | 13.8 | 17.9 | 14.8 | 18.4 | 16.6 | 14.7 | 17.2 | 17.9 | 18.6 | 20.4 |
There were 113 deaths to Hull residents from communicable diseases that were registered within the three-year period 2022 to 2024. Between 2012-14 and 2020-22, there had been around 10-11 deaths per 100,000 population (slightly lower during the pandemic), so that latest rate represents an increase on the trends observed over the last decade or so.
Compared with benchmark
Better
Similar
Worse
Not Compared
Lower
Similar
Higher
Mortality rate from a range of specified communicable diseases, including influenza (Persons All ages)
|
Period
|
Kingston upon Hull |
Yorkshire and the Humber region (statistical)
|
England
|
||||
|---|---|---|---|---|---|---|---|
|
Count
|
Value
|
95%
Lower CI |
95%
Upper CI |
||||
| 2001 - 03 | • | 70 | 12.4 | 9.7 | 15.7 | 8.5 | 9.2 |
| 2002 - 04 | • | 71 | 13.1 | 10.2 | 16.5 | 8.8 | 9.6 |
| 2003 - 05 | • | 86 | 16.0 | 12.8 | 19.8 | 9.5 | 10.9 |
| 2004 - 06 | • | 90 | 16.5 | 13.3 | 20.4 | 10.0 | 12.9 |
| 2005 - 07 | • | 106 | 18.5 | 15.1 | 22.4 | 11.2 | 14.9 |
| 2006 - 08 | • | 93 | 16.1 | 12.9 | 19.8 | 12.1 | 14.9 |
| 2007 - 09 | • | 76 | 12.9 | 10.1 | 16.1 | 11.9 | 13.3 |
| 2008 - 10 | • | 55 | 9.2 | 6.9 | 12.0 | 10.3 | 10.9 |
| 2009 - 11 | • | 82 | 13.7 | 10.9 | 17.1 | 9.5 | 9.9 |
| 2010 - 12 | • | 89 | 14.8 | 11.8 | 18.2 | 9.2 | 9.1 |
| 2011 - 13 | • | 91 | 15.0 | 12.0 | 18.5 | 9.2 | 8.9 |
| 2012 - 14 | • | 65 | 10.7 | 8.2 | 13.7 | 8.2 | 8.5 |
| 2013 - 15 | • | 63 | 10.7 | 8.2 | 13.7 | 8.3 | 8.8 |
| 2014 - 16 | • | 67 | 11.5 | 8.9 | 14.6 | 8.5 | 9.0 |
| 2015 - 17 | • | 63 | 11.0 | 8.5 | 14.2 | 8.9 | 9.1 |
| 2016 - 18 | • | 66 | 11.0 | 8.5 | 14.0 | 9.5 | 9.6 |
| 2017 - 19 | • | 61 | 10.0 | 7.6 | 12.9 | 9.6 | 9.5 |
| 2018 - 20 | • | 59 | 9.3 | 7.0 | 12.0 | 9.4 | 9.4 |
| 2019 - 21 | • | 62 | 9.9 | 7.5 | 12.7 | 8.9 | 9.0 |
| 2020 - 22 | • | 73 | 11.5 | 9.0 | 14.4 | 10.4 | 10.3 |
| 2021 - 23 | • | 92 | 14.2 | 11.4 | 17.5 | 13.4 | 13.0 |
| 2022 - 24 | • | 113 | 17.6 | 14.5 | 21.2 | 16.1 | 15.2 |
Source: Office for Health Improvement and Disparities
From local data, the deaths from communicable diseases were mainly from bacteria diseases including those which resulted in sepsis with 38 deaths in total. Additionally, there were 14 deaths from intestinal infectious diseases, seven deaths from flu, and five deaths from viral hepatitis. The remaining nine deaths were from tuberculosis, viral infections, HIV, mycoses, sequelae (or consequence) of infectious and parasitic diseases, and other infectious diseases. There were a similar number of deaths for men (35) and women (38). Almost seven in ten of the deaths were among those aged 70+ years with 7, 10, 14 and 19 deaths among those aged 70-74, 75-79, 80-84 and 85+ years respectively. There were nine deaths among people aged 40-49 years, four deaths among those aged 50-59 years and six deaths among those aged 60-69 years.
The number of deaths registered each year from communicable disease has generally been around 22-27, but has been particularly high for some years such as 2007 when there was 45, 2011 when there was 57 and 2016 when there was 32. The higher numbers are generally due to a higher number of deaths from sepsis. There was only 16 deaths from communicable disease that were registered during 2020 which is associated with the COVID-19 pandemic as there was lower rates of social mixing, people wearing face masks and likely more people employing better hand hygiene habits. However, the number of deaths from communicable disease registered during 2022, 2023 and 2024 are relatively high with 33, 35 and 45 deaths respectively.
There have been relatively few deaths from influenza with five registered during 2018, six during 2019 and very few registered during 2020 and 2021 due to the pandemic. The numbers increased to five, 10 and 15 for 2022, 2023 and 2024 respectively with 18 already registered in 2025 (which includes most deaths which have been registered up to the middle of November 2024). Although flu deaths only made up around 21% of all communicable disease deaths in Hull in the last six years (2019 to 2024), they accounted for 27% of communicable disease deaths in the last three years (2022-24) without the impact of social distancing rules during the pandemic.
Antibiotic Prescribing in Primary Care
Reductions in antibiotic consumption is a well-recognised target in antimicrobial resistance (AMR) policies both nationally and internationally. Fingertips includes information on adjusted antibiotic prescribing in primary are by the NHS. The rates of antibiotic prescribing are adjusted to take into account the demographics of the population as this influences the levels of prescribing. The annual total number of prescribing antibiotic items per STAR PU (Specific Therapeutic group Age sex weightings Related Prescribing Units) are given. The information is presented as indirectly standardised ratios (see Indirectly Standardised Ratios within the Glossary for more information although for the case of antibiotic prescribing the comparison groups is not England as the ratio is not one for England but the ‘standard’ is related to the population in terms of the STAR PU).
For 2024, after adjusting for the age-sex structure of the population, there is a higher rate of antibiotic prescribing in Hull compared to England (0.90 versus 0.85 annual total items per STAR PU).
Compared with benchmark
Better
Similar
Worse
Not Compared
Lower
Similar
Higher
| Indicator | Period | England | Yorkshire and the Humber region (statistical) | Kingston upon Hull | East Riding of Yorkshire | North East Lincolnshire | North Lincolnshire | York | Barnsley | Doncaster | Rotherham | Sheffield | Bradford | Calderdale | Kirklees | Leeds | Wakefield | North Yorkshire Cty |
|---|---|---|---|---|---|---|---|---|---|---|---|---|---|---|---|---|---|---|
Adjusted antibiotic prescribing in primary care by the NHS (Persons All ages) | 2024 | 0.85 | 0.90 | 0.90 | 0.91 | 0.98 | 0.93 | 0.76 | 0.96 | 0.90 | 0.93 | 0.81 | 0.96 | 0.95 | 1.01 | 0.82 | 0.97 | - |
| Indicator | Period | England | Yorkshire and the Humber region (statistical) | Kingston upon Hull | East Riding of Yorkshire | North East Lincolnshire | North Lincolnshire | York | Barnsley | Doncaster | Rotherham | Sheffield | Bradford | Calderdale | Kirklees | Leeds | Wakefield | North Yorkshire Cty |
|---|---|---|---|---|---|---|---|---|---|---|---|---|---|---|---|---|---|---|
Adjusted antibiotic prescribing in primary care by the NHS (Persons All ages) | 2024 | 0.85 | 0.90 | 0.90 | 0.91 | 0.98 | 0.93 | 0.76 | 0.96 | 0.90 | 0.93 | 0.81 | 0.96 | 0.95 | 1.01 | 0.82 | 0.97 | - |
The annual total number of antibiotic items prescribed in primary care by the NHS has reduced in Hull from 1.22 to 0.90 units per STAR PU between 2015 and 2024. A reasonably similar rate of change has occurred for England. There was a decrease in 2020 and 2021, likely associated with the COVID-19 pandemic, but rates have increased since, although are at a lower level than the rates observed prior to the pandemic.
In 2015, the rate of antibiotic prescribing in primary are by the NHS after taking into account Hull’s population was 11% higher than England (1.22 versus 1.10 annual total items per STAR PU). This has reduced over time to 6% higher in Hull compared to England for 2024 (0.90 versus 0.85 annual total items per STAR PU).
Compared with benchmark
Better
Similar
Worse
Not Compared
Lower
Similar
Higher
Adjusted antibiotic prescribing in primary care by the NHS (Persons All ages)
|
Period
|
Kingston upon Hull |
Yorkshire and the Humber region (statistical)
|
England
|
||||
|---|---|---|---|---|---|---|---|
|
Count
|
Value
|
95%
Lower CI |
95%
Upper CI |
||||
| 2015 | • | 193737 | 1.22 | 1.21 | 1.23 | 1.15 | 1.10 |
| 2016 | • | 188910 | 1.18 | 1.17 | 1.18 | 1.12 | 1.08 |
| 2017 | • | 187134 | 1.16 | 1.16 | 1.17 | 1.09 | 1.04 |
| 2018 | • | 176767 | 1.09 | 1.08 | 1.09 | 1.03 | 0.99 |
| 2019 | • | 169722 | 1.04 | 1.03 | 1.04 | 1.00 | 0.95 |
| 2020 | • | 135982 | 0.83 | 0.82 | 0.83 | 0.81 | 0.75 |
| 2021 | • | 137250 | 0.83 | 0.83 | 0.84 | 0.81 | 0.74 |
| 2022 | • | 155162 | 0.93 | 0.93 | 0.94 | 0.93 | 0.87 |
| 2023 | • | 152411 | 0.90 | 0.90 | 0.91 | 0.94 | 0.88 |
| 2024 | • | 152915 | 0.90 | 0.90 | 0.90 | 0.90 | 0.85 |
Source: NHS England
Vaccinations For Infectious Diseases
Information relating to vaccinations of some infectious conditions can be found within Vaccinations under Prevention for Adults, and within Screening and Vaccinations under Health Factors for Children and Young People.
Strategic Need and Service Provision
Whilst effects from some infectious diseases can be relatively mild, some infectious diseases can cause high levels of mortality and disability. Therefore, it is important to prevent the spread of infectious diseases as much as possible, particularly those infections that have a higher likelihood of causing death and disability.
From the UK Health Security Agency, the general advice for managing outbreaks of infectious diseases in a particular setting or establishment is to encourage people who are unwell to not attend or remain separate from others, ensuring all eligible groups are enabled and supported to take up the offer of vaccinations, ensuring occupied spaces are well ventilated, reinforcing good hygiene practice, and requesting that infectious diseases are reported to the setting or establishment. There are recommendations on how long people should remain away from a setting such as work, school or nursery for specific diseases, and certain infections need to be reported to the Health Protection Teams. The UK Health Security Agency also has advice for Managing Specific Infectious Diseases.
Resources
Very Well Health. https://www.verywellhealth.com/the-difference-between-communicable-and-infectious-diseases-4151985
World Health Organisation. Infectious Diseases. https://www.emro.who.int/health-topics/infectious-diseases/index.html
UK Health Security Agency. Guidance: Managing outbreak and incidents. https://www.gov.uk/government/publications/health-protection-in-schools-and-other-childcare-facilities/managing-outbreaks-and-incidents
UK Government. Escherichia coli (E. coli): guidance, data and analysis. https://www.gov.uk/government/collections/escherichia-coli-e-coli-guidance-data-and-analysis
UK Government. Staphylococcus aureus (MRSA): guidance, data and analysis. https://www.gov.uk/government/collections/staphylococcus-aureus-guidance-data-and-analysis
UK Government. Clostridioides difficile (C. difficile): guidance, data and analysis. https://www.gov.uk/government/collections/clostridium-difficile-guidance-data-and-analysis
UK Government. Klebsiella species: guidance, data and analysis. https://www.gov.uk/government/collections/klebsiella-species-guidance-data-and-analysis
UK Government. Pseudomonas aeruginosa (P. aeruginosa): guidance, data and analysis. https://www.gov.uk/government/collections/pseudomonas-aeruginosa-guidance-data-and-analysis
World Health Organisation. Tuberculosis. https://www.who.int/health-topics/tuberculosis
NHS. Tuberculosis (TB). https://www.nhs.uk/conditions/tuberculosis-tb/
The Office for Health Improvement & Disparities’ Fingertips: https://fingertips.phe.org.uk/
Updates
This page was last updated / checked on 3 February 2026.
This page is due to be updated / checked in August 2026.
Migrant Health
This topic area covers statistics and information relating to migrants in Hull and the Yorkshire and Humber region including refugees and asylum seekers. Further information relating to Race and Ethnicity is given under Population.
The Health Intelligence Pack for Migrant Health produced by the Office for Health Improvement & Disparities provides insight into the health and wellbeing of migrants, and they have given us permission to display their dashboard on our JSNA below.
Headlines
- There is no single definition of migrants and often different information is recorded which makes it difficult to quantify the number of migrants and examine their health needs.
- The dictionary definition of a migrant is a person who moves from one place to another, especially in order to find work or better living conditions, and a refugee is a person who has been forced to leave their country in order to escape war, persecution, or national disaster. An asylum-seeker is someone who is seeking international protection who has left their home country as a political refugee and is seeking asylum in another country. Only asylum-seekers who are granted refugee status are allowed to work in the country.
- In terms of defining migrants within health and other datasets, migrants are often defined as foreign-born, by foreign nationality or duration of stay, but none of these truly fulfil the definition a ‘migrant’, but are simply a consequence of the information captured within specific datasets.
- At the time of the 2021 Census, 34,963 of Hull’s residents were foreign-born representing 13.1% of all Hull residents mainly born in Ireland or Europe (8.5%) with smaller percentages from the Middle East and Asia (2.8%) and Africa (1.5%). However, there were large differences by age with 3.4% of Hull residents aged 65+ years being foreign-born compared to 23.0% among those aged 35-49 years.
- Over four in ten (43%) of Hull residents who had not been born in the UK, had moved to the UK prior to 2011 (15,058 residents in total). The remaining 19,906 residents had moved to the UK in the last decade between 2011 and 2021.
- Of Hull residents who were foreign-born, 44% had been in the UK for more than 10 years, 25% for five years or more but less than ten years, 17% for two years or more but less than five years, and 14% had been in the UK for less than two years. Half of people who were aged 0-15 years when they first arrived in the UK had been in the UK for 10 or more years, but the percentage was lower with older age groups decreasing to 21% among those who had first arrived in the UK when they were 65+ years. Overall, among
- Almost nine in ten of Hull’s residents has been at the same address one year prior to the Census (88.5%), 0.7% had been at a student term-time address one year ago, 8.9% had been at a different UK address one year ago, and 0.7% had been at a non-UK address one year ago. Perhaps not surprisingly, the oldest (50+ years) and youngest (<15 years) residents were the most likely to be living at the same address as they were one year ago, whereas those aged 16-24 years were the least likely to be living at the same address as one year ago. Hull residents who were born outside the UK were less likely to have been at the same address one year prior to the Census, although for three-quarters this was because they were at a different address in the UK a year ago rather than being at an address outside the UK a year ago.
- Migrants populations are extremely diverse, and their health needs differ greatly. On average, foreign-born residents of the UK have better health compared to UK-born residents even accounting for age. However, this masks considerable differences among migrants. People who migrate solely for social and economic reasons have much better health than people who are forced to flee from poverty, adverse events, persecution, oppression and violence. Refugees and asylum seekers have much worse health. Migrants face an increased likelihood of adverse health outcomes resulting from previous conflict and trauma as well as other adverse events from their countries and their journey. Furthermore, they face additional exclusions and barriers to essential services such as housing, employment, education, social services and healthcare in their destination country due to exclusionary migration policies, and language and cultural barriers as well as racism and discrimination.
The Population Affected – Why Is It Important?
In the BioMed Central article on migration and health research, they state that human migration is essential to growing economies and represent a critical part of social and cultural fabric of our societies. They point out that global migration continues to rise at unprecedented rates, fuelled by ‘push’ factors such as extreme weather events caused by climate change, conflict and violence, political instability, and poverty, as well as ‘pull’ factors including kinship networks and a desire for social and economic mobility.
Definitions
The dictionary definition of a migrant is a person who moves from one place to another, especially in order to find work or better living conditions, and a refugee is a person who has been forced to leave their country in order to escape war, persecution, or national disaster. An asylum-seeker is someone who is seeking international protection who has left their home country as a political refugee and is seeking asylum in another country. Only asylum-seekers who are granted refugee status are allowed to work in the country. The term ‘illegal immigrant’ or ‘irregular migration’ is often used and this often refers to someone who is living and/or working in the UK without the legal right to do so (and as a result are generally not permitted to work or access benefits, social housing or free hospital care).
As stated by the Migration Observatory, there are different definitions of migrants. Migrants might be defined as foreign-born, by foreign citizenship, or by their movement into a new country to stay temporarily or settle for the long-term. Dictionary definitions sometimes distinguish immigrants – people who are, or intend to be, settled in their new country – from migrants who temporarily residents. However, in practice, phrases are used interchangeably, and there are no definitions in law, although from a legal perspective, there is a key distinction between people who are ‘subject to immigration control’, who need permission to enter or remain in the UK, and those who do not. While the UK was part of the European Union, European Union nationals were not subject to immigration control, although they were often described as migrants. Different datasets define migrants based on country of birth, nationality and/or length of stay depending on what data is collected. The Office of National Statistics use the United Nations definition of ‘long-term international migrant’ as “a person who moves to a country other than that of his or her usual residence for a period of at least one year so that the country of destination effectively becomes his or her new country of usual residence”. This represents a challenge for newly arrived migrants as it is often not known how long they will stay. To complicate the situation further, different definitions are not interchangeable. For example, people who are foreign-born are not all foreign nationals, some foreign nationals may have lived in the UK for decades whereas others have only been in the UK for a year. Not all foreign-born UK residents are subject to immigration control as there will be some children born abroad of UK national parents (e.g. service personnel) and others are long-term British residents who have acquired citizenship. In addition, the term ‘migrant’ is sometimes distinguished from, and sometimes includes, foreign nationals who are seeking asylum in the UK. These represents a small proportion of the overall entrants into the UK, although attract a great deal of public and policy attention.
Migrant status can also be relatively fluid depending on the ‘length of time in country’ used to define migrants. Whilst one year in the country is generally used to define migrants, there will be people who living in the UK for shorter periods of time, or return periodically. Some people who are foreign-born can come to the UK to study, and some people born in the UK can move abroad to study. Some of these will be temporary moves which might last the duration of the educational course, but others may settle in the country due to the relationships formed, preference, or for work prospects. This of course is true of people who come into the UK or move out of the UK for work or other purposes, they could return to their country of birth in the future, or return to their country of birth for a period of time and then return to the UK again. The people who migrate may have a plan or idea of how long they will remain in their new country when they migrate, but the time actually spent in the country ultimately may be different to that originally anticipated, and additionally will likely depend on permissions to enter or remain in the UK. People who are aged 18-39 years are probably more likely to migrate for study or work reasons.
As stated by the Migration Observatory, the definition of ‘migrant’ is not simply a technical problem but has an important effect on migration data and the analyses generated from the data. This, in turn, has an impact on public understanding and on policy debates. The confusion in public debate over the definition of ‘migrant’ poses challenges for government policy. Not all those who are considered ‘migrants’ in public debate and datasets are subject to immigration controls and policies. The definition of ‘migrant’ used by most official sources includes many British citizens and others whose rights to work and access to services in the UK are not determined by immigration controls alone.
Regardless of migration status, all refugees and migrants have the right to health and countries should provide refugee and migrant-sensitive health care services.
Why is Refugee and Migrant Health Important?
From the World Health Organisation, global migration is a long-standing phenomenon. It may increase because of conflict, persecution, environmental degradation and climate change, and a profound lack of human security and opportunity. Many people move in the hope of improved employment and life opportunities.
The correlation between health and migration is dynamic by nature and complex. Health is strongly related to the social determinants of health, including employment, income, education and housing. When not properly supported by appropriate intersectoral policies, migration can expose the most vulnerable socioeconomic groups to significant risks.
Addressing the needs of these populations with well-functioning public health and health services responds to the human right to health, protects the health of both migrants and host communities, and contributes to integration and social and economic development. This is because refugees and migrants contribute to the society in which they live, especially when in good health. Access to information, prevention and appropriate care, including diagnostics, treatment and vaccines, is essential for these groups to fulfil their health needs. Furthermore, it ensures security for global public health.
Health Among Refugees and Migrants
Migrant populations are very diverse. People who choose to migrate for social or economic reasons can be very different compared to people who are forced to migrate. From the Migration Observatory, on average, foreign-born residents are healthier than UK-born residents. In part, this is because people who are not born in the UK tend to be younger than people born in the UK. However, even within the same age groups, people who are foreign-born have better health than people who were born in the UK. This is because the people who tend to migrate for social or economic reasons tend to be younger and healthier than those who stay behind and do not migrate, and at the same time, the Migration Observatory state that the healthiest migrants are more likely to stay in their new destination rather than return to their origin countries.
However, whilst this is the case on average, this masks considerable inequalities within the migrant population. People who are forced to flee from adverse events – persecution, oppression and violence – are by their very nature include a higher percentage of vulnerable populations. Refugees and asylum seekers have much worse health than other migrants.
Barriers to Health
From the World Health Organisation, refugees and migrants often experience barriers in accessing essential services including health because legislation or regulations restrict access according to nationality or migration status; fear of immigration authorities and detection, detention and deportation; financial barriers; language and cultural differences; social stigma; administrative hurdles; and the inability to join local health financing schemes (particularly social insurance schemes).
A significant challenge is the national acceptance in legal and policy terms of the human right to health of refugees and migrants. This acceptance requires political commitment to tackle xenophobia, discrimination, exclusion and misinformation about these populations and their health needs.
Reduction or removal of communication and language barriers is key to improving access to services by refugees and migrants. However, while a common language is crucial, culturally competent services should offer more than just minimal communication. Refugee-friendly and migrant-friendly services should be able to explain the host country’s system of health care, and use telephone interpreting, face-to-face interpreting, intercultural mediation, and supportive written information to improve health communication for both providers and patients.
Migrant Health Guide
The UK government has a Migrant Health Guide which provides advice and guidance on the health needs of migrant patients for healthcare professionals. It covers access to healthcare, assessing and treating patients, vulnerable migrant groups, communicable diseases, outbreak management, non-communicable diseases and nutrition.
The Hull Picture
Estimated Number of Migrants in Hull
The information presented below is based on information from the 2021 Census and as a result is based on the Hull residents at the time of the Census. The Census collected information on country of birth, time living in UK, age of first arrival in UK and whether the person’s address one year ago was the same as their (current) address at the time of the Census. The information from the Census can be used to give an estimate of the number of ‘migrants’ living in Hull, but due to there being no standard definition, the numbers will differ and conflict depending on what measure is used, and may not reflect the number of people in Hull who are living in Hull based on permission to enter or stay in the UK (subject to immigration control). Many people living in Hull who are foreign-born have lived in the UK a long time.
As the UK Census clearly does not include non-UK residents at the time of the Census, it cannot provide information on the number of UK-born or foreign-born people who lived in Hull one year prior to the Census but had moved outside the UK and were living abroad at the time of the Census. However, there are other national sources and estimates in relation to the numbers entering and leaving Hull available from the Office of National Statistics provided as part of their resident population estimates.
Estimates Based on the 2021 Census
From the 2021 Census, based on the foreign-born, there were 34,963 residents of Hull who were not born in the UK representing 13.1% of all Hull’s residents. However, the percentages were not evenly distributed by age with a far higher percentage of residents not born in the UK among those aged 25-34 years (20.2%) and 35-49 years (23.0%) compared to those aged under 15 years (7.2%), 50-64 years (9.4%) or 65+ years (3.4%). Overall, 65% of residents who were not born in the UK were born in European countries although this also varied by age from 54% among those aged 65+ years to 70% among those aged under 15 years.
| Country of birth | <15 | 16-24 | 25-34 | 35-49 | 50-64 | 65+ | Total |
| Total (N) | 53,139 | 31,806 | 41,038 | 50,812 | 49,396 | 40,824 | 267,015 |
| UK (N) | 49,324 | 26,662 | 32,765 | 39,105 | 44,776 | 39,420 | 232,052 |
| Foreign-born (N) | 3,815 | 5,144 | 8,273 | 11,707 | 4,620 | 1,404 | 34,963 |
| UK (%) | 92.8 | 83.8 | 79.8 | 77.0 | 90.6 | 96.6 | 86.9 |
| Foreign-born (%) | 7.2 | 16.2 | 20.2 | 23.0 | 9.4 | 3.4 | 13.1 |
| Ireland & other Europe (%) | 5.0 | 10.4 | 13.8 | 14.6 | 5.7 | 1.9 | 8.5 |
| Africa (%) | 0.7 | 2.1 | 1.9 | 2.6 | 1.2 | 0.4 | 1.5 |
| Middle East & Asia (%) | 1.3 | 3.3 | 4.0 | 5.3 | 2.1 | 0.9 | 2.8 |
| Americans & Caribbean (%) | 0.1 | 0.4 | 0.3 | 0.4 | 0.3 | 0.2 | 0.3 |
| Antarctica & Oceania including Australasia (%) | 0.0 | 0.1 | 0.1 | 0.2 | 0.1 | 0.0 | 0.1 |
From the 2021 Census, based on the year of arrival in the UK, 232,051 Hull residents were born in the UK representing 86.9% of the population. Over four in ten (43%) of Hull residents who had not been born in the UK, had moved to the UK prior to 2011 (15,058 residents in total). The remaining 19,906 residents had moved to the UK in the last decade between 2011 and 2021.
| Year of arrival in UK | Number | Percentage |
| Born in UK | 232,051 | 86.9 |
| Before 1951 | 103 | 0.0 |
| 1951 to 1960 | 235 | 0.1 |
| 1961 to 1970 | 490 | 0.2 |
| 1971 to 1980 | 679 | 0.3 |
| 1981 to 1990 | 735 | 0.3 |
| 1991 to 2000 | 1,582 | 0.6 |
| 2000 to 2010 | 11,234 | 4.2 |
| 2011 to 2013 | 4,380 | 1.6 |
| 2014 to 2016 | 6,164 | 2.3 |
| 2017 to 2019 | 6,469 | 2.4 |
| 2020 to 2021 | 2,893 | 1.1 |
| Total | 267,015 | 100 |
From the 2021 Census, examining age of arrival in the UK and length of time in UK, there were 232,051 residents who were born in the UK, around 9,000-9,600 foreign-born residents of Hull arrived in the UK for each of the three age groups: 0-15, 16-24 and 25-34 years, with fewer people aged 35+ years when they first arrived in the UK. The number of foreign-born residents of Hull who first arrived in the UK when they were aged 65+ years was low – being only 188 residents. It is possible that the majority of these people are relatives of people who are already living in the UK.
Under 2% of Hull residents had been in the UK for less than two years. The majority of Hull’s residents who had not been born in the UK had been in the UK for five or more years.
| Age of arrival in UK (N) | Born in UK | In UK 10+ years | In UK 5-<10 years | In UK 2-<5 years | In UK <2 years | Total |
| Born in UK | 232,051 | 232,051 | ||||
| Aged 0-15 | 4,725 | 2,221 | 1,453 | 903 | 9,302 | |
| Aged 16-24 | 4,413 | 2,288 | 1,550 | 1,342 | 9,593 | |
| Aged 25-34 | 3,938 | 2,286 | 1,535 | 1,291 | 9,050 | |
| Aged 35-49 | 1,881 | 1,632 | 1,094 | 907 | 5,514 | |
| Aged 50-64 | 342 | 350 | 364 | 264 | 1,320 | |
| Aged 65+ | 39 | 41 | 49 | 59 | 188 | |
| Total | 232,051 | 15,338 | 8,818 | 6,045 | 4,766 | 267,018 |
More than four in ten of those not born in the UK had arrived in the UK 10 years or more ago (43.9%), one-quarter (25.2%) five years or more but less than ten years ago, 17.3% two years or more but less than five years ago, and 13.6% had arrived in the UK within the last two years.
Eight in ten of foreign-born residents of Hull had first arrived in the UK prior to the age of 35 years with an additional 15.8% arriving when they were aged 35-49 years.
| Age of arrival in UK (%) | In UK 10+ years | In UK 5-<10 years | In UK 2-<5 years | In UK <2 years | Total |
| Aged 0-15 | 13.5 | 6.4 | 4.2 | 2.6 | 26.4 |
| Aged 16-24 | 12.6 | 6.5 | 4.4 | 3.8 | 27.4 |
| Aged 25-34 | 11.3 | 6.5 | 4.4 | 3.7 | 25.9 |
| Aged 35-49 | 5.4 | 4.7 | 3.1 | 2.6 | 15.8 |
| Aged 50-64 | 1.0 | 1.0 | 1.0 | 0.8 | 3.8 |
| Aged 65+ | 0.1 | 0.1 | 0.1 | 0.2 | 0.5 |
| Total | 43.9 | 25.2 | 17.3 | 13.6 | 100 |
Half of children and young people who had first arrived in the UK aged 0-15 years had lived in the UK for ten or more years with almost a further quarter lived in the UK five or more years but fewer than ten years.
As age of arrival in the UK increased, people were less likely to have been in the UK for ten or more years.
The lowest percentage of people who had lived in the UK for ten or more years was among those people who had first arrived in the UK when they were aged 65+ years where just over one in five (21%) had lived in the UK for ten or more years, although as noted above there were only 188 residents of Hull who were foreign-born who had first moved to the UK when they were aged 65+ years so relatively small numbers.
The time in the UK and the age of arrival in the UK reflects the increased migration in the last decade combined with the usual age of migrants when they first arrive in a new country.
| Age of arrival in UK (%) | In UK 10+ years | In UK 5-<10 years | In UK 2-<5 years | In UK <2 years | Total |
| Aged 0-15 | 50.8 | 23.9 | 15.6 | 9.7 | 100 |
| Aged 16-24 | 46.0 | 23.9 | 16.2 | 14.0 | 100 |
| Aged 25-34 | 43.5 | 25.3 | 17.0 | 14.3 | 100 |
| Aged 35-49 | 34.1 | 29.6 | 19.8 | 16.4 | 100 |
| Aged 50-64 | 25.9 | 26.5 | 27.6 | 20.0 | 100 |
| Aged 65+ | 20.7 | 21.8 | 26.1 | 31.4 | 100 |
| Total | 43.9 | 25.2 | 17.3 | 13.6 | 100 |
Of those who had been in the UK ten or more years, 31% had been 0-15 years when they first arrived in the UK, 29% had been aged 16-24 years and 26% had been aged 25-34 years. Of those who had been in the UK for five or more years but fewer than ten years, and for two or more years but fewer than five years, one-quarter had first arrived for each of the age groups 0-15, 16-24 and 25-34 years. The age distribution of first arrival in the UK was slightly different among those who had first arrived in the UK in the last two years with 19% aged 0-15 years when they first arrived, 28% aged 16-24, 27% aged 35-49 and 19% aged 35-49 years when they first arrived in the UK.
| Age of arrival in UK (%) | In UK 10+ years | In UK 5-<10 years | In UK 2-<5 years | In UK <2 years | Total |
| Aged 0-15 | 30.8 | 25.2 | 24.0 | 18.9 | 26.6 |
| Aged 16-24 | 28.8 | 25.9 | 25.6 | 28.2 | 27.4 |
| Aged 25-34 | 25.7 | 25.9 | 25.4 | 27.1 | 25.9 |
| Aged 35-49 | 12.3 | 18.5 | 18.1 | 19.0 | 15.8 |
| Aged 50-64 | 2.2 | 4.0 | 6.0 | 5.5 | 3.8 |
| Aged 65+ | 0.3 | 0.5 | 0.8 | 1.2 | 0.5 |
| Total | 100 | 100 | 100 | 100 | 100 |
The highest number of foreign-born Hull residents by current age (at the time of the Census) and age of arrival in the UK were people aged 35-49 years who first arrived in the UK when they were aged 25-34 years (5,400), people who are aged 25-34 years who first arrived in the UK when they were aged 16-24 years (4,311), children and young people aged under 16 years (3,816) and people aged 35-49 years who first arrived in the UK when they were aged 35-49 years (3,042).
| Age of arrival in UK | Aged 0-15 now | Aged 16-24 now | Aged 25-34 now | Aged 35-49 now | Aged 50-64 now | Aged 65+ now | Total |
| Born in UK | 49,322 | 26,662 | 32,765 | 39,106 | 44,776 | 39,420 | 232,051 |
| Aged 0-15 | 3,816 | 2,917 | 1,020 | 682 | 607 | 256 | 9,298 |
| Aged 16-24 | 2,227 | 4,311 | 2,583 | 233 | 239 | 9,593 | |
| Aged 25-34 | 2,941 | 5,400 | 545 | 165 | 9,051 | ||
| Aged 35-49 | 3,042 | 2,310 | 160 | 5,512 | |||
| Aged 50-64 | 925 | 395 | 1,320 | ||||
| Aged 65+ | 188 | 188 | |||||
| Total | 53,138 | 31,806 | 41,037 | 50,813 | 49,396 | 40,823 | 267,013 |
The majority of Hull residents who were not born in the UK and were aged 0-15 years when they first arrived in the UK were aged under 25 years (at the time of the Census) with 41% aged 0-15 years and 31% aged 16-24 years.
Almost 45% of Hull residents who first arrived in the UK when they were aged 16-24 years were aged 25-49 years at the time of the Census with the remaining split between 16-24 and 35-49 years (with very few currently aged 50+ years).
Six in ten of foreign-born Hull residents who first arrived in the UK when they were aged 25-34 years were aged 35-49 at the time of the Census with almost a third currently aged 25-34 years.
Over half of Hull residents not born in the UK who first arrived in the UK when they were aged 35-49 years were still in the same age band at the time of the Census with an additional 42% aged 50-64 years at the time of the Census (although the age band is slightly wider than the younger age bands so it might be expected that more are within the same age band at the time of the Census compared to their age when they first arrived in the UK).
| Age of arrival in UK | Aged 0-15 now | Aged 16-24 now | Aged 25-34 now | Aged 35-49 now | Aged 50-64 now | Aged 65+ now | Total |
| Aged 0-15 | 41.0 | 31.4 | 11.0 | 7.3 | 6.5 | 2.8 | 100 |
| Aged 16-24 | 23.2 | 44.9 | 26.9 | 2.4 | 2.5 | 100 | |
| Aged 25-34 | 32.5 | 59.7 | 6.0 | 1.8 | 100 | ||
| Aged 35-49 | 55.2 | 41.9 | 2.9 | 100 | |||
| Aged 50-64 | 70.1 | 29.9 | 100 | ||||
| Aged 65+ | 100 | 100 | |||||
| Total | 10.9 | 14.7 | 23.7 | 33.5 | 13.2 | 4.0 | 100 |
Among Hull residents aged 0-15 years (at the time of the 2021 Census), 92.8% were born in the UK. Over nine in ten residents of Hull who were aged 50-64 years at the time of the Census were also born in the UK, and the percentage was even higher among Hull residents aged 65+ years at 97%.
The percentages born in the UK were lower among those aged 16-49 years.
Among all Hull residents aged 16-24 years, 9.2% were foreign-born and had first arrived in the UK when they were aged 0-15 years and 7.0% were foreign-born and had first arrived in the UK when they were aged 16-24 years.
Among all Hull residents aged 25-34 years, 20.2% were foreign-born which included 10.5% who were aged 16-24 years and 7.2% who were aged 25-34 years when they first arriving in the UK.
Among all Hull residents aged 35-49 years, 23.0% were foreign-born which included 10.6% who were aged 25-3 years, 6.0% who were aged 35-49 years and 5.1% who were aged 16-24 years when they first arriving in the UK.
| Age of arrival in UK | Aged 0-15 now | Aged 16-24 now | Aged 25-34 now | Aged 35-49 now | Aged 50-64 now | Aged 65+ now | Total |
| Born in UK | 92.8 | 83.8 | 79.8 | 77.0 | 90.6 | 96.6 | 86.9 |
| Aged 0-15 | 7.2 | 9.2 | 2.5 | 1.3 | 1.2 | 0.6 | 3.5 |
| Aged 16-24 | 7.0 | 10.5 | 5.1 | 0.5 | 0.6 | 3.6 | |
| Aged 25-34 | 7.2 | 10.6 | 1.1 | 0.4 | 3.4 | ||
| Aged 35-49 | 6.0 | 4.7 | 0.4 | 2.1 | |||
| Aged 50-64 | 1.9 | 1.0 | 0.5 | ||||
| Aged 65+ | 0.5 | 0.1 | |||||
| Total | 100 | 100 | 100 | 100 | 100 | 100 | 100 |
Of Hull residents who were foreign-born, from their current age (at the time of the Census) and the age when they first arrived in the UK, for all current age groups aged 16+ years, the majority were within a younger age band when they first arrived in the UK compared to their current age.
| Age of arrival in UK | Aged 0-15 now | Aged 16-24 now | Aged 25-34 now | Aged 35-49 now | Aged 50-64 now | Aged 65+ now | Total |
| Aged 0-15 | 100 | 56.7 | 12.3 | 5.8 | 13.1 | 18.2 | 26.6 |
| Aged 16-24 | 43.3 | 52.1 | 22.1 | 5.0 | 17.0 | 27.4 | |
| Aged 25-34 | 35.6 | 46.1 | 11.8 | 11.8 | 25.9 | ||
| Aged 35-49 | 26.0 | 50.0 | 11.4 | 15.8 | |||
| Aged 50-64 | 20.0 | 28.2 | 3.8 | ||||
| Aged 65+ | 13.4 | 0.5 | |||||
| Total | 100 | 100 | 100 | 100 | 100 | 100 | 100 |
There is a ‘migrant status’ variable recorded in the Census which is defined on the basis of the address one year earlier, and is categorised as migration within the UK as well as migration into the UK within the last year.
Among the 267,022 residents of Hull, 234,762 (87.9%) were living at the same address at the time of the 2021 Census as they were one year ago. A further 2,015 (0.8%) Hull residents had been living at a different address one year ago which was a student term-time or boarding school address in the UK. The remaining 27,017 (10.1%) Hull residents were living at a different address one year ago with that address in the UK for 25,002 (9.4%) of Hull residents and outside the UK for 2,015 (0.8%) of Hull residents. For 3,090 Hull residents, their prior address was not applicable as they were infants aged under one year.
Overall, there were 2,015 Hull residents who had been living at an address outside the UK one year prior to the Census, 262 of these had been born in the UK and 1,753 were foreign-born.
As mentioned earlier, as the Census is a count of residents at the time of the Census, it will not capture previous residents of Hull who were living in Hull one year prior to the Census who have moved out of Hull to other parts of the UK or abroad. So this table reflects migration in one direction only whether that is people moving into Hull from abroad, moving into Hull other parts of the UK, or moving home within Hull. It is likely that a sizeable percentage of people who are recorded as living at a different address in the UK one year prior to the Census were living in Hull (or perhaps surrounding areas such as East Riding of Yorkshire) one year prior to the Census and their address change was within the local area. This will be particularly the case among older ages. Young people who are transitioning between school and further education or work will be more likely to have moved address in the last year perhaps from further afield. Families with school-aged children are also perhaps more likely to move as are people of working-age for work purposes.
| Born in UK or not | Address one year before Census | <15 | 16-24 | 25-34 | 35-49 | 50-64 | 65+ | Total |
| Born in UK | Infant | 3,073 | 3,073 | |||||
| Same | 42,346 | 19,221 | 27,564 | 36,353 | 43,082 | 38,482 | 207,048 | |
| Student | 2 | 1,722 | 91 | 3 | 1 | 0 | 1,819 | |
| Different in UK | 3,878 | 5,665 | 5,033 | 2,717 | 1,644 | 917 | 19,854 | |
| Non-UK | 25 | 56 | 78 | 33 | 49 | 21 | 262 | |
| Total | 49,324 | 26,664 | 32,766 | 39,106 | 44,776 | 39,420 | 232,056 | |
| Not born in UK | Infant | 17 | ||||||
| Same | 3,000 | 3,271 | 5,978 | 10,068 | 4,086 | 1,311 | 27,714 | |
| Student | 0 | 275 | 48 | 8 | 3 | 0 | 334 | |
| Different in UK | 527 | 1,153 | 1,735 | 1,249 | 422 | 62 | 5,148 | |
| Non-UK | 271 | 445 | 512 | 384 | 110 | 31 | 1,753 | |
| Total | 3,815 | 5,144 | 8,273 | 11,709 | 4,621 | 1,404 | 34,966 | |
| All | Infant | 3,090 | ||||||
| Same | 45,346 | 22,492 | 33,542 | 46,421 | 47,168 | 39,793 | 234,762 | |
| Student | 2 | 1,997 | 139 | 11 | 4 | 0 | 2,153 | |
| Different in UK | 4,405 | 6,818 | 6,768 | 3,966 | 2,066 | 979 | 25,002 | |
| Non-UK | 296 | 501 | 590 | 417 | 159 | 52 | 2,015 | |
| Total | 53,139 | 31,808 | 41,039 | 50,815 | 49,397 | 40,824 | 267,022 |
The column percentages are given below for each age group. Not surprisingly, the oldest residents of Hull aged 50+ years were the most likely to be living at the same address one year before the Census with over 95% living at the same address. Hull residents aged 16-24 years were the least likely to be living at the same address with only 70% living at the same address at the time of the Census as they had been one year prior to this.
| Born in UK or not | Address one year before Census | <15 | 16-24 | 25-34 | 35-49 | 50-64 | 65+ | Total |
| Born in UK | Infant | 5.8 | 1.2 | |||||
| Same | 79.7 | 60.4 | 67.4 | 71.5 | 87.2 | 94.3 | 77.5 | |
| Student | 0.0 | 5.4 | 0.2 | 0.0 | 0.0 | 0.0 | 0.7 | |
| Different in UK | 7.3 | 17.8 | 12.3 | 5.3 | 3.3 | 2.2 | 7.4 | |
| Non-UK | 0.0 | 0.2 | 0.2 | 0.1 | 0.1 | 0.1 | 0.1 | |
| Total | 92.8 | 83.8 | 79.8 | 77.0 | 90.6 | 96.6 | 86.9 | |
| Not born in UK | Infant | 0.0 | 0.0 | |||||
| Same | 5.6 | 10.3 | 14.6 | 19.8 | 8.3 | 3.2 | 10.4 | |
| Student | 0.0 | 0.9 | 0.1 | 0.0 | 0.0 | 0.0 | 0.1 | |
| Different in UK | 1.0 | 3.6 | 4.2 | 2.5 | 0.9 | 0.2 | 1.9 | |
| Non-UK | 0.5 | 1.4 | 1.2 | 0.8 | 0.2 | 0.1 | 0.7 | |
| Total | 7.2 | 16.2 | 20.2 | 23.0 | 9.4 | 3.4 | 13.1 | |
| All | Infant | 5.8 | 1.2 | |||||
| Same | 85.3 | 70.7 | 81.7 | 91.4 | 95.5 | 97.5 | 87.9 | |
| Student | 0.0 | 6.3 | 0.3 | 0.0 | 0.0 | 0.0 | 0.8 | |
| Different in UK | 8.3 | 21.4 | 16.5 | 7.8 | 4.2 | 2.4 | 9.4 | |
| Non-UK | 0.6 | 1.6 | 1.4 | 0.8 | 0.3 | 0.1 | 0.8 | |
| Total | 100 | 100 | 100 | 100 | 100 | 100 | 100 |
For all ages, Hull residents who were foreign-born were less likely to be living in the same address at the time of the Census compared to one year prior to this, and whilst by definition there was a higher percentage who had been living outside the UK one year prior the Census, the percentage not living at the same address were mainly because they had been living at a different address in the UK one year prior to the Census (rather than living abroad). This could denote more transient populations simply as a result of their generally younger age, but this occurred for all age groups, so suggests that perhaps accommodation is less stable for foreign-born residents of Hull.
| Born in UK or not | Address one year before Census | <15 | 16-24 | 25-34 | 35-49 | 50-64 | 65+ | Total |
| Born in UK | Infant | 6.2 | 1.3 | |||||
| Same | 85.9 | 72.1 | 84.1 | 93.0 | 96.2 | 97.6 | 78.2 | |
| Student | 0.0 | 6.5 | 0.3 | 0.0 | 0.0 | 0.0 | 0.8 | |
| Different in UK | 7.9 | 21.2 | 15.4 | 6.9 | 3.7 | 2.3 | 8.6 | |
| Non-UK | 0.1 | 0.2 | 0.2 | 0.1 | 0.1 | 0.1 | 0.1 | |
| Total | 100 | 100 | 100 | 100 | 100 | 100 | 100 | |
| Not born in UK | Infant | 0.4 | 0.0 | |||||
| Same | 78.6 | 63.6 | 72.3 | 86.0 | 88.4 | 93.4 | 79.3 | |
| Student | 0.0 | 5.3 | 0.6 | 0.1 | 0.1 | 0.0 | 0.1 | |
| Different in UK | 13.8 | 22.4 | 21.0 | 10.7 | 9.1 | 4.4 | 14.7 | |
| Non-UK | 7.1 | 8.7 | 6.2 | 3.3 | 2.4 | 2.2 | 5.0 | |
| Total | 100 | 100 | 100 | 100 | 100 | 100 | 100 |
Local and International Migration in Hull
The mid-year resident population estimates from the Office for National Statistics, give information on the number of births and deaths as well as estimates of migration for successive mid-year estimates. The mid-year population resident population estimates for Hull were 273,069 for 2023 and 275,401 for 2024. Between July 2023 and June 2024, there were 3,119 births and 2,590 deaths among Hull residents equating to a natural increase in population of 529 residents, but the largest differences were due to migration with people leaving Hull to move to other parts of the UK (reducing the population by 1.3%) and migration with people moving into Hull from abroad (increasing the population by 2.0%). It is likely that a number of people moving into Hull from abroad will be students. There were a reduction of 77 people living in Hull due to other changes such as those due to the prison population or armed forces.
| Component of change | Number of people | Percentage (of 2023 population) |
| Births to Hull residents | 3,119 | 1.1 |
| Deaths to Hull residents | 2,590 | 10.9 |
| Natural change | 529 | 0.2 |
| Internal migration into Hull | 11,713 | 4.3 |
| Internal migration out of Hull | 15,373 | 5.6 |
| Internal migration – net change | -3,660 | -1.3 |
| International migration into Hull | 7,640 | 2.8 |
| International migration out of Hull | 2,100 | 0.8 |
| International migration – net change | 5,540 | 2.0 |
| Other net change | -77 | 0.0 |
| Overall net change in population | 2,332 | 0.9 |
These components of change are also available for different ages, and as expected the size of the different population changes differs by age. The largest changes occurred in the youngest age group due to births, oldest age group due to deaths and the middle age group due to migration.
The highest levels of both internal and international migration occurred among people aged 25-39 years with a decrease in the population due to internal migration and an increase in the population due to international migration.
| Population or component of change | Aged 0-17 | Aged 18-24 | Aged 25-39 | Aged 40-64 | Aged 65+ |
| Population 2023 | 61,596 | 24,188 | 63,383 | 81,650 | 42,252 |
| Population 2024 | 62,379 | 24,558 | 63,897 | 81,868 | 42,699 |
| Births | 3,119 | ||||
| Deaths | 20 | 14 | 67 | 439 | 2,050 |
| Natural net change | 3,099 | -14 | -67 | -439 | -2,050 |
| Internal – in | 1,548 | 3,884 | 3,820 | 1,855 | 606 |
| Internal – out | 2,263 | 3,806 | 5,766 | 2,657 | 881 |
| Internal – net | -715 | 78 | -1,946 | -802 | -275 |
| International – in | 1,941 | 710 | 3,957 | 991 | 41 |
| International – out | 200 | 304 | 1,033 | 523 | 40 |
| International – net | 1,741 | 406 | 2,924 | 468 | 1 |
| Migration net change | 1,026 | 484 | 978 | -334 | -274 |
| Special changes* | -3 | -53 | -10 | -7 | -4 |
| Overall change | 783 | 370 | 514 | 218 | 447 |
As a percentage of the 2023 population in terms of migration, the largest percentage increases in the total population occurred for people aged 18-24 years with the population increasing by 1.5%.
The 18-24 year age group also had the highest net migration change which represented 2.0% of the 2023 population, followed by those aged 0-17 years (1.7%) and 25-39 years (1.5%). The population reduced among those aged 40-64 years and 65+ years from migration.
However, there were large differences between internal migration and international migration. There were reductions in relation to internal migration for all age groups except those aged 18-24 years, and the largest reductions were among those aged 25-39 years where 3.1% of the 2023 population in this age group moved out of Hull. This is not particularly surprising as students and other young people do tend to move into cities to work, study and socialise, and people aged 25-39 years and families are more likely to leave Hull perhaps to surrounding areas in East Riding of Yorkshire.
There were increases in net migration for all ages although these were highest among those aged 25-39 years which represented 4.6% of the 2023 population (with 6.2% moving into Hull and 1.6% moving out of Hull to abroad). The second highest age group was for those aged 0-17 years (2.8%) and those aged 18-24 years (1.7%). Previously, the age group with the largest net international migration was the 18-24 year age group which may predominantly be students from abroad moving into Hull to study, but the latest changes in the population profile suggest families with children are moving into Hull from abroad.
International migration was lower among those aged 40+ years and particular so for those aged 65+ years, and the rates of internal migration were also lower. There was also a reduction in the population due to internal migration among those aged 40+ years. Among those aged 65+ years, there was a reduction of 4.9% in the population due to deaths. Despite the overall reductions in population due to death and migration among those aged 40+ years, there was an increase in the populations aged 40-64 years and 65+ years between 2023 and 2024 due to people aged 39 years moving into the 40-64 year age group in 2024 and people aged 64 years moving into the 65+ year age group in 2024.
| Population or component of change | Aged 0-17 | Aged 18-24 | Aged 25-39 | Aged 40-64 | Aged 65+ |
| Births | 5.1 | ||||
| Deaths | 0.0 | 0.1 | 0.1 | 0.5 | 4.9 |
| Natural net change | 5.0 | -0.1 | -0.1 | -0.5 | -4.9 |
| Internal – in | 2.5 | 16.1 | 6.0 | 2.3 | 1.4 |
| Internal – out | 3.7 | 15.7 | 9.1 | 3.3 | 2.1 |
| Internal – net | -1.2 | 0.3 | -3.1 | -1.0 | -0.7 |
| International – in | 3.2 | 2.9 | 6.2 | 1.2 | 0.1 |
| International – out | 0.3 | 1.3 | 1.6 | 0.6 | 0.0 |
| International – net | 2.8 | 1.7 | 4.6 | 0.6 | 0.0 |
| Migration net change | 1.7 | 2.0 | 1.5 | -0.4 | -0.6 |
| Special changes* | 0.0 | -0.2 | 0.0 | 0.0 | 0.0 |
| Overall change | 1.3 | 1.5 | 0.8 | 0.3 | 1.1 |
Migration Yorkshire Dashboard
Migration Yorkshire have produced a dashboard which examines trends in migration in the Yorkshire region with much of the information available at local authority level. The numbers of migrants is examined over time as well as the top 10 nationalities, and the sex and age profile of the migrants.
Access Migration Yorkshire Dashboard
Health Intelligence Pack for Migrant Health
The Office for Health Improvement & Disparities have published a Health Intelligence Pack for Migrant Health which gives information relation to migrants and their health across local authorities within the Yorkshire and Humber region. The link is as follows, but they have given us permission to display their dashboard on our JSNA website.
Health Intelligence Pack for Migrant Health
The information has not been updated since it was published so there might be later information available.
The local knowledge and intelligence service team have given permission for us to display their health intelligence pack on our JSNA page. You can click on the zoom icon on the bottom right hand side of the page to make the page smaller or larger, and click on the < or > icons at the bottom of the page to move to move back or forward through the pages, or click on the page numbers “1 of 20” themselves to select a specific page. On specific pages, there are options to select different groups, such as select a specific region or local authority, specific years, or filter by nationality etc.
Strategic Need and Service Provision
This section will be updated in due course.
Resources
Migration and health research: past, present and future. Goldenberg SM and Fischer F. BMC Public Health, 2023; 23: 1425. https://bmcpublichealth.biomedcentral.com/articles/10.1186/s12889-023-16363-7
Who counts as a migrant? Definitions and their consequences. The Migration Observatory. https://migrationobservatory.ox.ac.uk/resources/briefings/who-counts-as-a-migrant-definitions-and-their-consequences/
Irregular migration in the UK. The Migration Observatory. https://migrationobservatory.ox.ac.uk/resources/briefings/irregular-migration-in-the-uk/
The health of migrants in the UK. The Migration Observatory. https://migrationobservatory.ox.ac.uk/resources/briefings/the-health-of-migrants-in-the-uk/
Refugee and migrant health. World Health Organisation. https://www.who.int/news-room/questions-and-answers/item/refugee-and-migrant-health
Migrant health guide. UK government. https://www.gov.uk/government/collections/migrant-health-guide
Health intelligence pack for migrant health. Office for Health Improvement & Disparities. Health intelligence pack for migrant health.
Updates
This page was last updated / checked on 16 January 2026.
This page is due to be updated / checked in August 2026.
Air Pollution
This topic area covers statistics and information relating to air pollution in Hull including local strategic need and service provision. Further information is also available about Hull and the environment can be found under Geographical Area within Place, and under Climate Change within Health and Wellbeing Influences.
This page contains information from the Office for Health Improvement & Disparities’ Fingertips. Information is taken ‘live’ from the site so uses the latest available data from Fingertips and displays it on this page. As a result, some comments on this page may relate to an earlier period of time until this page is next updated (see review dates at the end of this page).
Headlines
- Humans interact with the environment constantly. These interactions affect quality of life, years of healthy life lived, and health disparities.
- Air pollution will always be higher in cities with the much greater concentration of housing, industry, roads and traffic compared to rural areas. Furthermore, this might be exacerbated in the case of Hull with its tight geographical boundaries (most other cities have more ‘leafy suburbs’ within their boundary compared to Hull) and these areas will drag down the average levels of air pollution levels in other city local authorities. Despite this, the levels of air pollution are good in Hull relative to other cities, and have fallen in recent years.
- One measure of air pollution is particulate matter smaller than 2.5 microns (PM2.5) and this is estimated to be 7.2 µg/m3 (annual estimate) for Hull for 2023 which is not substantially different than England (7.0 µg/m3) or the region (6.8 µg/m3).
- For 2023, it is estimated that around 5.4% of all deaths among those aged 30+ years are attributable to air pollution in Hull. This is slightly higher than England (5.2%) and the region (5.1%) but similar to other cities and built up areas within the Yorkshire and Humber region.
- There is the potential for measures introduced to resolve one environmental problem to be detrimental to other strategies, so full consultation and engagement between the different areas and an assessment of the impacts of any council actions is essential to ensure strategies complement each other.
The Population Affected – Why Is It Important?
Air quality is the term used to describe how polluted the air we breathe is. When air quality is poor, pollutants in the air may be hazardous to people, particularly those with lung or heart conditions. There are a number of different components to air pollution, and monitoring of air quality involves measuring the atmospheric concentrations of a number of particulates and gases. However, people are not only exposed to air pollution outside the home but inside the home too. It is difficult to measure exposure to air pollution at an individual level as it depends on many factors as they are dependent on levels of emissions, the formation of pollutants, weather, topography and the environment. Household chemicals, pets and pests, temperatures, radon, microbes, particulate matter, humidity and ventilation can all influence indoor pollutants.
The UK’s air quality strategy details how the UK aims to achieve prescribed standards and objectives for a suite of air quality concentrations to protect health and the environment. These include nitrogen dioxide (NO2), sulphur dioxide (SO2) and particulate matter smaller than 10 microns (PM10), with an additional requirement for particulate matter smaller than 2.5 microns (PM2.5). Measurements are usually given as micrograms per cubic metre (µg/m3).
As people are generally more affected by one pollutant than another, locally it is felt that presenting the values of the individual pollutants rather than the Air Pollution Index (API) enables people to make more informed personal decisions. The NHS have summarised some research on lung cancer and heart failure in relation to air pollution. For a lung cancer study, each 10μg/m3 increase in PM10 led to a corresponding increase in the hazard ratio of lung cancer incidence of 1.22 (95% confidence interval 1.03 to 1.45) with no association found between lung cancer incidence and PM2.5, mono nitrogen oxide and nitrogen dioxide combined, or nitrogen dioxide. The heart failure study found an increased risk of heart failure hospitalisation or death for increases in carbon monoxide (3.5% increase in risk per increase of one part per million of pollutant), sulphur dioxide (2.4%), nitrogen dioxide (1.7%), PM2.5 (2.1%) and PM10 (1.6%). In both studies, some potential confounders were included in the model, but it is possible important confounders were not included.
Different factors influence different pollutants in relation to air pollution as illustrate by Health Matters from the Office for Health Improvement & Disparities (formerly Public Health England).
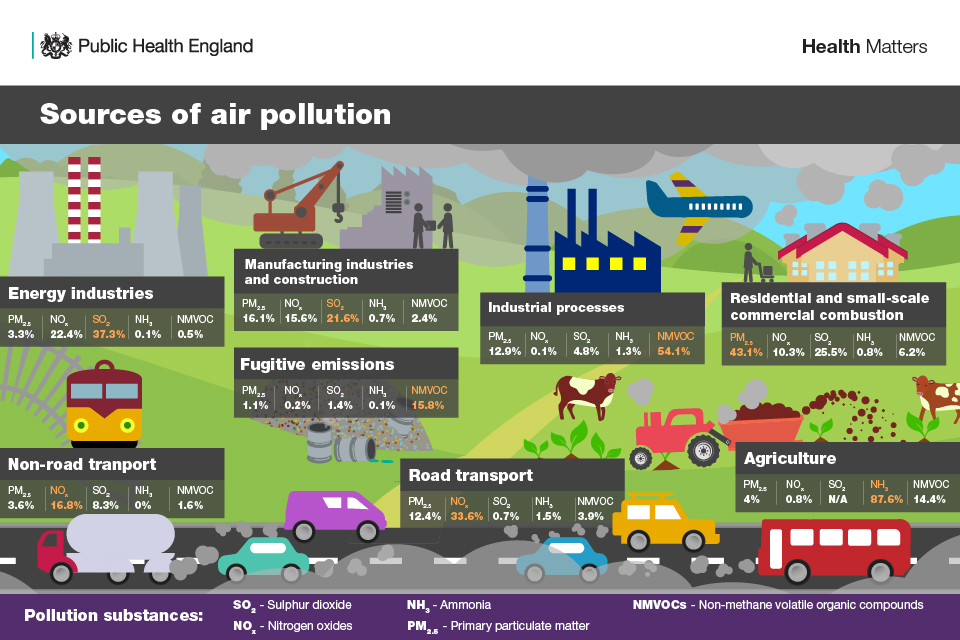
Air pollution affects individuals throughout their entire lifetime.
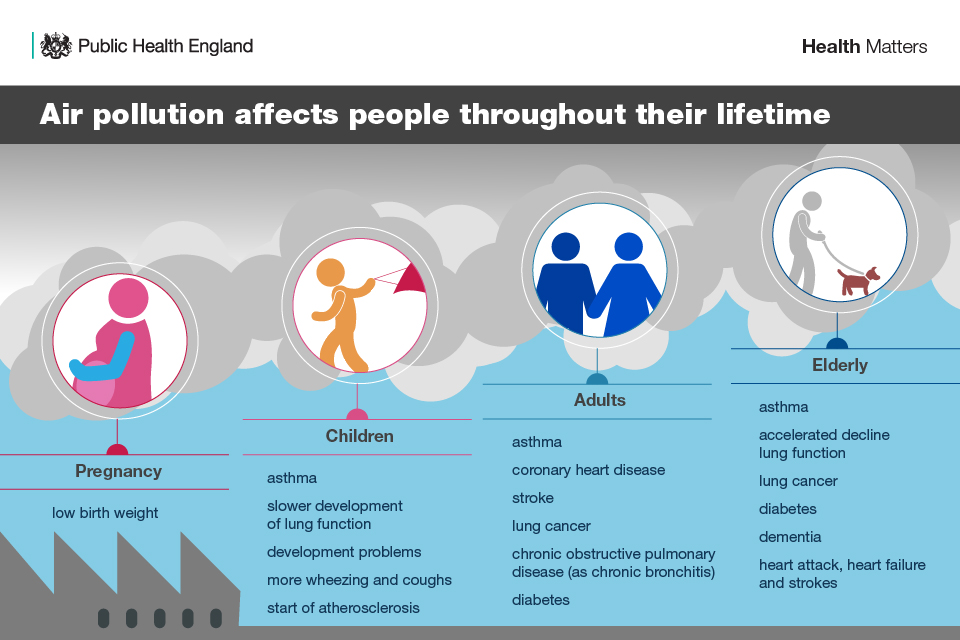
The Hull Picture
Air Quality Summary
Hull City Council has a very good story to tell regarding air quality so far, and it measures air quality across the city, with results used to inform planning policy and applications as well as the Action Plan Measures in the Council’s Air Quality Strategy. Further information can be found on the main Hull City Council website relating to Air quality, Atmospheric Pollution and Environmental Nuisance.
Part of the UK Strategy is for local authorities submit Annual Status Reports on air quality to the Department for Environment, Food and Rural Affairs’ (DEFRA) and for these to be reviewed by external consultants to ensure they are accurate. The contents of these reports from Hull City Council have been accepted each year and demonstrate that air quality in Hull is good, particularly in comparison to similar areas of the UK. The only exception to this has been an area around the A63 trunk road, which is the responsibility of the National Highways, a central government body. This area is currently an Air Quality Management Area (AQMA) but due to compliance with objectives for five years, to comply with guidance from DEFRA, Hull City Council must proceed to revoke the AQMA.
Changes Over Time in Hull
Levels of NO2 have decreased in Hull between 2016 and 2020 with a levelling off in the last five years.
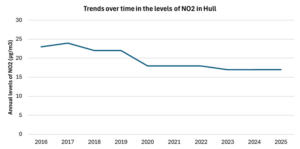
Levels of particulate matter have remained constant or have reduced in Hull over the last few years with an increase in 2024 and 2025 which can be explained by the weather. The levels are reported below for Freetown which will tend to have among the highest levels in Hull due to its location.
During the winter of 2024/2025 high pressure weather systems brought settled, calm conditions, creating ‘Anticyclonic Gloom’ phenomena and temperature inversions where cold air was trapped at the surface beneath warmer air. These inversions acted as a ‘lid’, preventing the dispersal of pollutants, leading to an increase in monitored levels. This effect was seen regionally and nationally, and was not unique to Hull.
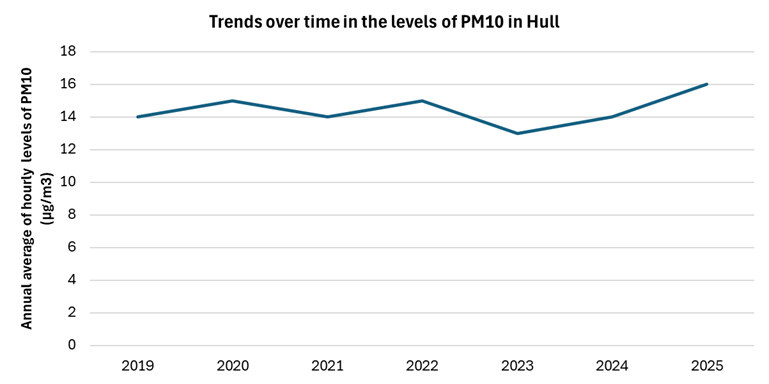
Levels of PM2.5 have reduced in Hull since 2016 with a slight increase in 2025 due to the ‘Anticyclonic Gloom’ phenomena.
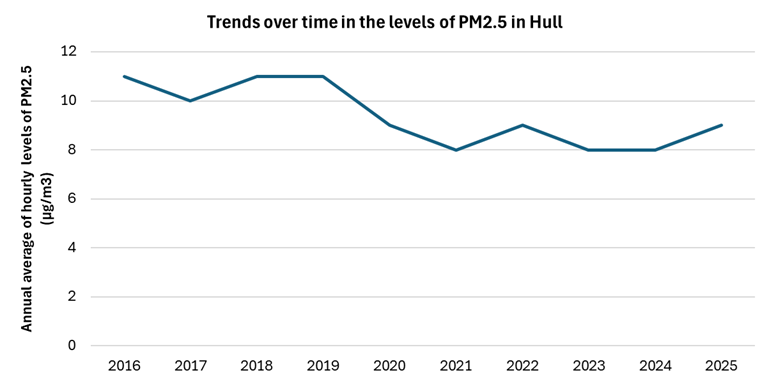
Hull Compared to Other Areas of England and Wales
The Access to Healthy Assets and Hazards which includes air pollution levels and was updated in 2024.
The Access to Healthy Assets and Hazards (AHAH) index is designed to allow policy and decision makers to understand which areas have poor environments for health, and to help move away from treating features of the environment in isolation.
The Access to Healthy Assets and Hazards index is comprised of four domains: access to retail services (fast food outlets, gambling outlets, pubs/bars/nightclubs, off licences, tobacconists), access to health services (GP surgeries, A&E hospitals, pharmacies, dentists and leisure centres), the physical environment (green and blue spaces) and levels of air pollution (nitrogen dioxide (NO2), particulate matter smaller than 10 microns (PM10) and sulphur dioxide (SO2)).
The national percentiles for England, Wales and Scotland are available for each lower layer super output areas. The percentiles range from 1 to 100 with 1 denoting the lowest levels of pollution and 100 denoting the highest levels. As previously mentioned and illustrated in the maps below for England and Wales, there are higher levels of pollution in cities.
Not surprisingly, air pollution levels are higher in cities across England and Wales, and lowest in rural areas.
For the overall air pollution measure, 39% of Hull’s 168 lower super output areas fall within the highest tenth of area of Great Britain, 25% in the second highest tenth of areas, 32% in the third highest tenth and 4% in the fourth highest tenth of areas.
Considering the density of Hull and tight geographical boundaries, the levels are relatively low in Hull.
The levels of NO2 are also presented within the Access to Healthy Assets and Hazards index. A similar pattern is observed as the overall measure with cities having the highest pollution levels and rural areas having the lowest levels, although there are lower levels in Hull.
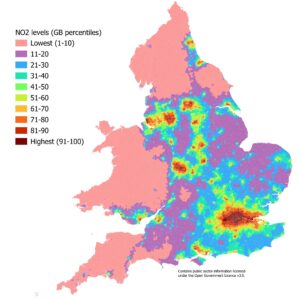
For NO2, none of Hull’s 168 lower super output areas fall within the highest tenth of area of Great Britain, 19% in the second highest tenth of areas, 24% in the third highest tenth, 29% in the fourth highest tenth of areas, 24% in the fifth highest tenth of areas and 4% in the fifth lowest tenth of areas.
Considering the density of Hull and tight geographical boundaries, the levels are low in Hull.
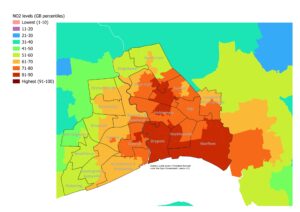
The levels of particulate matter (PM10) are also presented within the Access to Healthy Assets and Hazards index. The air pollution levels for PM10 differ slightly to the overall measure and NO2 within the AHAH index, and the levels in Hull are much lower.
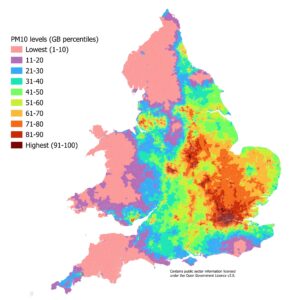
For PM10, none of Hull’s 168 lower super output areas fall within the highest tenth of area of Great Britain, 2% in the second highest tenth of areas, 16% in the third highest tenth, 22% in the fourth highest tenth of areas, 42% in the fifth highest tenth of areas, 18% in the fifth lowest tenth of areas, and 1% in the fourth lowest tenth of areas.
Considering the density of Hull and tight geographical boundaries, the levels are low in Hull.
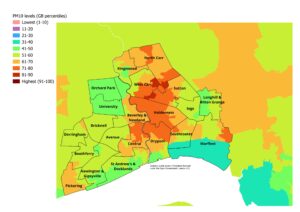
Levels of Particulate Matter 2.5
The annual concentration of fine particulate matter (PM2.5 ) at an area level, adjusted to account for population exposure is given on the Office for Health Improvement & Disparities’ Fingertips. The estimate of PM2.5 is relatively high across the region, but this is not surprising given that the levels are higher in cities compared to more rural areas. The levels in Hull with also be impacted by Hull’s tight geographical boundaries (as discussed within Geographical Area under Place) as most other cities have ‘leafy suburbs’ within their geographical boundary which reduces their average levels.
Compared with benchmark
Better
Similar
Worse
Not Compared
Lower
Similar
Higher
| Indicator | Period | England | Yorkshire and the Humber region (statistical) | Kingston upon Hull | East Riding of Yorkshire | North East Lincolnshire | North Lincolnshire | York | North Yorkshire UA | Barnsley | Doncaster | Rotherham | Sheffield | Bradford | Calderdale | Kirklees | Leeds | Wakefield |
|---|---|---|---|---|---|---|---|---|---|---|---|---|---|---|---|---|---|---|
Air pollution: fine particulate matter (new method - concentrations of total PM2.5) (Not applicable Not applicable) | 2024 | 7.1 | 6.9 | 7.4 | 6.4 | 7.3 | 7.2 | 6.0 | 5.5 | 7.1 | 7.4 | 7.5 | 7.3 | 6.9 | 6.6 | 7.0 | 7.4 | 7.1 |
| Indicator | Period | England | Yorkshire and the Humber region (statistical) | Kingston upon Hull | East Riding of Yorkshire | North East Lincolnshire | North Lincolnshire | York | North Yorkshire UA | Barnsley | Doncaster | Rotherham | Sheffield | Bradford | Calderdale | Kirklees | Leeds | Wakefield |
|---|---|---|---|---|---|---|---|---|---|---|---|---|---|---|---|---|---|---|
Air pollution: fine particulate matter (new method - concentrations of total PM2.5) (Not applicable Not applicable) | 2024 | 7.1 | 6.9 | 7.4 | 6.4 | 7.3 | 7.2 | 6.0 | 5.5 | 7.1 | 7.4 | 7.5 | 7.3 | 6.9 | 6.6 | 7.0 | 7.4 | 7.1 |
The estimate of PM2.5 in Hull has decreased between 2018 and 2023 by 27% in Hull which is similar to decreases for England.
Compared with benchmark
Better
Similar
Worse
Not Compared
Lower
Similar
Higher
Air pollution: fine particulate matter (new method - concentrations of total PM2.5) (Not applicable Not applicable)
|
Period
|
Kingston upon Hull |
Yorkshire and the Humber region (statistical)
|
England
|
||||
|---|---|---|---|---|---|---|---|
|
Count
|
Value
|
95%
Lower CI |
95%
Upper CI |
||||
| 2018 | • | - | 9.8 | - | - | 8.2 | 9.5 |
| 2019 | • | - | 9.6 | - | - | 8.9 | 9.6 |
| 2020 | • | - | 7.2 | - | - | 6.6 | 7.5 |
| 2021 | • | - | 7.6 | - | - | 6.7 | 7.4 |
| 2022 | • | - | 7.5 | - | - | 6.8 | 7.8 |
| 2023 | • | - | 7.2 | - | - | 6.8 | 7.0 |
| 2024 | • | - | 7.4 | - | - | 6.9 | 7.1 |
Source: Department for Environment, Food and Rural Affairs
Estimated Mortality Attributable to Air Pollution
The Committee on the Medical Effects of Air Pollutants (COMEAP) estimated that if all man-made particulate pollution were removed, this would lead to an increase in life expectancy of around 6 months although the effect could be as small as one month and as large as a year. To put this into context, the effect on life expectancy of continued smoking is seven years on average. The Office for Health Improvement & Disparities’ Fingertips previously presented the percentage of deaths among those aged 30+ years attributable to air pollution. However, DEFRA’s model for Hull was found to be inaccurate, and as a result it is possible that the percentages of deaths based on these levels of air pollution may also be inaccurate.
More recently, the Office for Health Improvement & Disparities’ have used a new method to calculate the fraction of annual all cause adult mortality attributable to particulate air pollution (PM2.5). It represents the mortality burden associated with long-term exposure to particulate air pollution at current levels, expressed as a percentage of annual deaths from all causes in those aged 30+ years.
From COMPEAP (2022), a 10 µg/m3 increased in PM2.5 equates to a relative risk of 1.08 (i.e. an 8% risk), and using this information a population weighted modelled annual average background PM2.5 concentration x, RR is calculated as (1.08)(x/10) (from Public Health England, 2014). The ‘attributable fraction’ of deaths or fraction of deaths attributable to PM2.5 is expressed as a percentage, calculated as 100*(RR-1)/RR.
Population weighted annual average concentrations of PM2.5 were provided by Ricardo Energy and Environment for all lower tier and unitary local authorities within England, as well as combined at upper tier, regional and national level.
Thus with a estimate of 7.2 µg/m3 for PM2.5 for 2023 above, the relative risk for Hull would be 1.080.72 which is 1.057, and the attributable fraction would be 100*(RR-1)/RR or 100*0.057/1.057 or 5.7, i.e. 5.4% for the fractions of deaths attributable to PM2.5 in Hull for 2023.
The fraction of deaths attributable to air pollution at 5.4% is among the highest in the region. Again, this is not surprising as it will be higher in cities especially for Hull with its relatively unique position of having tight geographical boundaries.
Compared with benchmark
Better
Similar
Worse
Not Compared
Lower
Similar
Higher
| Indicator | Period | England | Yorkshire and the Humber region (statistical) | Kingston upon Hull | East Riding of Yorkshire | North East Lincolnshire | North Lincolnshire | York | North Yorkshire UA | Barnsley | Doncaster | Rotherham | Sheffield | Bradford | Calderdale | Kirklees | Leeds | Wakefield |
|---|---|---|---|---|---|---|---|---|---|---|---|---|---|---|---|---|---|---|
Air pollution: estimated fraction of mortality attributable to particulate air pollution (Persons 30+ yrs) | 2024 | 5.3 | 5.2 | 5.6 | 4.8 | 5.5 | 5.4 | 4.5 | 4.1 | 5.3 | 5.5 | 5.6 | 5.5 | 5.2 | 4.9 | 5.3 | 5.5 | 5.4 |
| Indicator | Period | England | Yorkshire and the Humber region (statistical) | Kingston upon Hull | East Riding of Yorkshire | North East Lincolnshire | North Lincolnshire | York | North Yorkshire UA | Barnsley | Doncaster | Rotherham | Sheffield | Bradford | Calderdale | Kirklees | Leeds | Wakefield |
|---|---|---|---|---|---|---|---|---|---|---|---|---|---|---|---|---|---|---|
Air pollution: estimated fraction of mortality attributable to particulate air pollution (Persons 30+ yrs) | 2024 | 5.3 | 5.2 | 5.6 | 4.8 | 5.5 | 5.4 | 4.5 | 4.1 | 5.3 | 5.5 | 5.6 | 5.5 | 5.2 | 4.9 | 5.3 | 5.5 | 5.4 |
The percentage of deaths attributable to PM2.5 in Hull has decreased from 2018 and 2019 when it was over 7% to 5.4% in 2020. The percentage increased to 5.7% in 2021, but has subsequently fallen to 5.4% for 2023 which is the same as it was for 2020.
Compared with benchmark
Better
Similar
Worse
Not Compared
Lower
Similar
Higher
Air pollution: estimated fraction of mortality attributable to particulate air pollution (Persons 30+ yrs)
|
Period
|
Kingston upon Hull |
Yorkshire and the Humber region (statistical)
|
England
|
||||
|---|---|---|---|---|---|---|---|
|
Count
|
Value
|
95%
Lower CI |
95%
Upper CI |
||||
| 2018 | • | - | 7.2% | - | - | 6.1% | 7.1% |
| 2019 | • | - | 7.1% | - | - | 6.6% | 7.1% |
| 2020 | • | - | 5.4% | - | - | 5.0% | 5.6% |
| 2021 | • | - | 5.7% | - | - | 5.0% | 5.5% |
| 2022 | • | - | 5.6% | - | - | 5.1% | 5.8% |
| 2023 | • | - | 5.4% | - | - | 5.1% | 5.2% |
| 2024 | • | - | 5.6% | - | - | 5.2% | 5.3% |
Source: Department for Environment, Food and Rural Affairs
The impact of air pollution on health will not affect everyone the same, and it is likely that people living in more deprived areas who are more likely to have more ill health and comorbidities are more likely to be affected by poor air quality compared to people living in less deprived areas. Housing conditions may also be worse in more deprived areas which could impact on indoor air pollution levels.
Strategic Need and Service Provision
Hull’s improving year on year trend relating to air quality has been maintained with the Council’s Air Quality Strategy, and an increase in background levels are prevented. Continuing to raise awareness of the health and financial benefits of good air quality is a key measure in encouraging behaviour change and less polluting lifestyle choices.
It is necessary to work together to maintain and expand an environment that promotes active travel for all ages in order to reduce the impact on air pollution from cars. Food production also has a substantial impact on air pollution, particularly meat and manufactured food products. Raising awareness of this and encouraging people to buy locally produced food could all help to reduce air pollution levels.
It is important that any measures in the proposed climate change strategy and proposed action plan consider the implications on and as far as possible complement those in the Air Quality Strategy, as some could have a detrimental impact on air quality. For example, monitoring during the COVID-19 lockdown indicates that as direct emissions from vehicles decrease (mono nitrogen oxide and nitrogen dioxide combined) it has the potential to result in an increase in the concentrations of other potentially harmful gases, such as ozone, and only a minimal reduction in the emissions of particulate matter. This has implications and will need to be considered when advocating a change to electric vehicles.
Resources
HM Government, The Clean Growth Strategy: Leading the way to a low carbon future. 2017, HM Government: London.
Office for Health Improvement & Disparities’ Fingertips. https://fingertips.phe.org.uk/
Public Health England (now Office for Health Improvement & Disparities). Estimating local mortality burdens associated with particulate air pollution, 2014. https://www.gov.uk/government/publications/particulate-air-pollution-quantifying-effects-on-mortality
Hull 2020 Carbon Neutral Strategy. Hull City Council, 2020. http://www.hull.gov.uk/environment/pollution/hull-2030-carbon-neutral-strategy
Updates
This page was last updated / checked on 30 January 2026.
This page is due to be updated / checked in November 2026.
Where Do I Find The Information I Want?
Each topic has a separate page, and is arranged under different Main Menu headings as follows: Home, Population, Vulnerable Groups, Adults, Children and Young People, Place, Health and Wellbeing Influences, and Tools and Resources.
To access the Main Menu, click on Show Navigation (or box with lines) in the top right corner of the page, then click on the down arrows to go to Sub Menu items or individual topic pages.
A Contents Page / Site Map has also been produced which gives a list of all the topic pages beneath the Main Menu headings.
Under Home, Hull’s JSNA provides information on what a JSNA is, who it is for, who produces it, and information on where the statistics come from.
Under Home, the Key Facts for Hull which provides a summary of the health and wellbeing needs of Hull’s population.
Under Population, there is information on population estimates and projections, race and ethnicity, life expectancy, and causes of death.
Under the Adults and Children and Young People, there are headings for Health Factors and Lifestyle Factors. Under Adults, Health Factors covers general health, emotional wellbeing and oral health, and information relating to various diseases and medical conditions for adults including other topics such as neurodiversity, end of life and palliative care, falls and frailty, sexual health and suicide. Under Children and Young People, Health Factors covers Special Educational Needs or Disabilities, accidents and injuries, A&E attendances and hospital admissions, screening and vaccinations, and under 18 conceptions for children and young people. Lifestyle Factors includes information relating to lifestyle and behavioural risk factors, such as diet, physical activity, healthy weight, smoking, alcohol, drugs and gambling. There is another subheading for adults for Prevention which covers vaccinations and screening including the NHS Health Check. Within the Children and Young People menu, there are two further submenus: Pregnancy and Infants which covers pregnancy and maternal health, births and infant health, breastfeeding, smoking in pregnancy, stillbirths and infant mortality, and Child Development which covers early years and good child development as well as providing information on Hull’s Early Help and Prevention programme.
Under Vulnerable Groups, there is further information on specific groups such as carers, children in care and care leavers, gender identity and LGTBQ+, Gypsy and Travellers, and people who are homeless, people who have learning disabilities, people who have mental ill health, people who have multiple unmet needs, people with sensory impairment and Veterans. There is also a page for Inclusion Health which displays the Office for Health Improvement & Disparities’ Inclusion Health Data and Intelligence Resource.
Under Health and Wellbeing Influences, there is information on some of the wider determinants of health and wellbeing which include deprivation and poverty, housing, air pollution, climate change, schools, education and qualifications, employment, economy and healthy workplaces, young people not in education, employment or training, crime, domestic abuse, and financial resilience.
Under Place, there is further information about Hull as a geographical area, and health and wellbeing profiles for each electoral ward and Area Committee Area in Hull as well information on primary care and Hull’s GP practices and Primary Care Networks (groups of GP practices).
Under Tools and Resources, further information can be found on Hull’s Adult and Young People Health and Wellbeing Surveys and a summary of the prevalence of various diseases and medical conditions at GP practice level throughout Hull (from the Quality and Outcomes Framework data) as well as links to our Glossary, and links to other associated documents such as the Director of Public Health Annual reports, the local Health and Wellbeing Strategy, and Hull’s Pharmaceutical Needs Assessment. This section also provide information on where to report an outbreak of an infectious disease or other health-related issue (such as noise) as well as our contact details if you would like further information or have questions relating to health and wellbeing needs of Hull’s population or relating to Hull’s Joint Strategic Needs Assessment.
If you require further information please Contact Us.
Updates
This page was last updated on 12 March 2026.
This page is due to be updated / checked in March 2027.
Contents Page / Site Map
Each topic has a separate page.
The pages can be accessed through the Main Menu which is shown by clicking on Show Navigation (or by clicking on the square box with lines in at the top right corner of the website).
Once the Main Menu is shown, you can click on the down arrows beside each topic to access all the Sub Menus or individual topic pages.
Under the Main Menu or Sub Menus, all the individual topic pages are listed. Click on the name of the page to access the page you require.
Note that each Main Menu item and Sub Menu item also has a page to itself, so if you click on these main menu or sub menu items you will go to that page rather then the individual topic areas beneath them. Click on the down arrows to go to items below. All these main menu and sub menu pages include links to all the pages below them in the menu hierarchy so you can use these pages to navigate too.
Once you open a page (a Main Menu page, Sub Menu page or an individual topic page) at the top of the screen, it says “You are here: ……” You can click on the links to move back up to the Main Menu or access the Home page from here.
There is a lot of overlap between topic areas, but the following table provides a list of all the topic pages (site map) and where the topics are in the menu hierarchy in relation to the Main Menu and Sub Menus.
At the top of each page, there is a section which gives information on where associated information can be found. For instance, on the Population Estimates page, there is a link to the Population Projections page.
| Main Menu | Sub Menu | Individual Topic Page |
| Home | Hull’s JSNA (about the JSNA) | |
| Home | Key Facts for Hull | |
| Population | Population Estimates | |
| Population | Race and Ethnicity | |
| Population | Population Projections | |
| Population | Life Expectancy and Healthy Life Expectancy | |
| Population | Causes of Death | |
| Vulnerable Groups | Carers | |
| Vulnerable Groups | Children with Special Educational Needs or Disabilities | |
| Vulnerable Groups | Gender Identity and LGBTQ+ | |
| Vulnerable Groups | Gypsy and Travellers | |
| Vulnerable Groups | Homelessness | |
| Vulnerable Groups | Inclusion Health | |
| Vulnerable Groups | Learning Disabilities | |
| Vulnerable Groups | Looked After Children and Care Leavers | |
| Vulnerable Groups | Mental Ill Health | |
| Vulnerable Groups | Migrant Health | |
| Vulnerable Groups | Multiple Unmet Needs | |
| Vulnerable Groups | Sensory Impairment | |
| Vulnerable Groups | Veterans | |
| Adults | Health Factors | Physical Health |
| Adults | Health Factors | Mental Health and Emotional Wellbeing |
| Adults | Health Factors | Cancer |
| Adults | Health Factors | Cardiovascular Disease |
| Adults | Health Factors | Coronavirus (COVID-19) |
| Adults | Health Factors | Dementia |
| Adults | Health Factors | Diabetes |
| Adults | Health Factors | Falls and Frailty |
| Adults | Health Factors | Infectious Diseases |
| Adults | Health Factors | Kidney Disease |
| Adults | Health Factors | Liver Disease |
| Adults | Health Factors | Musculoskeletal Disorders |
| Adults | Health Factors | Oral Health |
| Adults | Health Factors | Palliative Care and End of Life |
| Adults | Health Factors | Respiratory Disease |
| Adults | Health Factors | Sexual and Reproductive Health |
| Adults | Health Factors | Sexually Transmitted Infections |
| Adults | Health Factors | Suicide and Self-Harm |
| Adults | Lifestyle Factors | Alcohol |
| Adults | Lifestyle Factors | Diet and Nutrition |
| Adults | Lifestyle Factors | Drugs |
| Adults | Lifestyle Factors | Gambling |
| Adults | Lifestyle Factors | Healthy Weight |
| Adults | Lifestyle Factors | Physical Activity |
| Adults | Lifestyle Factors | Smoking and Vaping |
| Adults | Prevention | Screening and the NHS Health Check |
| Adults | Prevention | Vaccinations |
| Children and Young People | Health Factors | Physical Health |
| Children and Young People | Health Factors | Mental Health and Emotional Wellbeing |
| Children and Young People | Health Factors | A&E Attendances and Hospital Admissions |
| Children and Young People | Health Factors | Accidents and Injuries |
| Children and Young People | Health Factors | Oral Health |
| Children and Young People | Health Factors | Screening and Vaccinations |
| Children and Young People | Health Factors | Under 18 Conceptions |
| Children and Young People | Lifestyle Factors | Alcohol |
| Children and Young People | Lifestyle Factors | Diet and Nutrition |
| Children and Young People | Lifestyle Factors | Drugs |
| Children and Young People | Lifestyle Factors | Gambling |
| Children and Young People | Lifestyle Factors | Healthy Weight |
| Children and Young People | Lifestyle Factors | Physical Activity |
| Children and Young People | Lifestyle Factors | Smoking and Vaping |
| Children and Young People | Pregnancy and Infants | Pregnancy and Maternal Health |
| Children and Young People | Pregnancy and Infants | Births and Infant Health |
| Children and Young People | Pregnancy and Infants | Breastfeeding |
| Children and Young People | Pregnancy and Infants | Smoking in Pregnancy |
| Children and Young People | Pregnancy and Infants | Stillbirths and Infant Mortality |
| Children and Young People | Child Development | Early Years and Good Child Development |
| Children and Young People | Child Development | Early Help and Prevention Programme |
| Place | Geographical Area | |
| Place | Ward Profiles | |
| Place | Primary Care Profiles | |
| Health and Wellbeing Influences | Air Pollution | |
| Health and Wellbeing Influences | Climate Change | |
| Health and Wellbeing Influences | Crime | |
| Health and Wellbeing Influences | Deprivation and Poverty | |
| Health and Wellbeing Influences | Domestic Abuse | |
| Health and Wellbeing Influences | Employment and the Labour Market | |
| Health and Wellbeing Influences | Financial Resilience | |
| Health and Wellbeing Influences | Housing and Households | |
| Health and Wellbeing Influences | Schools, Education and Qualifications | |
| Health and Wellbeing Influences | Young People Not in Education, Employment or Training | |
| Tools and Resources | Contact Us | |
| Tools and Resources | Help – Glossary and Site Map | Glossary |
| Tools and Resources | Help – Glossary and Site Map | Where Do I Find the Information I Want? |
| Tools and Resources | Help – Glossary and Site Map | Contents Page / Site Map (this page) |
| Tools and Resources | Surveys Conducted in Hull | Local Surveys Involving Adults |
| Tools and Resources | Surveys Conducted in Hull | Local Surveys Involving Young People |
| Tools and Resources | Surveys Conducted in Hull | Other Local Surveys and Research |
| Tools and Resources | Local Quality and Outcomes Framework Data | |
| Tools and Resources | Director of Public Health Annual Reports | |
| Tools and Resources | Health and Wellbeing Strategy | |
| Tools and Resources | Pharmaceutical Needs Assessment | |
| Tools and Resources | Reporting an Outbreak or Other Issue |
If you cannot find the information you require, please contact us at [email protected]
Updates
This page was last updated / checked on 12 March 2026.
This page is due to be updated / checked in March 2027.
Physical Health Among Children and Young People
This topic area covers statistics and information relating to physical health status among children and young people in Hull including local strategic need and service provision. Further information relating to Physical Health Among Adults is given under Lifestyle Factors within Adults. General health information has been collected within Hull’s Health and Wellbeing Surveys and full reports are available under Surveys within Tools and Resources.
Summary Infographic
Headlines
- Better health is central to human happiness and well-being. It also makes an important contribution to economic progress, as healthy populations live longer, are more productive, and save more. This affects everyone in society – individuals, families and the wider community. Poverty and deprivation as well as many other factors have an adverse impact on health.
- There are huge inequalities in Hull in relation to physical health which impacts greatly on all aspects of life and wellbeing.
- From a local survey conducted among secondary school pupils in 2024, self-reported health was better among males compared to females, and better among younger pupils. Overall, 36.3% of males reported their health as very good, 38.1% as good, 17.5% as OK, 4.8% as poor and 3.3% as very poor. Among females, 24.2% reported their health as very good, 40.0% as good, 25.1% as OK, 7.3% as poor and 3.4% as very poor.
- One in six boys and one in ten girls stated they had a long-term illness or disability which limited their daily activities.
- Young people who had a long-term illness or disability which limited their daily activities were more likely to smoke, vape, drink alcohol, eat a less healthy diet and not undertake physical activity compared to their peers. They were also more likely to have been bullied, have poorer mental health, feel unsafe, and worry more frequently.
The Population Affected – Why Is It Important?
Better health is central to human happiness and well-being. It also makes an important contribution to economic progress, as healthy populations live longer, are more productive, and save more. Poverty and deprivation and many associated factors such as poor housing, crime, lack of qualifications and unemployment also indirectly influence health. People who live in less affluent areas are likely to have poorer access to healthcare and other services. The circumstances people live in can make it harder to live healthily, and psychosocial stress leads to physical harm. Furthermore, many people with disabilities or very poor health have impaired education, training and employment opportunities and are so more likely to live in relative poverty which further impacts on physical health and emotional wellbeing, creating a vicious circle of cause and consequence.
There is a high number of children growing up in poverty in Hull, and this means that the health of children in Hull is adversely affected by poverty and deprivation. Furthermore, children growing up in households where families adopt unhealthy lifestyles and behaviours are also much more likely to undertake these same behaviours as adults. So it is important that children are given the best start in life to maximise their physical health as well as their emotional wellbeing.
There may be a change in services available as young people who are ill or have long-term medical conditions and diseases such as diabetes, learning disabilities, special educational needs or mental health as they transition into adulthood. Continuity of care is important in order to facilitate a smooth transition into adulthood, and ensure they receive the best care.
The Hull Picture
Self-Reported Health Status
In the local Young People Health and Wellbeing Survey conducted during 2024 among secondary school pupils, self-reported health was better among males compared to females, and better among younger pupils. Overall, 36.3% as very good, 38.1% as good, 17.51% as OK, 4.8% as poor and 3.3% as very poor. Among females, 24.2% as very good, 40.0% as good, 7.3% as OK, 3.4% as poor and 3.4% as very poor. Among year 7 boys (aged 11-12 years), 2.9% reported their health as very poor but this almost doubled to 5.6% among year 11 boys (aged 15-16 years). The age differences were similar for girls with 3.3% reporting very poor health among year 7 children compared to 5.6% among those in year 10 (aged 14-15), although only 0.9% among year 11 girls. Younger pupils were the most likely to report very good health, with 34.3% and 26.7% of year 7 boys and girls respectively reporting their health as very good compared to 26.0% and 21.9% of year 11 boys and girls respectively.
Among young people living in the most deprived fifth of areas of Hull (based on the Index of Multiple Deprivation 2019), 73.6% reported very good or good health, but the percentage was slightly higher at 79.7% among young people who lived in the least deprived fifth of areas of Hull.
Young people in good physical health were less likely than those in poor health to smoke, vape or drink alcohol.
Long-Term Illness or Disability Which Limited Daily Activities
One in six boys and one in ten girls stated they had a long-term illness or disability which limited their daily activities. Among males, the percentage reduced with age from 18.9% among year 7 boys to 14.4% among year 11 boys, although in females the percentage tended to increase with age although it was highest among year 10 girls at 11.6%.
There was no substantial differences in the percentages of young people who stated they had a long-term illness or disability which limited their daily activities by deprivation. Among young people living in the most deprived fifth of areas of Hull, 13.7% reported a long-term illness or disability which limited their daily activities, but this was 15.5% for the second most deprived fifth, 16.1% for the middle fifth, 12.9% for the second least deprived fifth and 13.2% for young people living in the least deprived fifth of areas of Hull.
Young people stated they had a long-term illness or disability which limited their daily activities were more likely than their peers to smoke (12% versus 8%) and drink alcohol (24% versus 18%). They were also more likely to have tried smoking (15% versus 9%), vaping (35% versus 26%) and alcohol (57% versus 46%).
They were also more likely to state they don’t usually eat a healthy diet (25% versus 15%), and eat no portions of fruit and vegetables (14% versus 10%).
They were also more likely to have had no days in the last seven days where they did 60 minutes of physical activity than their peers (14% versus 8%).
Young people stated they had a long-term illness or disability which limited their daily activities were less likely than their peer to report good or very good physical health (51% versus 68%) and good or very good mental health (38% versus 47%), and more likely to report poor or very poor physical health (26% versus 10%) and poor or very poor mental health (44% versus 27%).
Young people stated they had a long-term illness or disability which limited their daily activities were also more likely to worry quite a lot or a lot.
| Topic of worry | All young people (% worrying) | Activities limited (% worrying) |
| Homework | 19 | 27 |
| School tests or exams | 42 | 50 |
| My health | 24 | 32 |
| Someone else’s health | 30 | 43 |
| Getting a job | 29 | 38 |
| Money | 35 | 37 |
| Relationships and friends | 43 | 52 |
| Family | 43 | 48 |
| How I look | 44 | 49 |
| My identity | 20 | 28 |
| My weight | 34 | 40 |
| Feeling lonely | 26 | 34 |
| Bullying | 17 | 26 |
| Staying safe online | 10 | 14 |
| Gangs | 13 | 18 |
| Violence | 15 | 20 |
| Pressure to do things I don’t want to do | 17 | 23 |
| Climate change | 10 | 13 |
| COVID-19 | 6 | 9 |
Strategic Need and Service Provision
There are inequalities in relation to heath with people living in the more deprived areas having worse health earlier than those living in less deprived areas in Hull. It is necessary to help improve the circumstances of those living in the most deprived areas of Hull with services working together, and with the people living in those communities to improve health and reduce inequalities.
Resources
Hull’s Young People Health and Wellbeing Surveys
National Institute for Health and Care Research. Young children from deprived areas are more at risk of serious burns and scalds. https://evidence.nihr.ac.uk/alert/young-children-from-deprived-areas-are-more-at-risk-of-serious-burns-and-scalds/
Orton E, Kendrick D, West J, and Tata LJ. Persistence of Health Inequalities in Childhood Injury in the UK; A Population-Based Cohort Study of Children under 5. PLoS ONE 9(10): e111631. https://journals.plos.org/plosone/article?id=10.1371/journal.pone.0111631
Updates
This page was last updated / checked on 20 April 2026.
This page is due to be updated / checked in January 2027.