Index
This topic area covers statistics and information relating to Hull’s resident population including the age and gender structure of the local population, numbers registered with local GPs including local strategic need and service provision. Further information relating to population including Race and Ethnicity and Population Projections are given within Population.
Each year, the Office for National Statistics publish resident population estimates for the mid-year for England, then estimates at local authority level and then estimates at lower geographical levels (e.g. wards). This means that some information contained on this page may relate to different time periods. The 2021 Census contained additional information on population such as household composition which is presented under Housing and Households within Health and Wellbeing Influences.
This page contains information from the Office for Health Improvement & Disparities’ Fingertips. Information is taken ‘live’ from the site so uses the latest available data from Fingertips and displays it on this page. As a result, some comments on this page may relate to an earlier period of time until this page is next updated (see review dates at the end of this page).
Summary Infographic
Headlines
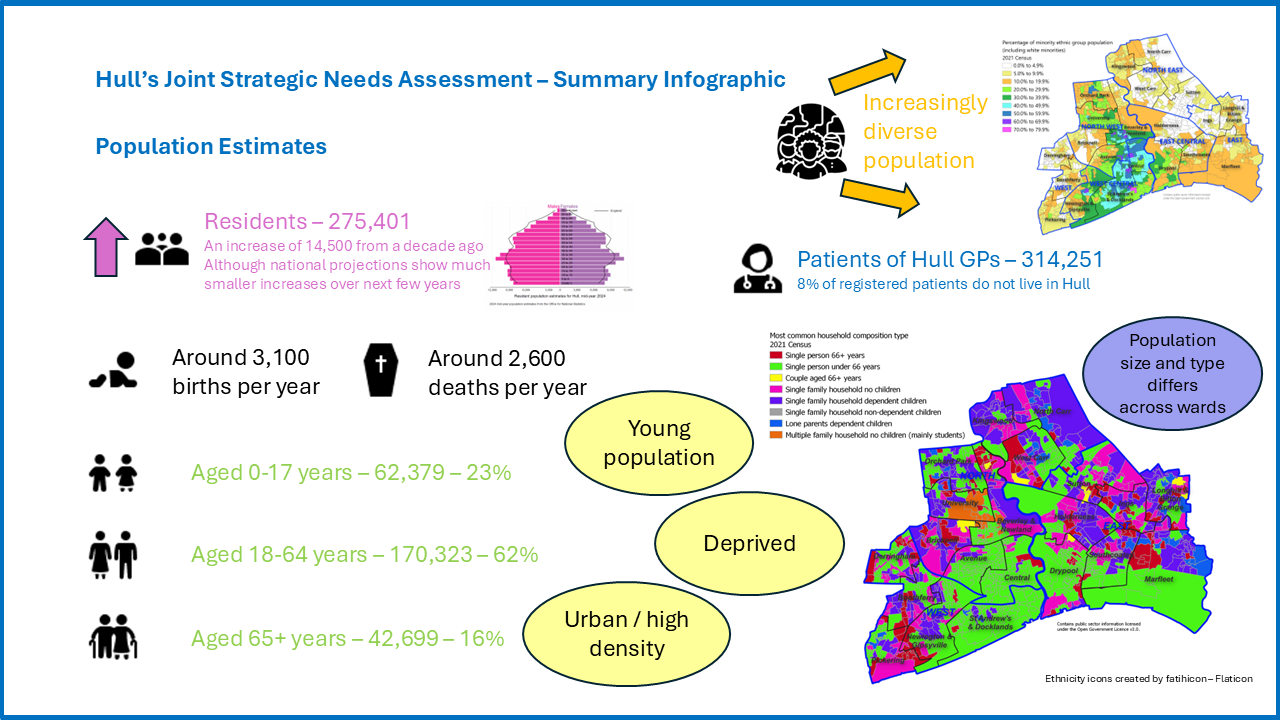
- People have different health and wellbeing needs at different ages and stages of their lives so it is important to understand the structure of the local population, not just in terms of their gender and current ages, but in terms of future projections of population numbers as well as other factors which influence health need such as deprivation, housing, employment, etc as well as where different groups of people live in the city. This is necessary in order to plan services, improve health and reduce inequalities.
- From the 2024 mid-year figures, it is estimated that 275,401 people live in Hull. This is an increase of 2,322 from the 2023 mid-year estimate and an increase of 14,505 from a decade ago (mid-year 2014 population). From the 2021 Census, it was estimated that there are 115,500 households with at least one usual resident.
- Hull has a relatively large population aged 20-39 years. Young people tend to move into cities to both study and work, so Hull is no different from many other cities. Hull’s population is younger than the population of England overall. Within Hull, the percentage of under 18s is higher and the percentage aged 65+ years is lower than all other local authorities in the Yorkshire and Humber region with the exception of Bradford.
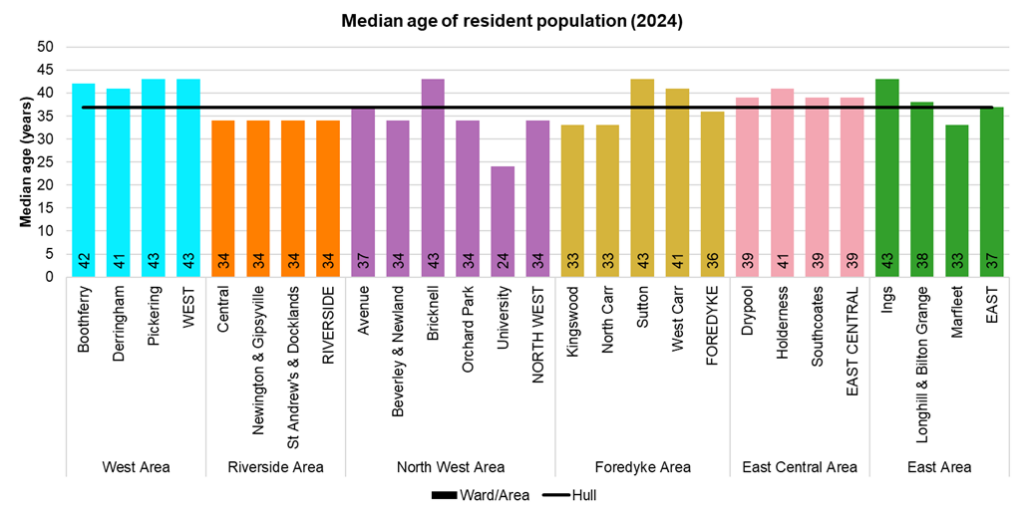
- From the 2024 mid-year population estimates, the age structure of Hull’s population differs substantially across Hull’s 21 electoral wards. Bricknell, Ings and Sutton wards have the oldest populations with half of residents aged 43 years or older, closely followed by Boothferry, and Pickering wards where half of residents are aged 42 years or older. University has a much younger population compared to all other wards in Hull with half of its residents aged 24 years or younger. Marfleet, North Carr and Kingswood wards have relatively young populations with half of residents aged 33 years or younger, as do St Andrew’s & Docklands, Newington & Gipsyville, Orchard Park and Beverley & Newland wards, with half of their residents aged 34 years or younger.
- Whilst the geographical boundaries are the same for the local authority and the the NHS (sub Integrated Care Board), the populations differ. In general, the local authority commissions services for the residents whereas the sub-ICB provides care for the patients registered with GP practices within Hull. From the GP registration file in July 2025, a total of 319,503 people were registered with a Hull GP and/or lived in Hull. Overall, 289,361 were registered with a Hull GP and lived in Hull, 5,252 lived in Hull but were registered with a GP outside of Hull (mainly East Riding of Yorkshire) and 24,890 were registered with a Hull GP but lived outside of Hull (mainly East Riding of Yorkshire). Overall, 314,251 patients were registered with Hull GPs.
- Based on the GP registration file, 294,613 people lived in Hull which is considerably higher (by around 19,200 people) than the estimated mid-year 2024 resident population. Both estimates are subject to assumptions or errors, but it is likely that the GP registration file overestimates the population. It is also possible that the Census and the annual mid-year estimates from the Office of National Statistics slightly underestimates the resident population.
- When delivering care through primary care, the differences in the populations need to be considered as just under one in every 12 patients registered with Hull GPs live outside Hull (just under 24,000 patients in total and 7.9% of all patients registered with Hull GPs), although the percentages of East Riding of Yorkshire residents varies dramatically across Hull’s 25 GP practices (from 1.5% to 52.7% of all registered patients).
- Furthermore, the Hull travel-to-work areas – which covers a large percentage of East Riding of Yorkshire – has one of the highest levels of commuter self-containment in the country. This means that Hull has high levels of visitor daytime populations who visit Hull for work and study reasons. Furthermore, due to the high concentration of retail, sporting and leisure facilities in Hull in close proximity to a high number of East Riding of Yorkshire residents in particular, there are a high number of visitors to Hull both during the day and evening across all age groups for retail, sporting, leisure and other purposes particularly at the weekend. As the nearest A&E for many East Riding of Yorkshire residents is located within Hull, this means that – together with the East Riding of Yorkshire residents registered with Hull GPs – there are significant cross-boundary flows into Hull in relation to the need for health-related services.
The Population Affected – Why is it Important?
In order to improve health and reduce inequalities, it is important to understand the make-up of the local population. People at different ages and stages of their lives have different health needs. Furthermore, other characteristics such as ethnicity, socio-economic group, deprivation, poverty, gender, age, sexuality, religion and other factors may have differing health needs and also seek professional medical help to a lesser or greater degree or have problems accessing services compared to others. Certain geographical areas will have higher proportions of specific populations such as couples with young families, older people, students, and other groups and this will influence the health needs for different geographical areas. Understanding the population is an essential tool in determining current and future health needs in order to plan services, improve health and reduce inequalities.
The Hull Picture
Resident Population
From the Office for National Statistics mid-year population figures, it is estimated that there are 275,401 residents of Hull in 2024. This is an increase of 2,332 from the 2023 mid-year estimate and an increase of 14,505 from a decade ago (mid-year 2014 population).
There was quite an even split in Hull between men (138,530) and women (136,871).
Each five year age band from 0-4 to 60-64 contains between 5.5% and 6.6% (between 15,206 and 17,936 people) of the overall population with the exception of those aged 25-39 years which are slightly higher (between 7.2% and 8.3%) due to former students and other young people living in the city (between 19,833and 22,845 people). Overall, there are an estimated 42,699 people aged 65+ years living in Hull representing 15.5% of Hull’s total population.
Around one quarter (25.4%) of Hull’s population was aged 0-19 years, one-quarter (24.9%) are aged 20-36 years, one quarter (24.9%) are aged 37-56 years and just under one-quarter (24.9%) are aged 57+ years.
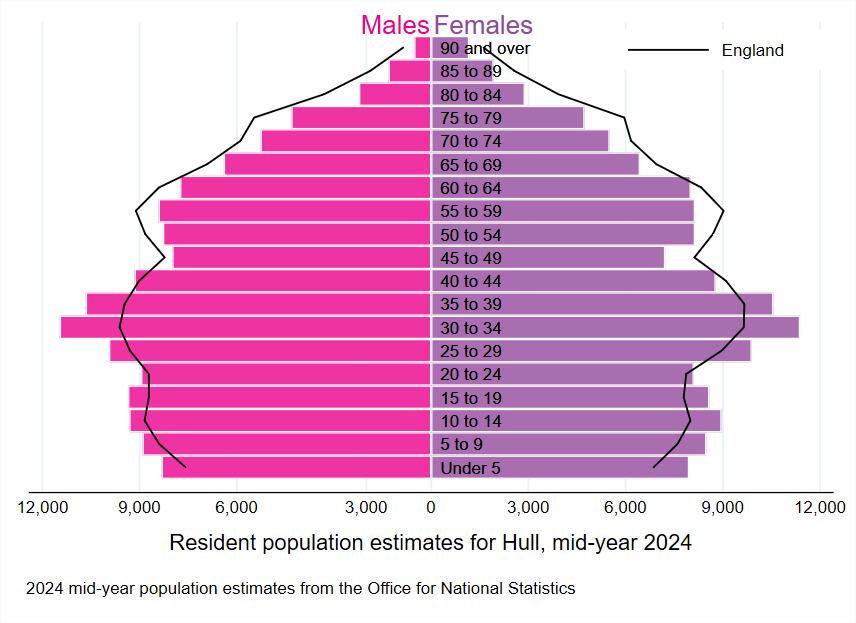
The population pyramid shows the age and gender structure of Hull’s population compared to England using the mid-year 2024 population estimates.
For each five year age group, there are higher percentages of people aged under 40 years living in Hull. In Hull, the majority of the population are aged under 40 years (54.8%) compared to around half of the population for England (49.7%).
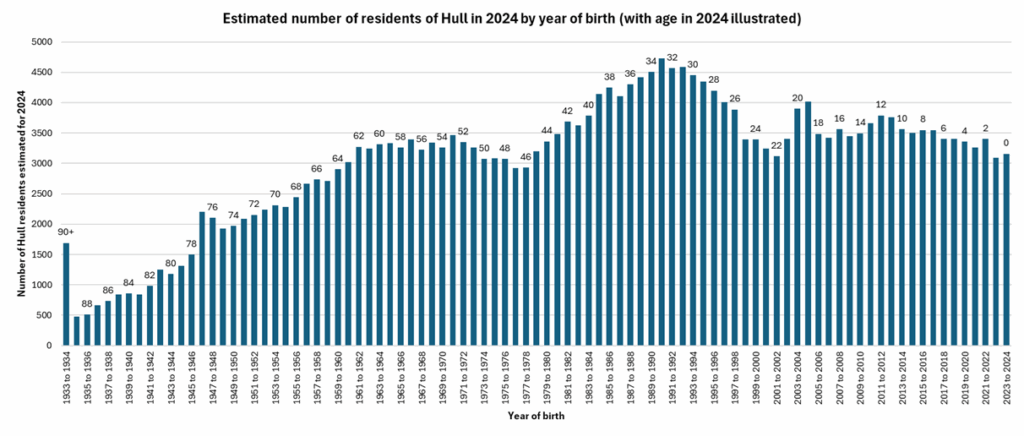
The numbers by single year of age are also illustrated in the following graph by the year of birth. It can be seen that the numbers aged 80+ years in Hull could increase in the next five years or so as the people born between 1946 and 1949 immediately following World War II reach the age of 80 years. It is estimated that there are over 2,200 residents in Hull aged 77 years in 2024, but that there are around half this number of residents aged 80 years. Whilst the number that reach 80 years may reduced slightly with death and migration, this represents a relatively large step up increase in the 80+ year age group.
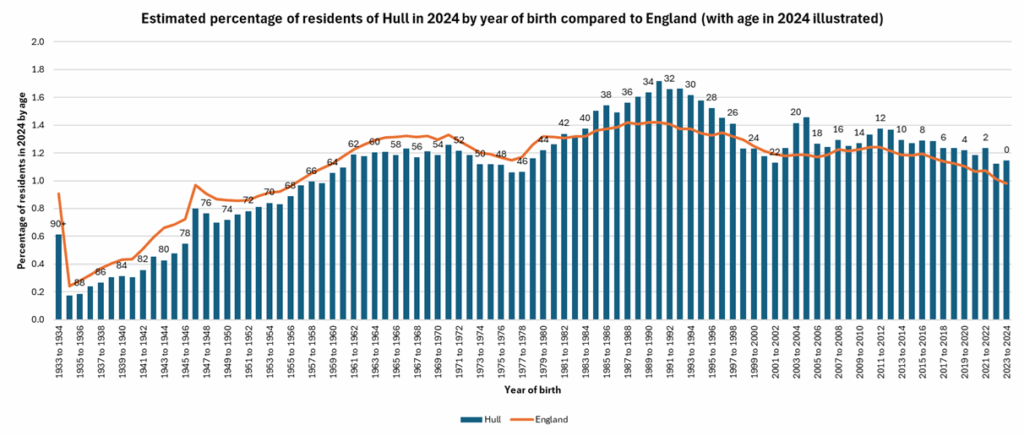
The profiles of ages for England differs as illustrated above, but when examined as a single year of age with males and females combined, it becomes easier to see the differences. There are children and young people in Hull compared to England as well as more people aged 19-20 years and 25-39 years, and fewer people aged 40+ years. The differences in the percentage of population aged 25-39 years is quite noticeable, and in part is likely associated with the increased international migration among this age group.
Based on the Office for National Statistics mid-year 2024 population figures , Hull had a higher percentage of people aged under 18 years and a lower percentage of people aged 65+ years compared to the majority of other local authorities across the Yorkshire and Humber region. Within the region, only Bradford had a higher percentage of under 18s and a similar percentage aged 65+ years compared to Hull.
Compared with benchmark
| Indicator | Period | England | Yorkshire and the Humber region (statistical) | Kingston upon Hull | East Riding of Yorkshire | North East Lincolnshire | North Lincolnshire | York | North Yorkshire UA | Barnsley | Doncaster | Rotherham | Sheffield | Bradford | Calderdale | Kirklees | Leeds | Wakefield |
|---|---|---|---|---|---|---|---|---|---|---|---|---|---|---|---|---|---|---|
Supporting information - % population aged under 18 (Persons <18 yrs) | 2024 | 20.8 | 20.8 | 22.7 | 17.7 | 21.0 | 20.2 | 16.6 | 18.2 | 20.6 | 21.4 | 21.5 | 20.0 | 25.3 | 21.4 | 22.3 | 20.9 | 21.1 |
Supporting information - % population aged 65+ (Persons 65+ yrs) | 2024 | 18.7 | 19.3 | 15.5 | 27.1 | 21.6 | 22.9 | 19.2 | 26.0 | 20.1 | 19.6 | 19.7 | 16.8 | 15.5 | 19.6 | 18.1 | 15.6 | 19.1 |
Between 2021 and 2024, it is estimated that the total number of people aged under 18 years living in Hull increased from 59,054 (or 22.2% of the population) to 62,379 (or 22.7% of the population).
Compared with benchmark
Supporting information - % population aged under 18 (Persons <18 yrs)
|
Period
|
Kingston upon Hull |
Yorkshire and the Humber region (statistical)
|
England
|
||||
|---|---|---|---|---|---|---|---|
|
Count
|
Value
|
95%
Lower CI |
95%
Upper CI |
||||
| 2010 | • | 54520 | 21.3% | 21.1% | 21.4% | 21.4% | 21.4% |
| 2011 | • | 54717 | 21.4% | 21.2% | 21.5% | 21.3% | 21.4% |
| 2012 | • | 55079 | 21.3% | 21.2% | 21.5% | 21.3% | 21.3% |
| 2013 | • | 55757 | 21.5% | 21.4% | 21.7% | 21.3% | 21.3% |
| 2014 | • | 56144 | 21.5% | 21.4% | 21.7% | 21.2% | 21.2% |
| 2015 | • | 56504 | 21.5% | 21.4% | 21.7% | 21.2% | 21.2% |
| 2016 | • | 57232 | 21.6% | 21.4% | 21.7% | 21.1% | 21.1% |
| 2017 | • | 57746 | 21.6% | 21.4% | 21.7% | 21.1% | 21.1% |
| 2018 | • | 58260 | 21.7% | 21.6% | 21.9% | 21.1% | 21.0% |
| 2019 | • | 58835 | 21.9% | 21.7% | 22.0% | 21.0% | 21.0% |
| 2020 | • | 59130 | 22.1% | 21.9% | 22.3% | 21.0% | 20.9% |
| 2021 | • | 59054 | 22.2% | 22.0% | 22.3% | 20.9% | 20.8% |
| 2022 | • | 60190 | 22.4% | 22.2% | 22.6% | 20.9% | 20.8% |
| 2023 | • | 61596 | 22.6% | 22.4% | 22.7% | 20.9% | 20.8% |
| 2024 | • | 62379 | 22.7% | 22.5% | 22.8% | 20.8% | 20.8% |
Source: Office for National Statistics
Between 2021 and 2024, it is estimated that the total number of people aged 65+ years living in Hull increased from 41,118 (or 15.4% of the population) to 42,699 (or 15.5% of the population).
Compared with benchmark
Supporting information - % population aged 65+ (Persons 65+ yrs)
|
Period
|
Kingston upon Hull |
Yorkshire and the Humber region (statistical)
|
England
|
||||
|---|---|---|---|---|---|---|---|
|
Count
|
Value
|
95%
Lower CI |
95%
Upper CI |
||||
| 2010 | • | 35659 | 13.9% | 13.8% | 14.1% | 16.5% | 16.3% |
| 2011 | • | 35907 | 14.0% | 13.9% | 14.2% | 16.7% | 16.4% |
| 2012 | • | 36886 | 14.3% | 14.2% | 14.4% | 17.2% | 16.9% |
| 2013 | • | 37740 | 14.6% | 14.4% | 14.7% | 17.5% | 17.2% |
| 2014 | • | 38172 | 14.6% | 14.5% | 14.8% | 17.8% | 17.5% |
| 2015 | • | 38353 | 14.6% | 14.5% | 14.7% | 18.1% | 17.6% |
| 2016 | • | 38870 | 14.6% | 14.5% | 14.8% | 18.2% | 17.8% |
| 2017 | • | 39206 | 14.7% | 14.5% | 14.8% | 18.4% | 17.9% |
| 2018 | • | 39686 | 14.8% | 14.7% | 14.9% | 18.6% | 18.0% |
| 2019 | • | 40216 | 15.0% | 14.8% | 15.1% | 18.8% | 18.2% |
| 2020 | • | 40585 | 15.2% | 15.0% | 15.3% | 18.9% | 18.3% |
| 2021 | • | 41118 | 15.4% | 15.3% | 15.6% | 19.1% | 18.5% |
| 2022 | • | 41714 | 15.5% | 15.4% | 15.7% | 19.2% | 18.6% |
| 2023 | • | 42252 | 15.5% | 15.3% | 15.6% | 19.2% | 18.6% |
| 2024 | • | 42699 | 15.5% | 15.4% | 15.6% | 19.3% | 18.7% |
Source: Office for National Statistics
The table below gives the estimated number of residents in Hull for mid-year 2024 by five year age group.
| Age | Males | Females | Persons |
| 0-4 | 8,318 | 7,957 | 16,275 |
| 5-9 | 8,908 | 8,490 | 17,398 |
| 10-14 | 9,315 | 8,959 | 18,274 |
| 15-19 | 9,354 | 8,582 | 17,936 |
| 20-24 | 8,951 | 8,103 | 17,054 |
| 25-29 | 11,462 | 9,891 | 19,833 |
| 30-34 | 10,660 | 11,383 | 22,845 |
| 35-39 | 9,156 | 10,559 | 21,219 |
| 40-44 | 7,988 | 8,778 | 17,934 |
| 45-49 | 7,988 | 7,218 | 15,206 |
| 50-54 | 8,277 | 8,140 | 16,417 |
| 55-59 | 8,412 | 8,140 | 16,552 |
| 60-64 | 7,748 | 8,011 | 15,759 |
| 65-69 | 6,401 | 6,440 | 12,841 |
| 70-74 | 5,263 | 5,505 | 10,768 |
| 75-79 | 4,314 | 4,731 | 9,045 |
| 80-84 | 2,227 | 2,888 | 5,115 |
| 85-89 | 1,312 | 1,927 | 3,239 |
| 90+ | 522 | 1,169 | 1,691 |
| All ages | 138,530 | 136,871 | 275,401 |
The table below gives the number of residents in Hull from the Office for National Statistics mid-year 2024 estimates for each 10 year age group.
| Age | Males | Females | Persons |
| 0-9 | 17,226 | 16,447 | 33,673 |
| 10-19 | 18,669 | 17,541 | 36,210 |
| 20-29 | 18,893 | 17,994 | 36,887 |
| 30-39 | 22,122 | 21,942 | 44,064 |
| 40-49 | 17,144 | 15,996 | 33,140 |
| 50-59 | 16,689 | 16,280 | 32,969 |
| 60-69 | 14,149 | 14,451 | 28,600 |
| 70-79 | 9,577 | 10,236 | 19,813 |
| 80-89 | 3,539 | 4,815 | 8,354 |
| 90+ | 522 | 1,169 | 1,691 |
| All ages | 138,530 | 136,871 | 275,401 |
It is estimated that there are 220,005 people aged 16+ years and 213,022 aged 18+ years living in Hull which represent 79.9% and 77.3% of Hull’s population respectively (which are both lower than England at 81.6% and 79.2% respectively).
The population in Hull is relatively young compared to England as a whole. Cities tend to have younger populations due to students and younger people wanting to live in cities, and more families and older people tending to want to live in suburbs and in the countryside. In 2024, the median age of Hull’s population was 36.9 years, compared with a median age of 40.3 for the Yorkshire and Humber region and 40.2 for England. Hull was ranked 46th lowest (out of 317 lower-tier local authorities in England). This means that half of Hull’s population in 2022 was estimated to be aged under 37 years and half of Hull’s population is estimated to be aged 37 years or older. By contrast, the median age of Hull’s neighbouring local authority, East Riding of Yorkshire, was 49.6 years.
Between mid-year 2023 and mid-year 2024, there were 3,119 births and 2,590 deaths in Hull giving an natural increase of 529 in Hull’s population. In terms of internal migration, the Office for National Statistics estimated that there were there was an estimate inflow of 11,713 people coming into Hull over the year and an estimated 15,373 people leaving Hull in the year, a reduction of 3,660 people overall. For international migration, there were an estimated 7,640 people coming into Hull and 2,100 people leaving Hull giving a net gain of 5,540 people due to international migration. There were a a further decrease of 77 people due to special circumstances such as changes in the armed forces and/or the prison population.
Hull is 71.6 kilometres square and thus – from the mid-year 2024 population estimates – it is estimated that there are 3,848 residents per square kilometre. In terms of size (square kilometres), Hull is ranked 69th lowest out of 317 lower-tier local authorities. The smallest local authority is the City of London which is only 2.9 square kilometres followed by Kensington & Chelsea which is 12.1 square kilometres. The largest local authority is North Yorkshire which is 8,037 square kilometres.
In terms of population density, Hull was ranked 46th highest out of the 317 lower-tier local authorities. Tower Hamlets has the most residents per square kilometre at 16,787 with West Devon having the lowest at 51 residents per square kilometre. England has 450 residents per square kilometre. Neighbouring East Riding of Yorkshire is 2,404 square kilometres with 355,884 residents and thus 148 residents per square kilometre.
Resident Population By Electoral Ward and Area Committee Area
ONS also publishes mid-year population estimates for electoral wards, with the latest 2024 estimates published in November 2025.The total number of males and females, and the total number of residents aged in each of the five year age groups from 0-4 and 5-9 to 85-59 and 90+ years are presented in the following Excel file for Hull for mid-year 2024.
Total Resident Population
From the Office for National Statistics resident population estimates for 2024, St Andrew’s & Docklands, Newington & Gipsyville, Beverley & Newland and Orchard Park have the largest resident populations in Hull whereas Pickering, Bricknell, Ings and Kingswood have the smallest resident populations.
There is a relatively even split between males and females for all wards in Hull with St Andrew’s & Docklands (54.6%), Central (54.0%), and Beverley & Newland (53.4%) having the highest percentages of males.
| Ward or Area Committee Area | Males | Females | Persons |
| Boothferry | 5,889 | 6,012 | 11,901 |
| Derringham | 5,661 | 5,907 | 11,568 |
| Pickering | 4,092 | 4,357 | 8,449 |
| West Area Committee | 15,642 | 16,276 | 31,918 |
| Central | 6,542 | 5,578 | 12,120 |
| Newington & Gipsyville | 9,336 | 8,828 | 18,162 |
| St Andrew’s & Docklands | 9,955 | 8,285 | 18,240 |
| Riverside Area Committee | 25,833 | 22,691 | 48,524 |
| Avenue | 7,035 | 6,428 | 13,463 |
| Beverley & Newland | 9,314 | 8,127 | 17,441 |
| Bricknell | 4,353 | 4,297 | 8,650 |
| Orchard Park | 7,797 | 8,306 | 16,103 |
| University | 6,176 | 6,443 | 12,544 |
| North West Area Committee | 34,675 | 33,179 | 67,854 |
| Kingswood | 5,200 | 5,043 | 10,243 |
| North Carr | 7,575 | 8,306 | 16,103 |
| Sutton | 6,416 | 7,066 | 13,482 |
| West Carr | 6,101 | 6,443 | 12,544 |
| Foredyke Area Committee | 25,292 | 26,564 | 51,856 |
| Drypool | 6,293 | 5,849 | 12,142 |
| Holderness | 5,952 | 6,003 | 11,955 |
| Southcoates | 7,784 | 7,327 | 15,111 |
| East Central Area Committee | 20,029 | 19,179 | 39,208 |
| Ings | 4,499 | 4,780 | 9,279 |
| Longhill & Bilton Grange | 6,055 | 6,805 | 12,860 |
| Marfleet | 6,505 | 6,805 | 12,860 |
| East Area Committee | 17,059 | 18,982 | 36,041 |
| Hull | 138,530 | 136,871 | 275,401 |
Age Distribution of Residents Across Hull’s Wards and Area Committee Areas
The household composition and type of properties differs across Hull’s wards, for instance, Kingswood is a ward with a high percentage of younger families, and there are a high percentage of students living near the University. Further information relating to household composition can be found in Housing and Households under Health and Wellbeing Influences. The household composition of the different wards will influence the age distribution across Hull’s electoral wards as illustrated in the following table which presents the population estimates for mid-year 2024.
| Ward / Area | 0-9 | 10-19 | 20-29 | 30-39 | 40-49 | 50-59 | 60-69 | 70-79 | 80-89 | 90+ |
| Boothferry | 1,227 | 1,330 | 1,179 | 1,807 | 1,413 | 1,646 | 1,513 | 1,152 | 552 | 82 |
| Derringham | 1,192 | 1,256 | 1,367 | 1,782 | 1,246 | 1,539 | 1,492 | 1,046 | 553 | 95 |
| Pickering | 912 | 1,000 | 899 | 1,131 | 856 | 1,049 | 1,075 | 945 | 492 | 90 |
| West Area Committee | 3,331 | 3,586 | 3,445 | 4,720 | 3,515 | 4,234 | 4,080 | 3,143 | 1,597 | 267 |
| Central | 1,664 | 1,431 | 1,900 | 2,324 | 1,685 | 1,441 | 903 | 517 | 205 | 50 |
| Newington & Gipsyville | 2,598 | 2,525 | 2,342 | 3,351 | 2,369 | 1,946 | 1,759 | 866 | 359 | 49 |
| St Andrew’s & Docklands | 2,202 | 2,071 | 3,083 | 3,451 | 2,693 | 2,115 | 1,511 | 937 | 370 | 104 |
| Riverside Area Committee | 6,464 | 6,027 | 7,325 | 9,126 | 6,450 | 5,502 | 4,173 | 2,320 | 934 | 203 |
| Avenue | 1,421 | 1,463 | 1,996 | 2,411 | 1,908 | 1,746 | 1,314 | 888 | 274 | 42 |
| Beverley & Newland | 1,723 | 1,671 | 3,570 | 3,355 | 2,036 | 1,869 | 1,514 | 1,084 | 550 | 69 |
| Bricknell | 848 | 1,056 | 1,030 | 1,039 | 1,044 | 1,170 | 1,082 | 867 | 430 | 84 |
| Orchard Park | 2,460 | 2,680 | 1,865 | 2,554 | 1,769 | 1,751 | 1,622 | 943 | 365 | 94 |
| University | 1,165 | 2,442 | 3,365 | 1,467 | 1,234 | 994 | 806 | 487 | 182 | 46 |
| North West Area Committee | 7,617 | 9,312 | 11,826 | 10,826 | 8,000 | 7,530 | 6,338 | 4,269 | 1,801 | 335 |
| Kingwood | 1,683 | 1,427 | 1,320 | 2,179 | 1,612 | 1,128 | 659 | 208 | 19 | 8 |
| North Carr | 2,354 | 2,513 | 1,912 | 2,625 | 1,866 | 1,845 | 1,264 | 885 | 276 | 47 |
| Sutton | 1,453 | 1,633 | 1,343 | 1,833 | 1,475 | 1,724 | 1,805 | 1,458 | 601 | 127 |
| West Carr | 1,373 | 1,805 | 1,214 | 1,636 | 1,389 | 1,621 | 1,576 | 1,332 | 547 | 51 |
| Foredyke Area Committee | 6,863 | 7,408 | 5,789 | 8,273 | 6,342 | 6,318 | 5,304 | 3,883 | 1,443 | 233 |
| Drypool | 1,427 | 1,250 | 1,500 | 1,979 | 1,572 | 1,713 | 1,344 | 940 | 325 | 92 |
| Holderness | 1,212 | 1,518 | 1,309 | 1,629 | 1,554 | 1,670 | 1,499 | 1,054 | 431 | 79 |
| Southcoates | 1,780 | 1,836 | 1,831 | 2,351 | 1,855 | 1,833 | 1,790 | 1,193 | 538 | 104 |
| East Central Area Committee | 4,419 | 4,604 | 4,640 | 5,959 | 4,981 | 5,216 | 4,633 | 3,187 | 1,294 | 275 |
| Ings | 1,018 | 1,141 | 875 | 1,249 | 932 | 1,192 | 1,246 | 946 | 532 | 148 |
| Longhill & Bilton Grange | 1,686 | 1,965 | 1,369 | 1,736 | 1,453 | 1,429 | 1,454 | 1,179 | 443 | 146 |
| Marfleet | 2,275 | 2,167 | 1,618 | 2,175 | 1,467 | 1,548 | 1,372 | 886 | 310 | 84 |
| East Area Committee | 4,979 | 5,273 | 3,862 | 5,160 | 3,852 | 4,169 | 4,072 | 73,011 | 1,285 | 378 |
| Hull | 33,673 | 36,210 | 36,887 | 44,064 | 33,140 | 32,969 | 28,600 | 19,813 | 8,354 | 1,691 |
In terms of the absolute total numbers in each age group:
- Population aged 0-9 years: Newington & Gipsyville, Orchard Park and North Carr have the largest population aged 0-9 years; Bricknell, Pickering and Ings have the smallest population aged 0-9 years.
- Population aged 10-19 years: Orchard Park, Newington & Gipsyville and North Carr have the largest population aged 10-19 years; Pickering, Bricknell and Ings have the smallest population aged 10-19 years.
- Population aged 20-29 years: Beverley & Newland, University and St Andrew’s & Docklands have the largest population aged 20-29 years; Ings, Pickering and Bricknell have the smallest population aged 20-29 years.
- Population aged 30-39 years: St Andrew’s & Docklands, Beverley & Newland and Newington & Gipsyville have the largest population aged 30-39 years; Bricknell, Pickering and Ings have the smallest population aged 30-39 years.
- Population aged 40-49 years: St Andrew’s & Docklands, Newington & Gipsyville, and Beverley & Newland have the largest population aged 40-49 years; Pickering, Ings and Bricknell have the smallest population aged 40-49 years.
- Population aged 50-59 years: St Andrew’s & Docklands, Newington & Gipsyville, and Beverley & Newland have the largest population aged 50-59 years; University, Pickering and Kingswood have the smallest population aged 50-59 years.
- Population aged 60-69 years: Sutton, Southcoates, and Newington & Gipsyville have the largest population aged 60-69 years; Kingswood, University and Central have the smallest population aged 60-69 years.
- Population aged 70-79 years: Sutton, West Carr, and Southcoates have the largest population aged 70-79 years; Kingswood, University and Central have the smallest population aged 70-79 years.
- Population aged 80-89 years: Sutton, Derringham, and Boothferry have the largest population aged 80-89 years; Kingswood, University and Central have the smallest population aged 80-89 years.
- Population aged 90+ years: Ings, Longhill & Bilton Grange and Sutton have the largest population aged 90+ years; Kingswood, Avenue and University have the smallest population aged 90+ years.
In terms of the percentages in each age group:
- Population aged 0-9 years: Kingswood (16.4%), Marfleet (16.4%), and Orchard Park (15.3%) have the largest percentage of its population aged 0-9 years; University (9.6%) , Bricknell (9.8%) and Beverley & Newland (9.9%) have the smallest percentage of its population aged 0-9 years.
- Population aged 10-19 years: University (20.0%), Orchard Park (16.6%), and North Carr (16.1%) have the largest percentage of its population aged 10-19 years; Beverley & Newland (9.6%), Drypool (10.3%) and Derringham (10.9%) have the smallest percentage of its population aged 10-19 years.
- Population aged 20-29 years: University (27.6%), Beverley & Newland (20.5%), and St Andrew’s & Docklands (16.9%) have the largest percentage of its population aged 20-29 years; Ings (9.4%), West Carr (9.7%) and Boothferry (9.9%) have the smallest percentage of its population aged 20-29 years.
- Population aged 30-39 years: Kingswood (21.3%), Beverley & Newland (19.2%), and Central (1932%) have the largest percentage of its population aged 30-39 years; Bricknell (12.0%), and University (12.0%) and West Carr (13.0%) have the smallest percentage of its population aged 30-39 years.
- Population aged 40-49 years: Kingswood (15.7%), Avenue (14.2%) and Central (13.9%), have the largest percentage of its population aged 40-49 years; Ings (10.0%), Pickering (10.1%), and University (102%) have the smallest percentage of its population aged 40-49 years.
- Population aged 50-59 years: Drypool (14.1%), Holderness (14.0%) and Boothferry (13.8%) have the largest percentage of its population aged 50-59 years; University (8.1%), Newington & Gipsyville (10.7%) and Beverley & Newland (10.7%) have the smallest percentage of its population aged 50-59 years.
- Population aged 60-69 years: Ings (12.8%), Sutton (12.8%), and Derringham (13.3%) have the largest percentage of its population aged 60-69 years; Kingswood (6.4%), University (6.6%) and Central (7.5%) have the smallest percentage of its population aged 60-69 years.
- Population aged 70-79 years: Pickering (11.2%), Sutton (10.8%), and West Carr (10.6%) have the largest percentage of its population aged 70-79 years; Kingswood (2.0%), University (4.0%) and Central (4.3%) have the smallest percentage of its population aged 70-79 years.
- Population aged 80-89 years: Pickering (5.8%), Ings (5.7%), and Bricknell (5.0%) have the largest percentage of its population aged 80-89 years; Kingswood (0.2%) University (1.5%) and Central (1.7%) have the smallest percentage of its population aged 80-89 years.
- Population aged 90+ years: Ings (1.6%), Longhill & Bilton Grange (1.1%), and Pickering (1.1%) have the largest percentage of its population aged 90+ years; Kingswood (0.1%), Newington & Gipsyville (0.3%) and North Carr (0.3%) have the smallest percentage of its population aged 90+ years.
Median Age of Residents Across Hull’s Wards and Area Committee Areas
The median age of residents differs substantially across Hull’s wards. In University ward, half of the residents are aged 24 years or younger. In contrast, half of residents in Ings ward are aged 43 years or older.
Bricknell, Ings and Sutton wards have the oldest population with half of residents aged 43 years or older, followed by Boothferry and Pickering wards, with half of residents aged 42 years or older.
University has a much younger population compared to all other wards in Hull, but Marfleet, North Carr and Kingswood wards have relatively young populations with half of residents aged 33 years or younger, as do St Andrew’s & Docklands, Newington & Gipsyville, Orchard Park, Central and Beverley & Newland wards, with half of their residents aged 34 years or younger.
Overall, the median age of Hull’s residents is 36.9 years. With University having such a young population, North West Area Committee Area has a relatively young population with a median age of 34 years, the same as Riverside. Foredyke and East Area Committee Areas have similar median ages (36 and 37 years respectively), while West Area Committee Area has the oldest median age of 43 years.
2021 Census
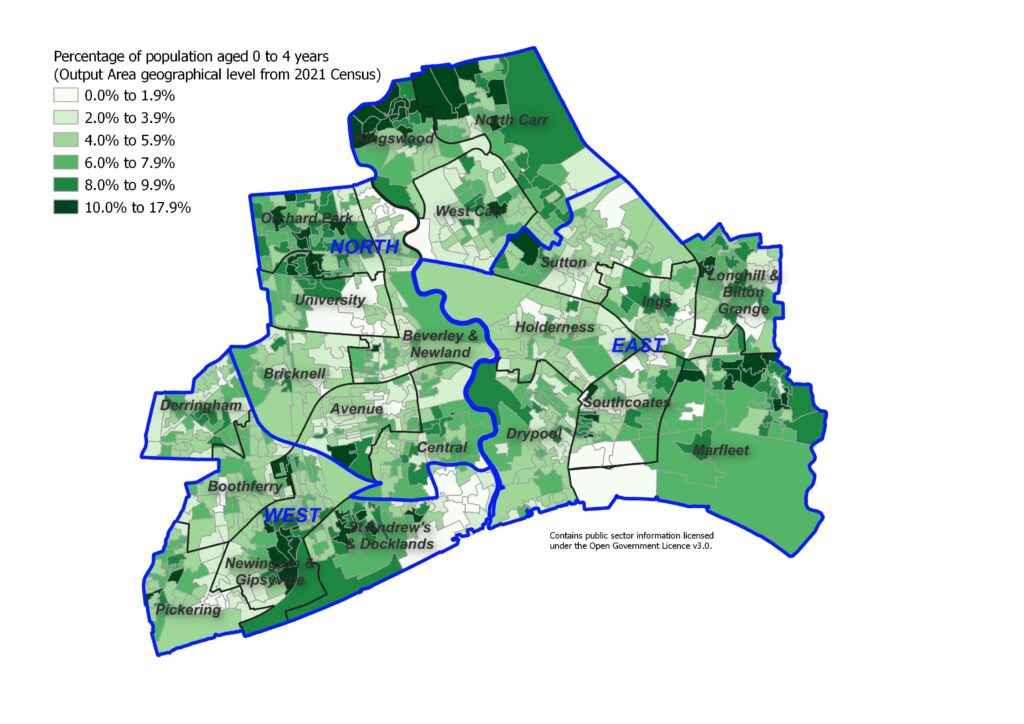
Parts of Kingswood, North Carr, Orchard Park, Marfleet, and Newington & Gipsyville have the highest percentages of the resident population aged 0-4 years.
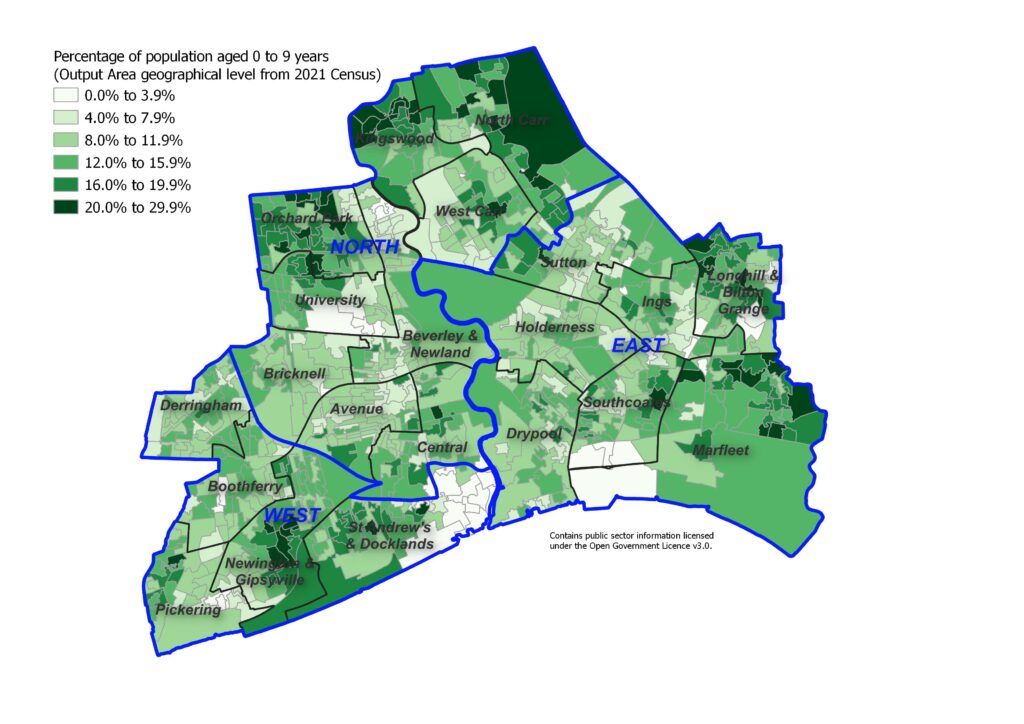
Parts of Kingswood, North Carr, Orchard Park, Marfleet, Longhill & Bilton Grange, At Andrew’s & Docklands and Newington & Gipsyville have the highest percentages of the resident population aged 0-9 years.
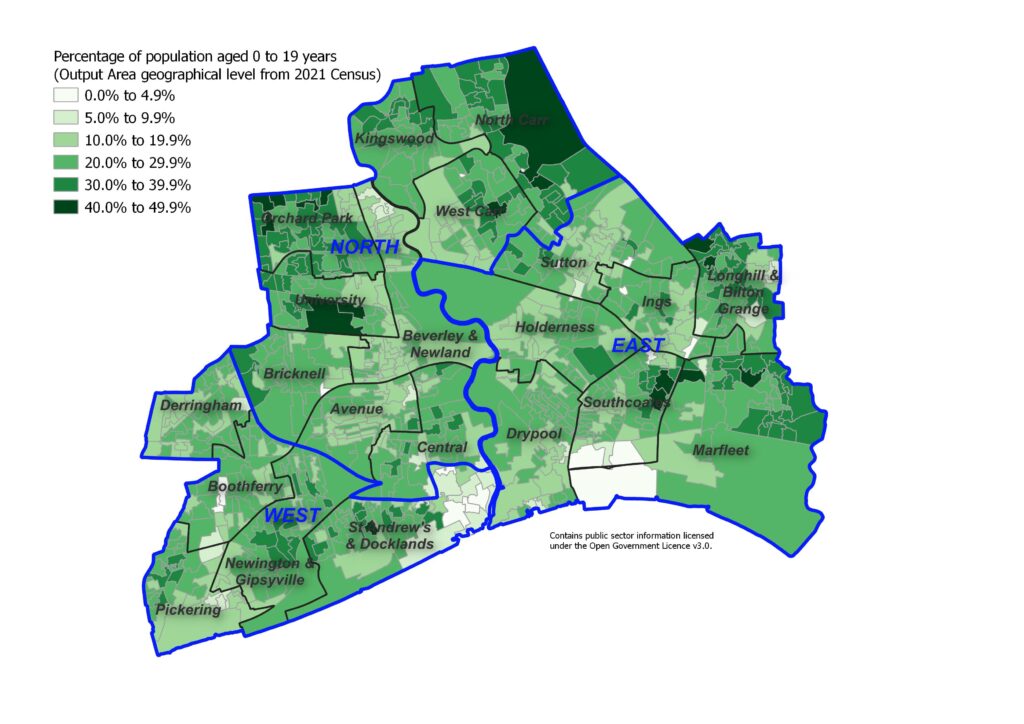
Parts of North Carr, Orchard Park, Longhill & Bilton Grange, Marfleet, Southcoates and University have the highest percentages of the resident population aged 0-19 years.
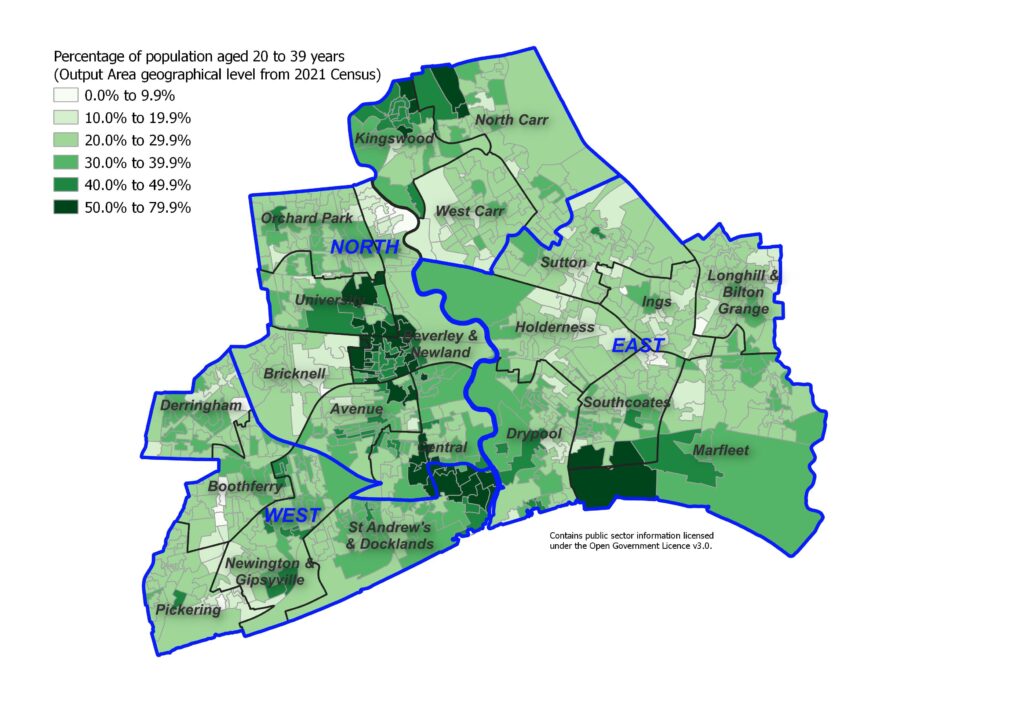
Parts of Kingswood, North Carr, Marfleet and Southcoates have the highest percentages of resident population aged 20-39 years together with areas around the city centre (St Andrew’s & Docklands and Central) and around the University (University, Bricknell and Beverley & Newland).
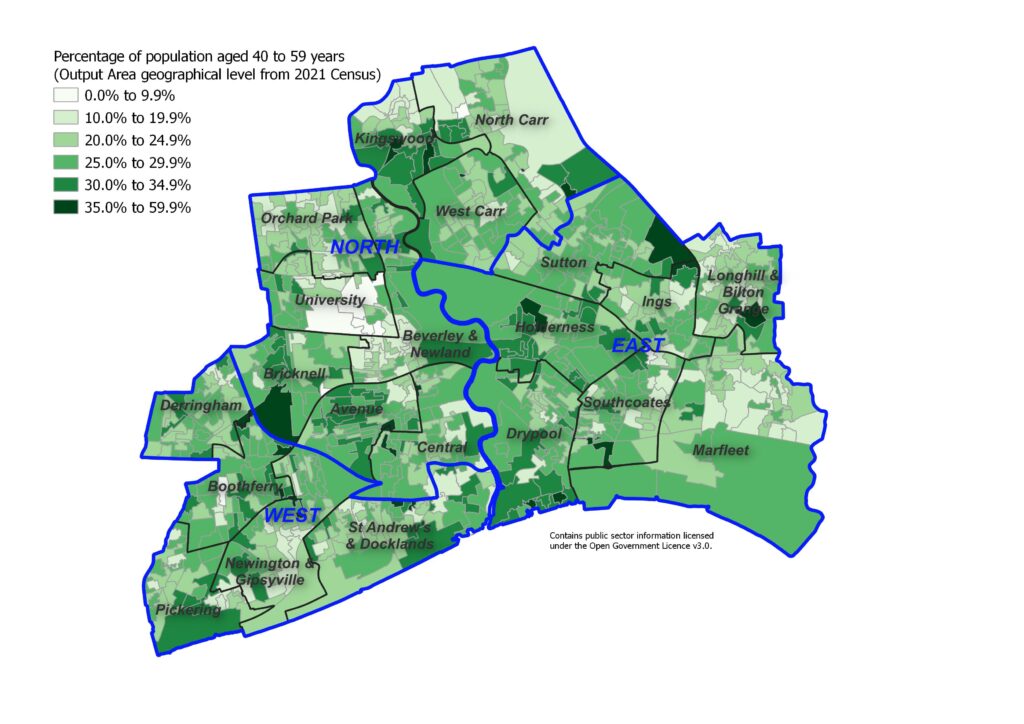
Parts of Kingswood, Sutton, Longhill & Bilton Grange, Holderness, Southcoates, Drypool, Avenue , Boothferry and Bricknell have the highest percentages of people aged 40-59 years.
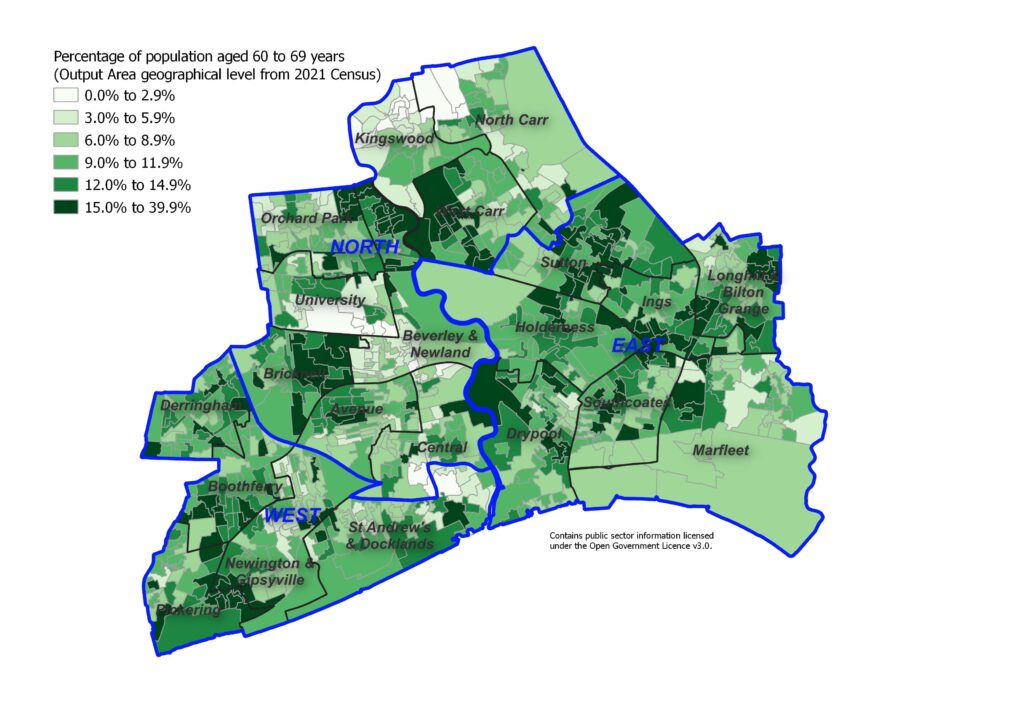
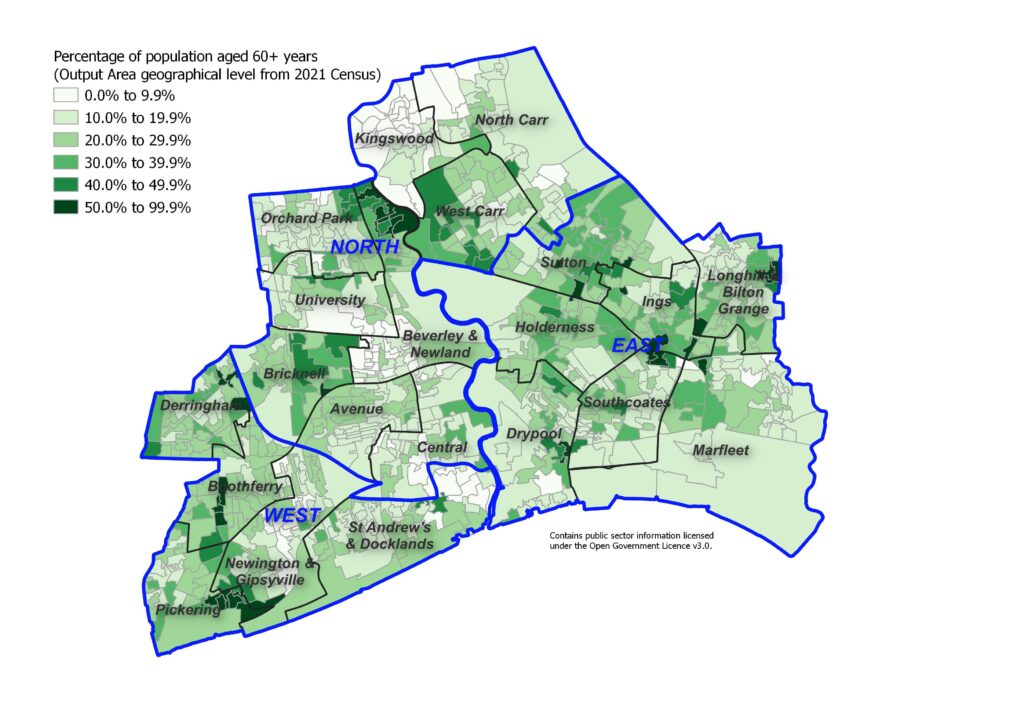
The areas of the city with the highest percentages of residents aged 60-69 years is quite scattered across the city with Kingwood, North Carr, Orchard Park, University, the southern parts of Beverley & Newland, and areas around the city centre the least likely to have the highest percentages of those aged 60-69 years.
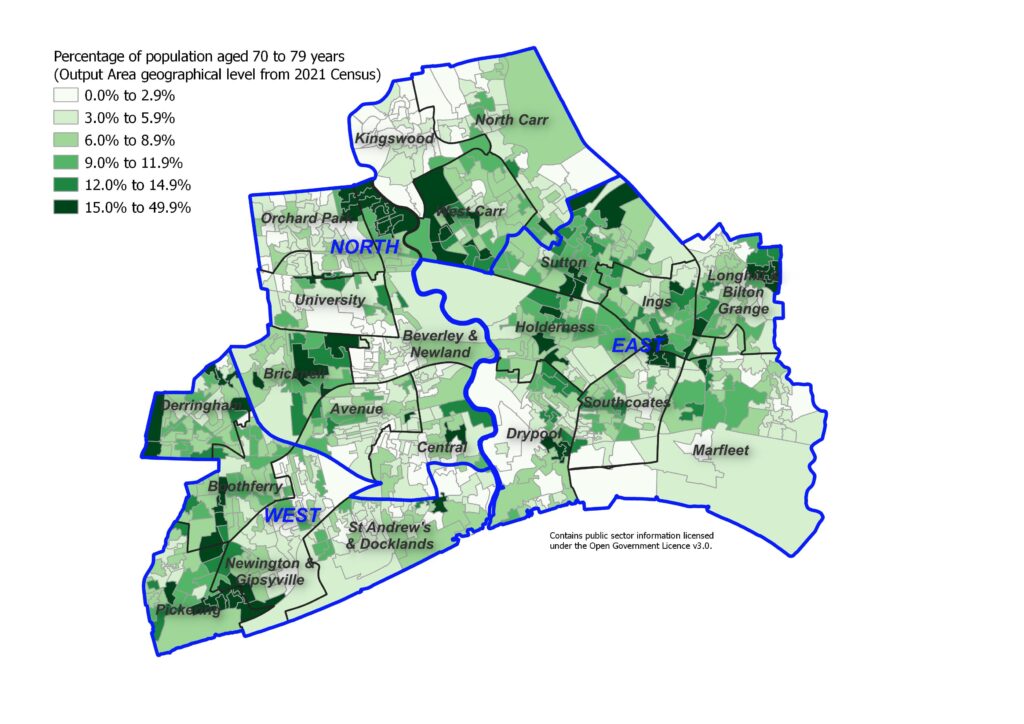
The highest percentages of people aged 70-79 years tends to be in an arch around the city centre with the highest percentages in Pickering, Newington & Gipsyville, Boothferry, Derringham, Bricknell, northern Beverley & Newland, West Carr, Holderness, Sutton, Ings and Longhill & Bilton Grange.
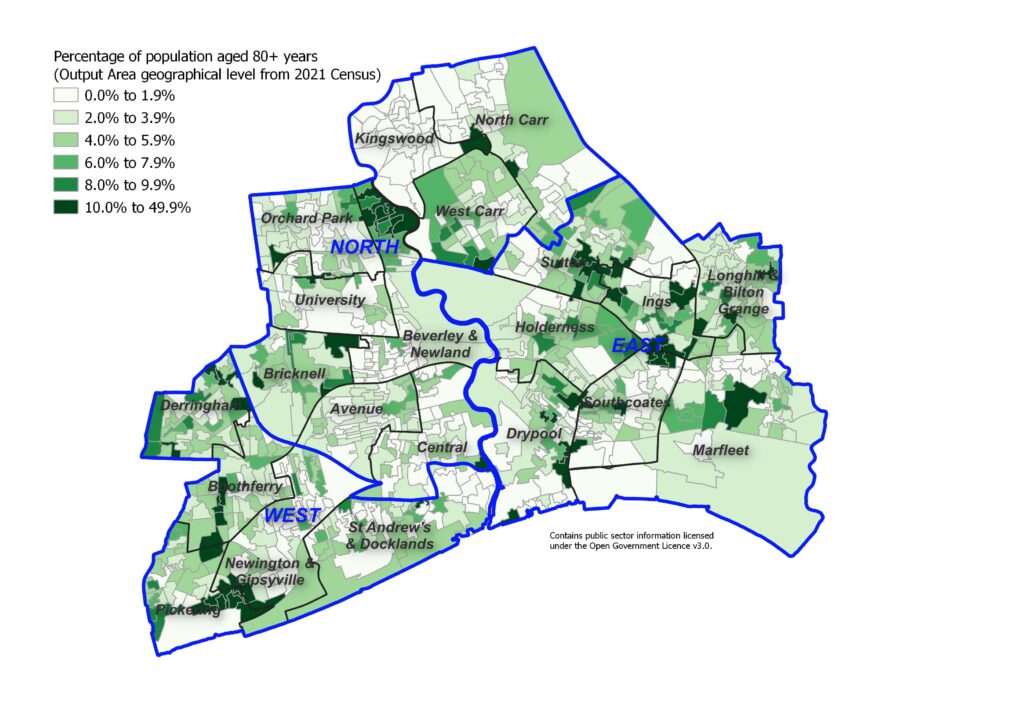
The same areas that tend to have higher percentage of people aged 70-79 years also have a high percentage aged 80+ years, namely, Pickering, Newington & Gipsyville, Boothferry, Derringham, Bricknell, northern Beverley & Newland, Sutton, Ings and Longhill & Bilton Grange.
Kingswood, North Carr, University, Orchard Park, southern parts of Beverley & Newland, Avenue, Newington & Gipsyville, St Andrew’s & Docklands, Drypool, Southcoates and Marfleet tend to have the lowest percentages of those aged 60+ years.
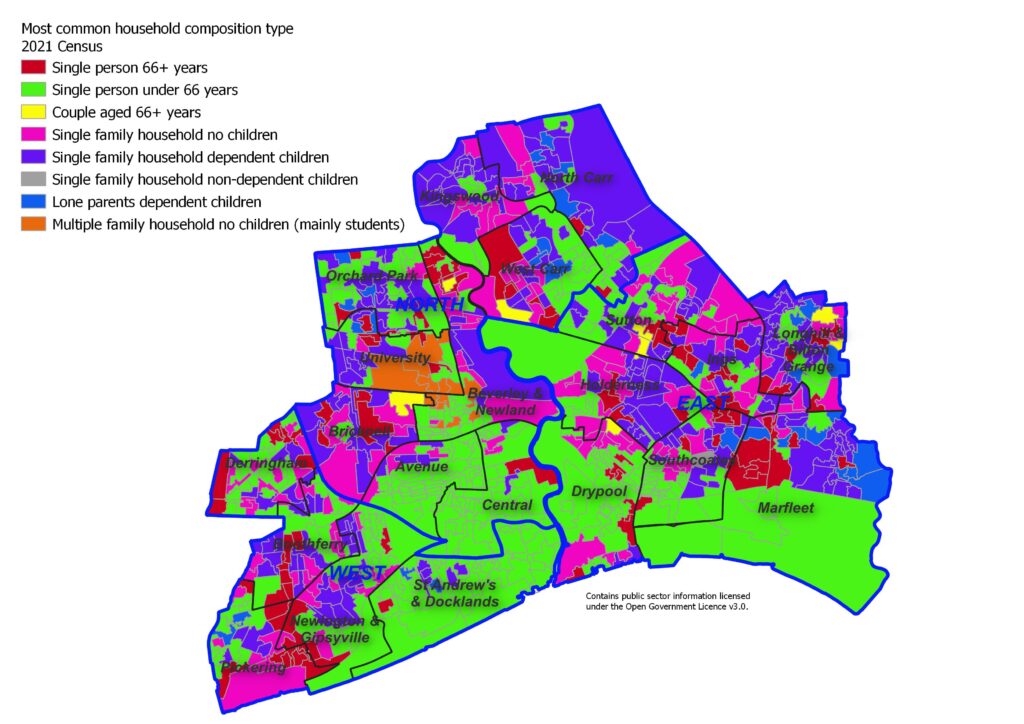
From the 2021 Census, the household composition also differs across Hull (more maps are included within Housing and Households within Health and Wellbeing Influences). A higher percentage of households are single person households of people aged under 66 years around the city centre, with a high percentage of multiple occupancy households (mainly students) near the University, and a mix of families with children and older people to the north, east and west of the city centre with a particularly high percentage of households containing dependent children in Kingwood and North Carr.
Recent Changes in Resident Population
The mid-year population estimates for 2021, 2022 and 2023 were all revised upwards for Hull when the mid-year 2024 estimates were released. The population estimates were 267,591 for mid-year 2021, 266,516 for mid-year 2022 and 268,577 for mid-year 2023.
Between mid-year 2021 and mid-year 2024, the Office for National Statistics estimate that Hull’s population has increased by 8,885 which is mainly due to international migration, although there have been a smaller natural increase as well.
| Starting mid-year / component | 2021 | 2022 | 2023 | 2024 |
| Population at starting mid-year | 266,516 | 268,768 | 273,069 | 275,401 |
| Births | 3,202 | 3,067 | 3,119 | |
| Deaths | 2,704 | 2,749 | 2,590 | |
| Natural change | 498 | 318 | 529 | |
| Internal migration in | 11,769 | 11,716 | 11,713 | |
| Internal migration out | 14,662 | 14,141 | 15,373 | |
| Internal migration net | -2,893 | -2,425 | -3,660 | |
| International migration in | 6,483 | 7,925 | 7,640 | |
| International migration out | 1,743 | 1,590 | 2,100 | |
| International migration net | 4,740 | 6,335 | 5,540 | |
| Other changes (e.g. armed services, prisons) | -93 | 73 | -77 | |
| Total change | 2,252 | 4,301 | 2,332 | |
| Population at ending mid-year | 268,768 | 273,069 | 275,401 |
However, the differences are not uniform across the different age groups particularly for natural changes in the population. The highest rates of both net internal migration and net international migration occur in the 25-39 year age group with an increase in the population aged 25-39 years overall but an increase due to international migration which is larger than the decrease due to internal migration.
Among the 0-17 year age group, there were fewer births relative to the numbers moving into the 18-24 year age group so that the population would have reduced by 235 people based on ageing and the natural change in the population (including the small number of deaths). However, there was an increase of 3,325 residents in the total population aged 0-17 years over the three year period as 3,560 more children and young people aged 0-17 years moved into Hull compared to moving out of Hull.
With fewer people moving into the 18-24 year age group from 0-17 year age group compared to the number aged 18-24 years moving into the 25-39 year age group, the number of residents aged 18-24 years would have decreased by 1,493 including the 29 deaths in this age group. However, the number of residents aged 18-24 years has only decreased by 645 people as 848 more people aged 18-24 years have moved into Hull compared to those who left Hull.
The impact of migration into Hull is even more significant among the 25-39 year age group. There was an estimated 109 new people in the 25-39 year age group as 11,039 from the 18-24 year age group came into the 25-39 year age group but 10,930 people from the 25-39 year age group moved into the 40-64 year age group. With 172 deaths in this age group, the ageing effect and natural change would would have meant that the population reduced by 63 people in this age group. However, there was an increase of 4,286 people due to more people aged 25-39 years coming into Hull compared to leaving Hull over the three year period.
The pattern was different in the 40-64 year age group. Overall, 10,930 people moved into this age group from the 25-39 year age group but only 8,502 people aged 40-64 years moved into the 65+ year age group. A further 1,383 people aged 40-64 years died within the three year period, resulting in a increase in the population of 1,045 due to ageing and natural change. However, as there were an estimated 707 more people aged 40-64 years moving out of Hull compared to moving into Hull, the estimated population aged 40-64 years increased by only 338 residents.
There is relative small changes to the population aged 65+ years due to internal and international migration with only 510 moving out of Hull, but there were over 6,411 deaths among those aged 65+ years over the three year period. However, the population aged 65+ years has increased over the last three years as 8,502 people who were within the 40-64 year age group three years ago have now aged by three years, and are now included within the 65+ year age group.
| Population / component | 0-17 | 18-24 | 25-39 | 40-64 | 65+ | All ages |
| Population 2021 | 59,054 | 25,203 | 59,611 | 81,530 | 41,118 | 266,516 |
| Births | 9,388 | |||||
| Deaths | 48 | 29 | 172 | 1,383 | 6,411 | 8,043 |
| Natural change | 9,340 | -29 | -172 | -1,383 | -6,411 | -8,043 |
| Internal migration in | 4,427 | 11,638 | 11,377 | 5,736 | 2,020 | 35,198 |
| Internal migration out | 6,331 | 11,717 | 15,617 | 7,992 | 2,519 | 44,176 |
| Internal migration net | -1,904 | -79 | -4,240 | -2,256 | -499 | -8,978 |
| International migration in | 5,940 | 2,101 | 10,986 | 2,885 | 136 | 22,048 |
| International migration out | 472 | 1,037 | 2,451 | 1,373 | 100 | 5,433 |
| International migration net | 5,468 | 1,064 | 8,535 | 1,512 | 36 | 16,615 |
| Other change | -4 | -137 | 54 | 37 | -47 | -97 |
| Total internal and international migration | 3,560 | 848 | 4,349 | -707 | -510 | 7,540 |
| Total change including natural change | 12,900 | 819 | 4,177 | -2,090 | -6,921 | 8,885 |
| Ageing effect – moving out of age group* | 9,575 | 11,039 | 10,930 | 8,502 | 0 | 40,046 |
| Ageing effect – moving into age group* | 0 | 9,575 | 11,039 | 10,930 | 8,502 | 40,046 |
| Ageing effect – change | -9,575 | -1,464 | 109 | 2,428 | 8,805 | 0 |
| Ageing effect and natural change | -235 | -1,493 | -63 | 1,045 | 2,091 | 1,345 |
| Population 2024 | 62,379 | 24,558 | 63,897 | 81,868 | 42,699 | 275,401 |
| Change 2021 to 2024 | 3,325 | -645 | 4,286 | 338 | 1,581 | 8,885 |
Patient Population Registered with Local GPs
Based on the general practice registration file for July 2025, the estimated resident population is noticeably higher than the Office for National Statistics’ estimate for Hull at 294,613 residents with 289,361 of these residents registered with general practices in Hull. A total of 319,503 people are either registered with a Hull GP as a patient or live in Hull based on the GP registration file for July 2025.
Of the 624 patients who live beyond East Riding of Yorkshire, 55 live in North Lincolnshire, 43 live in Doncaster, 33 live in North East Lincolnshire, 32 live in Leeds, 22 live in Wakefield, 20 live in York, 17 live in Manchester, 15 live in Bradford, 13 live in Sheffield, 11 live in Hillingdon, 10 live in Scarborough, and the remaining 350 patients live in another 148 different local authorities across England (1-9 people for each local authority). It is possible that some of these patients lived in the city and moved away but have not yet changed their GP, and may not be an ‘active’ patient (but informed their GP of their new address). However, it is possible that some of the patients living elsewhere do live in the city and have recorded another address as part of the GP registration process, for example, parental address given for students, or that they work in the city or divide their time between two different addresses, and may be an ‘active’ patient for the practice.
Of the 319,503 people who are either registered with a Hull GP as a patient and/or live in Hull based on the GP registration file, 289,361 (90.6%) are registered with a Hull GP and live in Hull, 23,706 (7.4%) are registered with a Hull GP but live in East Riding of Yorkshire, and 3,740 (1.1%) people live in Hull but are registered with a GP in East Riding of Yorkshire. Additionally, there are a further 2,696 individuals who are either registered with a Hull GP and live further afield, or who are recorded as living in Hull but are registered with a GP further afield.
Of the 314,251 patients registered with Hull GPs, 23,706 (7.5%) live in East Riding of Yorkshire and a further 1,181 live elsewhere. This is an important consideration if services are provided via primary care.
Of the 294,613 people estimated to live in Hull based on information in GP records, 289,361 (98.2%) live in Hull, 3,740 (1.3%) live in East Riding of Yorkshire and 1,512 (0.5%) live beyond East Riding of Yorkshire.
| Resident | Hull GP | ERoY GP | Other GP | Totals |
| Resident of Hull | 289,316 | 3,740 | 1,512 | 294,613 |
| Resident of ERoY | 23,706 | 23,706 | ||
| Resident elsewhere | 624 | 624 | ||
| Unknown | 560 | 560 | ||
| Totals | 314,251 | 3,740 | 1,512 | 319,503 |
As at July 2025, the total number of patients registered with Hull general practices also differs substantially ranging from 2,256 registered patients for CHCP East Park to 56,303 registered patients for Modality.

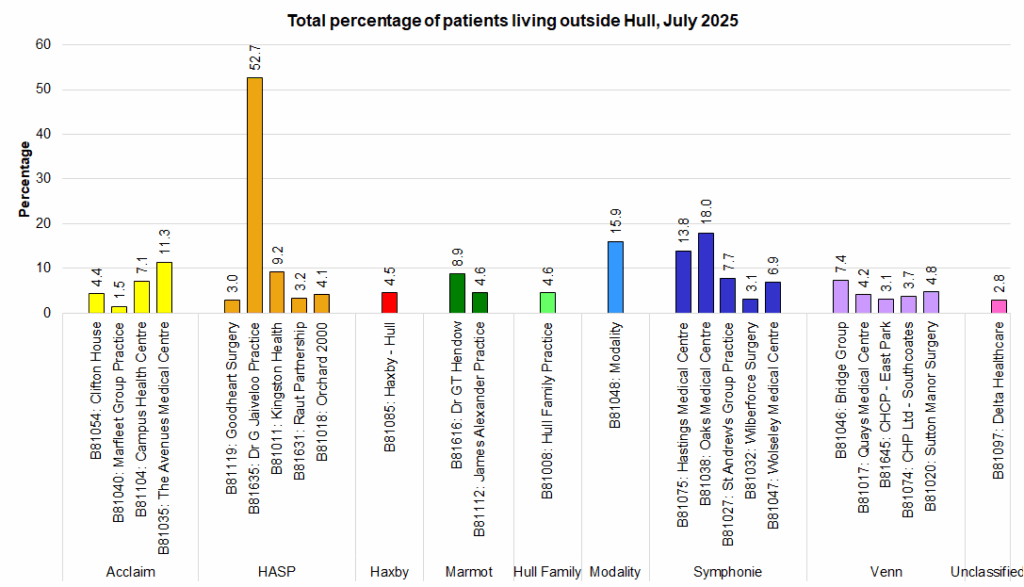
As at July 2025, all 25 practices in Hull have patients registered with them who live in East Riding of Yorkshire and all practices have patients registered with them who live beyond East Riding of Yorkshire, and all but one have patients with local authority beyond England or missing. The percentage of their patients who live outside Hull varies across Hull’s 25 GP practices from 1.5% to 52.7%.
The practices with the highest percentages of patients living outside Hull are De Jaiveloo Practice (Laurbel Surgery) where over half of patients live outside of Hull (52.7%), Oaks Medical Centre (18.0%), Modality (15.9%), Hastings Medical Centre (13.8%) and The Avenues Medical Centre (11.3%).
More than half of all patients registered with the Laurbel Surgery live in East Riding of Yorkshire, and nearly one in five patients live in East Riding of Yorkshire for Modality Hull and The Oaks Medical Centre.
Modality Hull practice operates as a single Primary Care Network (PCN), this PCN has the highest percentage of patients living beyond Hull (15.9%) with around one in ten patients for both HASP (10.4%) and Symphonie (10.0%).
| PCN / Practice | Total patients | Lives in Hull % | Lives in ERoY % | Lives elsewhere % |
| B81054: Clifton House | 7,999 | 95.6 | 4.1 | 0.3 |
| B81040: Marfleet Group Practice | 15,804 | 98.5 | 1.4 | 0.2 |
| B81104: Campus Health Centre | 7,398 | 92.9 | 5.7 | 1.4 |
| B81035: The Avenues Medical Centre | 7,075 | 88.7 | 11.0 | 0.3 |
| ACCLAIM | 38,276 | 95.0 | 4.6 | 0.4 |
| B81119: Goodheart Surgery | 6,416 | 97.0 | 2.8 | 0.2 |
| B81635: Dr Jaiveloo Practice | 3,620 | 47.3 | 52.6 | 0.1 |
| B81011: Kingston Health | 10,499 | 90.8 | 8.9 | 0.2 |
| B81631: Raut Partnership | 4,695 | 96.8 | 3.9 | 0.2 |
| B81018: Orchard 2000 | 9,319 | 95.9 | 3.9 | 0.2 |
| HASP | 34,549 | 89.6 | 10.2 | 0.2 |
| B81085: Haxby Hull | 38,427 | 95.5 | 4.1 | 0.4 |
| HAXBY | 38,427 | 95.5 | 4.1 | 0.4 |
| B81616: Dr Hendow | 2,928 | 91.1 | 8.5 | 0.4 |
| B81112: James Alexander Practice | 21,531 | 95.4 | 3.9 | 0.7 |
| MARMOT | 24,459 | 94.9 | 4.5 | 0.7 |
| B81008: Hull Family Practice | 38,025 | 95.4 | 4.4 | 0.2 |
| HULL FAMILY | 38,025 | 95.4 | 4.4 | 0.2 |
| B81048: Modality | 56,303 | 84.1 | 15.7 | 0.3 |
| MODALITY | 56,303 | 84.1 | 15.7 | 0.3 |
| B81075: Hastings Medical Centre | 3,796 | 86.2 | 13.6 | 0.2 |
| B81038: Oaks Medical Centre | 8,216 | 82.0 | 13.6 | 0.2 |
| B81027: St Andrew’s Group Practice | 7,877 | 92.3 | 7.5 | 0.2 |
| B81032: Wilberforce Surgery | 5,662 | 96.9 | 2.6 | 0.5 |
| B81`047: Wolseley Medical Centre | 7,503 | 93.1 | 6.4 | 0.5 |
| SYMPHONIE | 33,054 | 90.0 | 9.7 | 0.3 |
| B81046: Bridge Group | 8,888 | 92.6 | 7.0 | 0.4 |
| B81017: Quays Medical Centre | 16,901 | 95.8 | 2.9 | 1.2 |
| B81645: CHCP – East Park | 2,256 | 96.9 | 2.7 | 0.4 |
| B81074: CHP Ltd – Southcoates | 12,008 | 96.3 | 3.3 | 0.4 |
| B81020: Sutton Manor Surgery | 8,471 | 95.2 | 4.7 | 0.1 |
| VENN | 48,524 | 95.3 | 4.1 | 0.6 |
| B81097: Unclassified | 2,634 | 97.2 | 2.7 | 0.2 |
| UNCLASSIFIED | 2,634 | 97.2 | 2.7 | 0.2 |
| HULL | 314,251 | 92.1 | 7.5 | 0.4 |
The age distribution of the patients registered with Hull practices also differs.
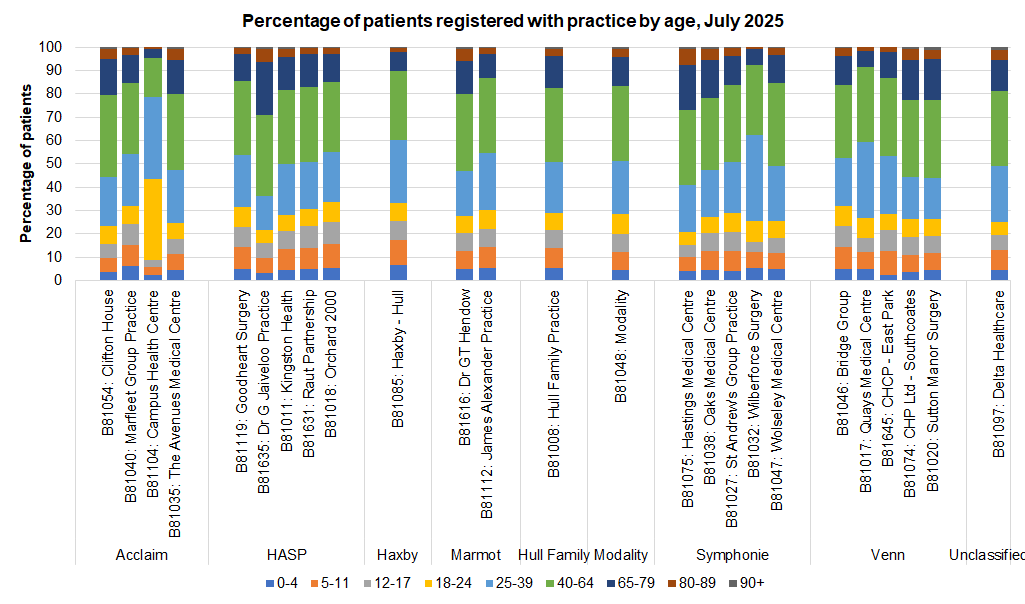
Campus Health Centre has a high proportion of students registered with the practice and as a result has a much different age structure of their patients compared to all other practices in Hull. Seven in ten of their patients are aged 18-39 years. They have the lowest percentage of patients aged 0-4, 5-11, 12-17, 40-64, 65-79 and 80-89 years (all other age groups except 90+ years and they are third lowest for the 90+ age group).
Excluding Campus Health Centre, the following statements can be made in relation to the age distribution of patients:
- Aged 0-4 years: The percentage of the population aged 0-4 years ranges from 2.7% for CHCP – East Park to 6.9% for Haxby – Hull.
- Aged 5-11 years: The percentage of the population aged 5-11 years ranges from 6.0% for Hastings Medical Centre to 10.4% for Haxby – Hull.
- Aged 12-17 years: The percentage of the population aged 12-17 years ranges from 4.6% for Wilberforce Surgery to 9.4% for Raut Partnership.
- Aged 18-24 years: The percentage of the population aged 18-24 years ranges from 5.6% for Dr Jaiveloo Practice (Laurbel Surgery) to 8.9% for Orchard 2000.
- Aged 25-39 years: The percentage of the population aged 25-39 years ranges from 14.8% for Dr Jaiveloo Practice (Laurbel Surgery) to 36.9% for Wilberforce Surgery.
- Aged 40-64 years: The percentage of the population aged 40-64 years ranges from 29.5% for Haxby – Hull to 35.6% for Wolseley Medical Centre.
- Aged 65-79 years: The percentage of the population aged 65-79 years ranges from 6.8% for Quays Medical Centre to 22.7% for Dr Jaiveloo Practice (Laurbel Surgery).
- Aged 80-89 years: The percentage of the population aged 80-89 years ranges from 1.2% for Wilberforce Surgery to 6.8% for Hastings Medical Centre.
- Aged 90+ years: The percentage of the population aged 90+ years ranges from 0.1% for CHCP – East Park to 1.2% in Sutton Manor Surgery.
Differences in Resident and GP Population Estimates
The total estimated resident population from the GP registration file (as at July 2025) is considerably different from the estimated number of residents from Office for National Statistics mid-year estimates for 2024.
From ONS’s mid-year estimates for 2024, it was estimated that 275,401 people lived in Hull, so with an estimated 294,613 residents from the GP registration file, the GP registration file gives an estimate of 19,212 residents higher (or 6.9% higher).
ONS produce annual estimates based on the Census, ageing people each year, adding births and subtracting deaths, and adding adjustments to estimate local, national and international migration. Whilst it is a legal requirement to complete a Census form, the Census is an underestimate as not everybody completes the Census particularly men, younger people and those living in the most deprived areas. ONS adjust the figures to try to account for this under-count. ONS uses the GP registrations to estimate local and national migration, and there are other sources of data to estimate international migration, but these data sources are neither complete nor comprehensive. So migration will comprise the largest error component, and furthermore the error rate increases with each successive mid-year estimate until the next Census. After a new Census, ONS generally revise their historical estimates so there is a not a step jump in estimates between the year before the Census and the Census year. It is rare for them to back-revise estimates at other times, although this happened in Hull when the mid-year 2024 estimates were published (when they revised their estimates for the previously-published years of mid-year 2021, 2022 and 2023).
Whilst the GP registration file is a count of real people, it is not necessarily more accurate. People who move house do not always inform their GP of their new address, and they do not always register with a new GP practice if they have moved too far to attend their GP practice. Once someone registers with a new GP they are automatically removed from the practice list of their old practice (but this will not happen if they move abroad). Thus it is possible that people move to Hull and live in Hull some time before registering with a local GP, and people can move away from Hull but not update their GP with their new address or change their GP to a practice local near to where they move. This is particularly the case for young people especially men, who generally use their GP less frequently.
Thus both the ONS and GP registration file estimates of resident population will not be totally accurate. In general, the ONS population estimates and the Census estimates are used as the official figures for resident population estimates. It is possible that they underestimate the population slightly, but it is likely that the GP registration file overestimates the resident population.
Visitor Populations
The Hull travel-to-work areas, which covers a large percentage of East Riding of Yorkshire, has one of the highest levels of commuter self-containment in the country. This means that Hull has high levels of visitor daytime populations who visit Hull for work and study reasons. However, due to the high concentration of retail, sporting and leisure facilities in Hull in close proximity to a high number of East Riding of Yorkshire residents in particular, there are a high number of visitors to Hull both during the day and evening across all age groups for retail, sporting, leisure and other purposes particularly at the weekend and at other times of the year such as over the Christmas period or during school holidays, or when special events are on in Hull. Furthermore, as mentioned earlier, around 8% of all patients registered with Hull GPs live in East Riding of Yorkshire, and with the nearest A&E for many East Riding of Yorkshire residents located within Hull, this means there is significant cross-boundary flow into Hull in relation to health-related services which will impact on the need for health-related services in Hull.
Hull is a port with significant flow into and out of Hull in relation to those travelling on the overnight ferries to Europe which arrive into Hull and depart out of Hull every day. Whilst many people travelling by ferry in this way will be driving in cars, vans or heavy goods vehicles who travel directly to and from the port without stopping in Hull city centre itself, there may be some such visitors who visit retail and leisure facilities in Hull as they pass through. This may be particularly the case if they require medical treatment or services such as A&E or pharmaceutical services.
Hull is home to a Championship side football team Hull City AFC (Association Football Club) and two Super League rugby league clubs Hull FC (Football Club) and Hull KR (Kingston Rovers). This means that there are significant visitor populations to sporting facilities in Hull with both Hull City and Hull FC playing at the MKM Stadium in the west of the city and Hull KR playing at Craven Park in the east of the city.
Strategic Need and Service Provision
At different life-stages, people have very different needs. For instance, among areas with a high percentage of families, maternal health, breastfeeding, vaccinations, and a good start in life are important issues. Students and young people may need advice and support in relation to lifestyle and behavioural factors such as alcohol and smoking, mental health, and sexual health. People of working age may have needs in relation to employment, mental health, sexual health, and lifestyle and behavioural risk factors, such as smoking and diet. Older people will tend to have more long-term conditions, and needs in relation to falls and hip fractures, dementia, and mental health including social isolation.
Because approximately 24,000+ “extra” people registered with Hull GPs live in East Riding of Yorkshire (or other areas), if services are delivered through primary care, account needs to be taken of these non-Hull residents on the lists of Hull general practices.
As well as understanding the gender and current age structure of the local population, it is important to examine the future projections for the age and gender structure of the population (see Population Projections also under Population) as well as other factors which influence health and the need for health services such as Race and Ethnicity, and other factors such as deprivation, housing, employment, etc (see Health and Wellbeing Influences) as well as where different groups of people live in the city (see Ward and Area Committee Profiles under Place).
Resources
Office for National Statistics population estimates: www.ons.gov.uk
Office for National Statistics. Census 2021. https://census.gov.uk/
NHS Digital for patients registered at each GP practice: https://digital.nhs.uk/
Updates
This page was last updated / checked on 28 May 2026.
This page is due to be updated / checked in February 2027.