Index
This topic area covers statistics and information relating to population estimates for people from ethnic minority backgrounds in Hull including local strategic need and service provision. Further information relating to health, wellbeing and lifestyle risk factors is given within our Adult Health and Wellbeing Surveys within Tools and Resources. Where information is available which relates to people from different ethnic minority backgrounds, it is given for specific topic areas within this Joint Strategic Needs Assessment. Information is included within Children with Special Education Needs or Disabilities, on specific diseases and medical conditions including COVID-19 under Health Factors under Adults, within Schools, Education and Qualifications, etc.
Ethnic minorities refers to all ethnic minority groups combined except the white British group, and therefore ethnic minorities includes white minorities.
Summary Infographic
Headlines
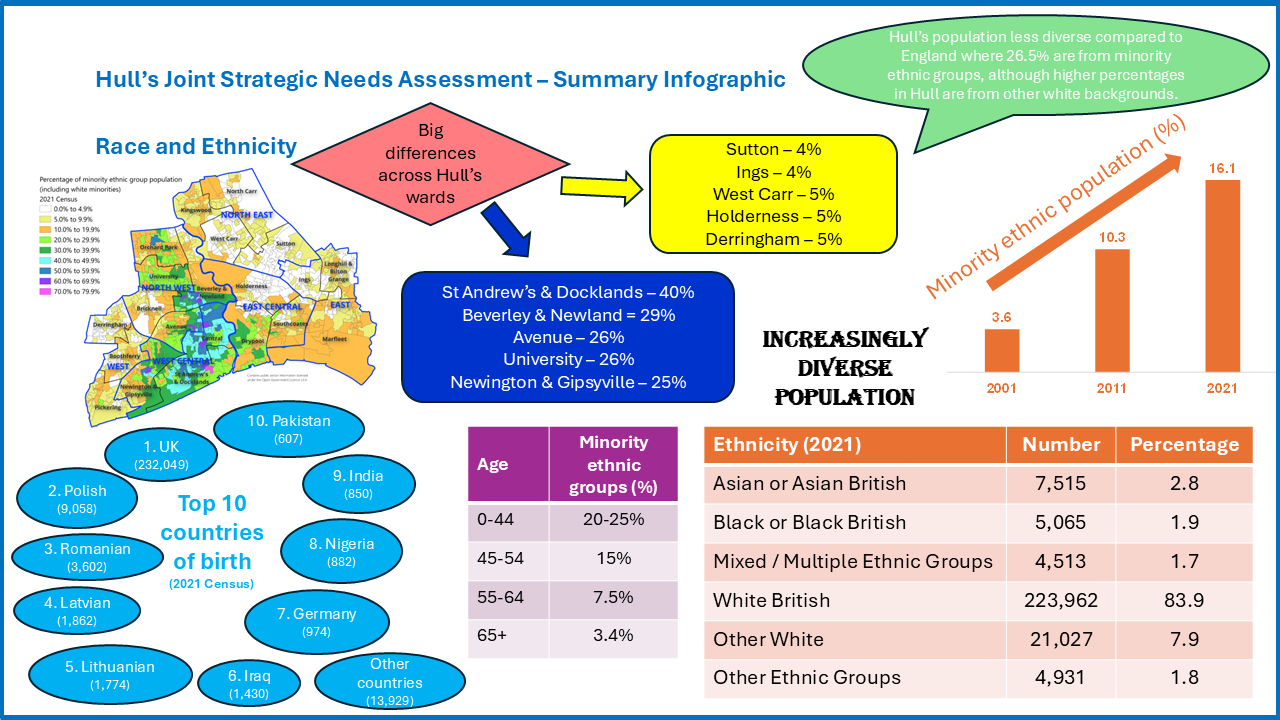
- In the 2021 Census, it was estimated that 91.8% of Hull’s residents were white with 83.9% being white British, 0.2% white Irish, 0.2% white Gypsy or Irish Traveller, 0.1% Roma and 7.4% from other white backgrounds. Overall, 1.7% of people were from a mixed ethnic background, 2.8% were Asian or British Asian, 1.9% were black, black British, Caribbean or African, 0.5% Arabs and 1.3% from other ethnic minority backgrounds.
- Whilst the percentage of people from ethnic minority backgrounds is relatively low in Hull compared to the England average, although the percentages have increased in Hull over the last couple of decades.
- In the 2001 Census, it was estimated that 2.3% of Hull’s population were from ethnic minority backgrounds excluding white minority backgrounds and 3.6% were from ethnic minority backgrounds including white minorities, but this increased to 5.9% and 10.3% respectively in the 2011 Census and to 8.2% and 16.1% respectively in the 2021 Census.
- In 2021, it was estimated that 223,962 Hull residents were white British, 21,027 from white minorities mainly Eastern European, and 22,024 from ethnic minorities (excluding white minorities). Overall, 43,051 Hull residents were from ethnic minority backgrounds.
- In 2021, 232,049 (86.9%) of Hull’s residents had been born in the UK, 9,058 (3.4%) had been born in Poland, 3,602 (1.3%) in Romanian, 1,865 (0.7%) in Latvia, 1,774 (0.7%) in Lithuania, 1,430 (0.5%) in Iraq, 974 (0.4%) in Germany, 882 (0.3%) in Nigeria and 850 (0.3%) had been born in India.
- Between 2011 and 2021, the largest increases in ethnicity occurred for Arab and other ethnic groups, other white, other black, black African and Bangladeshi.
- The percentage of ethnic minority population in Hull differs dramatically across Hull’s 21 electoral wards, and the ethnic minority population also differs by age group with higher percentage of residents from ethnic minority backgrounds among younger people (21.1% among 0-4 year olds compared to 13.5% among those aged 30+ years).
- The percentage of children from ethnic minorities attending Hull schools has increased from 9.1% in 2010 to 21.5% in 2020 with around 8,805 children attending Hull schools from ethnic minorities.
- From the January 2021 school census, 78.1% of pupils were white British, 9.8% of pupils were from other white backgrounds, 4.0% pupils were from mixed ethnic backgrounds, 2.0% pupils were black British, Caribbean or African, 1.8% pupils were Asian or Asian British, 3.0% were from other ethnic backgrounds, and 1.4% did not have their ethnicity unclassified. A total of 9,246 (21.9%) pupils were from ethnic minorities which was considerably lower than England (35.1%).
- Among state-funded mainstream schools in Hull for 2023/24, 19.7% of primary school, 16.0% of secondary school and 9.0% of special school pupils first language was not English. Whilst these percentages are lower than England (22.8%, 18.6% and 14.4% respectively), there difference between Hull and England appear to be reducing over time. The figures were 16.9%, 13.6% and 6.0% for 2020/21 respectively so numbers have increased in Hull in recent years. For the 2023/24 school year, this equates to 4,934 primary, 2,717 secondary and 72 special school pupils whose first language is not English. However, across Hull’s schools, the percentages varied dramatically from 1.6% to 17.% among Hull’s six special schools, from 2.5% to 70.0% for Hull’s 71 primary maintained and academy schools, and from 2.5% to 46.7% for Hull’s 13 academy secondary schools.
- Nine in ten residents in Hull aged 3+ years at the time of the Census spoken English as their main language (first or preferred language) with 3.3% speaking Polish, 1.3% speaking Romanian, 0.6% speaking Lithuanian, 0.5% speaking Arabic and 0.5% speaking Kurdish.
- Around 7,500 residents of Hull aged 3+ years, cannot speak English well or cannot speak English at all which represents just under 3% of Hull’s population. The highest percentages who could not speak English well or at all occurred for people who used sign language or other communication systems (96 of the 143 residents: 67%), and residents whose main language was Chinese (353 of the 655 residents: 54%) or Turkish (224 of the 540 residents: 42%). However, the largest number of people who could not speak English well or at all was among people who spoke Polish with almost 2,700 residents who spoke Polish as their main language not being able to speak English well at all (this represented 31.5% all residents who spoke Polish as their main language).
- Almost a half of all residents of Hull stated they had no religion (49.2%) with the remaining Christian (39.9%), Muslim (3.5%), Buddhist (0.3%), Hindu (0.2%), Sikh (0.1%) and Jewish (0.1%) with 0.4% stating they had another religion and for the remaining 6.4% religion was not stated.
- There is a ‘healthy migrant affect’ in that people who tend to migrate have better health and opportunities than people who chose not to migrate. However, health is poorer among asylum seekers and refugees, and people from some ethnic minority backgrounds have a greater risk of some disease and medical conditions. People from white Gypsy or Irish Traveller, Bangladeshi and Pakistani communities have the poorest health outcomes across a range of indicators. Rates of infant and maternal mortality, cardiovascular disease and diabetes are higher among people with black and South Asian ethnic backgrounds compared to people white ethnic backgrounds. Mortality from cancer, dementia and Alzheimer’s disease is highest among people with white ethnic backgrounds. Men from black backgrounds are more likely to received a prostate cancer diagnosis. There is significant evidence that people from ethnic minority backgrounds are at higher risk of serious illness should they contract COVD-19. Furthermore, some ethnic minority groups are disproportionately represented in occupations that were known to increase the likelihood of contracting the virus.
- There is often a lack of information in relation to the health and wellbeing needs of people from ethnic minority backgrounds as ethnicity is not recorded accurately or fully on many health and other datasets. Additionally, different datasets can record ethnicity in different ways, or there have been changes in the way it has been recorded over time. As the King’s Fund state, unpicking the cause of inequalities among people with different ethnic backgrounds is difficult as there is often complex interplay of many factors including deprivation, environment, health-related behaviours and the ‘healthy migrant effect’. However, most ethnic minority groups are disproportionately affected by socio-economic deprivation, a key determinant of health status in all communities.
- Structural racism can reinforce inequalities, for example, in housing, employment and the criminal justice system, which in turn can have a negative impact on health. Racism and discrimination impacts negatively on physical and mental health.
- Furthermore, some people from ethnic minority backgrounds may experience language barriers and other barriers in relation to accessing services.
The Population Affected – Why Is It Important?
Race is generally defined as a combination of physical, behavioural and cultural attributes, whereas ethnicity recognises differences between people on the basis of language and shared culture. Race is often perceived as something that is inherent in our biology, and therefore inherited across generations. Ethnicity is more something we acquire, or self-ascribe, based on factors such as where we live or the culture that we share with others. As a result, people can ascribe themselves to more than one ethnic group based on their ascribed racial identity, culture, ancestry and religion. Furthermore, there is a great deal of variation within different ‘groups’ of individuals regardless of how the groups are defined. Everybody is unique. Generally, the complexity of race and ethnicity are not captured when recording personal characteristics of people whether that is in the Census or among people using different services such as attending health appointments or using local services.
Nevertheless, based on averages, people from different racial and ethnic groups, people can have different health needs as they may have an increased risk of specific diseases due to different genetic risk factors or have different prevalence of lifestyle and behavioural risk factors and may have some problems accessing services due to barriers such as language or due to cultural differences. There may also be increased lack of knowledge around what services are available and how they can be accessed. It is vital that these potential factors are considered so that everybody has good healthcare and access to services.
The Macpherson Report of 1999 highlighted that sometimes services are not meeting the needs of an ethnically diverse population because of both unwitting and institutional racism, which was defined as: “The collective failure of an organisation to provide an appropriate and professional service to people because of their colour, culture or ethnic origin. It can be seen or detected in processes, attitudes and behaviour which amount to discrimination through unwitting prejudice, ignorance, thoughtlessness and racial stereotyping.” This occurs because the majority population, usually white, set the rules and design the services without meaningful and fully listened to input from local diverse and usually minority communities. These representatives have the necessary understanding of their individual communities and the cultural, language and communication barriers, including how and where their communities gather information about services which may not always be the ‘mainstream’ channels. Meaningful involvement and representation from all ethnic minority communities is therefore essential for understanding and meeting the needs of all our communities. This involvement must not be ignored, it must be positively welcomed and incorporated into the design of inclusive services.
In order to assess the different needs of people from different ethnic minority backgrounds, it is essential to understand the health and wellbeing needs as well as understand any wider determinants of health (such as deprivation, housing, education, employment, etc) and differences in lifestyle and behaviour factors which may impact health in relation to the ethnic minorities. However, this is not always easy. Ethnicity is not generally collected in a standard and comprehensive manner across different service areas with different organisations often collecting the data and classifying ethnicity in different ways. As well as differences in the way ethnicity is recorded in different datasets, there are often changes over time in the way ethnicity has been collected. This makes it more difficult to examine the health and wellbeing needs of people from ethnic minority backgrounds. Furthermore, the numbers of people accessing different services can be small for specific ethnic minority groups, which makes the analysis of data difficult when dealing with small numbers as the data is not robust (see Small Numbers for more information).
The Hull Picture
Estimated Number of People From Different Ethnic Minority Backgrounds
Estimates from 2021 Census
From the 2021 Census, 91.8% of Hull residents were white, with 83.9% being white British. A further 2.8% were Asian or Asian British, 1.9% were black, black British, Caribbean or African, 1.7% residents were from mixed ethnic backgrounds, 0.5% were Arabs and 1.3% were from other ethnic groups.
| Ethnicity in 2021 Census | Hull (%) | Hull (N) | England (%) |
| WHITE | 91.8 | 244,989 | 81.0 |
| White British | 83.9 | 223,962 | 73.5 |
| White Irish | 0.2 | 455 | 0.9 |
| White Gypsy or Irish Traveller | 0.1 | 451 | 0.1 |
| Roma | 0.1 | 286 | 0.2 |
| Any other white background | 7.4 | 19,835 | 6.3 |
| MIXED OR MULTIPLE ETHNIC GROUPS | 1.7 | 4,513 | 3.0 |
| White and black Caribbean | 0.4 | 948 | 0.4 |
| White and black African | 0.4 | 1,144 | 0.9 |
| White and Asian | 0.4 | 1,172 | 0.8 |
| Any other mixed ethnic groups | 0.5 | 1,249 | 0.8 |
| ASIAN OR BRITISH ASIAN | 2.8 | 7,515 | 9.6 |
| Indian | 0.5 | 1,259 | 3.3 |
| Pakistani | 0.5 | 1,292 | 2.8 |
| Bangladeshi | 0.5 | 1,279 | 1.1 |
| Chinese | 0.5 | 1,234 | 0.8 |
| Any other Asian background | 0.9 | 2,451 | 1.7 |
| BLACK, BLACK BRITISH, CARIBBEAN OR AFRICAN | 1.9 | 5,065 | 4.2 |
| Black Caribbean | 0.1 | 232 | 2.6 |
| Black African | 1.6 | 4,292 | 1.1 |
| Any other black background | 0.2 | 541 | 0.5 |
| ANY OTHER ETHNIC GROUP | 1.8 | 4,931 | 2.2 |
| Arab | 0.5 | 1,443 | 0.6 |
| Any other ethnic group | 1.3 | 3,488 | 1.6 |
| TOTAL | 100.0 | 267,013 | 100.0 |
| Ethnic Minorities (excluding white minorities) | 8.2 | 22,024 | 19.0 |
| All Ethnic Minorities | 16.1 | 43,051 | 26.5 |
County of Birth from 2021 Census
Detailed information is available from the 2021 Census relating to the country of birth. This cannot be combined with ethnicity due to small numbers, confidentiality and disclosure reasons, but may give a guide as to the ranges of countries where Hull residents were born. It is likely that a relatively high percentage of people from Asian or British Asian communities were born in the UK, but for other minority ethnic communities where the change in Hull’s population has been more recent, for instance, people from Eastern Europe coming to Hull, county of birth may reflect ethnicity. There will be some British citizens that were born abroad. The following table presents the county of birth for countries with the highest number of Hull residents.
Overall, 86.9% of Hull residents at the time of the 2021 Census were born in the UK with relatively high numbers of residents born in Eastern European countries, the Middle East, the Indian subcontinent, and parts of Africa as well as a relatively high number born in Germany which could be related to armed forces personnel.
However, there has been relatively high levels of international migration into Hull since the Census, so it is possible that ethnicity and country of birth of Hull’s residents could have changed slightly since the Census in 2021.
| Country of birth | Number of Hull residents | Percentage of Hull residents |
| England | 229,086 | 85.8 |
| Scotland, Wales or Northern Ireland | 2,963 | 1.1 |
| United Kingdom | 232,049 | 86.9 |
| Poland | 9,058 | 3.4 |
| Romanian | 3,602 | 1.3 |
| Latvia | 1,862 | 0.7 |
| Lithuania | 1,774 | 0.7 |
| Iraq | 1,430 | 0.5 |
| Germany | 974 | 0.4 |
| Nigeria | 882 | 0.3 |
| India | 850 | 0.3 |
| Pakistan | 607 | 0.2 |
| Philippines | 607 | 0.2 |
| Bangladeshi | 604 | 0.2 |
| China | 572 | 0.2 |
| Turkey | 532 | 0.2 |
| Italy | 516 | 0.2 |
| Bulgaria | 511 | 0.2 |
| Portugal (including Madeira and the Azores) | 446 | 0.2 |
| Iran | 438 | 0.2 |
| Slovakia | 412 | 0.2 |
| Syria | 411 | 0.2 |
| Zimbabwe | 357 | 0.1 |
| Hungary | 349 | 0.1 |
| Ireland | 327 | 0.1 |
| Ghana | 313 | 0.1 |
| Sudan | 284 | 0.1 |
| Afghanistan | 284 | 0.1 |
| Spain (including Canary Islands) | 281 | 0.1 |
| Congo (Democratic Republic) | 275 | 0.1 |
| South Africa | 260 | 0.1 |
| Moldova | 259 | 0.1 |
| Hong Kong (Special Administrative Region of China) | 215 | 0.1 |
| United States | 208 | 0.1 |
| Other countries (<200 residents) | 5,424 | 2.0 |
| Total number of Hull residents | 267,020 | 100.0 |
Changes Over Time Across Censuses
The percentage of Hull’s resident population from ethnic minority backgrounds has increased over time. Between 2011 and 2021, the largest increases occurred for Arab and other ethnic groups (120% increase), other white (82% increase), other black (80% increase), Africans (67% increase) and Bangladeshi (63% increase). The only ethnic minority group where the percentage of residents decreased was for Chinese (44% decrease).
However, over the last 20 years, the largest increases have occurred for other white, Arab and other ethnic groups, other black, Black African and other Asians.
| Ethnicity in the last three Censuses (%) | 2001 | 2011 | 2021 |
| WHITE | 97.7 | 94.1 | 91.8 |
| White British | 96.4 | 89.7 | 83.9 |
| White Irish | 0.3 | 0.2 | 0.2 |
| White Gypsy or Irish Traveller/Roma | * | 0.1 | 0.2 |
| Any other white background | 1.0 | 4.1 | 7.4 |
| MIXED OR MULTIPLE ETHNIC GROUPS | 0.7 | 1.3 | 1.7 |
| White and black Caribbean | 0.1 | 0.3 | 0.4 |
| White and black African | 0.1 | 0.3 | 0.4 |
| White and Asian | 0.2 | 0.4 | 0.4 |
| Any other mixed ethnic groups | 0.2 | 0.3 | 0.5 |
| ASIAN OR BRITISH ASIAN | 1.1 | 2.5 | 2.8 |
| Indian | 0.3 | 0.4 | 0.5 |
| Pakistani | 0.2 | 0.3 | 0.5 |
| Bangladeshi | 0.2 | 0.3 | 0.5 |
| Chinese | 0.3 | 0.8 | 0.5 |
| Any other Asian background | 0.2 | 0.6 | 0.9 |
| BLACK, BLACK BRITISH, CARIBBEAN OR AFRICAN | 0.4 | 1.2 | 1.9 |
| Black Caribbean | 0.1 | 0.1 | 0.1 |
| Black African | 0.3 | 1.0 | 1.6 |
| Any other black background | 0.0 | 0.1 | 0.2 |
| ANY OTHER ETHNIC GROUP | 0.2 | 0.8 | 1.8 |
| Arab | * | 0.4 | 0.5 |
| Any other ethnic group | 0.2 | 0.4 | 1.3 |
| TOTAL | 100.0 | 100.0 | 100.0 |
| Ethnic Minorities (excluding white minorities) | 2.3 | 5.9 | 8.2 |
| All Ethnic Minorities | 3.6 | 10.3 | 16.1 |
Differences Across Hull’s Wards
There were also large differences in percentage of people from ethnic minority backgrounds across Hull’s 21 electoral wards. Wards in the centre of Hull and around Hull University were generally the most diverse, with the percentage of residents from ethnic minority backgrounds highest in Central (46.6%), St Andrew’s & Docklands (39.8%), Beverley & Newland (29.4%), Avenue (25.9%), University (25.5%) and Newington & Gipsyville (24.8%).
| Ethnicity from the 2021 census (%) by ward and area committee area | White British | Other white | Ethnic minorities (excl. white minorities) | All ethnic minorities |
| Boothferry | 93.0 | 3.0 | 4.0 | 7.0 |
| Derringham | 94.6 | 2.1 | 3.3 | 5.4 |
| Pickering | 91.5 | 3.7 | 4.7 | 8.5 |
| West Area Committee | 93.2 | 2.9 | 3.9 | 6.8 |
| Central | 53.4 | 21.8 | 24.8 | 46.6 |
| Newington & Gipsyville | 75.2 | 14.2 | 10.6 | 24.8 |
| St Andrew’s & Docklands | 60.2 | 17.8 | 21.9 | 39.8 |
| Riverside Area Committee | 64.3 | 17.4 | 18.3 | 35.7 |
| Avenue | 74.1 | 11.2 | 14.7 | 25.9 |
| Beverley & Newland | 70.6 | 17.1 | 12.2 | 29.4 |
| Bricknell | 89.8 | 3.0 | 7.2 | 10.2 |
| Orchard Park | 80.7 | 11.5 | 7.8 | 19.3 |
| University | 74.5 | 8.2 | 17.3 | 25.5 |
| North West Area committee Area | 77.0 | 11.1 | 11.9 | 23.0 |
| Kingswood | 90.6 | 3.4 | 5.9 | 9.4 |
| North Carr | 93.2 | 3.4 | 3.4 | 6.8 |
| Sutton | 95.9 | 2.2 | 2.0 | 4.1 |
| West Carr | 95.0 | 2.4 | 2.6 | 5.0 |
| Foredyke Area Committee | 93.9 | 2.8 | 3.3 | 6.1 |
| Drypool | 82.9 | 7.9 | 9.2 | 17.1 |
| Holderness | 94.7 | 2.7 | 2.5 | 5.3 |
| Southcoates | 88.5 | 6.6 | 4.9 | 11.5 |
| East Central Area Committee | 88.7 | 5.8 | 5.5 | 11.3 |
| Ings | 95.7 | 1.7 | 2.6 | 4.3 |
| Longhill & Bilton Grange | 93.6 | 3.9 | 2.6 | 6.4 |
| Marfleet | 90.3 | 6.0 | 3.7 | 9.7 |
| East Area Committee | 92.8 | 4.1 | 3.0 | 7.2 |
| HULL | 83.9 | 7.9 | 8.2 | 16.1 |
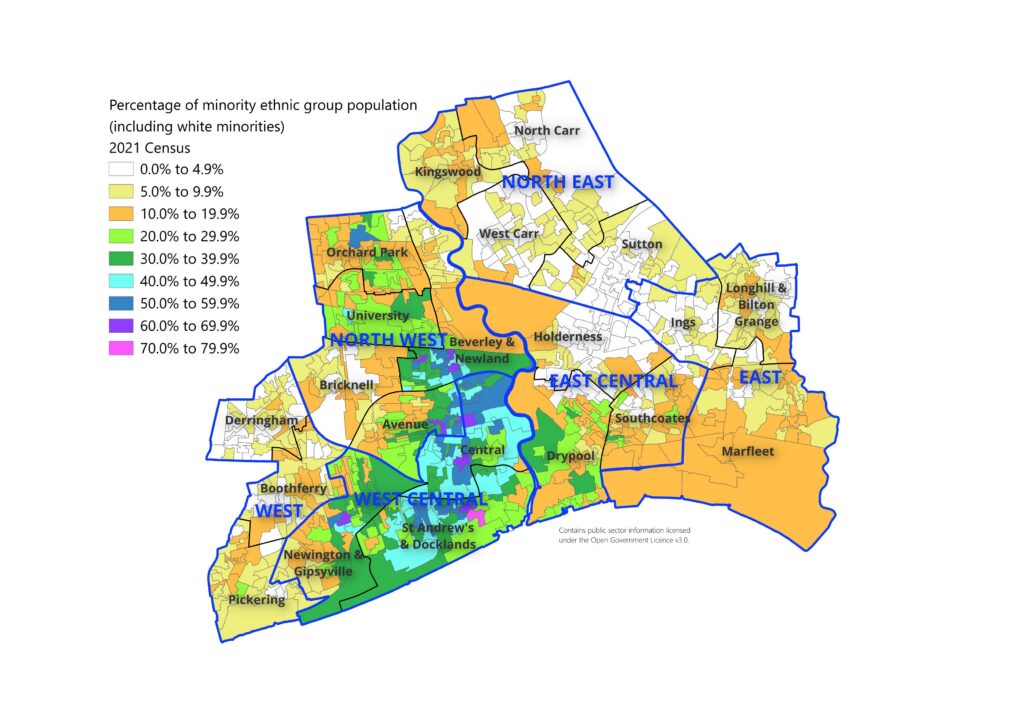
The map shows the percentage of Hull’s resident population who were from ethnic minority backgrounds for each of the 881 Output Areas in Hull (see Glossary for more information on these geographical areas).
There is a huge difference in the percentages for these small geographical areas which range from zero to three-quarters. The highest percentages are within St Andrew’s & Docklands and Central wards with high percentages also in parts of Newington & Gipsyville, Avenue, Drypool, Beverley & Newland, University and Orchard Park wards. The percentages are low to the east of the city particularly the north east in North Carr, West Carr, Sutton, Ings and parts of Longhill & Bilton Grange and Holderness wards as well as a couple of wards in the west such as Derringham and Bricknell.
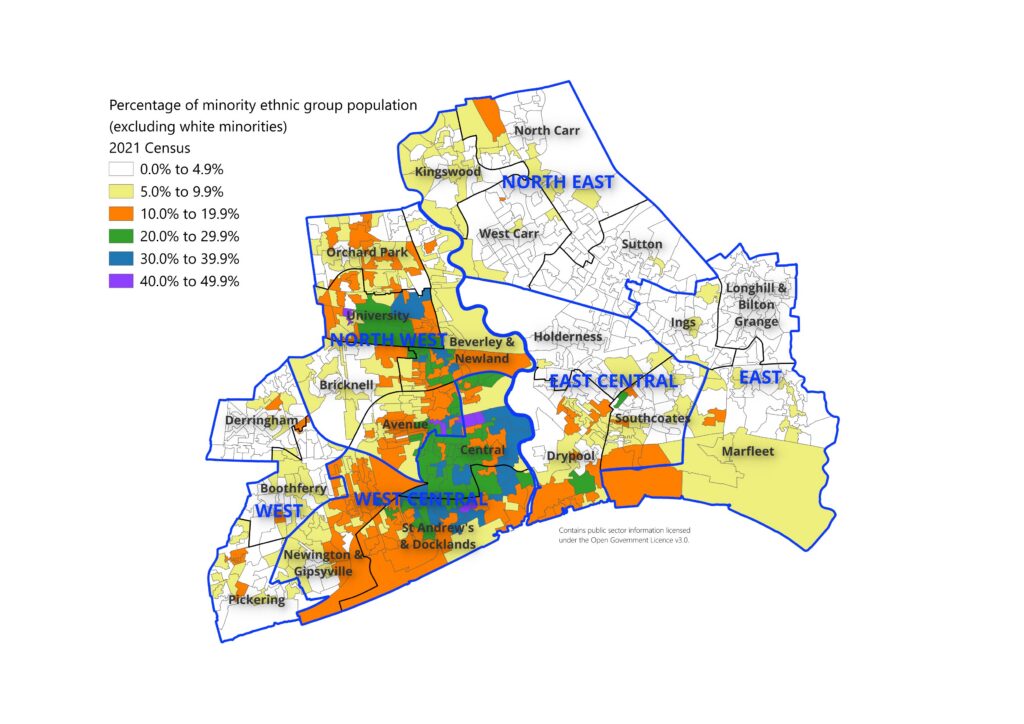
The following map shows the percentage of Hull’s population who were from ethnic minority backgrounds (excluding white minorities), and shows the percentage are generally less than 5% for the north and north east, and west of the city. The highest percentages occur in St Andrew’s & Docklands, Central and University wards.
Differences by Age
As well as differing by geographical areas, the percentages from ethnic minority backgrounds did differ considerably by age with a higher percentage of the resident population from ethnic minority backgrounds among younger people.
| Ethnicity by age (%) | 0-4 | 5-15 | 16-24 | 25-34 | 35-44 | 45-54 | 55-64 | 65+ |
| WHITE | 86.3 | 87.8 | 88.6 | 90.7 | 89.2 | 93.3 | 96.3 | 98.1 |
| White British | 78.9 | 79.6 | 80.1 | 79.4 | 75.4 | 858.1 | 92.5 | 96.6 |
| White Irish | 0.0 | 0.0 | 0.2 | 0.2 | 0.2 | 0.2 | 0.3 | 0.3 |
| White Gypsy or Irish Traveller/Roma | 0.3 | 0.3 | 0.4 | 0.3 | 0.5 | 0.3 | 0.1 | 0.1 |
| Any other white background | 7.1 | 8.0 | 7.9 | 10.9 | 13.2 | 7.6 | 3.4 | 1.3 |
| MIXED OR MULTIPLE ETHNIC GROUPS | 3.5 | 3.4 | 2.6 | 1.3 | 1.4 | 1.1 | 0.9 | 0.4 |
| White and black Caribbean | 0.6 | 0.6 | 0.6 | 0.3 | 0.3 | 0.3 | 0.2 | 0.2 |
| White and black African | 1.1 | 1.1 | 0.7 | 0.2 | 0.3 | 0.2 | 0.1 | 0.1 |
| White and Asian | 0.9 | 0.9 | 0.7 | 0.3 | 0.4 | 0.3 | 0.1 | 0.1 |
| Any other mixed background | 0.9 | 0.8 | 0.7 | 0.4 | 0.4 | 0.3 | 0.4 | 0.1 |
| ASIAN OR BRITISH ASIAN | 4.2 | 3.2 | 3.6 | 3.7 | 4.2 | 2.5 | 1.4 | 0.7 |
| Indian | 0.8 | 0.4 | 0.6 | 0.7 | 0.6 | 0.4 | 0.4 | 0.1 |
| Pakistani | 0.9 | 0.6 | 0.7 | 0.6 | 0.7 | 0.3 | 0.2 | 0.1 |
| Bangladeshi | 1.1 | 0.7 | 0.6 | 0.5 | 0.8 | 0.3 | 0.1 | 0.1 |
| Chinese | 0.4 | 0.5 | 0.7 | 0.5 | 0.6 | 0.5 | 0.3 | 0.3 |
| Any other Asian background | 1.0 | 1.0 | 1.1 | 1.4 | 1.6 | 0.9 | 0.3 | 0.1 |
| BLACK, BLACK BRITISH, CARIBBEAN OR AFRICAN | 2.9 | 2.9 | 3.0 | 1.9 | 2.4 | 1.7 | 0.8 | 0.3 |
| Black Caribbean | 0.0 | 0.1 | 0.1 | 0.1 | 0.1 | 0.1 | 0.1 | 0.0 |
| Black African | 2.4 | 2.3 | 2.7 | 1.8 | 2.2 | 1.4 | 0.6 | 0.2 |
| Any other black background | 0.5 | 0.6 | 0.3 | 0.1 | 0.1 | 0.1 | 0.1 | 0.0 |
| ANY OTHER ETHNIC GROUP | 3.1 | 2.6 | 2.2 | 2.3 | 2.8 | 1.5 | 0.7 | 0.2 |
| Arab | 0.7 | 0.9 | 0.9 | 0.6 | 0.6 | 0.5 | 0.2 | 0.1 |
| Any other ethnic group | 2.5 | 1.7 | 1.3 | 1.8 | 2.2 | 1.1 | 0.5 | 0.1 |
| TOTAL | 100 | 100 | 100 | 100 | 100 | 100 | 100 | 100 |
| Ethnic Minorities (excluding white minorities) | 13.7 | 12.2 | 11.4 | 9.3 | 10.8 | 6.7 | 3.7 | 1.7 |
| All Ethnic Minorities | 21.1 | 20.4 | 19.9 | 20.6 | 24.6 | 14.9 | 7.5 | 3.4 |
The numbers by ethnic minority background for the same ages are given below.
| Ethnicity by age (numbers) | 0-4 | 5-15 | 16-24 | 25-34 | 35-44 | 45-54 | 55-64 | 65+ |
| WHITE | 13,766 | 32,662 | 28,166 | 37,231 | 30,784 | 31,294 | 30,937 | 40,148 |
| White British | 12,585 | 29,588 | 25,478 | 32,578 | 26,008 | 28,5873 | 29,716 | 39,436 |
| White Irish | 5 | 9 | 53 | 63 | 53 | 53 | 81 | 140 |
| White Gypsy or Irish Traveller/Roma | 45 | 93 | 114 | 129 | 167 | 114 | 45 | 26 |
| Any other white background | 1,131 | 2,972 | 2,521 | 4,461 | 4,556 | 2,554 | 1,095 | 546 |
| MIXED OR MULTIPLE ETHNIC GROUPS | 557 | 1,273 | 834 | 541 | 471 | 369 | 284 | 179 |
| White and black Caribbean | 92 | 216 | 179 | 135 | 90 | 91 | 72 | 72 |
| White and black African | 179 | 416 | 209 | 102 | 98 | 63 | 48 | 29 |
| White and Asian | 138 | 332 | 234 | 143 | 145 | 106 | 48 | 24 |
| Any other mixed background | 148 | 309 | 212 | 161 | 138 | 109 | 116 | 54 |
| ASIAN OR BRITISH ASIAN | 666 | 1,185 | 1,158 | 1,515 | 1,452 | 823 | 438 | 282 |
| Indian | 126 | 143 | 193 | 287 | 206 | 130 | 113 | 61 |
| Pakistani | 143 | 235 | 224 | 250 | 243 | 97 | 63 | 38 |
| Bangladeshi | 180 | 265 | 179 | 214 | 260 | 109 | 48 | 26 |
| Chinese | 57 | 172 | 213 | 203 | 203 | 172 | 109 | 107 |
| Any other Asian background | 160 | 370 | 349 | 561 | 540 | 315 | 105 | 50 |
| BLACK, BLACK BRITISH, CARIBBEAN OR AFRICAN | 467 | 1,093 | 965 | 789 | 830 | 558 | 252 | 114 |
| Black Caribbean | 5 | 29 | 36 | 38 | 41 | 34 | 38 | 12 |
| Black African | 381 | 850 | 847 | 723 | 745 | 484 | 180 | 83 |
| Any other black background | 81 | 214 | 82 | 28 | 44 | 40 | 34 | 19 |
| ANY OTHER ETHNIC GROUP | 497 | 969 | 685 | 962 | 972 | 514 | 231 | 99 |
| Arab | 104 | 323 | 275 | 242 | 221 | 156 | 77 | 45 |
| Any other ethnic group | 393 | 646 | 410 | 720 | 751 | 358 | 154 | 54 |
| TOTAL | 15,953 | 37,182 | 31,808 | 41,038 | 34,509 | 33,558 | 32,142 | 40,822 |
| Ethnic Minorities (excluding white minorities) | 2,187 | 4,520 | 3,642 | 3,807 | 3,725 | 2,264 | 1,205 | 674 |
| All Ethnic Minorities | 3,368 | 7,594 | 6,330 | 8,460 | 8,501 | 4,985 | 2,426 | 1,386 |
Ethnicity Within Hull’s Schools
The percentage of pupils from ethnic minority backgrounds attending Hull schools has increased threefold over the last 15 years, from 9.1% in 2010 to 28.1% in 2025.
The ethnic breakdown of school pupils in Hull in the 2024-25 academic year are shown below, with comparisons to England.
| Ethnicity among school pupils | Hull (%) | Hull (N) | England (%) |
| WHITE | 81.3 | 34,851 | 68.1 |
| White British | 71.9 | 30,816 | 60.4 |
| Irish | 0.1 | 27 | 0.2 |
| Traveller of Irish heritage | 0.0 | 5 | 0.1 |
| Gypsy/Roma | 0.5 | 196 | 0.3 |
| Any other white background | 8.9 | 3,807 | 7.1 |
| MIXED OR MULTIPLE ETHNIC GROUPS | 4.5 | 1,909 | 7.2 |
| White and black Caribbean | 0.3 | 117 | 1.6 |
| White and black African | 0.7 | 313 | 1.0 |
| White and Asian | 0.6 | 276 | 1.7 |
| Any other mixed background | 2.8 | 1,203 | 2.9 |
| ASIAN OR BRITISH ASIAN | 2.5 | 1,092 | 13.7 |
| Indian | 0.5 | 193 | 4.2 |
| Pakistani | 0.6 | 255 | 4.6 |
| Bangladeshi | 0.6 | 252 | 1.8 |
| Chinese | 0.2 | 74 | 0.8 |
| Any other Asian background | 0.7 | 318 | 2.3 |
| BLACK, BLACK BRITISH, CARIBBEAN OR AFRICAN | 5.9 | 2,510 | 6.9 |
| Black Caribbean | 0.1 | 40 | 0.9 |
| Black African | 5.1 | 2,179 | 5.2 |
| Any other black background | 0.7 | 291 | 0.8 |
| ANY OTHER ETHNIC GROUP | |||
| Any other ethnic group | 3.7 | 1,601 | 2.5 |
| Unclassified | 2.1 | 922 | 1.6 |
| All Ethnic Minorities | 28.1 | 12,069 | 39.6 |
Among state-funded mainstream schools in Hull for the 2024-25 academic year, 20.6% of primary school, 17.0% of secondary school and 10.2% of special school pupils did not have English as their first language. Whilst these percentages are lower than England (23.4%, 19.2% and 14.5% respectively), the differences between Hull and England appear to be reducing over time. The figures were 17.4%, 14.5% and 9.0% for 2020/21 respectively so numbers have increased in Hull in recent years. For the 2024-25 school year, this equates to 5,084 primary, 2,888 secondary and 86 special school pupils whose first language is not English, a total of 8,058 pupils, and it is estimated that pupils in Hull speak a range of around 122 different languages other than English.
However, there were very large differences in the percentage of pupils whose first language was not English across Hull’s schools. Among special schools, the percentages ranged from 1.6% to 21.1% in Ganton School. Among primary schools, the percentages ranged from 1.6% to 76.6%, and among secondary schools, the percentages ranged from 2.5% to 49.6% in The Boulevard Academy.
The following schools have fewer than 5% of its pupils whose first language was not English:
- Wansbeck Primary School (1.6%)
- St Andrew’s Church of England Voluntary Aided Primary School (3.2%)
- Gillshill Primary School (3.4%)
- Spring Cottage Primary School (3.6%)
- Neasden Primary School (3.9%)
- Ings Primary School (4.2%)
- Highlands Primary School (4.8%)
- Bude Park Primary School (4.8%)
- Oakfield Special School (1.6%)
- Bridgeview Special School (4.8%)
- Winifred Holtby Secondary Academy (2.8%)
The following schools have the majority of its pupils whose first language was not English:
- Sidmouth Primary School (52.8%)
- Wheeler Primary School (55.5%)
- Clifton Primary School (55.9%)
- St Charles Voluntary Catholic Academy (56.6%)
- Collingwood Primary School (61.1%)
- Pearson Primary School (64.7%)
- Stepney Primary School (69.4%)
- Adelaide Primary School (71.6%)
- St Vincent’s Voluntary Catholic Academy (76.6%)
Recent International Migration
Whilst the latest Census in 2021 provided estimates on the percentage of ethnic minorities across different populations, the resident population estimates from the Office for National Statistics present changes in migration including international migration. Between mid-2021 and mid-2024, ONS estimate that since 2001, international migration has added 16,615 people to Hull’s population. Not all the people coming into Hull will be from minority ethnic groups as some people could be white British returning to the UK, but it is likely that a sizable proportion are from minority ethnic groups. On this basis, it does suggest that Hull’s minority ethnic minority population may have increased since the 2021 Census. Furthermore, there are differences in the age profile for the international migration net figures. Between mid-2023 and mid-2024, when net international migration added 5,540 people to Hull’s population, 1,741 (31.4%) were aged 0-17 years, 406 (7.3%) were aged 18-24 years, 2 924 (52.8%) were aged 25-39 years, 468 (8.4%) were aged 40-64 years and 1 (<0.1%) were aged 65+ years.
| Population / component | 2021 | 2022 | 2023 | 2024 |
| Population at starting mid-year | 266,516 | 268,768 | 273,069 | 275,401 |
| Births | 3,202 | 3,067 | 3,119 | |
| Deaths | 2,704 | 2,749 | 2,590 | |
| Natural change | 498 | 318 | 529 | |
| Internal migration in | 11,769 | 11,716 | 11,713 | |
| Internal migration out | 14,662 | 14,141 | 15,373 | |
| Internal migration net | -2,893 | -2.425 | -3.660 | |
| International migration in | 6,483 | 7,925 | 7,640 | |
| International migration out | 1,743 | 1,590 | 2,100 | |
| International migration net | 4,740 | 6,335 | 5,540 | |
| Other changes (e.g. armed services, prisons) | -93 | 73 | -77 | |
| Total change | 2,252 | 4,301 | 2,332 | |
| Population at ending mid-year | 268,768 | 273,069 | 275,401 |
However, the differences are not uniform across the different age groups particularly for natural changes in the population. The highest rates of both net internal migration and net international migration occur in the 25-39 year age group with an increase in the population aged 25-39 years overall but an increase due to international migration which is larger than the decrease due to internal migration.
Among the 0-17 year age group, there were fewer births relative to the numbers moving into the 18-24 year age group so that the population would have reduced by 235 people based on ageing and the natural change in the population (including the small number of deaths). However, there was an increase of 3,325 residents in the total population aged 0-17 years over the three year period as 3,560 more children and young people aged 0-17 years moved into Hull compared to moving out of Hull.
With fewer people moving into the 18-24 year age group from 0-17 year age group compared to the number aged 18-24 years moving into the 25-39 year age group, the number of residents aged 18-24 years would have decreased by 1,493 including the 29 deaths in this age group. However, the number of residents aged 18-24 years has only decreased by 645 people as 848 more people aged 18-24 years have moved into Hull compared to those who left Hull.
The impact of migration into Hull is even more significant among the 25-39 year age group. There was an estimated 109 new people in the 25-39 year age group as 11,039 from the 18-24 year age group came into the 25-39 year age group but 10,930 people from the 25-39 year age group moved into the 40-64 year age group. With 172 deaths in this age group, the ageing effect and natural change would would have meant that the population reduced by 63 people in this age group. However, there was an increase of 4,286 people due to more people aged 25-39 years coming into Hull compared to leaving Hull over the three year period.
The pattern was different in the 40-64 year age group. Overall, 10,930 people moved into this age group from the 25-39 year age group but only 8,502 people aged 40-64 years moved into the 65+ year age group. A further 1,383 people aged 40-64 years died within the three year period, resulting in a increase in the population of 1,045 due to ageing and natural change. However, as there were an estimated 707 more people aged 40-64 years moving out of Hull compared to moving into Hull, the estimated population aged 40-64 years increased by only 338 residents.
There is relative small changes to the population aged 65+ years due to internal and international migration with only 510 moving out of Hull, but there were over 6,411 deaths among those aged 65+ years over the three year period. However, the population aged 65+ years has increased over the last three years as 8,502 people who were within the 40-64 year age group three years ago have now aged by three years, and are now included within the 65+ year age group.
| Population / component | 0-17 | 18-24 | 25-39 | 40-64 | 65+ | All ages |
| Population 2021 | 59,054 | 25,203 | 59,611 | 81,530 | 41,118 | 266,516 |
| Births | 9,388 | |||||
| Deaths | 48 | 29 | 172 | 1,383 | 6,411 | 8,043 |
| Natural change | 9,340 | -29 | -172 | -1,383 | -6,411 | -8,043 |
| Internal migration in | 4,427 | 11,638 | 11,377 | 5,736 | 2,020 | 35,198 |
| Internal migration out | 6,331 | 11,717 | 15,617 | 7,992 | 2,519 | 44,176 |
| Internal migration net | -1,904 | -79 | -4,240 | -2,256 | -499 | -8,978 |
| International migration in | 5,940 | 2,101 | 10,986 | 2,885 | 136 | 22,048 |
| International migration out | 472 | 1,037 | 2,451 | 1,373 | 100 | 5,433 |
| International migration net | 5,468 | 1,064 | 8,535 | 1,512 | 36 | 16,615 |
| Other change | -4 | -137 | 54 | 37 | -47 | -97 |
| Total internal and international migration | 3,560 | 848 | 4,349 | -707 | -510 | 7,540 |
| Total change including natural change | 12,900 | 819 | 4,177 | -2,090 | -6,921 | 8,885 |
| Ageing effect – moving out of age group* | 9,575 | 11,039 | 10,930 | 8,502 | 0 | 40,046 |
| Ageing effect – moving into age group* | 0 | 9,575 | 11,039 | 10,930 | 8,502 | 40,046 |
| Ageing effect – change | -9,575 | -1,464 | 109 | 2,428 | 8,805 | 0 |
| Ageing effect and natural change | -235 | -1,493 | -63 | 1,045 | 2,091 | 1,345 |
| Population 2024 | 62,379 | 24,558 | 63,897 | 81,868 | 42,699 | 275,401 |
| Change 2021 to 2024 | 3,325 | -645 | 4,286 | 338 | 1,581 | 8,885 |
Main Language Spoken
The 2021 Census also collected information on the main language spoken which is a person’s first or preferred language. The information was collected on all residents who were aged 3+ years. There were a total of 84 different languages for Hull in the Census where at least one resident aged 3+ years spoke that language, although this may be an underestimate as some languages were grouped together into broader groups such as ‘any other Chinese language’, ‘other European language’ or ‘any other West African language’. Nine in ten residents of Hull spoke English as their first or preferred language.
| Main language | Number | Percentage |
| English | 231,761 | 90.0 |
| Polish | 8,564 | 3.3 |
| Romanian | 3,245 | 1.3 |
| Lithuanian | 1,517 | 0.6 |
| Arabic | 1,287 | 0.5 |
| Kurdish | 1,248 | 0.5 |
| Russian | 1,061 | 0.4 |
| Latvian | 930 | 0.4 |
| Turkish | 547 | 0.2 |
| Portuguese | 536 | 0.2 |
| Bengali (with Sylheti and Chatgaya) | 457 | 0.2 |
| All other Chinese (not Mandarin or Cantonese) | 450 | 0.2 |
| Persian or Farsi | 405 | 0.2 |
| Bulgarian | 404 | 0.2 |
| Hungarian | 382 | 0.1 |
| Slovak | 362 | 0.1 |
| Tagalog or Filipino | 329 | 0.1 |
| Urdu | 317 | 0.1 |
| Spanish | 313 | 0.1 |
| Italian | 294 | 0.1 |
| Igbo | 178 | 0.1 |
| Any other African language | 178 | 0.1 |
| Panjabi | 173 | 0.1 |
| Swahili or Kiswahili | 144 | 0.1 |
| Greek | 142 | 0.1 |
| Pashto | 137 | 0.1 |
| Czech | 132 | 0.1 |
| Tamil | 127 | 0.0 |
| Cantonese Chinese | 125 | 0.0 |
| Malayalam | 124 | 0.0 |
| Mandarin Chinese | 122 | 0.0 |
| Somali | 113 | 0.0 |
| British Sign Language | 112 | 0.0 |
| French | 102 | 0.0 |
| Vietnamese | 102 | 0.0 |
| Thai | 100 | 0.0 |
| Albanian | 86 | 0.0 |
| Any other West African language | 76 | 0.0 |
| German | 74 | 0.0 |
| Hindi | 67 | 0.0 |
| Tigrinya | 57 | 0.0 |
| Dutch | 54 | 0.0 |
| Other European language | 51 | 0.0 |
| Bosnian, Croatian, Serbian and Montenegrin | 51 | 0.0 |
| Other languages (<50 individuals) | 581 | 0.2 |
| Total residents aged 3+ years | 257,566 | 100.0 |
In 2021, there were around 7,500 residents of Hull who could not speak English well or at all.
| Proficiency in English language | Number | Percent |
| Main language is English | 231,761 | 90.0 |
| Can speak English very well | 8,630 | 3.4 |
| Can speak English well | 9,652 | 3.7 |
| Cannot speak English well | 6,292 | 2.4 |
| Cannot speak English | 1,241 | 0.5 |
| Total residents aged 3+ years | 257,576 | 100.0 |
Overall, there were 25,582 residents of Hull aged 3+ years whose main language was not English. Among those with main language stated and proficiency of England stated, 18,096 (70.7%) could speak English well or very well, 6,261 (24.5%) could not speak English well and 1,225 (4.8%) could not speak English at all.
Whilst the highest percentages who could not speak English well or at all occurred for people using sign language, the total number of residents affected were relatively small in relation to the total numbers who could not speak English well or at all for other languages. More than half of people who spoke Chinese languages could not speak English well or at all, and around four in ten of those who spoke Turkish. Around three in ten who spoke Polish, other European languages, West or Central Asian languages, Bengali (with Sylheti and Chatgaya) could not speak English well or at all. Information relating to proficiency in the English language from the Census was not available for the full list of languages above with only 24 categories included.
The table below presents the information in order of the highest total number of residents aged 3+ years who cannot speak English well or cannot speak English at all. The highest numbers occurs for residents who spoke Polish or other European languages excluding Portuguese, Spanish and French which are listed separately (with around 2,700 residents among those who spoke Polish and around 2,200 residents among those who spoke other European languages). The remaining individuals can either speak English well or very well.
| Language | Total residents (3+) | Cannot speak English well (N) | Cannot speak English well (%) | Cannot speak English at all (N) | Cannot speak English at all (%) | Cannot speak English well or at all (N) | Cannot speak English well or at all (%) |
| Polish | 8,533 | 2,310 | 27.1 | 382 | 4.5 | 2,692 | 31.5 |
| Other European languages | 7,556 | 1,780 | 23.6 | 426 | 5.6 | 2,206 | 29.2 |
| West or Central Asian languages | 1,798 | 481 | 26.8 | 66 | 3.7 | 547 | 30.4 |
| Mandarin, Cantonese or other Chinese languages | 655 | 314 | 47.9 | 39 | 6.0 | 353 | 53.9 |
| Arabic | 1,270 | 246 | 23.2 | 33 | 3.1 | 315 | 26.3 |
| Russian | 1,059 | 246 | 23.2 | 33 | 3.1 | 279 | 26.3 |
| Turkish | 540 | 164 | 30.4 | 60 | 11.1 | 224 | 41.5 |
| African languages | 884 | 150 | 17.0 | 29 | 3.3 | 179 | 20.2 |
| Bengali (with Sylheti and Chatgaya) | 457 | 134 | 29.3 | 15 | 3.3 | 149 | 32.6 |
| Portuguese | 522 | 96 | 18.4 | 15 | 2.9 | 111 | 21.3 |
| Any other East Asian languages | 599 | 82 | 13.7 | 6 | 1.0 | 88 | 14.7 |
| British Sign Language | 112 | 40 | 35.7 | 29 | 25.9 | 69 | 61.6 |
| Spanish | 304 | 50 | 16.4 | 9 | 3.0 | 59 | 19.4 |
| Urdu | 314 | 46 | 14.6 | 3 | 1.0 | 49 | 15.6 |
| Panjabi | 173 | 29 | 16.8 | 11 | 6.4 | 40 | 23.1 |
| Other European language (non-European Union) | 158 | 29 | 18.4 | 10 | 6.3 | 39 | 24.7 |
| Any other South Asian language | 303 | 21 | 6.9 | 3 | 1.0 | 24 | 7.9 |
| Any sign communication system | 21 | 11 | 52.4 | 8 | 38.1 | 19 | 90.5 |
| Any other languages | 37 | 12 | 32.4 | 1 | 2.7 | 13 | 35.1 |
| Tamil | 127 | 9 | 7.1 | 1 | 0.8 | 10 | 7.9 |
| Any other sign language | 10 | 1 | 10.0 | 7 | 70.0 | 8 | 80.0 |
| Any other UK languages | 28 | 2 | 7.1 | 3 | 10.7 | 5 | 17.9 |
| French | 93 | 4 | 4.3 | 0 | 0.0 | 4 | 4.3 |
| Gujarati | 29 | 4 | 13.8 | 0 | 0.0 | 4 | 13.8 |
| Total | 25,582 | 6,261 | 24.5 | 1,225 | 4.8 | 7,486 | 29.3 |
Religion
The 2021 Census also collected information on religion for all residents.
| Religion | Number | Percentage |
| No religion | 131,424 | 49.2 |
| Christian | 106,411 | 39.9 |
| Muslim | 9,285 | 3.5 |
| Buddhist | 746 | 0.3 |
| Hindu | 646 | 0.2 |
| Sikh | 277 | 0.1 |
| Jewish | 146 | 0.1 |
| Other religion | 1,124 | 0.4 |
| Religion not stated | 16,957 | 6.4 |
| Total residents | 267,016 | 100.0 |
A total of 131,424 were classified as ‘No religion’ and this mainly comprised residents who had specifically selected ‘No religion’ (131,212) but also included 134 with Agnostic, 49 with Atheist and 26 as Humanist.
A total of 1,124 were classified as having other religions and these included Pagan (397), Alevi (81), Spiritualist (76), Wicca (72), Spiritual (62), and Heathen (38).
Strategic Need and Service Provision
There have been relatively large increases in Hull’s ethnic minority population between 2001 and 2021, and it would appear that these are continuing with the relatively high levels international migration into Hull since the 2021 Census. Therefore, it is important that service providers in Hull are taking these changes into consideration when designing their services to ensure there are no barriers to access to healthcare and other services. There should also be work to identify the most vulnerable citizens and work with them to address their specific needs so that all services, policies and strategies are the best they can be for all people regardless of who they are.
There is often a lack of data and information relating to the health and wellbeing for specific ethnic minority groups, and collecting good quality consistent information relating to ethnicity is essential so that the circumstances and needs of people from specific ethnic minority groups can be examined in more detail. Despite the lack of data, there are many ways local services are involving ethnic minority groups in the design of services, policies and strategies so that they meet the needs of specific ethnic minority groups.
Resources
Census 2021. https://www.nomisweb.co.uk/sources/census
Census 2011. https://www.ons.gov.uk/census/2011census
Census 2021. https://www.ons.gov.uk/datasets/create
Census 2021: https://www.nomisweb.co.uk/sources/census_2021
School League Tables: https://www.compare-school-performance.service.gov.uk/
Office for National Statistics. Estimates of the population for England and Wales. https://www.ons.gov.uk/peoplepopulationandcommunity/populationandmigration/populationestimates/datasets/estimatesofthepopulationforenglandandwales
Updates
This page was last updated / checked on 28 May 2026.
This page is due to be updated / checked in February 2027.