Index
This topic area covers statistics and information relating to schools, education attainment and qualifications in Hull including local strategic need and service provision. Further information relating to early years including good child development is given in Early Years and Good Child Development under Pregnancy, Infants and Early Years and information relating to Children with Special Educational Needs or Disabilities is under Health Factors both under the main menu item of Children and Young Children. Further information is also available on Young People Not in Education, Employment or Training under Health and Wellbeing Influences.
This page contains information from the Office for Health Improvement & Disparities’ Fingertips. Information is taken ‘live’ from the site so uses the latest available data from Fingertips and displays it on this page. As a result, some comments on this page may relate to an earlier period of time until this page is next updated (see review dates at the end of this page).
Headlines
- The overall number of school aged children with an Education, Health and Care Plan (EHCP) or with Special Educational Needs Support (SEN Support) steadily increased in Hull between 2015/16 and 2024/25 from 17.3% to 21.1%. For 2024/25, 9,305 of the 44,100 pupils in Hull have an EHCP or require SEN Support which is higher than England and the region (both 19.6%). Some of the increase could be due to increased awareness, testing and better recording.
- For 2024/25, just over one-third (34.7%) of Hull children are are eligible for free school meals which is considerably higher than England where just over a quarter (25.7%) of children are eligible for free school meals. However, there are much higher rates among pupils attending special schools compared to pupils attending mainstream primary or secondary schools. Prior to the COVID-19 pandemic during the 2014/15 to 2018/19 school years, around 23% were eligible for free school meals in Hull, but this has increased sharply in the last few years.
- The percentage of pupils that speak English as an additional language and the numbers from minority ethnic backgrounds has increased quite sharply in the last decade. Overall, 21% of primary school pupils, 17% of secondary school pupils and 10% of pupils attending Hull’s special schools speak English as an additional language. It is estimated that these pupils speak around 120 different languages in total.
- Overall Hull had a higher percentage of schools with either an outstanding or good rating than compared with the region or England as a whole. Hull’s special school performed the best, and performance was better across primary schools compared to secondary schools.
- School absence rates in Hull are statistically significantly higher than England. Between the 2013/14 and 2020/21 school years, around 5% of all half-day school sessions were missed, but this has increased dramatically following the COVID-19 pandemic to 8.0% for Hull for 2021/22. The percentage has decreased slightly in the last two years to 7.6% for 2023/24, but is higher than England (7.1%).
- For the 2023/24 school year, around one in six primary school pupils (16.8%) and almost three in ten secondary school pupils (29.0%) in Hull were persistently absent from school in that they missed 10% or more of all half-day sessions. Prior to the pandemic around 10% of primary school pupils and around 15% of secondary school pupils were classified as persistently absent, and this doubled in 2022/23 (to 20.7% for primary school pupils and to 31.7% for secondary school pupils), although these percentages have decreased in the last two years.
- Outcomes in primary school (Key Stage 1 and 2) are slightly lower in Hull compared to England among all pupils, but are better among the subset of pupils eligible for free school meals. In general, outcomes have deteriorated since the beginning of the pandemic for Hull, the region and England.
- Outcomes at the end of secondary school (Key Stage 4) are lower in Hull compared to England and the region. Educational attainment is much lower among looked after children. The average Attainment 8 score for 2023/24 was 41.1 for children in Hull compared to 45.9 for England (19.1 for Hull and 18.3 for England for looked after children). The average Attainment 8 score is the sum of (up to eight) qualifying GCSE grades (1-9) with English and maths included twice so that the maximum possible score for a child is 90. A lower score denotes lower educational attainment, but scores for individual pupils can be lower if they do not have eight qualifying GCSEs (not all subjects are included).
- While slightly lower percentages of students in Sixth Form and at colleges (Key Stage 5) achieved three A* to A grades at A-level in 2024/25 in Hull (14.1%) compared with England (14.9%), the percentage was higher than for the region (13.5%); the percentages achieving AAB or higher at A-level were lower in Hull (21.5%) compared to the region (22.8%) and England (24.3%); the average point score achieved for each A-level was slightly higher in Hull (35.3) than the region (34.6) and England (35.0).
- In 2024, one in ten working age adults in Hull had no qualifications (10.0%) and the percentage of Hull’s population at each level of NVQ is consistently lower than the Yorkshire and Humber region and Great Britain as a whole.
- From the 2021 census, there were large differences between areas in the percentage of people aged 16+ years without qualifications or with qualifications at degree level or higher. Based on the 2021 Census, one-third or more residents in areas of North Carr, Orchard Park, St Andrew’s & Docklands, Newington & Gipsyville and Marfleet had no qualifications.
The Population Affected – Why Is It Important?
Good education improves career prospects, raises aspirations, and gives people more financial control over their lives. Poor education and training, and low educational attainment can affect confidence, aspirations, and increase the risk of lifelong unemployment, benefit dependency or low paid employment. These factors have a strong influence on health and wellbeing. Children (and adults) with low confidence and aspirations, and with low educational attainment are more likely to make poor choices in their lives, are less likely to achieve well-paid satisfying regular employment, have poor resilience, and increase the likelihood of poor health and wellbeing. Children living in more deprived areas are more likely to grow up thinking that poverty, poor housing, and unemployment are the norm, which could result in cyclic behaviours with these children behaving as their parents do as they reach adulthood. Early intervention in childhood can help reduce physical and mental health problems and prevent social dysfunction being passed from one generation to the next.
Following the Children and Families Act 2014, children and young people (under the age of 25 years) who have Special Educational Needs may have an Education, Health and Care (EHC) plan, developed by all professionals and the family working together, to address all needs that a child or young person has within education, health and care. Prior to the Act, children were on School Action, School Action Plus or have SEN statements (three classifications in order of severity of additional need requirements). Within the Act, SEN Support replaces School Action and School Action Plus (in schools) and Early Years Action and Early Years Action Plus (in early years).
Literacy is the combination of reading, writing, speaking and listening skills we all need to fulfil our potential. These life skills are essential to the happiness, health and wealth of individuals and society. It is quite an old research survey now, but in 2011, levels of literacy and numeracy were assessed (and also examined in relation to the Index of Multiple Deprivation 2010). In England, 15% of working-age adults struggled with literacy with their literacy below levels expected of an eleven year old, but this was 26% among people living in most deprived 25% of areas nationally (and only 5% among those living in least deprived 25% of areas). Concerns over staff literacy were widespread. Of employers who rated the competency of their low-skilled staff as poor or satisfactory, over half reported problems with literacy. Men and women with poor literacy were less likely to be in full-time employment at the age of thirty, and poor literacy skills can also be a serious barrier to progressing once in employment with 63% of men and 75% of women with very low literacy skills having never received a promotion. There are too many adults who lack basic literacy skills. Whilst 92% of the British public say literacy is vital to the economy, and essential for getting a good job, a quarter of children and young people do not recognise a link between reading and success. Fourteen percent of children and young people in lower income homes rarely or never read their books for pleasure. One in five parents easily find the opportunity to read to their children, with the rest struggling to read to their children due to fatigue and busy lifestyles. Marmot in his strategic review of health inequalities in England post-2010 stated that “Parental involvement in their child’s reading has been found to be the most important determinant of language and emergent literacy”.
In the 2011 study, a high percentage of the working-age population in England had poor numeracy. Overall, 49% had numeracy skills below the expected levels of an eleven year old, but this was 35% among those with an Index of Multiple Deprivation (IMD) of 0-9 (least deprived 25% of areas of England) but 62% and 72% among those with an IMD score 30-39 and 40+ (combined most deprived 25%).
Among working-age adults who lived in areas with an IMD score of 50+ (most deprived 7% of areas of England), 64%, 53% and 62% were at Level 2 or below in relation to word processing, email and spreadsheets respectively (28%, 20% and 28% among those with an IMD score of 1-9). Level 2 refers to being able to use Information and Communications Technology to communicate, as well as enter and edit small amounts of information in ways that are fit for purpose and audience.
The transition between education and employment can be difficult for many young people, but especially so for young people who lack good working role models, have poor literacy and/or numeracy skills, do not feel confident about themselves and lack resilience to cope with changing circumstances. It is even more difficult for vulnerable groups such as those with learning disabilities, looked after children, care leavers or other young people who do not have family support networks. Young people with poor educational attainment are more likely to be not in education, employment or training (NEET) and more likely to become teenage parents. The teenage years are generally the time when young people experiment with unhealthy lifestyle behaviours such as smoking, alcohol consumption and using drugs, and this behaviour is more likely to be tried or sustained among vulnerable young people and those finding the transition into adulthood difficult.
The Hull Picture
Educational Provision in the City
As at October 2024, there were 42,646 children and young people attending the city’s educational provision (excluding independent schools) split into the following types of provision:
- Nursery schools – 1
- Primary schools – 71
- Secondary schools – 13
- Special schools – 6
- Pupil referral units – 7
- Independent schools – 2
Special Educational Needs
From 2014, Education, Health and Care Plans (EHCPs) were introduced to replace the existing system of Statement of Educational Needs (SEN – often referred to as “Statements”). It was hoped that the new system would be all encompassing and would detail in a single document the needs of the child rather than having the need for multiple plans. Although SEN and EHCPs were/are reviewed annually, the switch over to the new system took a number of years, so for some time a dual system was in place with some children having a SEN and others an EHCP.
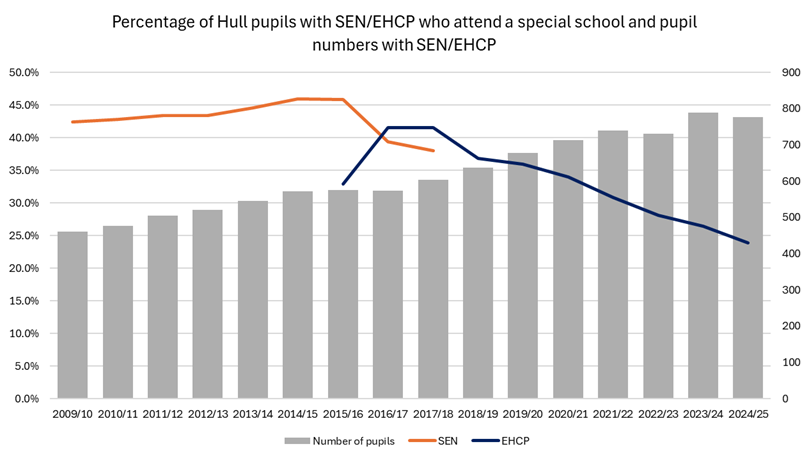
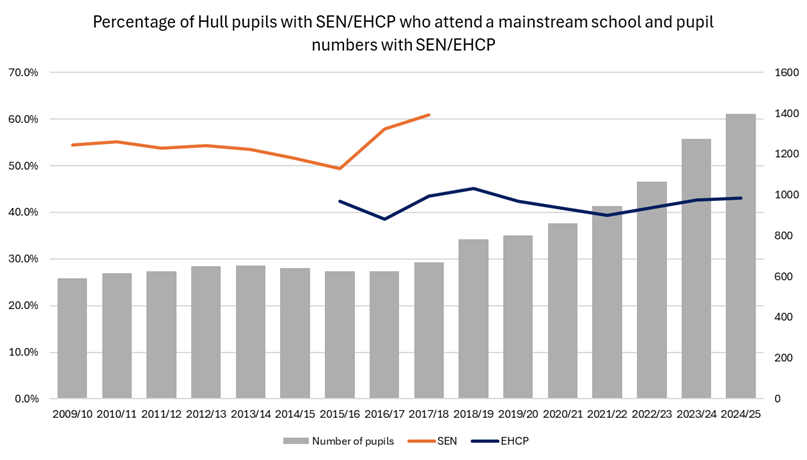
Just under a quarter (23.9% in 2024-25) of pupils with an EHCP in the city attend specialist provision (special schools) with more (43.1% in 2024-25) attending a mainstream school. The number of pupils attending a special school with a SEN/EHCP has been steadily increasing, although with some annual variation. In the 2024-25 academic year there were 776 pupils with an EHCP in Hull special schools. The number of pupils attending a Hull mainstream school with a SEN/EHCP was relatively stable up until the changeover and number began to increase from 2018 also. In the 2024-25 academic year there were 1,398 pupils in Hull attending a mainstream school with an EHCP.
The Office for Health Improvement & Disparities’ Fingertips presents information on the percentages of school children who have Education, Health and Care (EHC) Plans or are on SEN Support. For the 2024/25 school year, a statistically significantly higher percentage of children in Hull had special educational needs (21.1%) compared to England and the region (both 19.6%). The percentage in Hull is second highest in the region after Rotherham.
Compared with benchmark
| Indicator | Period | England | Yorkshire and the Humber region (statistical) | Kingston upon Hull | East Riding of Yorkshire | North East Lincolnshire | North Lincolnshire | York | North Yorkshire UA | Barnsley | Doncaster | Rotherham | Sheffield | Bradford | Calderdale | Kirklees | Leeds | Wakefield |
|---|---|---|---|---|---|---|---|---|---|---|---|---|---|---|---|---|---|---|
Pupils with special educational needs (SEN) (Persons School age) | 2024/25 | 19.6 | 19.6 | 21.1 | 18.2 | 19.5 | 19.9 | 16.1 | 18.5 | 18.6 | 18.2 | 23.5 | 20.4 | 19.4 | 19.7 | 19.2 | 19.8 | 20.2 |
The rates in Hull have steadily increased in Hull between 2015/16 and 2022/23 from 17.3% to 18.3% although the increases in the last two years have been greater increasing to 19.7% for 2023/24 and to 21.1% for 2024/25. Some of the increase could be due to increased awareness, testing and better recording.
Across the region and England, the percentages have also increased, and at a faster rate between 2015/16 and 2022/23 so the difference between Hull and England reduced. The increases in the last two years have been slightly greater in Hull though.
There were 9,305 pupils in Hull with EHC Plans or requiring SEN Support in the 2024/25 school year out of the estimated 44,100 pupils attending Hull schools.
Compared with benchmark
Pupils with special educational needs (SEN) (Persons School age)
|
Period
|
Kingston upon Hull |
Yorkshire and the Humber region (statistical)
|
England
|
||||
|---|---|---|---|---|---|---|---|
|
Count
|
Value
|
95%
Lower CI |
95%
Upper CI |
||||
| 2015/16 | • | 6883 | 17.3% | 16.9% | 17.7% | 13.9% | 14.4% |
| 2016/17 | • | 6831 | 16.7% | 16.3% | 17.0% | 14.0% | 14.4% |
| 2017/18 | • | 7110 | 17.0% | 16.6% | 17.4% | 14.5% | 14.6% |
| 2018/19 | • | 7475 | 17.5% | 17.2% | 17.9% | 15.0% | 14.9% |
| 2019/20 | • | 7824 | 18.1% | 17.8% | 18.5% | 15.4% | 15.5% |
| 2020/21 | • | 7955 | 18.4% | 18.0% | 18.8% | 15.7% | 15.8% |
| 2021/22 | • | 8028 | 18.3% | 17.9% | 18.7% | 16.4% | 16.5% |
| 2022/23 | • | 8110 | 18.3% | 17.9% | 18.7% | 17.3% | 17.3% |
| 2023/24 | • | 8774 | 19.7% | 19.3% | 20.1% | 18.3% | 18.4% |
| 2024/25 | • | 9305 | 21.1% | 20.7% | 21.4% | 19.6% | 19.6% |
Source: Department for Education
From the national school league tables for the 2023-2024 academic year, the prevalence of EHC Plans and SEN support within Hull’s schools differ widely as follows:
- All 807 pupils from Hull’s six special schools have EHC Plans.
- Across Hull’s 71 state-funded primary schools, the percentage of pupils with EHC Plans ranges from 0.3% to 11.2%, and the percentage of pupils with SEN Support ranges from 6.6% to 27.5%.
- Across Hull’s 13 state-funded secondary schools, the percentage of pupils with EHC Plans ranges from 0.7% to 4.0%, and the percentage of pupils with SEN Support ranges from 2.3% to 18.4%.
The following mainstream primary schools have more than 5% of their pupils on EHC Plans:
- Appleton Primary School (5.6%)
- Victoria Dock Primary School (5.9%)
- Spring Cottage Primary School (6.7%)
- Ings Primary School (7.4%)
- Rokeby Park Primary School (7.8%)
- Dorchester Primary School (8.5%)
- Christopher Pickering Primary School (9.0%)
- Wansbeck Primary School (11.2%)
The following mainstream primary schools have more than 20% of their pupils with SEN Support:
- Chiltern Primary School (20.1%)
- The Green Way Academy (20.4%)
- Stockwell Academy (20.5%)
- Westcott Primary School (21.1%)
- Griffin Primary School (21.3%)
- Wheeler Primary School (21.3%)
- Bude Park Primary School (21.6%)
- Adelaide Primary School (22.7%)
- Wold Academy (23.1%)
- The Parks Primary Academy (23.4%)
- Stepney Primary School (24.2%)
- Woodland Primary School (24.4%)
- Rokeby Park Primary School (27.5%)
The following mainstream secondary schools have 3% or more of their pupils on EHC Plans:
- Winifred Holtby Academy (3.0%)
- The Marvell College (3.9%)
- Kelvin Hall School (4.0%)
The following mainstream secondary schools have more than 15% of their pupils with SEN Support:
- Archbishop Sentamu Academy (15.6%)
- Malet Lambert (15.7%)
- Newland School for Girls (16.2%)
- Sirius Academy North (17.0%)
- The Boulevard Academy (17.2%)
- Sirius Academy West (18.2%)
- Winifred Holtby Academy (18.4%)
There is increasing evidence to suggest that the demand for assessment towards EHC Plans is increasing both locally and nationally. The increase is less evident for Hull. However, there is bound to be an increase from 2014 when they were first introduced. For Hull, the absolute numbers are lower for 2021 and 2022, which might be due to the COVID-19 pandemic, but numbers did not change much across the region or England during these two years. Hull has been inconsistent in producing plans within the statutory time frame of 20 weeks.
| Year | Hull (N) | Hull (%) | Y&H (N) | Y&H (%) | England (N) | England (%) |
| 2014 | 0 | – | 50 | 62.5 | 836 | 61.5 |
| 2015 | 4 | 17.4 | 1,181 | 61.9 | 13,451 | 54.6 |
| 2016 | 110 | 48.9 | 1,875 | 57.1 | 20,045 | 55.7 |
| 2017 | 172 | 90.1 | 2,413 | 60.1 | 25,302 | 61.3 |
| 2018 | 55 | 20.5 | 2,725 | 59.8 | 28,178 | 58.0 |
| 2019 | 274 | 89.0 | 3,282 | 71.1 | 31,313 | 58.7 |
| 2020 | 256 | 87.4 | 3,622 | 68.9 | 32,863 | 55.6 |
| 2021 | 74 | 23.2 | 3,502 | 64.9 | 35,470 | 57.9 |
| 2022 | 96 | 27.1 | 3,640 | 61.2 | 31,226 | 47.7 |
| 2023 | 138 | 30.4 | 4,444 | 55.5 | 39,784 | 49.1 |
More information is available on Children with Special Educational Needs or Disabilities under Health Factors under Children and Young People.
Free School Meals
Children in state-funded schools in England are entitled to received free school meals if a parent or carer were in receipt of any of the following benefits:
- Income Support
- Income-based Jobseekers Allowance
- Income-related Employment and Support Allowance
- Support under Part VI of the Immigration and Asylum Act 1999
- the guarantee element of the State Pension Credit
- Child Tax Credit (provided they were not also entitled to Working Tax Credit and had an annual gross income of no more than £16,190, as assessed by Her Majesty’s Revenue and Customs)
- Working Tax Credit run-on – paid for four weeks after having stopped being qualified for Working Tax Credit
- Universal Credit – if applied on or after 1 April 2018 and the household income is less than £7,400 a year (after tax and not including any benefits)
Pupils in families with no recourse to public funds can also be eligible for free school meals. Since 1 April 2018, transitional protections have been in place which will continue during the roll out of Universal Credit. This has meant that pupils eligible for free school meals on or after 1 April 2018 retain their free school meal eligibility even if their circumstances change. Prior to the pandemic, this had been the main driver in the increase in the proportion of pupils eligible for free school meals as pupils continue to become eligible but fewer pupils stop being eligible. Any pupil gaining eligibility for free school meals after 1 April 2018 will be protected against losing free school meals until March 2025. After March 2025, any existing claimants that no longer meet the eligibility criteria will continue to receive free school meals until the end of their current phase of education (i.e. primary or secondary).
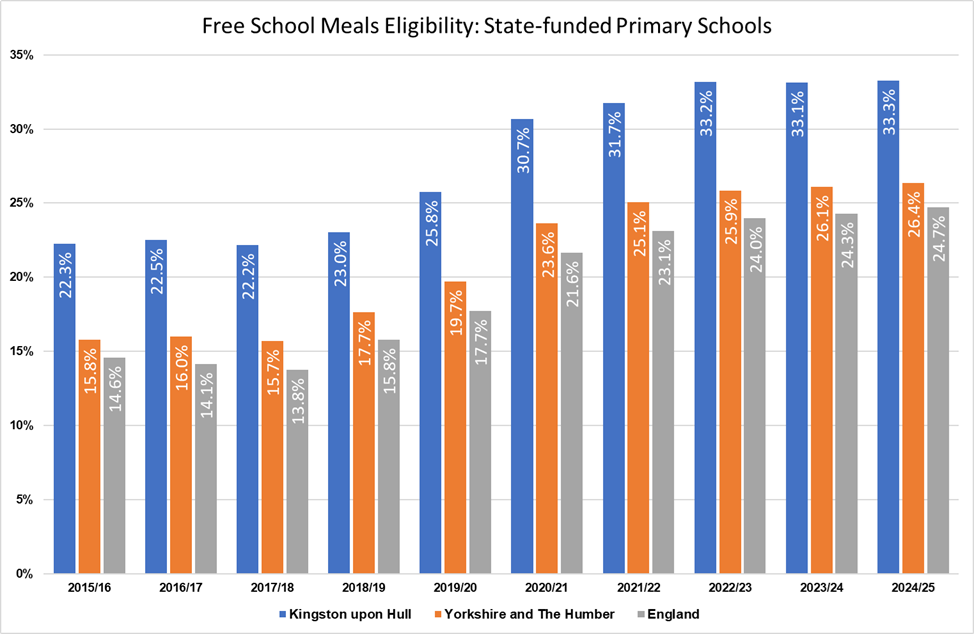
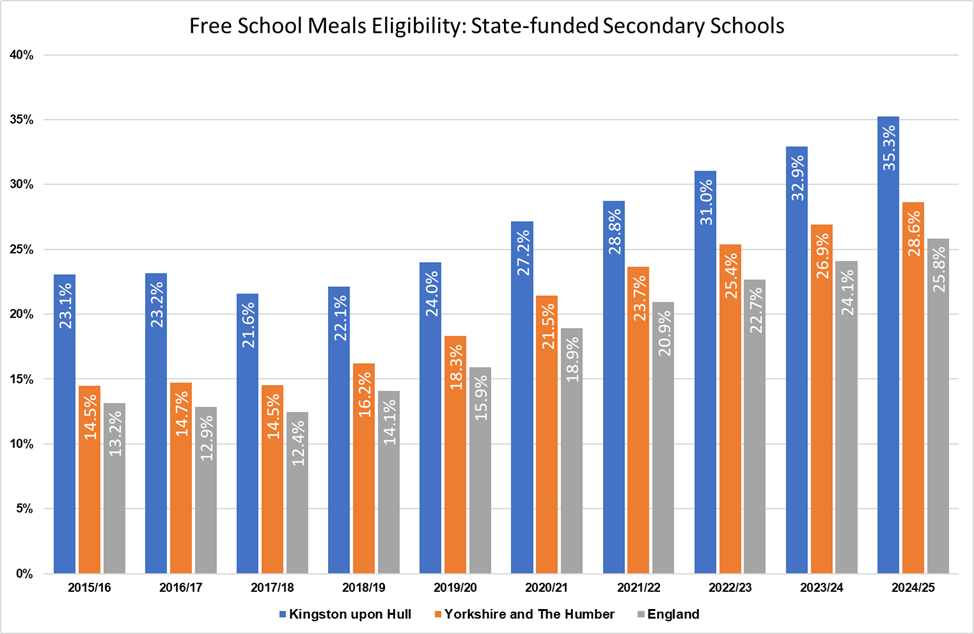
The charts below show the levels of free school meal eligibility in primary, secondary and special schools since 2015. The latest data is for the academic year of 2024/25. The overall trend in the percentage of free school meal eligibility is increasing and Hull is consistently above the levels seen in the Yorkshire and Humber region as a whole, as well as England. In the latest data 33.3% of children in Hull state-funded primary schools are eligible for free school meals, compared with 26.4% in the region and 24.7% in England. For secondary schools the latest Hull figure was 35.3%, in Yorkshire and the Humber it was 28.6% and for England it was 25.8%.
The picture in special schools is even more stark. In the latest data 55.2% of children in Hull state-funded special schools are eligible for free school meals, compared with 50.6% in the region and 49.2% in England.
Levels of free school meal eligibility is consistently higher in Hull than it is either in the region or England as a whole.
However, children in Key Stage 1 (reception, Year 1 and Year 2) automatically receive free school meals, so not all parents who are eligible apply for free school meals for their child(ren). However, applying for school meals is encouraged by the school as they obtain additional funding for each pupil eligible for free school meals. Therefore, the figures below may not include all children who are eligible for free school meals, and are the numbers who have applied for free school meals.
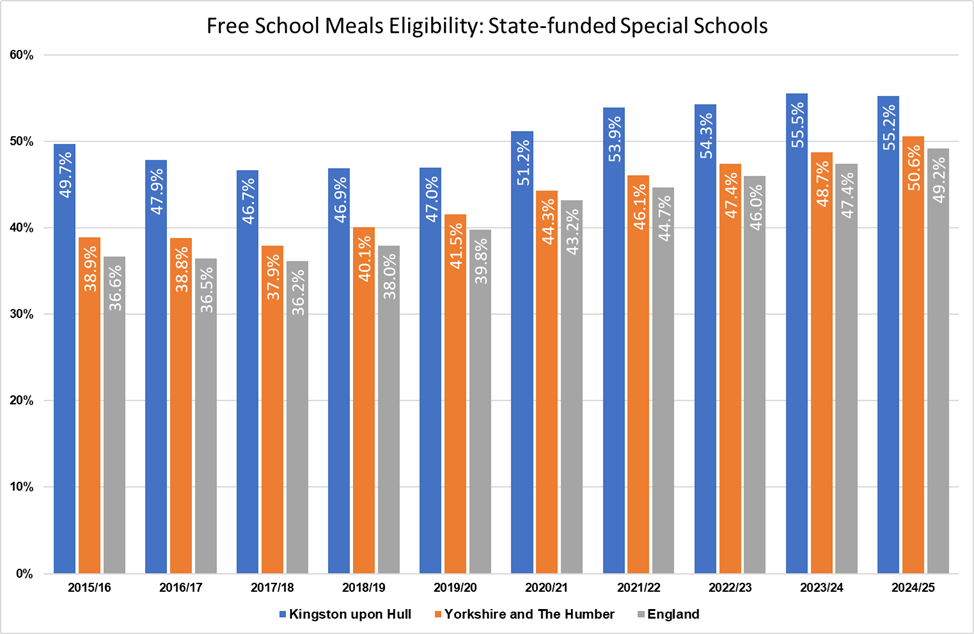
Just over one-third of school children in Hull were eligible for free school meals in 2024/25 compared to just over one-quarter for England. The percentage in Hull is the highest in the region.
Compared with benchmark
| Indicator | Period | England | Yorkshire and the Humber region (statistical) | Kingston upon Hull | East Riding of Yorkshire | North East Lincolnshire | North Lincolnshire | York | North Yorkshire UA | Barnsley | Doncaster | Rotherham | Sheffield | Bradford | Calderdale | Kirklees | Leeds | Wakefield |
|---|---|---|---|---|---|---|---|---|---|---|---|---|---|---|---|---|---|---|
Children eligible for free school meals (Persons School age) | 2024/25 | 25.7 | 27.8 | 34.7 | 20.7 | 33.8 | 30.8 | 17.6 | 18.6 | 29.4 | 29.6 | 29.1 | 34.1 | 30.4 | 27.1 | 27.5 | 27.1 | 26.3 |
Between 2015/16 and 2018/19, the numbers of pupils eligible for free school meals had increased slightly but the prevalence had only increased by 0.9%. However, the percentage increased during the 2019/20 school year by 16% and has continued to increase for each year since, but by smaller margins. The first lockdown for the COVID-19 pandemic commenced at the end of March 2020 during the 2019/20 school year, and the impact of the pandemic and subsequent cost of living crisis has had an impact on the numbers eligible for free school meals in Hull.
43,301 pupils attended Hull schools in 2024/25, and 14,928 of them were eligible for free school meals.
Free school meal eligibility has also increased across England and the region at a relatively similar rate to Hull.
Compared with benchmark
Children eligible for free school meals (Persons School age)
|
Period
|
Kingston upon Hull |
Yorkshire and the Humber region (statistical)
|
England
|
||||
|---|---|---|---|---|---|---|---|
|
Count
|
Value
|
95%
Lower CI |
95%
Upper CI |
||||
| 2014/15 | • | 9273 | 24.8% | 24.4% | 25.2% | 16.2% | 15.2% |
| 2015/16 | • | 8932 | 23.1% | 22.7% | 23.5% | 15.5% | 14.3% |
| 2016/17 | • | 9244 | 23.2% | 22.8% | 23.6% | 15.8% | 14.0% |
| 2017/18 | • | 9148 | 22.5% | 22.1% | 22.9% | 15.5% | 13.6% |
| 2018/19 | • | 9682 | 23.3% | 22.9% | 23.7% | 17.4% | 15.4% |
| 2019/20 | • | 10804 | 25.6% | 25.2% | 26.1% | 19.4% | 17.3% |
| 2020/21 | • | 12583 | 29.8% | 29.4% | 30.3% | 23.0% | 20.8% |
| 2021/22 | • | 13332 | 31.2% | 30.7% | 31.6% | 24.8% | 22.5% |
| 2022/23 | • | 14182 | 32.9% | 32.4% | 33.3% | 26.0% | 23.8% |
| 2023/24 | • | 14594 | 33.7% | 33.2% | 34.1% | 26.8% | 24.6% |
| 2024/25 | • | 14928 | 34.7% | 34.2% | 35.1% | 27.8% | 25.7% |
Source: Department for Education
The national school league tables give the percentages of pupils eligible for free school meals at any time during the last six years for the 2023/24 school year. Overall, 35.9% of primary school pupils, 36.4% of secondary school pupils and 55.9% of special school pupils were or had been eligible for free school meals at any time in the last six years compared to 25.9%, 27.3% and 50.5% of pupils respectively for England.
Across Hull’s schools for 2023/24, there are large differences in the percentages eligible for free school meals at any point in the last six years.
Among state funded primary schools, the percentages ranged from 4.5% to 66.0% with the following schools having more than 50% of their pupils eligible for free school meals:
- Adelaide Primary School (50.4%)
- Longhill Primary School (51.8%)
- Oldfleet Primary School (52.4%)
- Mountbatten Primary School (52.9%)
- Southcoates Primary School (54.3%)
- Bude Park Primary School (57.6%)
- Cleeve Primary School (58.2%)
- Thorpepark Academy (60.3%)
- The Green Way Academy (60.9%)
- The Parks Primary School (63.0%)
- Woodland Primary School (66.0%)
Among state funded secondary schools, the percentages ranged from 14.4% to 53.4% with the following schools having the majority of their pupils eligible for free school meals:
- Archbishop Sentamu Academy (53.4%)
- The Boulevard Academy (51.4%)
Among state funded special schools, the percentages ranged from 42.2% to 68.3% with the following schools having the majority of their pupils eligible for free school meals:
- Tweendykes School (54.8%)
- Ganton School (58.9%)
- Bridgeview Special School (63.1%)
- Oakfield (68.3%)
Pupils from Minority Ethnic Backgrounds
The percentage of pupils from ethnic minority backgrounds attending Hull schools has doubled in the last decade from 9.1% in 2010 (14.9% in 2014 and 17.3% in 2016) to 21.5% in 2020.
In the January 2025 school census, 28.1% were from ethnic minority backgrounds.
The impact of Eastern European migration has impacted massively on the city’s school population in recent years.
Further information can be found within Race and Ethnicity under Population.
Pupils with English as an Additional Language
Over the last 10 years or so the prevalence of pupils in the city’s schools that speak English as an additional language has increased significantly.
Among state-funded mainstream schools in Hull for 2024/25, 20.6% of primary school, 17.0% of secondary school and 10.2% of special school pupils first language was not English. This equates to 5,084 primary, 2,888 secondary and 83 special school pupils whose first language is not English. It is estimated that these pupils speak a range of 120 languages other than English.
Figures vary widely across Hull’s schools ranging from 2.8% to 76.6% across Hull’s primary and secondary schools. Further information is presented under Race and Ethnicity within Population.
| School type | Hull (N) | Hull (%) | England (%) |
| Primary schools | 5,084 | 20.6 | 23.4 |
| Secondary schools | 2,888 | 17.0 | 19.2 |
| Special schools | 83 | 10.2 | 14.4 |
| All maintained schools | 8,108 |
Further information can be found within Race and Ethnicity under Population.
School Absence
The Office for Health Improvement & Disparities’ Fingertips provides information on overall absence from school.
Pupil absence is measured as the percentage of half-day sessions missed by pupils which includes both authorised (due to illness and health issues) and unauthorised absence.
Children who have missed 10% or more of all half-day sessions are deemed to be persistently absent from school.
During 2023/24, pupil absence was statistically significantly higher in Hull compared to England (7.6% versus 7.1% of half-day sessions missed).
During 2023/24, the percentage of persistent absentees for primary and secondary school pupils were both statistically significantly higher in Hull compared to England. Around one in six (16.8%) of primary school pupils and around three in ten (29.0%) of secondary school pupils in Hull missed more than 10% of half-day sessions during the 2023/24 school year.
Compared with benchmark
| Indicator | Period | England | Yorkshire and the Humber region (statistical) | Kingston upon Hull | East Riding of Yorkshire | North East Lincolnshire | North Lincolnshire | York | North Yorkshire UA | Barnsley | Doncaster | Rotherham | Sheffield | Bradford | Calderdale | Kirklees | Leeds | Wakefield |
|---|---|---|---|---|---|---|---|---|---|---|---|---|---|---|---|---|---|---|
Pupil absence (Persons 5-15 yrs) | 2023/24 | 7.1 | 7.6 | 7.6 | 6.9 | 7.7 | 7.2 | 7.4 | 7.3 | 7.8 | 7.3 | 7.7 | 8.0 | 8.6 | 7.1 | 7.1 | 7.4 | 7.7 |
Persistent absentees - Primary school (Persons Primary school age) | 2024/25 | 13.0 | 13.5 | 14.6 | 10.7 | 12.7 | 12.0 | 11.7 | 10.5 | 12.1 | 13.2 | 14.4 | 15.4 | 16.2 | 11.3 | 13.6 | 14.3 | 13.7 |
Persistent absentees - Secondary school (Persons Secondary school age) | 2024/25 | 23.4 | 25.3 | 25.7 | 23.8 | 28.6 | 24.0 | 23.9 | 24.2 | 25.8 | 24.2 | 25.4 | 27.1 | 31.0 | 22.4 | 21.8 | 23.8 | 26.2 |
Following the lockdowns for the COVID-19 pandemic and the temporary closure of schools, there has been an increasing trend in school absence which has been observed in Hull, but this follows the same pattern observed for England and for the region.
There has been a slight reduction in Hull in pupil absence since the high in 2021/22.
A total of 1,016,310 half-day sessions were missed by all pupils in Hull during the 2023/24 school year.
Compared with benchmark
Recent trends
Pupil absence (Persons 5-15 yrs)
|
Period
|
Kingston upon Hull |
Yorkshire and the Humber region (statistical)
|
England
|
||||
|---|---|---|---|---|---|---|---|
|
Count
|
Value
|
95%
Lower CI |
95%
Upper CI |
||||
| 2010/11 | • | 539859 | 6.6% | 6.3% | 6.9% | 6.1% | 5.8% |
| 2011/12 | • | 478175 | 5.6% | 5.3% | 5.9% | 5.2% | 5.1% |
| 2012/13 | • | 594514 | 5.7% | 5.5% | 6.0% | 5.4% | 5.3% |
| 2013/14 | • | 520312 | 4.9% | 4.7% | 5.2% | 4.6% | 4.5% |
| 2014/15 | • | 554960 | 4.9% | 4.7% | 5.2% | 4.8% | 4.6% |
| 2015/16 | • | 541570 | 4.8% | 4.5% | 5.0% | 4.7% | 4.6% |
| 2016/17 | • | 609878 | 5.1% | 4.9% | 5.4% | 4.9% | 4.7% |
| 2017/18 | • | 611736 | 5.0% | 4.7% | 5.2% | 5.0% | 4.8% |
| 2018/19 | • | 615107 | 4.9% | 4.7% | 5.1% | 5.0% | 4.7% |
| 2020/21 | • | 663343 | 5.1% | 4.9% | 5.4% | 5.0% | 4.6% |
| 2021/22 | • | 1038152 | 8.0% | 7.7% | 8.3% | 7.9% | 7.6% |
| 2022/23 | • | 997174 | 7.8% | 7.6% | 8.1% | 7.7% | 7.4% |
| 2023/24 | • | 1016310 | 7.6% | 7.3% | 7.9% | 7.6% | 7.1% |
Source: OHID, based on Department for Education data
Among primary schools, the trends in the percentage of pupils who are persistently absent has been around 10% for primary school pupils in Hull between 2014/15 and 2020/21, but increased significantly (doubling) to 20.7% for 2021/22 with, although decreasing in both 2022/23 and 2023/24 to 16.8%.
There were 21,057 primary school pupils in Hull of which 3,539 (17.6%) missed 10% or more of all half-day sessions during the 2023/24 school year.
Compared with benchmark
Recent trends
Persistent absentees - Primary school (Persons Primary school age)
|
Period
|
Kingston upon Hull |
Yorkshire and the Humber region (statistical)
|
England
|
||||
|---|---|---|---|---|---|---|---|
|
Count
|
Value
|
95%
Lower CI |
95%
Upper CI |
||||
| 2014/15 | • | 2125 | 11.1% | 10.6% | 11.5% | 9.3% | 8.4% |
| 2015/16 | • | 1914 | 9.8% | 9.4% | 10.2% | 8.9% | 8.2% |
| 2016/17 | • | 2101 | 10.4% | 10.0% | 10.8% | 9.2% | 8.3% |
| 2017/18 | • | 2258 | 10.9% | 10.4% | 11.3% | 9.5% | 8.7% |
| 2018/19 | • | 2067 | 9.8% | 9.5% | 10.3% | 9.1% | 8.2% |
| 2020/21 | • | 2319 | 11.1% | 10.7% | 11.6% | 9.7% | 8.8% |
| 2021/22 | • | 4339 | 20.7% | 20.2% | 21.2% | 18.8% | 17.7% |
| 2022/23 | • | 3962 | 18.7% | 18.2% | 19.3% | 16.9% | 16.2% |
| 2023/24 | • | 3539 | 16.8% | 16.3% | 17.3% | 15.7% | 14.6% |
| 2024/25 | • | 3003 | 14.6% | 14.1% | 15.1% | 13.5% | 13.0% |
Source: Department for Education
The percentage of persistent absentees at secondary school is much higher than for primary school pupils.
Between 2014/15 and 2018/19 between 15.1% and 17.4% of secondary school pupils in Hull missed 10% or more of all half-day sessions during the school year, but this increased to 19.3% for 2020/21 and increased sharply to 31.7% for 2021/22, although there have been two consecutive small decreases since, to 29.0% for 2023/24.
Whilst the percentage in Hull has been statistically significantly higher than England throughout the entire period 2014/15 to 2023/24, the difference has remained relatively constant with the rate in Hull being around three percentage points higher than England.
There were 16,509 secondary school pupils in Hull of which 4,786 (30.1%) missed 10% or more of all half-day sessions during the 2023/24 school year.
Compared with benchmark
Recent trends
Persistent absentees - Secondary school (Persons Secondary school age)
|
Period
|
Kingston upon Hull |
Yorkshire and the Humber region (statistical)
|
England
|
||||
|---|---|---|---|---|---|---|---|
|
Count
|
Value
|
95%
Lower CI |
95%
Upper CI |
||||
| 2014/15 | • | 1969 | 16.5% | 15.8% | 17.2% | 14.9% | 13.8% |
| 2015/16 | • | 1813 | 14.7% | 14.1% | 15.3% | 14.2% | 13.1% |
| 2016/17 | • | 2233 | 17.4% | 16.7% | 18.0% | 15.1% | 13.5% |
| 2017/18 | • | 2008 | 15.1% | 14.5% | 15.7% | 15.6% | 13.9% |
| 2018/19 | • | 2094 | 15.3% | 14.7% | 15.9% | 15.3% | 13.7% |
| 2020/21 | • | 2863 | 19.3% | 18.7% | 19.9% | 17.3% | 14.8% |
| 2021/22 | • | 4854 | 31.7% | 31.0% | 32.5% | 29.7% | 27.7% |
| 2022/23 | • | 4801 | 30.4% | 29.7% | 31.2% | 28.6% | 26.5% |
| 2023/24 | • | 4786 | 29.0% | 28.3% | 29.7% | 28.0% | 25.6% |
| 2024/25 | • | 4292 | 25.7% | 25.1% | 26.4% | 25.3% | 23.4% |
Source: Department for Education
Quality of Educational Provision
As at 31 December 2023 Ofsted published the percentage of all the city’s establishments judged good or better at the last Ofsted inspection ranged from 84.6% to 100% with an average of 93.8% across the City.
| Hull | Yorkshire & Humber | England | |
| All Schools | 93.8% | 87.9% | 89.7% |
| Nursery Schools | 100% | 100% | 97.9% |
| Primary Schools | 94.4% | 89.0% | 91.0% |
| Secondary Schools | 84.6% | 81.1% | 82.9% |
| Special Schools | 100% | 84.1% | 89.8% |
| Alternative Provision Schools | 100% | 91.2% | 86.2% |
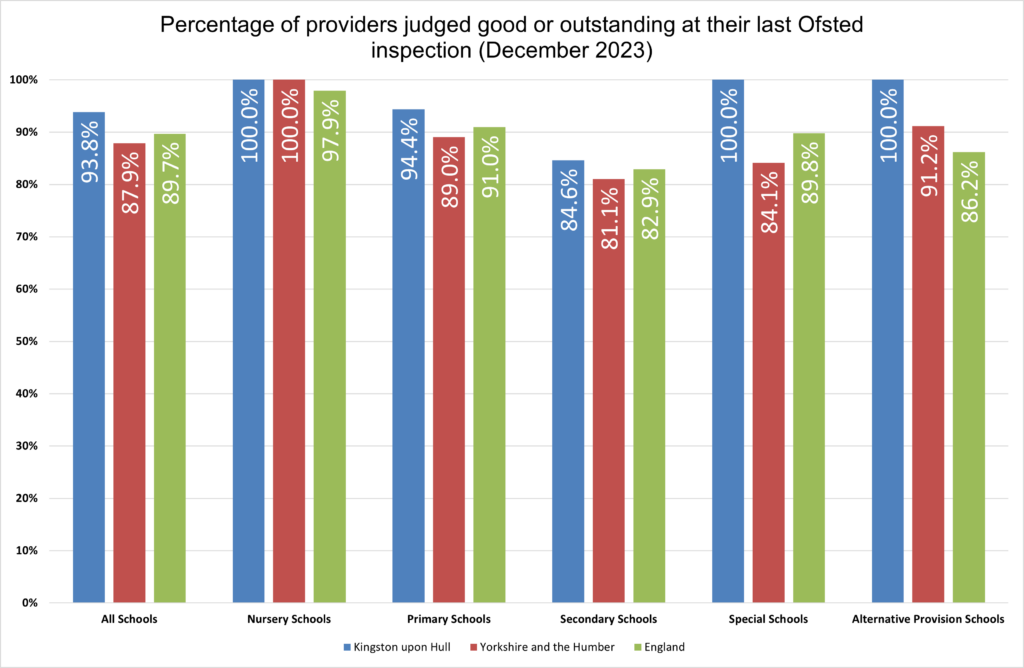
Overall Hull had a higher percentage of schools with either an outstanding or good rating (93.8%) than compared with the region (87.9%) or England as a whole (89.7%). However this performance is not across the whole spectrum of education. For instance, whilst 94.4% of primary schools in Hull received either an outstanding or good rating (compared with 89.0% in the region and 91.0% in England), only 84.6% of secondary schools in Hull received the same rating (compared with 81.1% in the region and 82.9% in England).
For the 2023/24 at the last Ofsted inspection from national school league table information, 18 schools in Hull were rated as outstanding, 66 as good and six rated as requires improvement.
| Ofsted rating | Primary | Secondary | Special | Total |
| Outstanding | 12 | 2 | 4 | 18 |
| Good | 55 | 9 | 2 | 66 |
| Requires improvement | 4 | 2 | 0 | 6 |
| Total | 71 | 13 | 6 | 90 |
This meant that one-fifth of Hull schools were rated as outstanding, 73% as good and 6.7% rated as requires improvement. Ratings were highest among Hull’s special schools, and higher among Hull’s primary schools compared to secondary schools.
| Ofsted rating | Primary (Hull) | Secondary (Hull) | Special (Hull) | Total (Hull) |
| Outstanding | 16.9 | 15.4 | 66.7 | 20.0 |
| Good | 77.5 | 69.2 | 33.3 | 73.3 |
| Requires improvement | 5.6 | 15.4 | 0.0 | 6.7 |
| Total | 100 | 100 | 100 | 100 |
A higher percentage of Hull’s schools were rated as ‘outstanding’ and a lower percentage were rated as ‘requires improvement’ in 2023/24 compared to all of state maintained England.
| Ofsted rating | Primary (England) | Secondary (England) | Special (England) | Total (England) |
| Outstanding | 10.4 | 15.3 | 25.7 | 12.3 |
| Good | 82.1 | 71.4 | 65.7 | 79.3 |
| Requires improvement | 7.5 | 13.3 | 8.6 | 8.4 |
| Total | 100 | 100 | 100 | 100 |
Outcomes and Educational Achievements
Primary school outcomes data is not available for 2019/20 and 2020/21 as assessments were not undertaken in schools due to national lockdowns for the COVID-19 pandemic. Schools were closed to the majority of pupils between the end of March 2020 to the end of the school year in July 2020, and during the majority of the Spring term between Christmas and Easter in 2021 (opening a couple of weeks prior to the Easter school holiday).
There were no examinations in 2019/20 and 2020/21 due to the pandemic. Qualifications and educational attainment were determined on the basis of coursework and other factors. The results were generally higher for these two years, and this means that the results in 2019/20 and 2020/21 are not comparable with earlier or subsequent years.
Not only did the pandemic affect school-aged children in terms of their education, but the lockdowns and limited to social mixing impacted on social development outside school for primary and secondary school pupils, but this also affected younger pre-school children considerably who reply on social interactions to a greater extent for their development.
Among school children, there were significant disparities in home schooling. Children living in more deprived households were less likely to have resources (books, tablets and laptops, wifi, etc) to be able to be home schooled. Home learning was also likely to be dependent on supervision and the working situation of their parents or carers. It would also have been more difficult to undertake school learning with multiple children in different school years all doing different school work especially if work was online and there were not enough devices for all children in the household. Schools were open to some children who were eligible for free school meals and children of ‘key worker’ parents during some of the lockdowns, but not all of these children would have attended.
Outcomes in Primary School
Outcomes in Early Years Foundation Stage (Reception Year)
For the 2024/25 school year, the percentage of children who had achieved a good level of development at the end of their reception year was statistically significantly lower in Hull compared to England for all pupils (65.3% versus 68.3%), but statistically significantly higher for the subset of children eligible for free school meals (56.1% versus 51.3%). However, the percentage of all reception children that achieved at least the expected level of development in communication, language and literacy skills was also statistically significantly lower in Hull than England (66.0% versus 69.7%).
Further information, including the trends over time, are given for ‘school readiness’ and under Early Years and Good Child Development within Pregnancy, Infants and Early Years within Children and Young People.
Compared with benchmark
| Indicator | Period | England | Yorkshire and the Humber region (statistical) | Kingston upon Hull | East Riding of Yorkshire | North East Lincolnshire | North Lincolnshire | York | North Yorkshire UA | Barnsley | Doncaster | Rotherham | Sheffield | Bradford | Calderdale | Kirklees | Leeds | Wakefield |
|---|---|---|---|---|---|---|---|---|---|---|---|---|---|---|---|---|---|---|
School readiness: percentage of children achieving a good level of development at the end of Reception (Persons 5 yrs) | 2024/25 | 68.3 | 66.2 | 65.3 | 68.5 | 66.7 | 66.7 | 71.4 | 70.6 | 67.9 | 67.5 | 64.9 | 65.5 | 61.9 | 65.3 | 66.4 | 63.9 | 69.6 |
School readiness: percentage of children with free school meal status achieving a good level of development at the end of Reception (Persons 5 yrs) | 2024/25 | 51.3 | 49.2 | 56.1 | 45.8 | 54.6 | 49.7 | 46.7 | 45.5 | 56.0 | 53.5 | 44.2 | 46.5 | 50.4 | 44.5 | 50.5 | 45.8 | 53.2 |
School readiness: percentage of children achieving at least the expected level of development in communication and language and literacy skills at the end of Reception (Persons 5 yrs) | 2024/25 | 69.7 | 67.5 | 66.0 | 70.6 | 67.2 | 67.7 | 72.3 | 72.2 | 68.8 | 68.2 | 66.2 | 66.6 | 62.8 | 66.5 | 68.0 | 65.5 | 70.6 |
Outcomes in Year 1
The percentage of Year 1 children achieving the expected level in their phonics screening was very similar in Hull as England for 2024/25 (79.5% versus 79.8%), but statistically significantly higher among the subgroup of children who were eligible for free school meals (71.6% versus 66.6%).
Further information, including the trends over time, are given in relation to outcomes in Year 1 under Early Years and Good Child Development within Pregnancy, Infants and Early Years within Children and Young People.
Compared with benchmark
| Indicator | Period | England | Yorkshire and the Humber region (statistical) | Kingston upon Hull | East Riding of Yorkshire | North East Lincolnshire | North Lincolnshire | York | North Yorkshire UA | Barnsley | Doncaster | Rotherham | Sheffield | Bradford | Calderdale | Kirklees | Leeds | Wakefield |
|---|---|---|---|---|---|---|---|---|---|---|---|---|---|---|---|---|---|---|
School readiness: percentage of children achieving the expected level in the phonics screening check in Year 1 (Persons 6 yrs) | 2024/25 | 79.8 | 79.9 | 79.5 | 80.1 | 80.5 | 76.7 | 80.6 | 82.0 | 84.7 | 79.8 | 77.0 | 76.3 | 77.7 | 81.0 | 80.5 | 80.4 | 84.2 |
School readiness: percentage of children with free school meal status achieving the expected level in the phonics screening check in Year 1 (Persons 6 yrs) | 2024/25 | 66.6 | 67.9 | 71.6 | 65.1 | 69.7 | 64.3 | 64.5 | 64.3 | 78.6 | 68.8 | 62.2 | 64.4 | 69.9 | 67.6 | 70.9 | 65.7 | 73.5 |
Outcomes in Key Stage 2
Key Stage 2 continues to be a strength for the city with rates generally higher or comparable to England and the region. However, the percentages meeting the expected standards in reading, writing and mathematics decreased considerably following the COVID-19 pandemic, falling by 11 percentage points from 68% in 2019/20 to 57% in 2021/22, although the sharp fall was not unique to Hull with both England and the region showing decreases. However, the decrease in Hull was slightly greater falling by 16% compared to 13% for the region and 11% for England. Levels have increased in 2024/25.
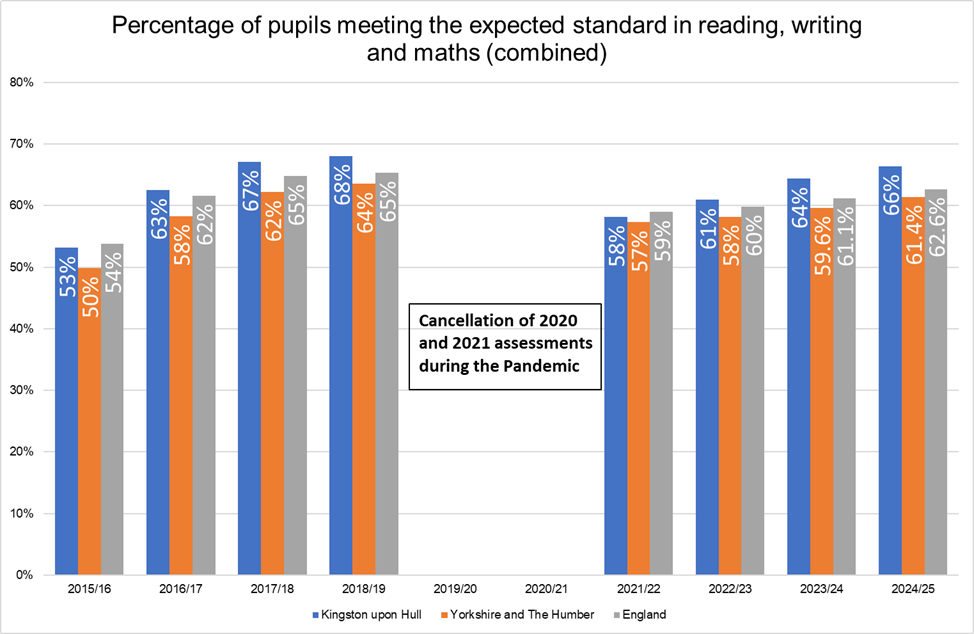
The percentage of Hull pupils meeting the expected standard in each of the three areas decreased during the pandemic, although the largest decrease occurred for mathematics.
| Hull: Key stage 2 attainment | 2015/16 | 2016/17 | 2017/18 | 2018/19 | 2019/20 | 2020/21 | 2021/22 | 2022/23 | 2023/24 | 2024/25 |
| Percentage of pupils meeting the expected standard in reading, writing and maths (combined) | 53% | 63% | 67% | 68% | x | x | 58% | 61% | 64% | 66% |
| Percentage of pupils meeting the expected standard in reading | 64% | 71% | 76% | 77% | x | x | 73% | 72% | 75% | 75% |
| Percentage of pupils meeting the expected standard in writing | 79% | 77% | 78% | 79% | x | x | 72% | 74% | 73% | 75% |
| Percentage of pupils meeting the expected standard in maths | 69% | 76% | 78% | 80% | x | x | 68% | 73% | 75% | 76% |
Outcomes in Secondary School (Key Stage 4)
Attainment 8 is a summary measure of how well pupils have achieved in their GCSE results. It measures achievements of a pupil across eight qualifications including mathematics and English with the latter two subjects double-weighted. Essentially this means that the highest score a pupil can achieve is 90 as the highest score in a single qualification is 9 thus there are 72 points for 8 qualifications but a further 18 points to add for mathematics and English as they are included twice. Only qualifying subjects count so if a pupil achieves eight GCSEs but only six of them are in qualifying subjects then they will score lower as two subjects will not be scored or counted. So comparisons depend on the range of subjects taken by pupils, and some independent schools may have other qualifications which don’t count towards the Attainment 8 score.
The old grades of A* and A are equivalent to numerical grades 9-7, grades B and C are equivalent to numerical grades 6-4 with 5 representing a ‘strong pass’ and 4 representing a ‘standard pass’, grades D to G are equivalent to numerical grades 3-1. Whilst there is no direct equivalence, the bottom of grade 7 is aligned with the bottom of grade A, the bottom of grade 4 is aligned with the bottom of grade C and the bottom of grade 1 is aligned with the bottom of grade G. Whilst grades 4-5 technically count as a pass, many sixth forms insist on a minimum of of 5s or 6s as a condition of entry for further study. The government school league tables are based on the percentage of pupils who achieve a 5 or above in English and maths GCSEs, and if you get a grade 3 or below in English or maths, you will have to resit next year.
The average Attainment 8 score for Hull is given below in relation to local authorities across the Yorkshire and Humber region.
During 2023/24, the average Attainment 8 score was lower in Hull at 41.1 compared to England (45.9). Looked after children had much lower average Attainment 8 scores, and this was the case for both Hull (19.1) and England (18.3). It is likely that looked after children obtain lower outcomes in their GCSEs, but it is also possible that they undertake fewer qualifying GCSEs.
During the 2020/21 school year, the average Attainment 8 score was 38.6 among children eligible for free school meals compared to 39.1 for England, so the average score in England was only marginally better.
Compared with benchmark
| Indicator | Period | England | Yorkshire and the Humber region (statistical) | Kingston upon Hull | East Riding of Yorkshire | North East Lincolnshire | North Lincolnshire | York | North Yorkshire UA | Barnsley | Doncaster | Rotherham | Sheffield | Bradford | Calderdale | Kirklees | Leeds | Wakefield |
|---|---|---|---|---|---|---|---|---|---|---|---|---|---|---|---|---|---|---|
Average Attainment 8 score (Persons 15-16 yrs) | 2024/25 | 46.0 | 44.5 | 40.4 | 45.1 | 41.7 | 44.2 | 50.7 | 45.8 | 44.2 | 44.7 | 41.8 | 43.4 | 41.8 | 47.6 | 46.2 | 46.2 | 44.8 |
Average Attainment 8 score of children in care (Persons 15-16 yrs) | 2023/24 | 18.3 | 19.3 | 19.1 | 16.1 | 23.4 | 25.6 | 23.1 | 19.0 | 19.3 | 22.3 | 18.0 | 13.0 | 17.6 | 35.2 | 21.0 | 17.6 | 19.5 |
Average Attainment 8 Score among children eligible for Free School Meals (FSM) (Persons 15-16 yrs) | 2020/21 | 39.1 | 37.6 | 38.6 | 40.2 | 37.7 | 37.9 | 38.1 | - | 37.2 | 36.5 | 37.7 | 35.6 | 36.7 | 41.5 | 38.6 | 37.8 | 36.7 |
Whilst the Attainment 8 score had improved in Hull between 2016/17 and 2020/21, the major part of the increase is likely due to the COVID-19 pandemic due to educational attainment determined on the basis of coursework and other factors (for 2019/20 and 2020/21). The results were generally higher for these two years, as they were nationally, and this means that the results in 2019/20 and 2020/21 are not comparable with earlier years. When examinations recommenced in 2021/22, the average Attainment 8 score was comparable to 2018/19, although has decreased in both 2022/23 and 2023/24. However, this pattern of change is not unique to Hull with similar trends over time observed for both England and across the region.
Compared with benchmark
Average Attainment 8 score (Persons 15-16 yrs)
|
Period
|
Kingston upon Hull |
Yorkshire and the Humber region (statistical)
|
England
|
||||
|---|---|---|---|---|---|---|---|
|
Count
|
Value
|
95%
Lower CI |
95%
Upper CI |
||||
| 2014/15 | • | - | 43.1 | - | - | 46.9 | 47.4 |
| 2015/16 | • | - | 47.7 | - | - | 48.9 | 48.5 |
| 2016/17 | • | - | 42.9 | - | - | 45.6 | 46.5 |
| 2017/18 | • | - | 43.7 | - | - | 45.3 | 46.7 |
| 2018/19 | • | 103724 | 43.9 | - | - | 45.7 | 46.7 |
| 2019/20 | • | 126252 | 45.7 | - | - | 48.4 | 50.2 |
| 2020/21 | • | 132556 | 46.9 | - | - | 49.2 | 50.9 |
| 2021/22 | • | 127745 | 43.8 | - | - | 46.9 | 48.8 |
| 2022/23 | • | 130491 | 42.3 | - | - | 44.8 | 46.3 |
| 2023/24 | • | 128096 | 41.1 | - | - | 44.3 | 45.9 |
| 2024/25 | • | 128636 | 40.4 | - | - | 44.5 | 46.0 |
Source: OHID, based on Department for Education data
The average Attainment 8 score among looked after children also increased in Hull for 2019/20 and 2020/21, but the score was also higher in 2021/22 in contrast to England and the pattern of change observed for all pupils in Hull. However, there was a substantial reduction in the average Attainment 8 score among looked after children in 2022/23 falling to a new low of 14.9 in Hull, before recovering somewhat to 19.1 in 2023/24, when it again was slightly higher than for England.
Compared with benchmark
Average Attainment 8 score of children in care (Persons 15-16 yrs)
|
Period
|
Kingston upon Hull |
Yorkshire and the Humber region (statistical)
|
England
|
||||
|---|---|---|---|---|---|---|---|
|
Count
|
Value
|
95%
Lower CI |
95%
Upper CI |
||||
| 2016/17 | • | 634 | 21.1 | - | - | 20.2 | 19.2 |
| 2017/18 | • | 764 | 19.1 | - | - | 18.7 | 18.6 |
| 2018/19 | • | 435 | 15.5 | - | - | 19.9 | 19.0 |
| 2019/20 | • | 1025 | 21.8 | - | - | 21.2 | 21.3 |
| 2020/21 | • | 1148 | 23.0 | - | - | 23.8 | 23.2 |
| 2021/22 | • | 1466 | 23.7 | - | - | 21.2 | 20.3 |
| 2022/23 | • | 744 | 14.9 | - | - | 18.9 | 19.3 |
| 2023/24 | • | 1124 | 19.1 | - | - | 19.3 | 18.3 |
Source: Department for Education
As at June 2024, trend data for the average Attainment 8 score among pupils eligible for free school meals is not available with only data for 2020/21.
Outcomes in Sixth Form (Key Stage 5)
Due to the impact of the pandemic it is difficult to assess the trend in A Level results in the city. In 2018 and 2019 Hull pupils in both state funded schools and colleges achieved fewer 3+ A grades and A*/A/B grades than both the Yorkshire and Humber total and the England total overall. However, the average point score (APS) for those pupils who were successful was either on a par or exceeding both the regional and the national values.
The 2019/20 and 2020/21 A Level exam seasons were cancelled with grades being awarded either by a moderated algorithm or later be centres (Schools and colleges were asked to allocate grades based on their best judgement regarding what grade they believed candidates would have achieved if exams had gone ahead. These institutions were referred to as centres). Significant grade inflation took place in those two years. Examinations resumed for the 2021/22 academic year and it was decided that the system for marking and awarding grades would be based on a mid point of the assessed marks and grades of the two preceding pandemic years. Consequently a marked drop has been noted since then, although grades still remain higher than those recorded before the pandemic.
| Percentage achieving 3 A* to A grades | 2018/19 | 2019/20 | 2020/21 | 2021/22 | 2022/23 | 2023/24 | 2024/25 |
| Hull | 7.4% | 15.3% | 21.8% | 17.4% | 15.0% | 13.2% | 14.1% |
| Yorkshire and the Humber | 10.0% | 18.2% | 23.5% | 19.0% | 12.4% | 13.5% | 13.5% |
| England | 13.7% | 19.9% | 25.3% | 20.3% | 13.7% | 14.5% | 14.9% |
| Percentage achieving AAB grades or better | 2018/19 | 2019/20 | 2020/21 | 2021/22 | 2022/23 | 2023/24 | 2024/25 |
| Hull | 13.4% | 26.2% | 31.3% | 31.7% | 25.6% | 24.1% | 21.5% |
| Yorkshire and the Humber | 17.38% | 28.2% | 35.1% | 29.8% | 20.9% | 22.3% | 22.8% |
| England | 18.4% | 30.4% | 37.6% | 31.4% | 22.5% | 23.4% | 24.3% |
| A levels: average points score | 2018/19 | 2019/20 | 2020/21 | 2021/22 | 2022/23 | 2023/24 | 2024/25 |
| Hull | 34.1 | 39.5 | 40.8 | 37.9 | 35.6 | 35.2 | 35.3 |
| Yorkshire and the Humber | 32.6 | 38.0 | 40.0 | 37.3 | 33.6 | 34.0 | 34.6 |
| England | 32.9 | 38.6 | 40.5 | 37.9 | 34.2 | 34.4 | 35.0 |
Highest Educational Qualifications Among Adults
Local authority labour market profiles are available from Official Labour Market Statistics (nomis) and present information on the number of working-age adults by their highest educational attainment from the Office for National Statistics Annual Population Survey.
In 2024 the percentage of adults aged 16-64 years with no qualifications was higher in Hull at 10.0% compared to the region (7.8%) and across Great Britain (6.8%). The higher percentage of Hull’s residents with no qualifications is to be expected, given that Hull is one of the most deprived local authorities in England (the fourth most deprived in the 2019 Index of Multiple Deprivation).
Overall, 29.7% of working-age people in Hull had qualifications at National Vocational Qualification (NVQ) 4 or above (degree, full technical certificates and Higher National Certificates) compared to 39.3% across the Yorkshire and Humber, and 47.3% for Great Britain.
| Qualification | Hull 2024 (N) | Hull 2024 (%) | Y&H 2024 (%) | GB 2024 (%) |
| NVQ4 and above | 48,500 | 29.7 | 39.3 | 47.2 |
| NVQ3 and above | 83,200 | 51.0 | 62.4 | 67.6 |
| NVQ2 and above | 123,600 | 75.7 | 85.1 | 86.5 |
| NVQ1 and above | 134,400 | 82.3 | 87.9 | 88.9 |
| Other qualifications | 12,600 | 7.7 | 4.3 | 4.3 |
| No qualifications | 16,300 | 10.0 | 7.8 | 6.8 |
More information about the different NVQ levels can be found in the Glossary.
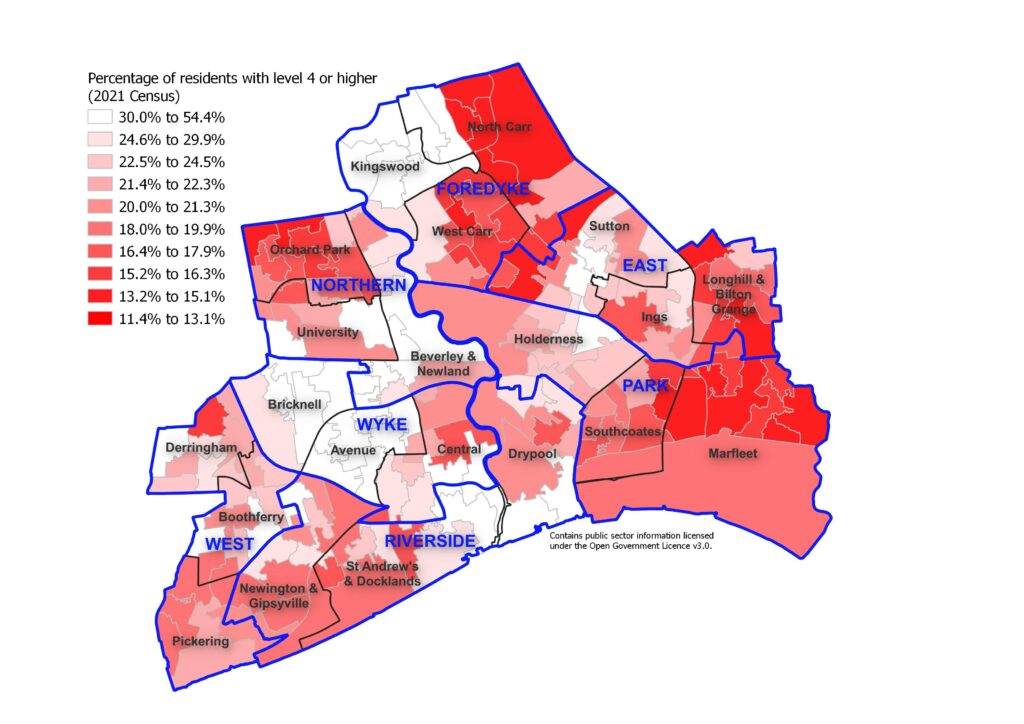
The 2021 Census also collected information on the qualifications of adults aged 16 years or older who completed the questionnaire, and it is possible to present this at lower layer super output area geographical area for Hull. There are 168 of these geographical areas in Hull following the 2021 Census (see Glossary for more information).
Based on the 2021 Census, one-third or more residents in areas of North Carr, Orchard Park, St Andrew’s & Docklands, Newington & Gipsyville and Marfleet had no qualifications.
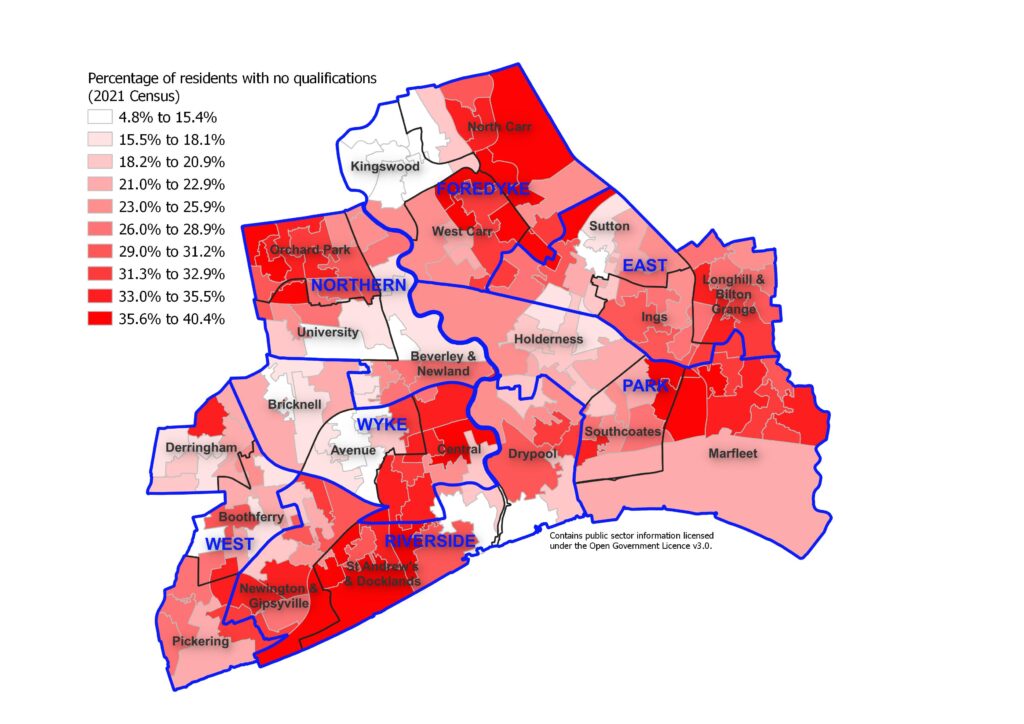
A similar but reversed pattern was evident when examining the percentage of residents aged 16+ years who had a highest educational attainment of level 4 or higher. Level 4 relates to degree levels, but further information relating to the different levels for qualifications can be found in the Glossary.
In most of Kingswood, Bricknell, Avenue, and Beverley & Newland wards, three in ten or more residents aged 16+ years had degrees or higher qualifications. People living in North Carr, Orchard Park, Marfleet, Longhill & Bilton Grange and West Carr were the least likely to have a degree.
Interestingly, whilst part of St Andrew’s & Docklands and Central wards were among the wards most likely to have a high percentage of the resident population without qualifications, they also had areas that had among the highest percentage of the resident population with degrees. It might be associated with younger population and newer housing developments in part of St Andrew’s & Docklands.
Strategic Need and Service Provision
Children potentially requiring additional support should be assessed as quickly as possible as early help gives rise to better outcomes. Children with an Education, Health and Care plan or in receipt of Special Educational Needs support need to have clear, comprehensive, integrated plans drawn up as soon as possible, with all professionals and the family working together to give the child the best possible care and support.
Hull’s Early Help and Prevention offer is focused on a whole family approach which aims to identify individuals and families with problems and brings together different services and agencies to collectively look at what support is needed and then work together to deliver the required support in an coordinated way. This is essential so that children and families, particularly those most in need, are supported so that children can achieve the best they can in their education to ensure good employment prospects.
There should also be promotion of physical and mental wellbeing across all educational settings. Hull was one of the places awarded funds from the Big Lottery Fund for HeadStart project. HeadStart Hull has been running a number of years in Hull with delivery across the city since a pilot in 2017. This programme aims to enable children and young people to have positive mental health and wellbeing, thrive in their ‘communities’, and be able to ‘bounce back’ from life’s challenges. The programme is running in a number of schools in Hull. There are a range of services offered through HeadStart Hull, and it is an integral part of the Early Help Delivery Model in Hull.
Employment prospects become more limited for people with fewer qualifications, and promotion is less likely. This impacts on their financial resilience, and can impact on mental wellbeing. Among adults with no formal qualifications who might struggle with basic literacy and numeracy as well as affecting their employment prospects, it can impact on many other aspects of everyday life, such as dealing with organisations if writing letters are required, dealing with household finances and bills, as well as ability to help children with homework etc. Everybody should have the opportunity to improve their employment and life choices through increased education, training and knowledge.
Resources
The Office for Health Improvement & Disparities’ Fingertips: https://fingertips.phe.org.uk/
Official Labour Market Statistics (nomis). Labour Market Profile for Hull. https://www.nomisweb.co.uk/reports/lmp/la/1946157109/report.aspx#tabempunemp
UK Government. Education, health and care plans. https://explore-education-statistics.service.gov.uk/find-statistics/education-health-and-care-plans
Marmot, M., Fair society, healthy lives: the Marmot review: strategic review of health inequalities in England post-2010. University College London Institute of Health: London, 2010.
A Bus, A.G., M.H. van IJzendoorn, and A.D. Pellegrini, Joint book reading makes for success in learning to read: a meta-analysis on intergenerational transmission of literacy. Review of Educational Research, 1995. 65(1): p. 1-21.
Jama, D. and G. Dugdale, Literacy: State of the Nation. A picture of literacy in the UK today. 2010, National Literacy Trust: London.
Department for Business Innovation and Skills, The 2011 skills for life survey: a survey of literacy, numeracy and ICT levels in England. 2012, Department for Business Innovation and Skills: London.
Simon, N., Emerging stronger: the value of education and skills in turbulent times. Education and skills survey 2009. 2009, Confederation of British Industry.: London.
Dugdale, G. and C. Clark, Literacy changes live: An advocacy resource. 2008, National Literacy Trust: London.
National Literacy Trust, Manifesto for literacy. 2009, National Literacy Trust: London.
Clark, C., S. Osborne, and G. Dugdale, Reaching out with role models: summary of the study. 2009, National Literacy Trust: London.
Book Trust, Book time and booked up: parents and carer’s research. 2009, Book Trust: London.
Updates
This page was last updated / checked on 5 March 2026.
This page is due to be updated / checked in September 2026.