Index
This topic area covers statistics and information relating to physical activity among adults in Hull including local strategic need and service provision. Further information relating to Physical Activity Among Children and Young People is given under Lifestyle Factors within Children and Young People. Physical activity information has been collected within Hull’s Health and Wellbeing Surveys and full reports are available under Surveys within Tools and Resources.
This page contains information from the Office for Health Improvement & Disparities’ Fingertips. Information is taken ‘live’ from the site so uses the latest available data from Fingertips and displays it on this page. As a result, some comments on this page may relate to an earlier period of time until this page is next updated (see review dates at the end of this page).
Headlines
- Whilst physical inactivity, together with poor diet, has an impact on obesity which is a risk factor for poor health, physical inactivity is an independent risk factor for poor physical health, and physical activity can also improve mental health.
- It is estimated that physical inactivity is costing the UK around £7.4 billion a year including £0.9 billion to the NHS alone.
- The levels of physical inactivity in Hull are high, and there is a strong association with deprivation. This impacts on levels of obesity in Hull which are high, as well as increasing the risk of poor physical and mental health. However, it is further likely that obesity and mental health impact on levels of physical activity too.
- A Physical Activity Needs Assessment was undertaken in Hull during 2025 which examines physical activity levels in Hull in more detail as well as provides qualitative information relating to the needs and barriers of the people of Hull in relation to physical activity.
- In the local Health and Wellbeing Survey conducted during 2019, 41% of people fulfilled the national physical activity guidelines of 150 minutes or more of moderate or vigorous physical activity per week, but 44% were classified as inactive as they undertook fewer than 30 minutes moderate or vigorous physical activity per week. Compared to the local survey conducted during 2014, physical activity levels have decreased with fewer people fulfilling the national guidelines (although similar percentages inactive).
- In the national Active Lives Survey, a higher percentage of Hull’s residents aged 19+ years were estimated to fulfil the national guidelines (62.8% for 2023/24) and fewer were inactive (27.5% for 2023/24), but it is likely that the local survey gives more robust results due to the much larger numbers surveyed as well and the survey methodology employed. Compared to England, physical activity levels were lower in Hull with more people active in England (67.4%) and fewer people inactive (22.0%) in England.
- Further analysis of trends over time from the Active Lives Survey show that there have been a relatively large changes changes in the percentage of people who were physically active between 2022/23 and 2023/24, but that the changes were different between men and women, and differed between those aged 16-34 years and those aged 35+ years. This means when the percentage of people who are physically active is presented for men and women combined, there appears to have been only a relatively small change. Combining the genders has masked individual changes between men and women.
- For men, 61.2% were physically active in 2019/20, but this decreased to 46.6% for 2020/21 before increasing to 65.4% for 2022/23 which was the highest level since before 2015/16, before decreasing slightly to 64.4% in 2023/24. In contrast, 52.6% of women were physically active in 2019/20 and this remained relatively unchanged in 2020/21 (53.4%) and 2021/22 (54.8%), decreased sharply in 2022/23 (46.3%), before returning to 54.3% in 2023/24. Examining the age groups in more detail, it would appear that the large decrease among women seen in 2022/23 and among men in 2020/21 was largely due to people aged 16-34 years. Due to small numbers surveyed, it is difficult to ascertain the true patterns by age and gender and it could be that there are biases due to the small number of men and women in specific age groups who were included in the survey. However, it does appear that men aged 16-34 years were particularly affected by the pandemic and perhaps to a lesser extent women aged 16-34 years in terms of being physical active. This is likely to be the case anyway as it is likely that men and younger people will be more likely to walk or cycle to school, college or work, and more likely to participate in organised sports clubs and attend the gym, and all of these together with furlough from work are likely to have reduced physical activity levels.
- There appears to have been an increase in the percentage of people who are physically inactive among those who have disabilities and long-term health conditions. Between 2015/16 and 2018/19, around 23% were physically inactive but in the last four years 2019/20 to 2022/23 this has increased to 28% (and was even higher for 2020/21 during the pandemic), although decreased in 2023/24 to 25.3%. Age will be a confounder though when examining associations between physical activity or inactivity and disability.
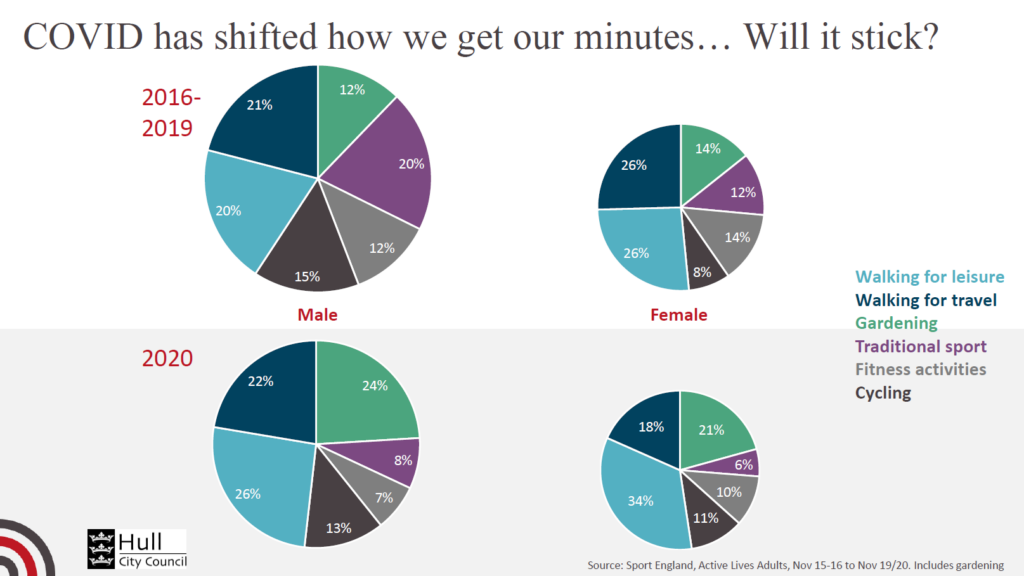
- The COVID-19 pandemic has had a significant effect on people’s activity levels. In general, there has been an increase in inactivity. There has also been an impact on the types of activities with fewer people getting their ‘minutes’ of physical activity from traditional sports and fitness activities to more people getting their physical activity from walking and gardening.
The Population Affected – Why Is It Important?
Whatever a person’s age, there is good scientific evidence that being physically active can help them lead a healthier and happier life. Lack of physical activity may increase the risk of obesity and its associated health risks, but there is increasing evidence that lack of physical activity and inactivity is a major risk factor in its own right increasing the risk of circulatory disease, diabetes, dementia, Alzheimer’s disease, stroke, and some cancers. There is also strong evidence that physical activity promotes mental wellbeing, boosting self-esteem, mood, sleep quality, and energy, as well as easing stress and anxiety.
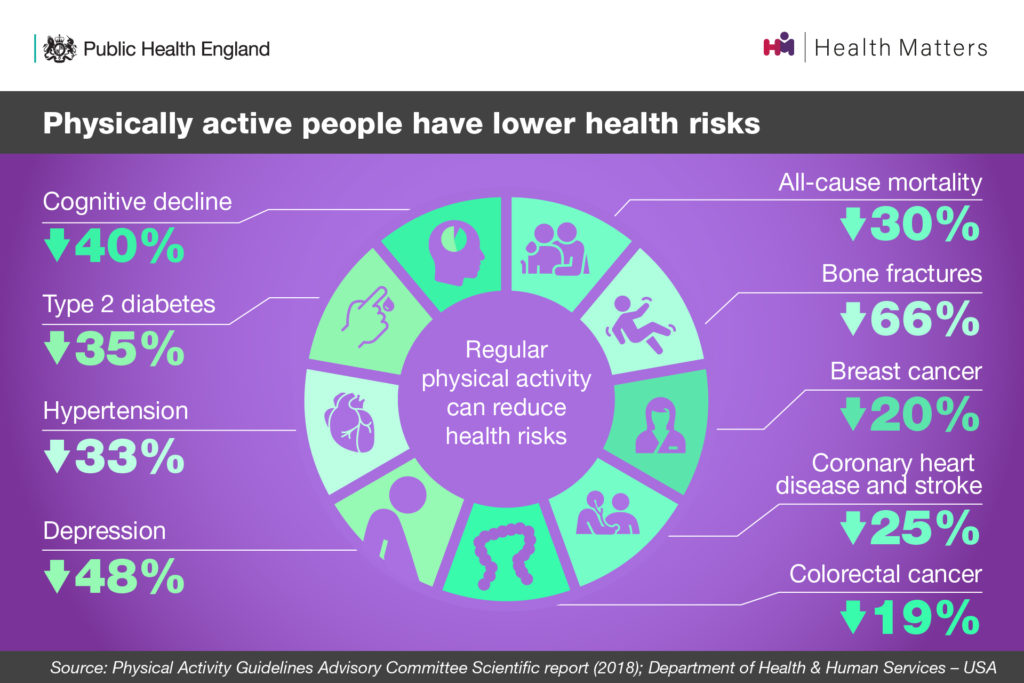
The Office for Health Improvement & Disparities (formerly Public Health England) estimate that this lack of physical activity is costing the UK £7.4 billion a year, including £0.9 billion to the NHS alone.
The Chief Medical Officer guidelines for physical activity sets out the amount and type of activities for health benefits for different age groups from babies to older adults, stating that some physical activity is good, more is better. It is recommended that physical activity levels should be 150 minutes every week throughout pregnancy, three hours every day from birth to five years, at least an hour a day for five to 18 year olds, 75 minutes of vigorous intensity or 150 minutes of moderate intensity physical activity for adults aged 19-64 years, and 150 minutes of at least light intensity physical activity for adults aged 65+ years.
In general, the more time spent being physically active, the greater the health benefits. However, the gains are especially significant for those currently doing the lowest levels of activity (fewer than 30 minutes per week), as the improvements in health per additional minute of physical activity will be proportionately greater.
The Hull Picture
Hull’s Physical Activity Needs Assessment 2025
A Physical Activity Needs Assessment was undertaken in Hull during 2025 which examines physical activity levels in Hull in more detail as well as provides qualitative information relating to the needs and barriers of the people of Hull in relation to physical activity.
Local Health and Wellbeing Survey 2019
Fulfils National Physical Activity Guidelines
From the local adult Health and Wellbeing Survey 2019, 41% fulfilled the national guidelines (150 minutes or more of moderate intensity physical activity per week). There was a strong association with age and deprivation. Due to the association with age, there was also a strong association between fulfilling the national physical activity guidelines, and employment status and household composition. Among survey responders aged under 65 years, the single person households had a higher percentage of males aged 35-64 years (42% versus 24% for all other households type where the survey responder was aged under 65 years) and females aged 55-64 years (19% versus 8% for all other households types where the survey responder was aged under 65 years). So it appears that this group could include people who are separated or divorced as well as single individuals.
There have been changes to the physical activity guidance for adults aged 65+ years since the local 2019 survey was conducted with light activity now counting towards fulfilling the national guidelines for those aged 65+ years, but the local analysis uses moderate or vigorous activity levels for all.
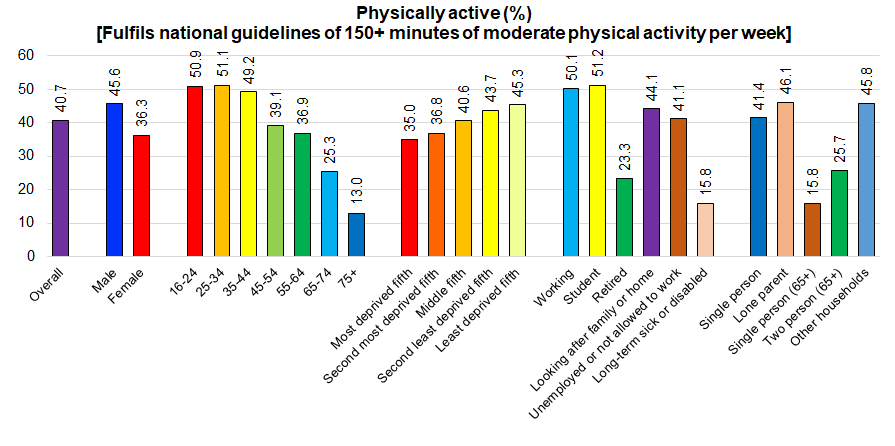
The percentage of physically active adults varied by wards, with between one third and one half of adults by ward reporting that they took at lest 150 minutes of moderate physical activity per week. The lowest percentage of adults reporting meeting these guidelines were in Longhill & Bilton Grange (33%), Derringham (34%) and Boothferry (39%), while the highest percentages were in Beverley & Newland (51%), Avenue (50%) and Central (49%).

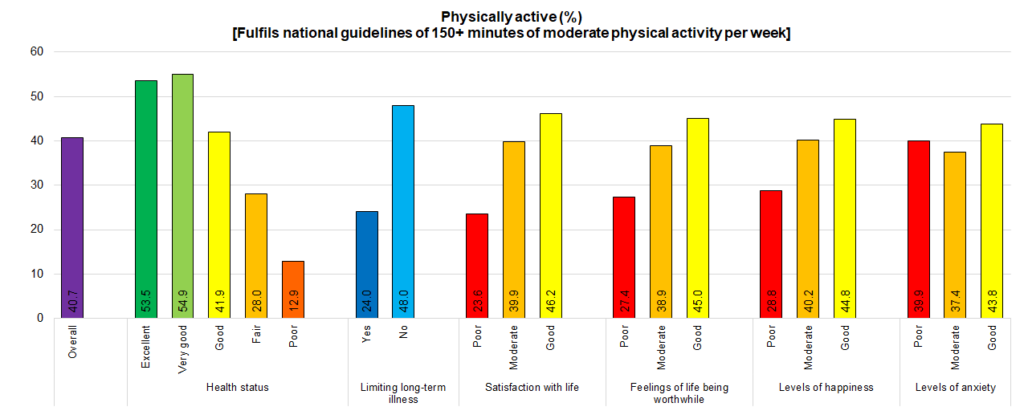
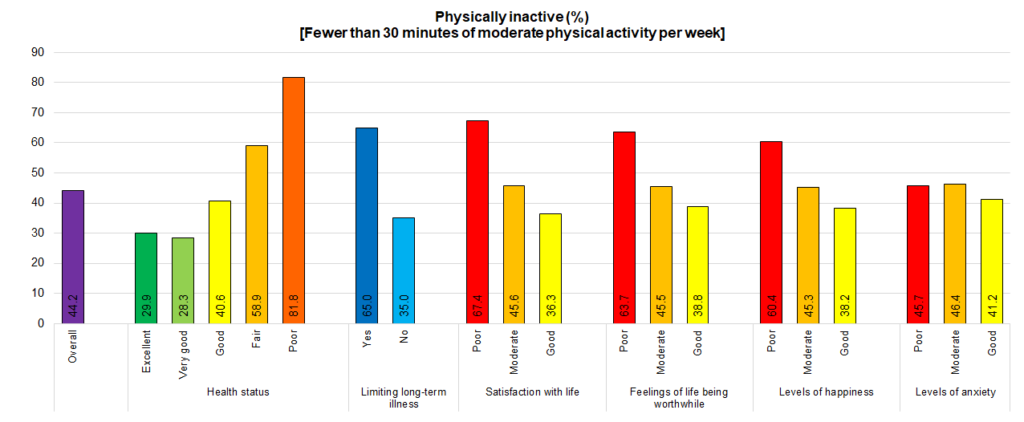
Health status also had a significantly impact on physical activity levels. People who stated that their health was excellent or very good and those who did not have any illness or disabilities that limited their daily activities were much more likely to undertake the recommended levels of physical activity with around half doing so, compared to only 13% of those with poor health, and 24% of those with long-term illnesses or disabilities that limited their daily activities. However, younger people were more likely to fulfil the national physical activity guidelines and they were also more likely to have better health so age is a confounder here. People were asked to rate their satisfaction with life, feelings of their life being worthwhile, happiness yesterday and anxiety yesterday on a scale of 0 (not at all) to 10 (completely). Poor, moderate and good levels were classified as having scores of 0-4, 5-7 and 8-10 respectively for the first three questions and as having scores of 6-10, 3-5 and 0-2 for the final question on anxiety. People who had the poorest wellbeing were the least likely to be physically active, although there was relatively small difference in physical activity by levels of anxiety.
Physically Inactive
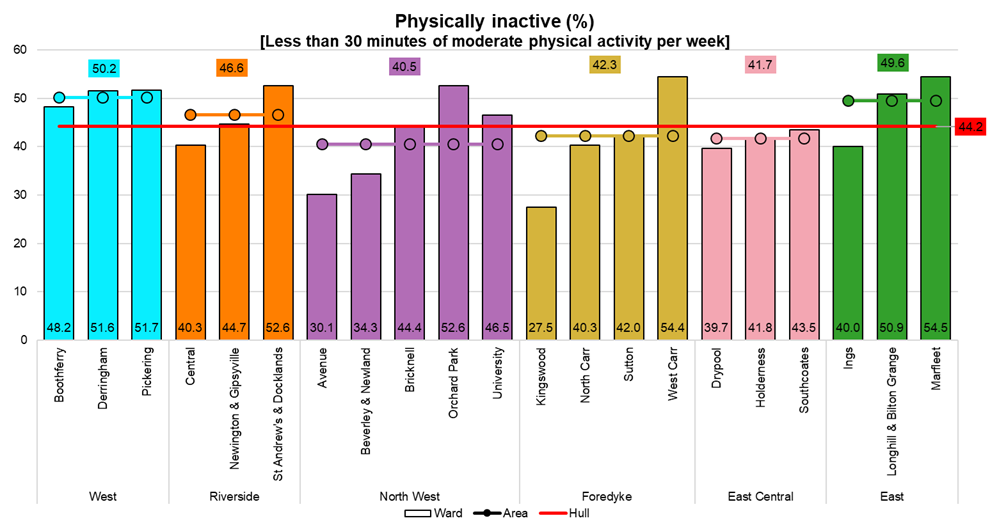
Overall, 44% of people aged 16+ years in Hull were inactive (fewer than 30 minutes of moderate intensity physical activity per week), again there was a strong association with age and deprivation. This equates to around 92,300 adults in Hull who are physically inactive and an additional 31,650 people who are not classified as physical inactive but do not fulfil the national physical activity guidelines. Thus, in total it is estimated that 123,900 people in Hull do not fulfil the national physical activity guidelines of 150+ minutes of moderate intensity activity per week.
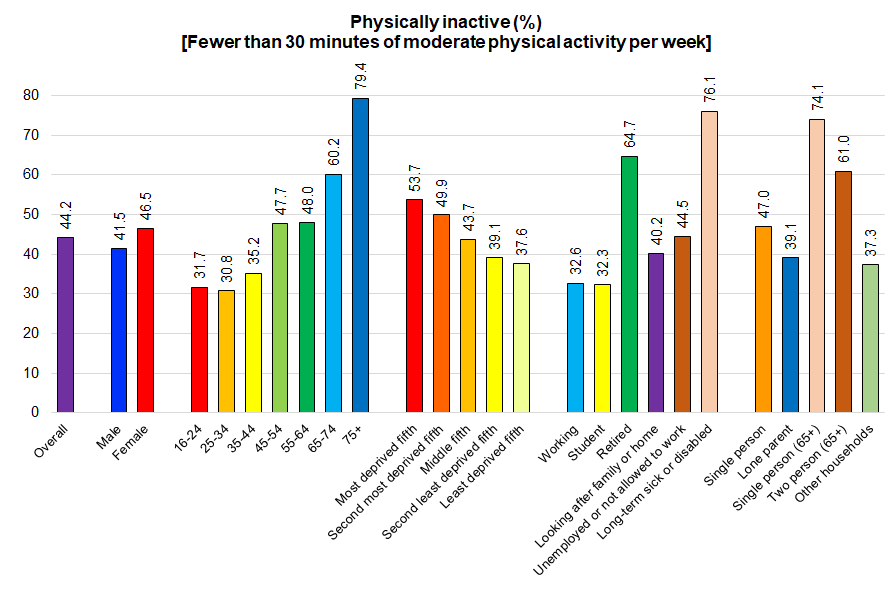
There was again a large degree of variation by ward in the percentage of inactive adults, with 28% of Kingswood adults and 30% of Avenue adults reporting taking less than 30 minutes of moderate physical activity per week, rising to 55% in Marfleet, 54% in West Carr and 53% in St Andrew’s & Docklands, although some of these differences will be due to differences in the age of survey respondents between wards.
As expected, given the strong association between physical activity and physical health and emotional wellbeing above, there was also a strong association between health and physical inactivity, but as mentioned above age will be a confounding factor (and other factors too).
However, examining this and other factors further there is a very strong association with feelings of safety in the local area (whilst walking alone during the daytime, after dark and alone at night at home) and the frequency of use of local parks. Feelings of safety are all associated with age, gender, deprivation, and limiting long-term illness and disability. Age, gender, deprivation, limiting long-term illness and disability, body mass index are all statistically significant independent predicators of physical inactivity. This means that after taking into account all these factors, each factor listed still has an influence on levels of physical inactivity. Furthermore, after taking into consideration age, gender, deprivation and limiting long-term illness and disability, physical activity levels are also associated with the use of parks and the perception of safety during the day. Although if we additionally take body mass index into account as well as age, gender, deprivation and limiting long-term illness and disability, physical activity levels are also associated with the use of parks (and the perception of safety during the day is no longer statistically significant).
Levels of Physical Activity
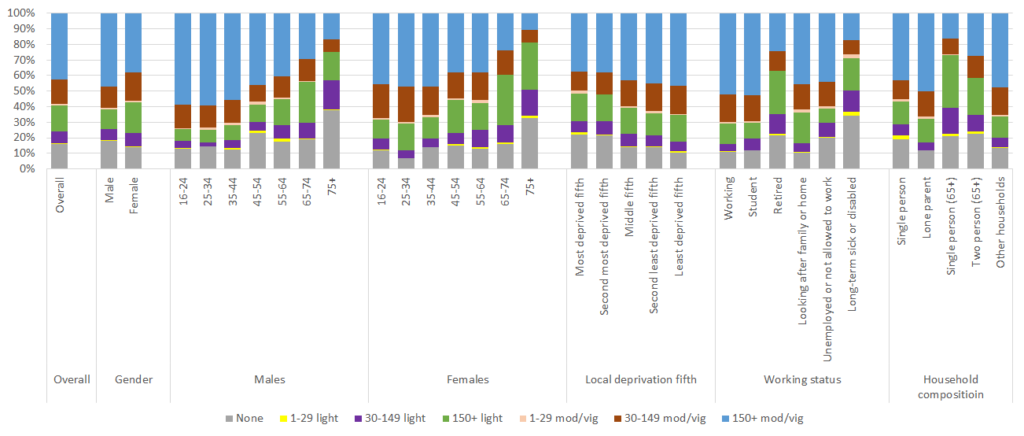
Physical activity levels in the local survey can be broken down into the degree of physical activity over and above the two ‘active’ and ‘inactive’ classifications above as the number of minutes of light physical activity was also collected within the local survey. The pale blue category at the top denotes the ‘active’ group above fulfilling the national guidelines of 150+ minutes of moderate/vigorous activity per week.
There are some positive findings from the survey in relation to activity levels as there are a significant proportions of people undertaking some physical activity who might be nudged slightly to increase either their intensity levels or number of minutes throughout the week in order to fulfil the national physical activity guidelines.
The proportions below shaded in brown are undertaking 30-149 minutes of moderate or vigorous intensity physical activity per week, and the proportions below shaded in green are undertaking 150+ minutes of light physical activity per week (in fact those aged 65+ years in green would be classified as ‘active’ and fulfilling the national guidance with the relatively new physical activity guidance for those aged 65+ years). These two groups represent a sizeable proportion of individuals who are currently classified as ‘inactive’ based on the local Health and Wellbeing Survey 2019.
Change in Physical Activity Levels Over Time in Local Surveys
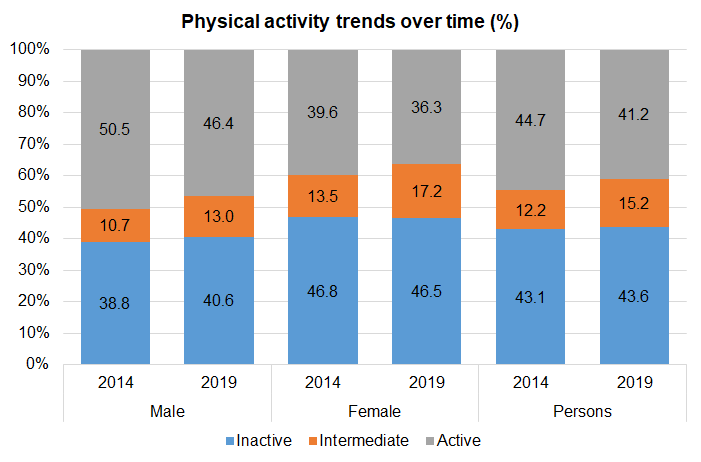
Local Health and Wellbeing Surveys have been conducted in Hull since 2003 for adults, although over that time period the national guidance for physical activity has changed, and this has resulted in necessary changes to the questions that were asked in the surveys in relation to physical activity levels. This means that it is not possible to compare trends over time over a long period of time, and only possible to compare the latest survey results of 2019 with previous survey conducted in 2014.
The age-standardised percentages of adults who are inactive (undertaking fewer than 30 minutes of moderate-intensity physical activity per week), who are in the intermediate group (undertaking 30+ minutes but fewer than 150 minutes of moderate-intensity physical activity per week) and who are active (undertaking 150+ minutes of moderate-intensity physical activity per week) is given for men and women for 2019 compared to 2014.
For men, the percentage who are active has reduced from 51% to 46% and the percentage who are inactive has increased from 39% to 41% between 2014 and 2019. Among women, the percentage who were active has also reduced from 40% to 36%, but the percentage who are inactive has remained relatively unchanged (from 47% to 46%). Thus physical activity levels have reduced among Hull men and women over the five year period.
National Active Lives Survey
All Individuals
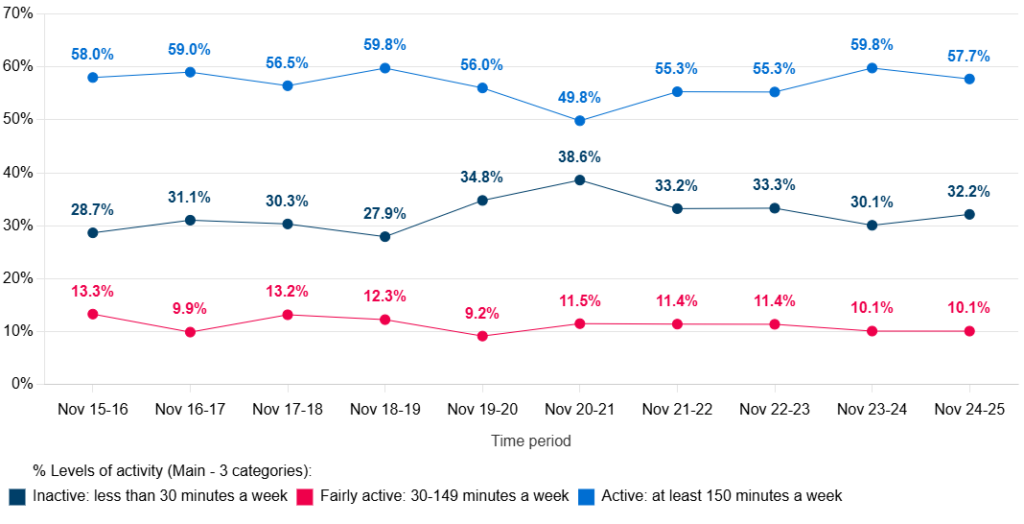
From the Office for Health Improvement & Disparities’ Fingertips, in 2024/25, 60.0% of adults aged 19+ years in Hull were physically active. fulfilling the national physical activity guidelines, and 29.7% were inactive. undertaking fewer than 30 minutes of physical activity per week. More people in England (68.0%) were active and fewer people were inactive (21.8%), so physical activity levels were lower in Hull.
There is a large difference in these estimates compared to the local adult Health and Wellbeing Survey. The national data comes from the Active Lives Survey conducted by Sport England, and there are around 500 people in Hull who participate in the survey each year, although this was around 800 people for 2024/25. The local adult Health and Wellbeing Survey conducted in 2019 involved over 4,000 survey responders and from the way the survey was conducted there was good representation of survey responders across both genders, all age groups and across Hull’s wards. Therefore, it is much more likely that the measures of physical activity undertaken in the local survey are more representative of the actual levels undertaken across all of Hull’s adult population. Nevertheless, it is likely that these will represent the ‘official’ figures for physical activity in Hull, and for completeness the data from the Active Lives Survey is presented here.
The percentage of adults who are physical active in Hull is statistically significantly lower than England, and is among the lowest across the Yorkshire and Humber region. Furthermore, the percentage of adults who are physical inactive is also statistically significantly higher than England, and the percentage is also among the lowest across the region.
Whilst it is felt that the results from the Active Lives Survey does not reflect physical activity levels in Hull, it is more likely that any comparison with other geographical places is more robust (although given Hull’s high deprivation levels and the influence of deprivation on survey response rate does mean that there is also some degree of uncertainty in relation to comparisons too). Furthermore, it is likely that the trends over time will be more similar to the actual trend. From the local survey data, it is just anticipated that the actual percentages differ.
Compared with benchmark
| Indicator | Period | England | Yorkshire and the Humber region (statistical) | Kingston upon Hull | East Riding of Yorkshire | North East Lincolnshire | North Lincolnshire | York | Barnsley | Doncaster | Rotherham | Sheffield | Bradford | Calderdale | Kirklees | Leeds | Wakefield | North Yorkshire Cty |
|---|---|---|---|---|---|---|---|---|---|---|---|---|---|---|---|---|---|---|
Percentage of physically active adults (Persons 19+ yrs) | 2024/25 | 68.0 | 67.0 | 60.0 | 70.1 | 62.5 | 61.0 | 76.2 | 67.4 | 60.8 | 64.5 | 69.8 | 62.1 | 68.1 | 62.4 | 70.4 | 65.7 | - |
Percentage of physically inactive adults (Persons 19+ yrs) | 2024/25 | 21.8 | 23.5 | 29.7 | 21.0 | 26.8 | 26.3 | 15.1 | 24.5 | 30.0 | 25.2 | 20.2 | 28.0 | 22.1 | 29.0 | 20.3 | 24.7 | - |
Based on the Active Lives Survey, the percentage of adults physically active had been generally around 60% between 2015/16 and 2024/25, dropping to 55.2% during the COVID-19 pandemic, then recovering afterwards. In 2023/24 the percentage of physically active adults was the highest over this period at 62.8%, before dropping back to 60.0% in 2024/25.
The percentage of people in Hull who walk or cycle for travel is generally higher in Hull compared to the average across England due to it being a relatively flat compact city. It is likely that this impacted on physical activity levels in Hull for 2020/21 as fewer people would have been walking or cycling to work, or accompanying younger children to school. In general, the type of physical activity undertaken during the lockdowns for the COVID-19 pandemic also changed with more walking and cycling for leisure, and more other activities such as gardening, and less physical activity from organised sport like football and rugby and at locations that were closed during the lockdowns such as gyms, swimming pools and sports centres. In the case, of Hull with a higher percentage of the population walking and cycling to work, this could have impacted on the overall levels of walking and cycling, and the increase in walking and cycling for leisure purposes may have not compensated for the decreases in walking and cycling for active travel.
Compared with benchmark
Percentage of physically active adults (Persons 19+ yrs)
|
Period
|
Kingston upon Hull |
Yorkshire and the Humber region (statistical)
|
England
|
||||
|---|---|---|---|---|---|---|---|
|
Count
|
Value
|
95%
Lower CI |
95%
Upper CI |
||||
| 2015/16 | • | - | 62.5% | 58.3% | 66.7% | 64.2% | 66.1% |
| 2016/17 | • | - | 61.9% | 57.6% | 66.0% | 64.6% | 66.0% |
| 2017/18 | • | - | 58.5% | 54.0% | 63.0% | 64.0% | 66.3% |
| 2018/19 | • | - | 62.7% | 58.5% | 67.1% | 66.2% | 67.2% |
| 2019/20 | • | - | 61.0% | 56.6% | 65.3% | 65.4% | 66.4% |
| 2020/21 | • | - | 55.2% | 50.7% | 59.6% | 65.2% | 65.9% |
| 2021/22 | • | - | 58.7% | 54.5% | 62.8% | 66.1% | 67.3% |
| 2022/23 | • | - | 58.6% | 54.3% | 63.0% | 65.7% | 67.1% |
| 2023/24 | • | - | 62.8% | 59.6% | 66.1% | 66.3% | 67.4% |
| 2024/25 | • | - | 60.0% | 56.7% | 63.4% | 67.0% | 68.0% |
Source: OHID, based on Sport England data
Based on the Active Lives Survey, the percentage of adults physically inactive has been between 24% and 32% for Hull, although as mentioned previously the figure in the local surveys have been around 43%.
The percentage of adults in Hull who are physically inactive was under 30% between 2015/16 and 2019/20, but has been just over 30% for the period 2020/21 to 2022/23, although the percentage reduced to 27.5% in 2023/24 before returning to 30% in 2024/25.
The percentage of adults who are physically inactive in Hull has been consistently higher than the region and England and for eight of the ten years has also been statistically significantly higher than England.
Compared with benchmark
Percentage of physically inactive adults (Persons 19+ yrs)
|
Period
|
Kingston upon Hull |
Yorkshire and the Humber region (statistical)
|
England
|
||||
|---|---|---|---|---|---|---|---|
|
Count
|
Value
|
95%
Lower CI |
95%
Upper CI |
||||
| 2015/16 | • | - | 24.7% | 21.0% | 28.5% | 24.7% | 22.3% |
| 2016/17 | • | - | 29.8% | 25.7% | 34.0% | 24.1% | 22.2% |
| 2017/18 | • | - | 28.5% | 24.4% | 32.5% | 24.1% | 22.2% |
| 2018/19 | • | - | 24.3% | 20.5% | 28.1% | 22.7% | 21.4% |
| 2019/20 | • | - | 29.5% | 25.5% | 33.5% | 24.2% | 22.9% |
| 2020/21 | • | - | 32.4% | 28.1% | 36.8% | 24.2% | 23.4% |
| 2021/22 | • | - | 30.7% | 27.0% | 34.7% | 23.6% | 22.3% |
| 2022/23 | • | - | 30.1% | 26.0% | 34.3% | 24.1% | 22.6% |
| 2023/24 | • | - | 27.5% | 24.4% | 30.5% | 23.5% | 22.0% |
| 2024/25 | • | - | 29.7% | 26.7% | 32.9% | 23.5% | 21.8% |
Source: OHID, based on Sport England data
Activity Levels for Different Groups of Individuals
Further information is available on the Active Lives Survey directly through the Query Builder on the Sport England website.
All Individuals
Whilst the data on Fingertips come from the Active Lives Survey, there are some slight differences in the definitions. The Active Lives Survey covered those aged 16+ years whereas the indicator on Fingertips is for those aged 19+ years. Furthermore, the focus for Sport England (and thus for the Active Lives Survey) is on sport and organised activity, whereas the Office for Health Improvement & Disparities focus is on physical activity. Information is collected on non-sporting activities like gardening within the Active Lives Survey, but it is not included in their definition of physical activity. So any ‘hours’ of physical activity for gardening does not contribute to the 150 minutes of moderate or vigorous physical activity. Whereas the definition on the Office for Health Improvement & Disparities’ Fingertips does includes gardening.
Despite the differences in the definitions, the pattern is clear in the reduction of physical activity levels among Hull’s residents from the Active Lives Survey with a higher percentage being inactive and a lower percentage fulfilling the national guidelines of 150 minutes of physical activity per week. As mentioned, whilst the overall levels of physical activity differ substantially between the Active Lives Survey and the local Health and Wellbeing Survey, it is likely that the overall trend in the Active Lives Survey is a reasonable representation of the actual trends (just at a different level).
It is also possible to examine the trends for different groups defined on the basis of gender, age and disability, but some of the data is not shown for specific groups as the numbers participating in the survey are too low.
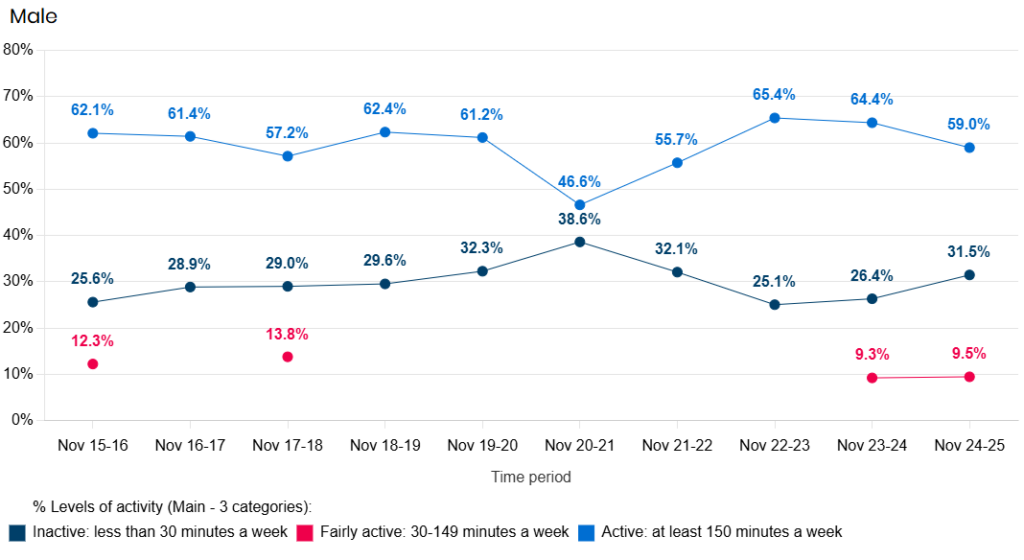
Men
For men in Hull participating in the Active Lives Survey, the percentage who were physically active during 2020/21 was low due to the pandemic, but since then the percentage has increased and is now 59.0% of men physically active for 2024/25, having peaked at 65.4% of men for 2022/23. For men, the pattern is reversed for the percentages who are physically inactive with the percentages of men who are physically inactive in Hull reaching its lowest point in 2022/23 at 25.1%, increasing slightly to 31.5% in 2024/25.
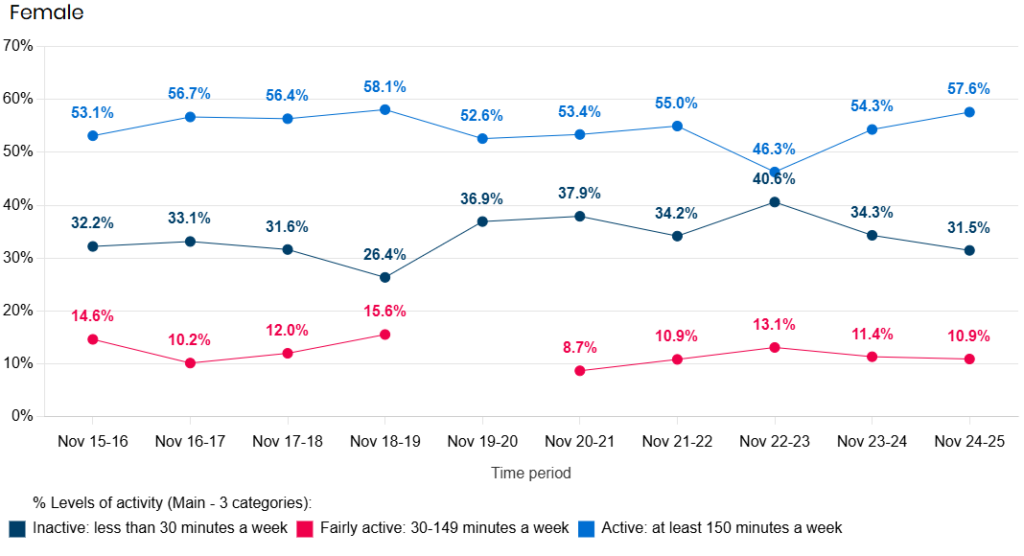
Women
For females, the percentages who are physically active is lower than males, and the pattern in the last 2-3 years is different. There was no real decrease in the percentage of women who were physically active during the pandemic, although there was a large decrease in 2022/23 to its lowest level of 46.3%, but has returned to the long term trend in 2024/25 at 57.6%. The pattern is also reversed for women for those who are physically inactive with the percentage of women who are physically inactive being the highest it has been in 2022/23 at 40.8%, before returning to just under one third in 2024/25 (31.5%), it’s lowest level since 2018/19.
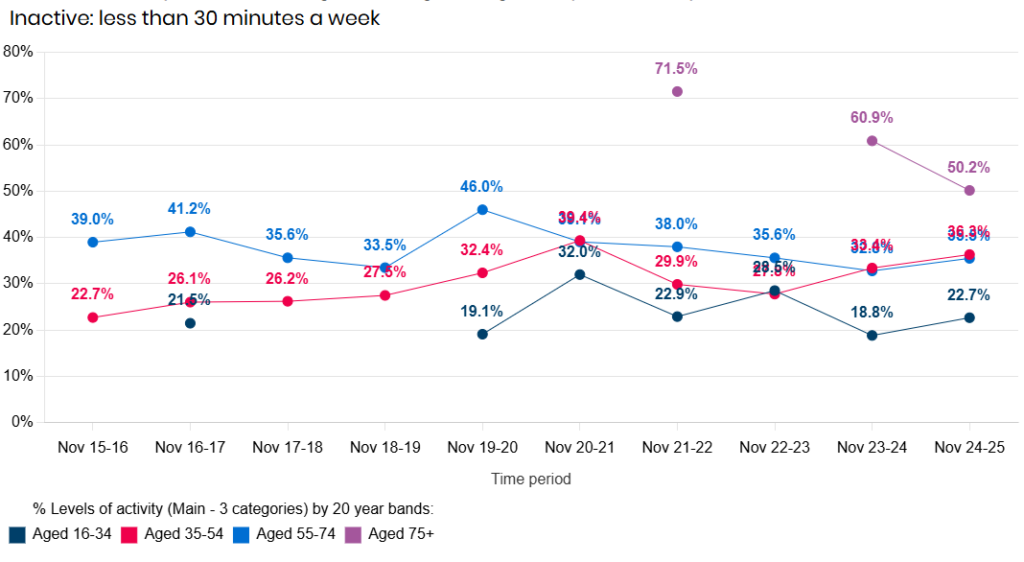
By Age
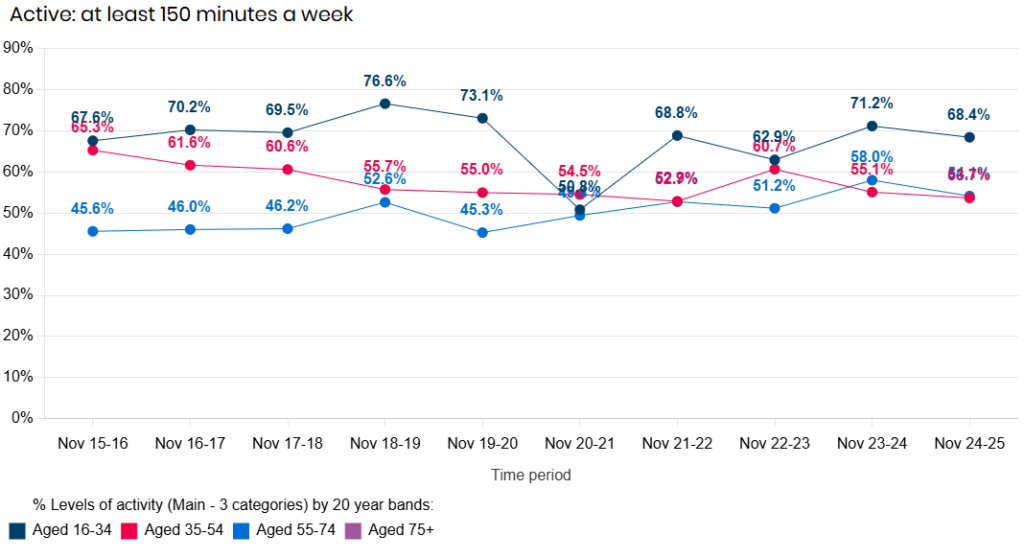
The trends over time is also available for different age groups although due to the small number of Active Lives survey responders aged 75+ years, the data is not presented for most years.
Physically Active
The percentages who are physically active differ by age although the differences between those aged 35-54 years and those aged 55-74 years were small in 2023/24. A lower percentage of those aged 55-74 years are physically active. The percentage of people who were physically active reduced considerably among those aged 16-34 years in 2020/21, and has not yet recovered to pre-pandemic levels. It could be that younger people are more likely to walk or cycle to school or college, and are also more likely to participate in organised activities and attend gyms, which impacted their physical activities levels to a greater extent compared to other age groups during the pandemic.
Physically Inactive
A similar but reversed pattern occurs for the percentage of people who are physically inactive.
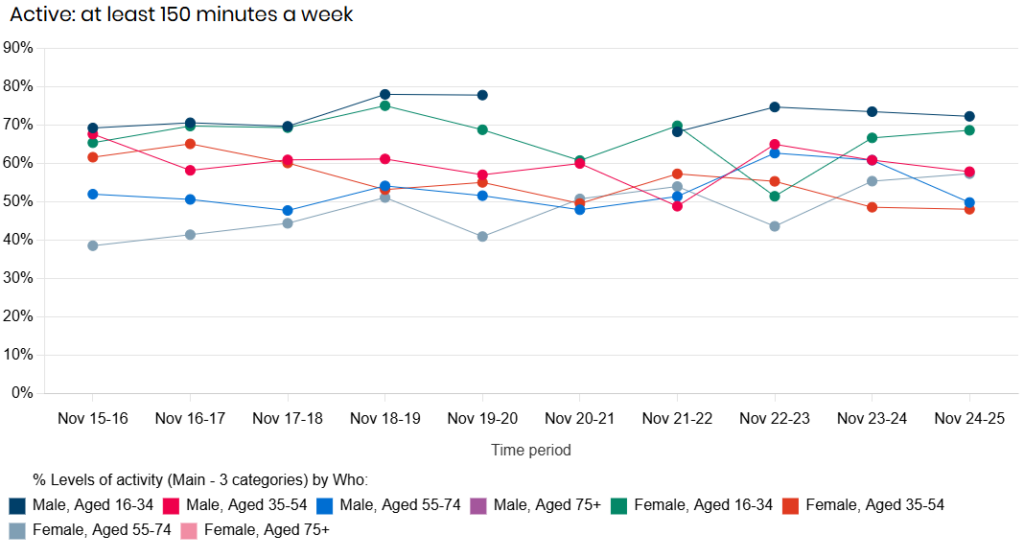
By Age and Gender
However, as noted above, there are significant differences in the trends over time between men and women in Hull in terms of physical activity and inactivity from the Active Lives Survey. Information is not available on the trends over time of physical inactivity due to small numbers, but some information is available for the percentages of people who are physically active.
Physically Active
Where information is available for both men and women for an age group, it can be seen that there is a distinct difference between 2022/23 and 2023/24. The percentage of females aged 16-34years and aged 55-74 years who are physically active increased between 2022/23 and 2023/24, but for other women, small decreases were seen. Among men, decreases were seen for all men aged 35 years and older, with little change for men aged 16-34 years. Because of relatively small numbers when broken down by both age and gender, there is a great deal of random variation from year to year. In 2023/24 and 2024/25, though, the sample sizes were much larger than in preceding years, so a greater degree of certainty can be applied to the most recent percentages.
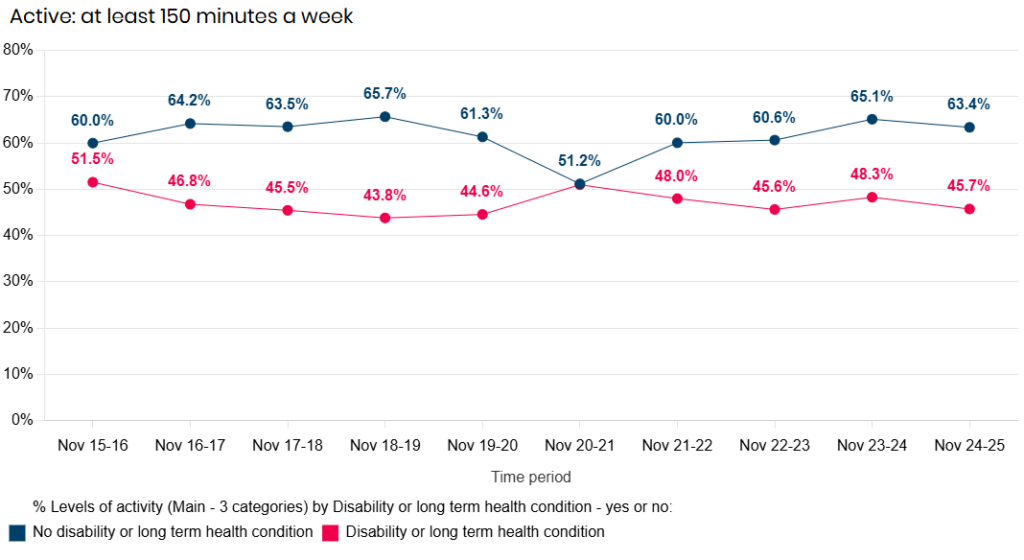
Physical Disabilities
Unsurprisingly, people who do not have any physical disabilities are more likely to to physically active. Age will be a confounder in that older people are more likely to have disabilities and also less likely to be physically active.
Physically Active
With the exception of 2020/21 during the pandemic, the trends over time are relatively consistent with between 60% and 66% of people without disabilities or long-term health conditions being physically active compared to between 44% and 51% among people with disabilities or long-term health conditions.
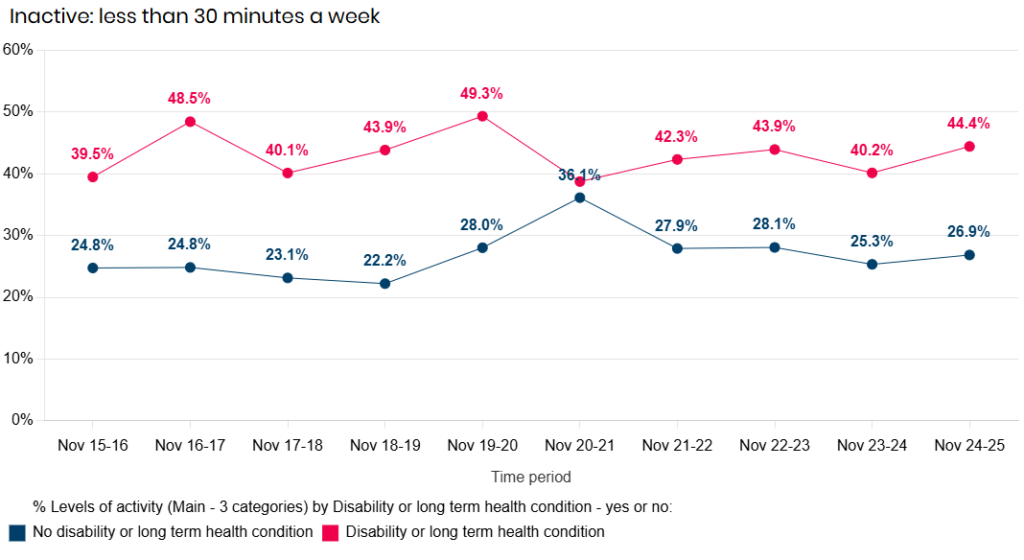
Physically Inactive
There is year-on-year variability in the percentage of people without disabilities or long-term health conditions being physically inactive with the percentage being just under 45% for most years. Among people with disabilities or long-term health conditions, the percentage who are physically inactive was around 22-24% between 2015/16 and 2018/19 but increased to around 28% between 2019/20 and 2022/23 (although was slightly higher than this during the pandemic), before falling slightly in 2023/24 and 2024/25. So there appears to have been an increase in the percentage of people who are physically inactive among those who have disabilities and long-term health conditions.
Local Physical Activity Scorecard
A summary of physical activity has been produced locally which summarises some of the information from the local Health and Wellbeing Surveys, the Active Lives Survey, information from Fingertips as well as information on the frequency of walking and cycling including active travel. The scorecard summarises information for both adults and children and is available below.
Impact of COVID-19 on Physical Activity
The COVID-19 pandemic had a significant impact on physical activity levels both nationally and in Hull with reduced levels of physical activity as well as a change in the types of physical activity.
Across England as illustrated by data from the Active Lives Survey, there has been a substantial reduction in the number of minutes of physical activity undertaken in traditional sports and fitness activities (like the gym), and an increase in walking and gardening, and an increase in cycling among women. The size of the pie chart below is proportionate to the percentage of people undertaking physical activity, and it can be seen that the number of people undertaking physical activity in 2020 compared to 2016-19 has reduced at a national level. The pattern of activities may be slightly different in Hull to those observed nationally, but it is likely that there has also been a change in the types of activities undertaken in Hull as well.
Understanding Sports and Leisure in Hull
The Local Government Association have a report which examines sport and leisure in Hull in relation to comparable geographical areas. It includes information on physical activity levels of adults and children from the Active Lives Survey, information on the frequency of walking and cycling as well as information on the number of sports and leisure facilities within Hull, and information on volunteering to support sports and physical activity events as well as numbers attending live sporting events.
Understanding Sports and Leisure in Hull
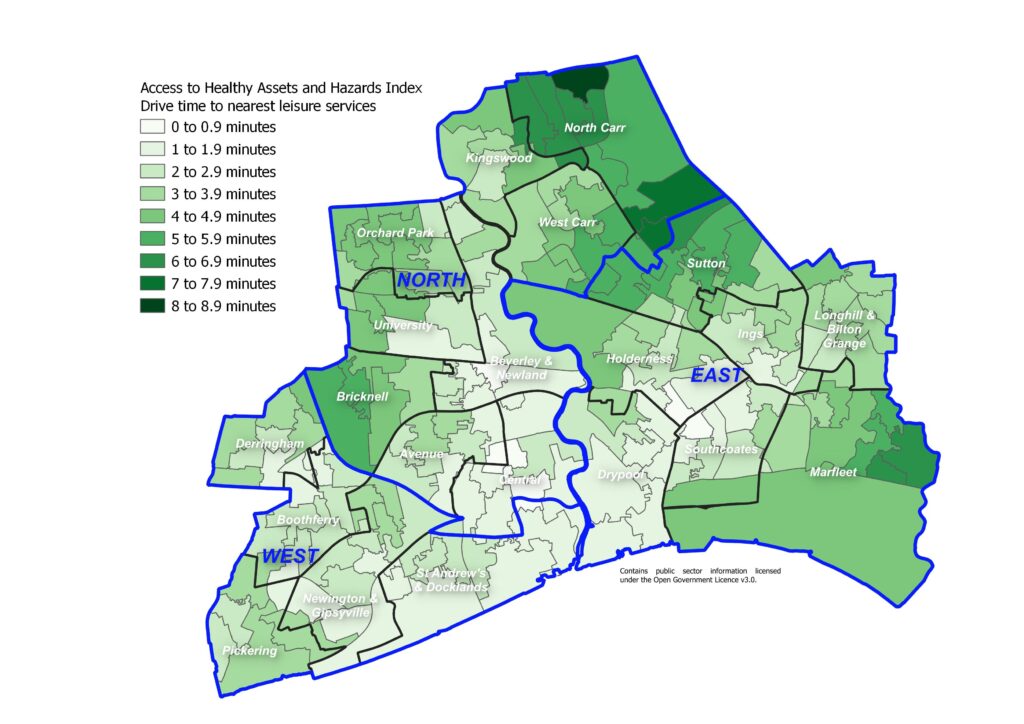
Access to Healthy Assets and Hazards Index
The Access to Healthy Assets and Hazards which includes drive times to nearest leisure centre was updated in 2024.
The Access to Healthy Assets and Hazards (AHAH) index is designed to allow policy and decision makers to understand which areas have poor environments for health, and to help move away from treating features of the environment in isolation.
The Access to Healthy Assets and Hazards index is comprised of four domains: access to retail services (fast food outlets, gambling outlets, pubs/bars/nightclubs, off licences, tobacconists), access to health services (GP surgeries, A&E hospitals, pharmacies, dentists and leisure centres), the physical environment (green and blue spaces) and levels of air pollution (nitrogen dioxide (NO2), particulate matter smaller than 10 microns (PM10) and sulphur dioxide (SO2)).
In 2024, the Access to Healthy Assets and Hazards Index is very high in Hull with 44.7% of Hull’s population residing in the bottom fifth of areas nationally in relation to the Access to Healthy Assets and Hazards Index. The percentage nationally is 20.9% and across the other 14 lower tier local authorities in the region the range is from 1.3% to 32.6%.
Compared with benchmark
| Indicator | Period | England | Yorkshire and the Humber region (statistical) | Kingston upon Hull | East Riding of Yorkshire | North East Lincolnshire | North Lincolnshire | York | North Yorkshire UA | Barnsley | Doncaster | Rotherham | Sheffield | Bradford | Calderdale | Kirklees | Leeds | Wakefield |
|---|---|---|---|---|---|---|---|---|---|---|---|---|---|---|---|---|---|---|
Access to Healthy Assets & Hazards Index (Persons All ages) | 2024 | 20.9 | 18.2 | 44.7 | 9.4 | 23.6 | 10.7 | 1.3 | 13.4 | 10.2 | 6.2 | 9.7 | 13.7 | 32.6 | 5.1 | 13.1 | 30.3 | 18.8 |
Despite the very high levels in Hull, the index has decreased considerably since 2016 when nine in ten residents lived in the worst fifth of areas of England in relation to the index, although there was a large decrease between 2016 and 2017 to 46% with only relatively minor changes to 2022 and 2023.
In 2024, it is estimated that 120,220 residents in Hull live within areas defined as the bottom fifth of areas nationally based on the Access to Healthy Assets and Hazards Index.
Compared with benchmark
Access to Healthy Assets & Hazards Index (Persons All ages)
|
Period
|
Kingston upon Hull |
Yorkshire and the Humber region (statistical)
|
England
|
||||
|---|---|---|---|---|---|---|---|
|
Count
|
Value
|
95%
Lower CI |
95%
Upper CI |
||||
| 2016 | • | 233157 | 90.0% | - | - | 22.2% | 21.2% |
| 2017 | • | 120814 | 46.3% | - | - | 14.1% | 21.1% |
| 2022 | • | 114694 | 44.3% | - | - | 19.9% | 22.6% |
| 2024 | • | 120220 | 44.7% | - | - | 18.2% | 20.9% |
Source: Consumer Data Research Centre
Information relating to version 4 of the Access to Healthy Assets and Hazards index is available at lower layer super output area geographical level. There are 33,755 lower layer super output areas in England, and the percentile score has been calculated for each of the 168 lower layer super output areas in Hull. The index was updated in July 2024, and information on the individual components is available.
The majority of residents living around the city centre, to the south west of the city, and around the University are only a few minutes drive from the nearest leisure centre. Residents living on the north, north west and east boundaries of Hull have a slightly longer drive time, although all residents are within a nine minute drive of the nearest leisure centre.
Information on the other indicators is available under Geographical Area under Place.
Strategic Need and Service Provision
Public Health England’s (now Office for Health Improvement & Disparities) national physical activity framework ‘Everybody Active, Every Day’ identifies four areas of local and national action: (i) Active Society – change the social norm to make physical activity the expectation; (ii) Moving Professionals – develop expertise and leadership within professionals and volunteers; (iii) Active Environments – create environments to support active lives; and (iv) Healthy at Work – identify and upscale successful programs nationwide.
As mentioned above, there are physical activity guidelines in place, and the more time spent being physically active the greater the health benefits. The gains are the highest among those currently doing the lowest levels of activity as the improvements in health per additional minute of physical activity will be proportionately greater.
In order to help people to fulfil the physical activity guidelines and increase their physical activity, it is necessary to work together to create an environment that promotes physical activity and active transport in everyday settings for all ages, and ensure people understand the benefit of positive life choices and know how to access information and seek early support to change.
Hull’s Towards an Active Hull Partnership has developed a 10 year physical activity strategy: ‘Towards an Active Hull’ with the overarching aim to move 10,000 inactive adults to be active to bring Hull in line to national levels of activity, reduce levels of inactive children and lessen inequalities. The four strategic pillars for action identified in the strategy are: Active Design / Active Recreation / Sports & Volunteering / Active Travel. There is also an emphasis on social marketing to encourage people to ‘just make small steps to make big changes’.
Resources
Chief Medical Officers guidelines for physical activity: https://assets.publishing.service.gov.uk/government/uploads/system/uploads/attachment_data/file/832868/uk-chief-medical-officers-physical-activity-guidelines.pdf
Local Health and Wellbeing Surveys
Office for Health Improvement & Disparities, 2014. Everybody active, every day: framework for physical activity: https://www.gov.uk/government/publications/everybody-active-every-day-a-framework-to-embed-physical-activity-into-daily-life
Office for Health Improvement & Disparities, 2021. Everybody active, every day: 5 years on. https://www.gov.uk/government/publications/everybody-active-every-day-5-years-on/everybody-active-every-day-5-years-on
Hull’s Towards an Active Hull: https://www.hcandl.co.uk/sites/hcandl/files/media/Towards%20An%20Active%20Hull.pdf
Get Hull Active: www.gethullactive.co.uk
Sport England. Active Lives Adult Survey: Query Builder. https://activelives.sportengland.org/AdultQuery/QueryBuilder
Updates
This page was last updated / checked on 3 June 2026.
This page is due to be updated / checked in March 2027.