Index
This topic area covers statistics and information relating to levels of deprivation and poverty in Hull including local strategic need and service provision. Levels of inequality in Hull are high in Hull predominantly due to deprivation and poverty, and as a result as much information as possible is presented for different groups of individuals based on deprivation levels based on where a person lives. So information on deprivation can be found on most of the topic web pages. Further information relating to children eligible for free school meals can be found under Schools, Education and Qualifications and information relating to food insecurity (concerns over being able to provide food for the family) can be found under Financial Resilience both under Health and Wellbeing Influences. Further information relating to unemployment and benefit claimants can be found within Employment, Economy and Healthy Workplaces under Health and Wellbeing Influences. Further information relating to the increases in the rental properties and mortgage and landlord repossessions can be found within Housing and Households under Health and Wellbeing Influences. A needs assessment was completed in Hull during 2023 for people with multiple unmet needs. The report – which was finalised in 2024 – is available within Multiple Unmet Needs under Vulnerable Groups.
This page contains information from the Office for Health Improvement & Disparities’ Fingertips. Information is taken ‘live’ from the site so uses the latest available data from Fingertips and displays it on this page. As a result, some comments on this page may relate to an earlier period of time until this page is next updated (see review dates at the end of this page).
The new Index of Multiple Deprivation 2025 was released on the 30 October 2025, and other pages throughout the JSNA will be updated to reflect this update in the course of the next few months.
Summary Infographic
Headlines
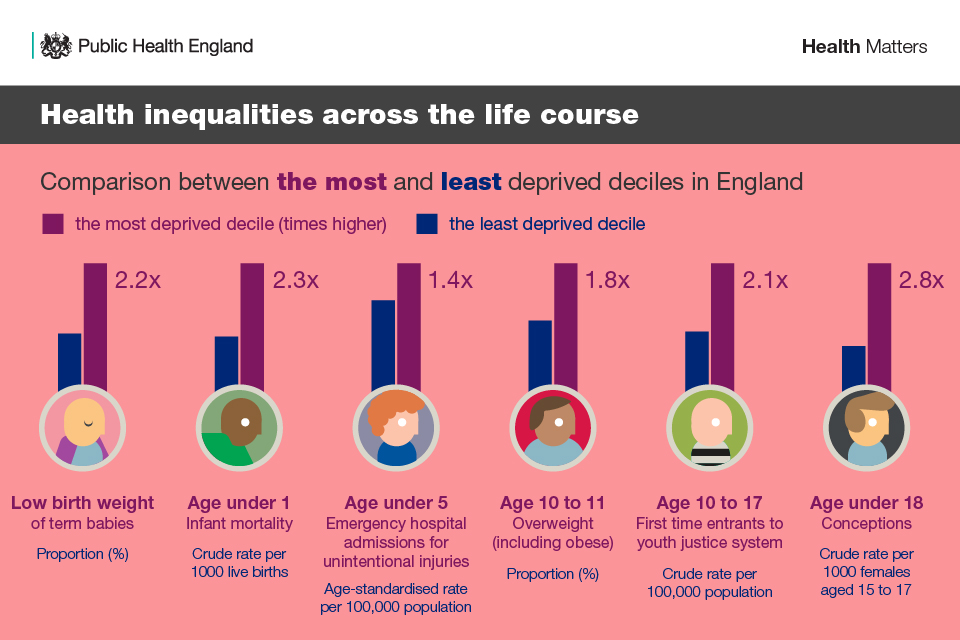
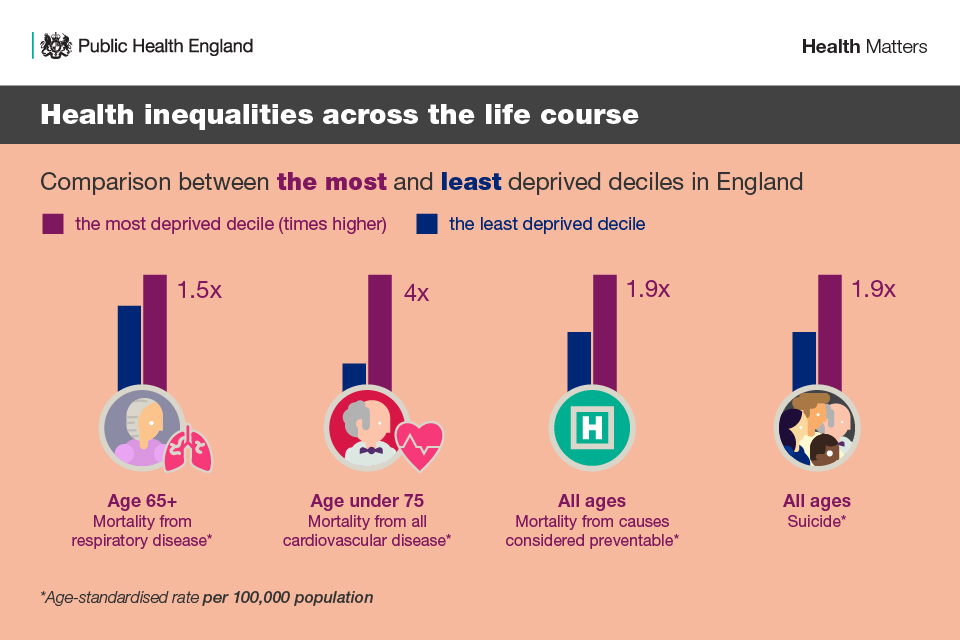
- Poverty and deprivation have a strong influence on physical health and mental wellbeing, as well as affecting other factors which influence health and wellbeing such as employment, education and housing.
- People living in more deprived areas are likely to have poorer access to healthcare and other services. The circumstances people live in can make it harder to live healthily, and psychosocial stress leads to physical harm. The prevalence of smoking, poor diet, physical inactivity, stress, etc tend to be higher for people living in more deprived areas. Barriers to health improvement may include financial barriers, transport issues, access to good quality fresh fruit and vegetables, safe parks, as well as other difficulties like getting time off work for GP appointments.
- The Index of Multiple Deprivation is generally used to defined levels of deprivation. A score has been determined nationally from specific indicators which has been applied to 168 geographical areas within Hull. It means it does not represent individuals exact circumstances only an average of people who live in that area and there will be some better off than average and some worse off than average who live within that area.
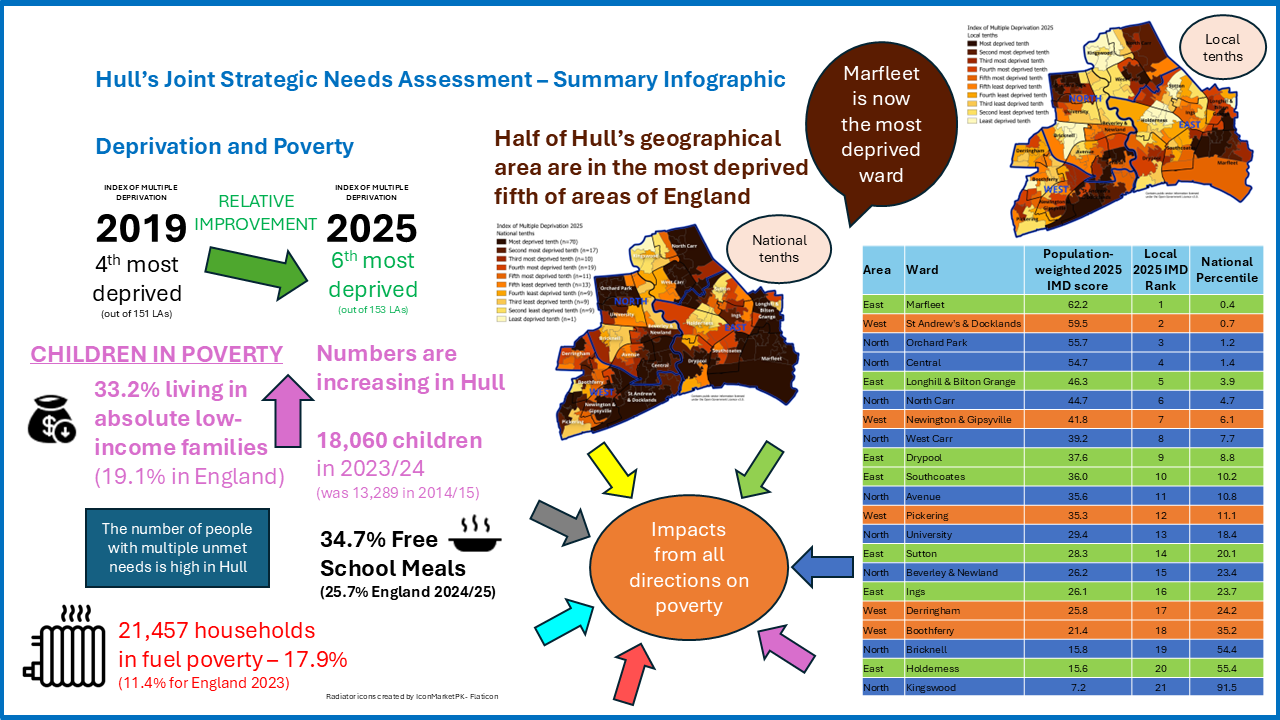
- Based on the Index of Multiple Deprivation 2025, Hull is the sixth most deprived upper-tier local authority in England (out of 153). Just over half (52%) of Hull’s geographical areas remain in the most deprived fifth nationally, although there are now more areas in the least deprived fifth of areas of England (6.0%). Hull was the fourth most deprived upper-tier local authority in England (out of 151) based on the previous Index of Multiple Deprivation published in 2019 and had 54% of geographical areas in the most deprived fifth of areas nationally and only 2.4% in the least deprived fifth of areas of England. This does mean that deprivation levels have improved very slightly in Hull relative to other places. However, it is not possible to determine if this is due to an improvement or due to a deterioration and other places have had more deterioration.
- The percentage of children (under 16s) living in poverty in Hull is also high. For 2023/24, it is estimated that 18,060 children representing 33.21% of all under 16s live in absolute low income families in Hull, and that 20,791 children in Hull representing 38.2% of all under 16s in Hull live in relatively low income families (much higher than England at 19.1% and 38.2% respectively). The percentages have increased in the last 2-3 years (both have increased by around six percentage points in the last two years). The increase in Hull has been greater than England so the inequalities gap has increased.
- For the 2024/25 school year, over one-third of school children in Hull are eligible for free school meals (34.7%) compared to over one-quarter of children in England (25.7%). Around 43,306 pupils attended Hull schools in 2023/24, and 14,594 of them are eligible for free school meals.
- In 2023, it was estimated that 17.9% of households were in fuel poverty in Hull compared to 11.4% for England. This equated to 21,457 households in Hull.
- Unemployment, financial insecurity, and poverty including food poverty have all increased in Hull since 2020 due the COVID-19 lockdown and resulting economic impact. This effect is likely to have a considerable cumulative impact for a considerable length of time. However, this has been compounded by dramatic increases in the prices of gas and electricity, and food, and the resulting high levels of inflation in late 2021 and in 2022. The Bank of England’s base interest rate has increased between December 2021 and August 2023 to reach a high of 5.25% not seen since January 2008. The rate started to decreased in August 2024 and currently is 4% (as at December 2025). This has meant substantially higher monthly mortgage payments for those not on fixed interest rate deals. Increases in costs including a potential increased mortgage cost has affected landlords, and rents have increased significantly in the last 2-3 years. These continued high costs will further exacerbate financial vulnerability and poverty, and increase the inequalities gap further for Hull residents.
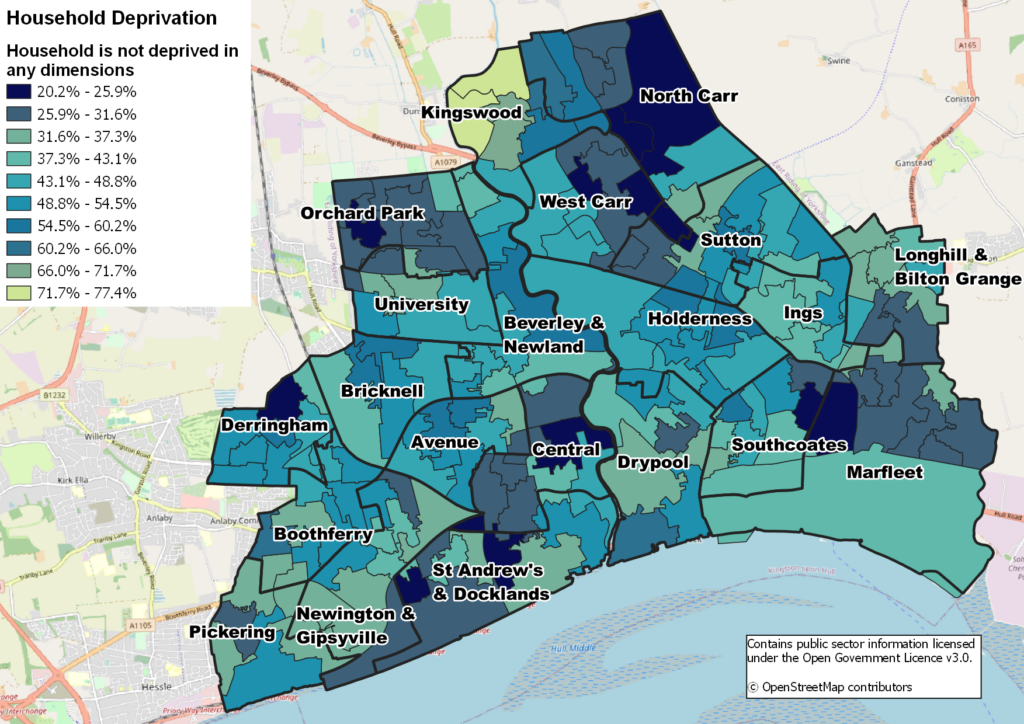
- The 2021 Census asked a number of questions which helped identify dimensions of deprivation which allow us to classify households based on education, employment, health and housing characteristics. By this measure, Hull would have the 14th worst levels of deprivation in England, with 58.8% of households being deprived in one or more of the four dimensions. In all four dimensions Hull has worse levels of deprivation than both the regional and national averages.
The Population Affected – Why Is It Important?
Poverty is not having enough money to get by on whereas deprivation refers to a more general lack of resources and opportunities. Unemployment, poor housing, lack of qualifications, debt, low income, fuel poverty, crime and many other social and environmental factors all indirectly affect the health and wellbeing of the population. Increased deprivation means that there is poorer health, but this is compounded as poor health also affects other measures such as employment and ability to improve employment, education and the person’s environment such as housing. People who live in less affluent areas are likely to have poorer access to healthcare and other services. Delays in diagnosis and treatment of medical conditions and diseases could influence survival. The circumstance people live in can make it harder to live healthily, and psychosocial stress leads to physical harm. The prevalence of smoking, poor diet, physical inactivity, stress, etc tend to be higher for people living in more deprived areas. People living in more affluent areas tend to be among the first to initiate positive health changes whereas it is more difficult to initiate positive changes with increased poverty and life pressures. For people living in more deprived areas, there are likely to be increased barriers in relation to access to health improvement and health services such as financial barriers, transport issues, access to local cheap good quality fresh fruit and vegetables, safe access to parks, flexible working arrangements to take time off work for GP and hospital appointments, etc.
Fuel poverty can also impact health. A household is considered to be fuel poor if they have required fuel costs that are above average (the national median level) and, were they to spend that amount, they would be left with a residual income below the official poverty line. Fuel poverty is distinct from general poverty: not all poor households are fuel poor, and some households would not normally be considered poor but could be pushed into fuel poverty if they have high energy costs. There is compelling evidence that the drivers of fuel poverty (low income, poor energy efficiency, and energy prices) are strongly linked to cold homes.
Evidence shows that living in cold homes is associated with poor health outcomes and an increased risk of morbidity and mortality for all age groups; furthermore, studies have shown that more than one in five (21.5%) excess winter deaths in England and Wales are attributable to the coldest quarter of housing.
The Hull Picture
Hull has high levels of both poverty and deprivation. In general, in relation to national averages, Hull has a higher unemployment rate, more poor housing, residents qualified to a lower level and higher levels of crime.
It is difficult to measure poverty and deprivation, and there are various ways poverty and deprivation can be examined in a population. At an individual level, people’s socio-economic group can be examined, but this is not available without detailed employment information. Households and families claiming benefits can be examined, but it is difficult to assess income and expenditure at an individual level. At a population level, there can be numerous ways to measure deprivation depending on what factors different people feel are important in terms of measuring and defining deprivation.
One way to examine the overall levels of deprivation at a geographical level is by using the Index of Multiple Deprivation (IMD), although this relates to the average levels of deprivation for residents living in that geographical areas, and there can be considerable variability within that area. Some people who live in the area will be better off than that average or typical level of deprivation score derived for that area whereas other people who live in that area will be worse off. As it is a measure that is produced nationally, it does mean that Hull’s relative position in terms of deprivation can be examined in relation to other places in England
There have been changes in the composition of the Index of Multiple Deprivation between 2019 and 2025 although the fundamental principals behind the index remain unchanged. There are some new indicators, some indicators that have been removed and changes to other indicators. There have also been slight changes to the methodology to improve the reduce uncertainty around estimates for small geographical areas. Comparisons have been made in relation to the IMD 2025 compared to the IMD 2019, although the scores are not directly comparable over time (even without the changes). There were 39 indicators included in the IMD 2019 but this has increased to 54 for the IMD 2025.
There have been consistently seven domains which make up the IMD with each domain given a different weighting based on its importance in determining the overall IMD score (different weightings for each domain given in brackets):
- income (22.5%);
- employment (22.5%);
- health deprivation and disability (13.5%);
- education, skills and training (13.5%);
- crime (9.3%);
- barriers to housing and services (9.3%); and
- living environment (9.3%).
A list of the 39 indicators that make up the IMD 2019 is given within the Glossary under Tools and Resources. A Briefing Paper provides more information on the IMD 2025 contains the list of the 54 indicators which make up the IMD 2025 (this is due to be added soon to this page).
The Index of Multiple Deprivation 2025
Nationally an Index of Multiple Deprivation (IMD) score has been calculated for each of the 33,755 lower layer super output areas (LSOAs) in England which is a geographical area of around 1,500 residents. The LSOAs are geographical areas which were derived to present information from the Census 2001. Due to changes in the population, there have been changes to the boundaries and number of LSOAs made in 2011 and 2021. There are currently 168 LSOAs in Hull based on the 2021 Census.
Out of the upper-tier local authorities, Hull is ranked as sixth most deprived (out of 153) for the Index of Multiple Deprivation 2025 having been ranked as the fourth most deprived (out of 151) based on the Index of Multiple Deprivation 2019. Blackpool, Middlesbrough, Manchester, Birmingham and Hartlepool are the five upper-tier local authorities that are more deprived compared to Hull based on the Index of Multiple Deprivation 2025.
Overall, 70 (41.7%) of Hull’s LSOAs are in the most deprived tenth of areas of England with a further 17 (10.1%) in the second most deprived tenth of areas. There is a single LSOA in the least deprived tenth of areas of England.
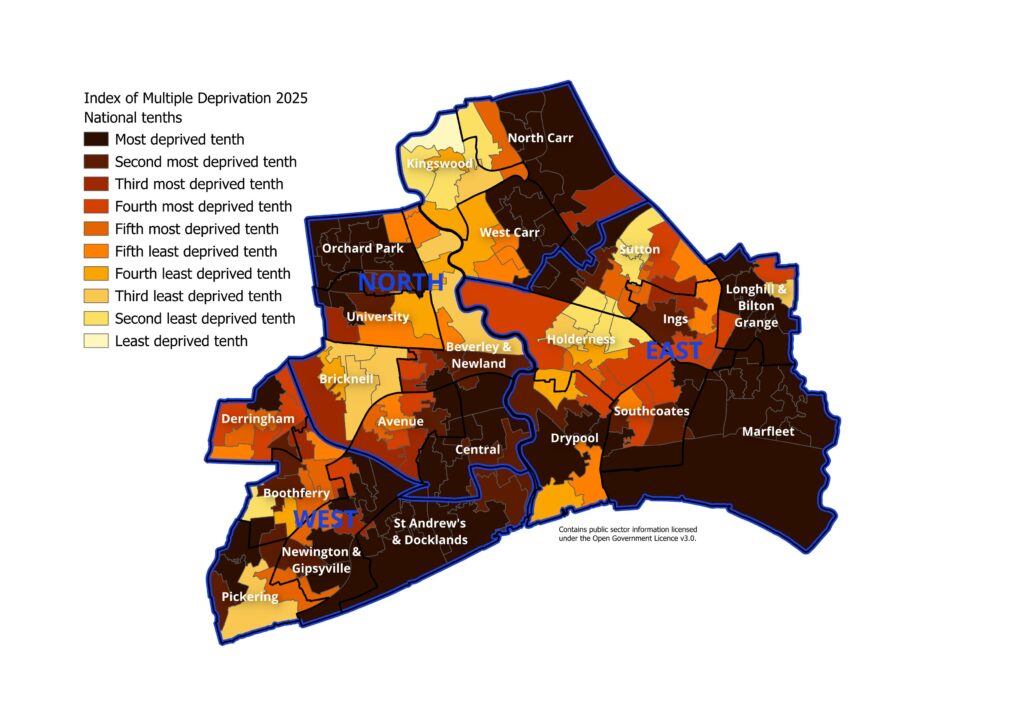
Thus just over half (51.8%) of all LSOAs are within the most deprived fifth of areas of England.
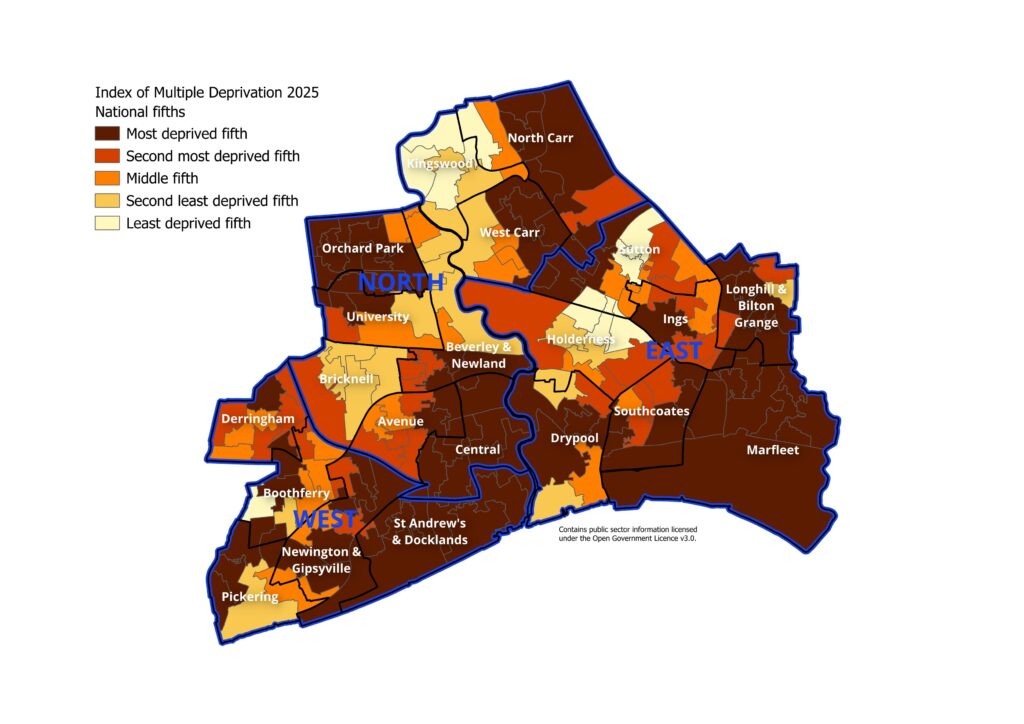
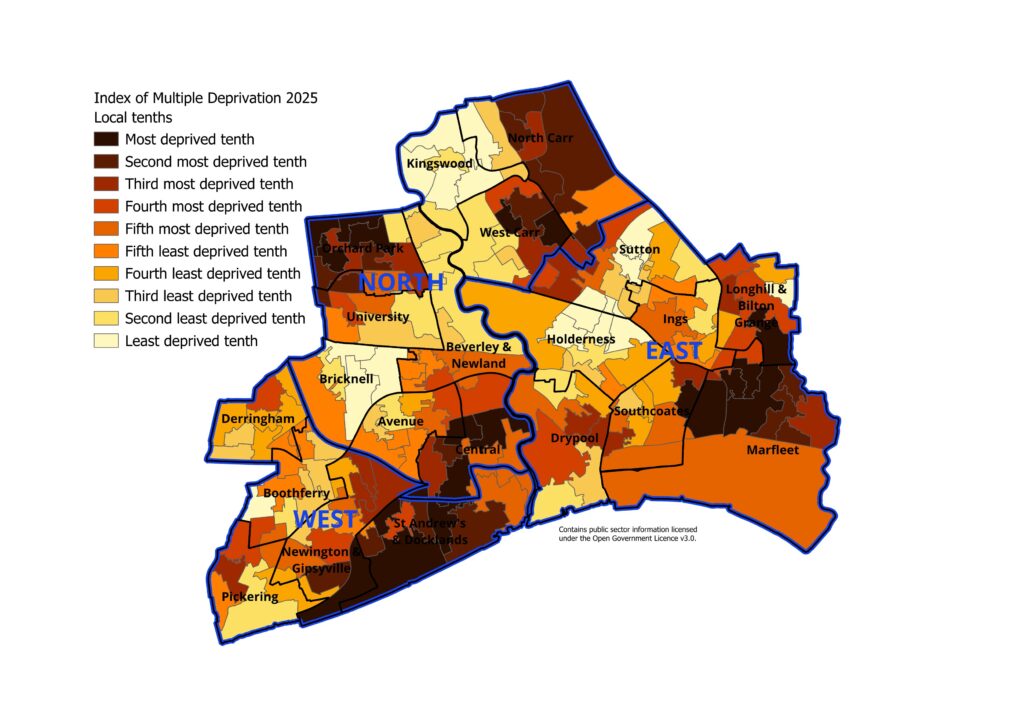
Examining the national tenths does not discriminate in deprivation levels within Hull, but if Hull’s 168 LSOAs are divided into approximately equal groups with 16 or 17 LSOAs in each group, then the most deprived areas within Hull can be seen more easily.
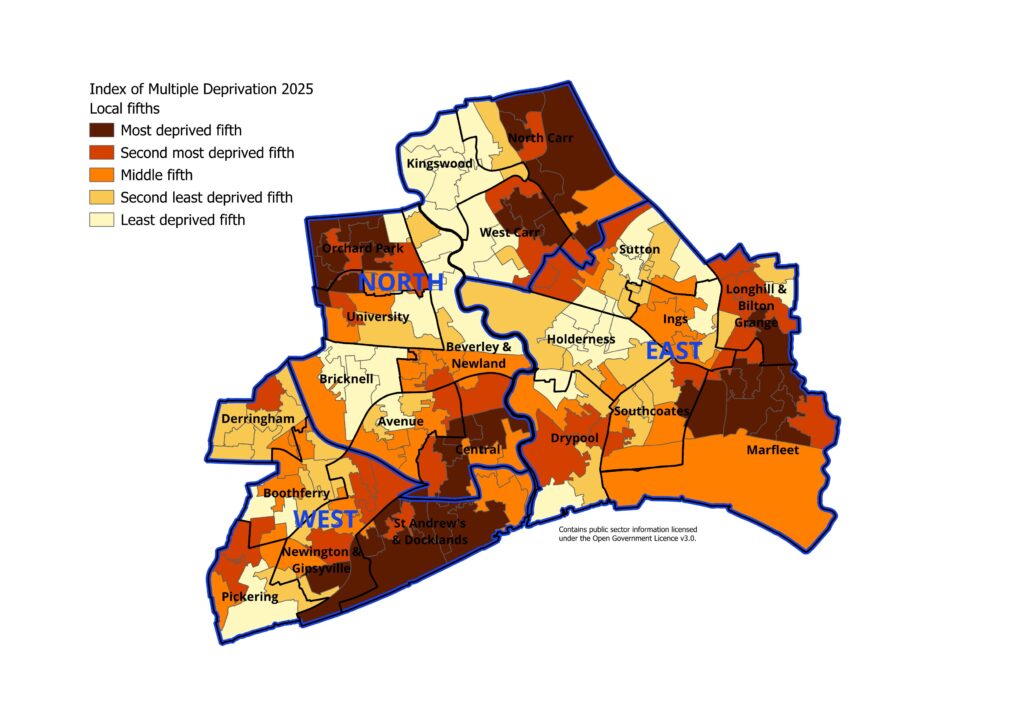
Differences by deprivation within this Joint Strategic Needs Assessment are often examined in relation to five local deprivation groups, and the following map illustrates the local deprivation fifths across Hull.
The population-weighted average IMD 2025 scores have been calculated for all the wards in England have been produced from which the percentile can be ascertained for Hull’s 21 wards. The mid-year 2022 population estimates have been used as they are included within the IMD original data files and have been used in their analyses. The boundaries for lower layer super output areas (LSOA) on which the IMD is based on wards are not coterminous, but the Office for National Statistics on their Open Geography have produced a ‘best fit’ table which assigns a ward to each LSOA.
Nationally the average IMD scores for the wards range from 1.3 for Wilmslow East ward in Cheshire East to 86.3 for Broomfield ward in Blackpool.
Marfleet ward is the most deprived ward in Hull followed by St Andrew’s & Docklands, Orchard Park, Central, and Longhill & Bilton Grange wards. At the other end of the scale, Kingswood is the least deprived ward, followed by Holderness, Bricknell, Boothferry and Derringham wards.
Marfleet and St Andrew’s & Docklands are among the most 1% of wards in England, and these two wards with Orchard Park, Central, Longhill & Bilton Grange and North Carr are among the most deprived 5% of wards in England. Nine of Hull’s wards fall within the most deprived 10% of wards in England, and 17 of Hull’s 21 wards are in the bottom quarter of the most deprived wards of England. All wards except Kingswood are in the most deprived 60% of wards in England, and Kingswood falls within the least deprived 10% of wards in England.
| Area Committee Area | Ward | IMD 2025 score | Hull ward rank | National rank (out of 6,793) | National percentile |
| East | Marfleet | 62.2 | 1 | 29 | 0.4 |
| West | St Andrew’s & Docklands | 59.5 | 2 | 51 | 0.8 |
| North | Orchard Park | 55.7 | 3 | 84 | 1.2 |
| North | Central | 54.7 | 4 | 99 | 1.5 |
| East | Longhill & Bilton Grange | 46.3 | 5 | 268 | 3.9 |
| North | North Carr | 44.7 | 6 | 321 | 4.7 |
| West | Newington & Gipsyville | 41.8 | 7 | 417 | 6.1 |
| North | West Carr | 39.2 | 8 | 524 | 7.7 |
| East | Drypool | 37.6 | 9 | 595 | 8.8 |
| East | Southcoates | 36.0 | 10 | 696 | 10.2 |
| North | Avenue | 35.6 | 11 | 734 | 10.8 |
| West | Pickering | 35.3 | 12 | 754 | 11.1 |
| North | University | 29.4 | 13 | 1,248 | 18.4 |
| East | Sutton | 28.3 | 14 | 1,363 | 20.1 |
| North | Beverley & Newland | 26.2 | 15 | 1,592 | 23.4 |
| East | Ings | 26.1 | 16 | 1,609 | 23.7 |
| West | Derringham | 25.8 | 17 | 1,646 | 24.2 |
| West | Boothferry | 21.4 | 18 | 2,389 | 35.2 |
| North | Bricknell | 15.8 | 19 | 3,696 | 54.4 |
| East | Holderness | 15.6 | 20 | 3,765 | 55.4 |
| North | Kingswood | 7.2 | 21 | 6,218 | 91.5 |
A briefing paper has been produced which gives further information on the levels of deprivation in Hull based on the Index of Multiple Deprivation 2025 and its seven domains. It includes information on the changes within Hull over time comparing the IMD 2019 with the IMD 2025. Further details relating to the Index of Multiple Deprivation can also be found in the Glossary.
Index of Multiple Deprivation 2025 Briefing Paper
Index of Multiple Deprivation 2025 Across the Humber
Active Humber and Press Red have produced this resource to better understand the deprivation across the Humber to better understand physical inactivity. Active Humber is the Active Partnership for the Humber and Press Red are their insight and learning consultants. They have given us permission to post their report on our JSNA.
Income Deprivation Affecting Children Index 2025
As well as the IMD 2025, an index was derived in 2025 which measured the proportion of children aged 0-15 years in income deprived families. It is a subset of the income deprivation domain and measures the proportion of the population in an area experiencing deprivation relating to low income.
Income Deprivation Affecting Older People Index 2025
As well as the IMD 2025, an index was derived in 2025 which measured the proportion of people aged 60+ years who experience income deprivation. It is a subset of the income deprivation domain and measures the proportion of the population in an area experiencing deprivation relating to low income.
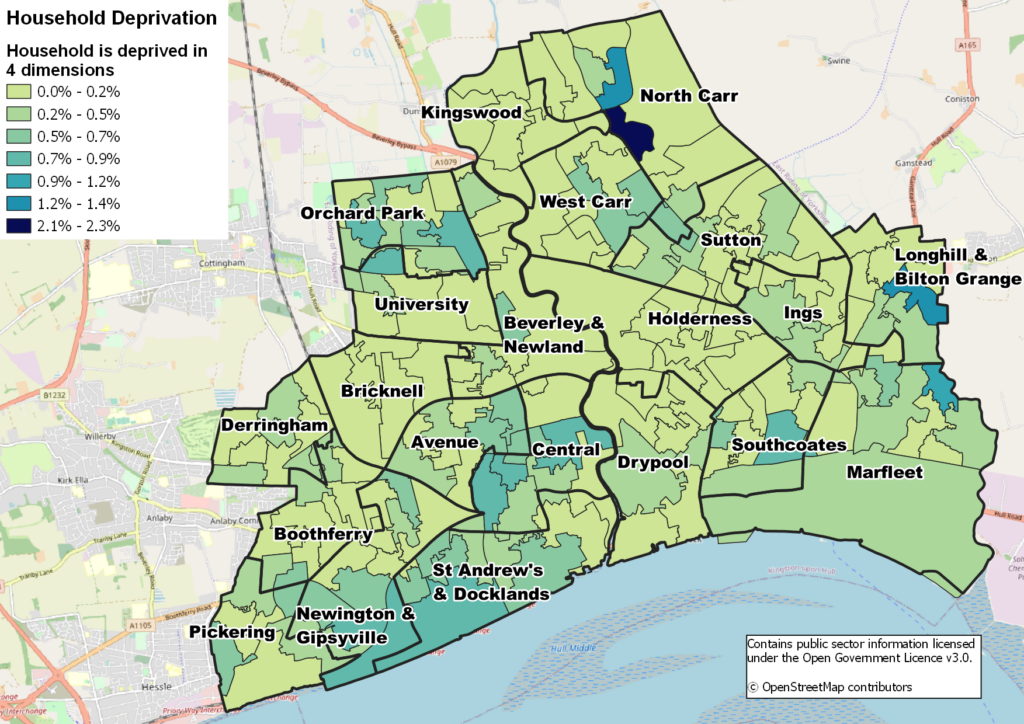
Dimensions of Deprivation from the 2021 Census
The 2021 Census asked a number of questions which helped identify dimensions of deprivation which allow us to classify households based on four selected household characteristics. These four characteristics are:
- Education – A household is classified as deprived in the education dimension if no one has at least level 2 education and no one aged 16 to 18 years is a full-time student;
- Employment – A household is classified as deprived in the employment dimension if any member, not a full-time student, is either unemployed or disabled;
- Health – A household is classified as deprived in the health dimension if any person in the household has general health that is bad or very bad or is identified as disabled; and
- Housing – A household is classified as deprived in the housing dimension if the household’s accommodation is either overcrowded, in a shared dwelling, or has no central heating.
| Household deprivation | Hull N | Hull % | Y&H % | England % |
| Household is not deprived in any dimension | 47,556 | 41.2 | 46.8 | 48.4 |
| Household is deprived in one dimension | 39,375 | 34.1 | 33.7 | 33.5 |
| Household is deprived in two dimensions | 21,788 | 18.9 | 15.1 | 14.2 |
| Household is deprived in three dimensions | 6,452 | 5.6 | 4.1 | 3.7 |
| Household is deprived in all four dimensions | 301 | 0.3 | 0.2 | 0.2 |
By this measure, Hull would have the 14th worst levels of deprivation in England, with 58.8% of households being deprived in one or more of the four dimensions (the worst upper tier local authority being Barking and Dagenham with 62.4% and the best being Wokingham with 38.5%). Deprivation in one dimension would see Hull in 50th place (34.1%), in two dimensions 7th place (18.9%), three dimensions 19th place (5.6%) and in four dimensions 63rd place (0.3%). In all dimensions Hull is worse than both the regional and national averages.
The data is available at lower layer super output area (geographical level) which allows us to map the dimensions across the city.
Further information in relation to housing characteristics such as tenure which relate to poverty and deprivation can be found under Housing under Health and Wellbeing Influences.
Multiple Unmet Need
From the Hard Edges report, Hull is ranked as having high levels of multiple unmet need being the sixth highest for ‘severe and multiple disadvantage’ of upper tier or ‘social services’ local authorities. Their report explored the problems faced by adults involved in the homelessness, substance use and criminal justice systems. Mental ill-health was a common complicating factor and poverty was an almost universal complicating factor.
The table below gives the ratio of the prevalence for housing, offenders, and drugs and alcohol for 2010/11 as well as a combined measure for these indicators. Each local authority is compared to England for 2010/11 which has a fixed value of 100, and the local authorities which have the highest levels of multiple unmet need have between two and three times the average levels of multiple unmet need.
The information is based on summarising information from a number of datasets which record activity in relation to:
- Housing – Supporting People (client record and outcomes for short-term services) – a housing-related support services dataset that includes most publicly-funded single homelessness services and covers most upper-tier (social services) local authorities in England.
- Offenders – Offender Assessment System – this dataset covers a substantial part of the prison population and also those undertaking community service punishments.
- NDTMS – National Drug Treatment Monitoring System – a national dataset that monitors client journeys through substance misuse services, a subject of this dataset covers alcohol services.
Hull has 2.2 times the number of people with multiple unmet need compared to average for England. The numbers in Hull are slightly higher than this for housing, but slightly lower for offenders. Neighbouring East Riding of Yorkshire is joint fifth in terms of the ranking as a local authority with the lowest levels of multiple unmet need using this definition.
| Local Authority | Supporting People (Housing) | Offender Assessment System | NDTMS | Combined |
| Blackpool | 378 | 298 | 244 | 306 |
| Middlesbrough | 152 | 306 | 387 | 281 |
| Liverpool | 265 | 200 | 249 | 238 |
| Rochdale | 310 | 183 | 184 | 226 |
| Manchester | 245 | 212 | 217 | 225 |
| Hull | 251 | 191 | 232 | 224 |
| Bournemouth | 266 | 177 | 218 | 220 |
| Nottingham | 260 | 199 | 181 | 213 |
| Stoke-on-Trent | 193 | 215 | 224 | 210 |
| Newcastle | 271 | 186 | 167 | 208 |
| England | 100 | 100 | 100 | 100 |
| Newbury | 57 | 47 | 31 | 45 |
| Surrey | 38 | 46 | 49 | 45 |
| Richmond Upon Thames | 18 | 51 | 65 | 44 |
| Harrow | 19 | 46 | 59 | 41 |
| Buckinghamshire | 23 | 44 | 43 | 37 |
| East Riding of Yorkshire | 34 | 38 | 38 | 37 |
| Windsor and Maidenhead | 3 | 49 | 58 | 36 |
| South Gloucestershire | 25 | 38 | 44 | 36 |
| Central Bedfordshire | 20 | 36 | 28 | |
| Wokingham | 10 | 31 | 23 | 21 |
A needs assessment of Multiple Unmet Needs in Hull was completed in 2023 and published in early 2024. Modelling of information from the Hard Edges report has been used to produce estimates for Hull, although this predominantly relates to men when examining homelessness, involvement with the criminal justice system and substance use. A recent report published in July 2023 by Changing Lives & Agenda Alliance found that examining these three factors together with removal of children into care, mental health and domestic abuse changed the focus to women. These reports and local data are being used to estimate and model the numbers in Hull with multiple unmet need as part of the needs assessment. However, in practice, due to lack of information and datasets examining multiple needs, the some of the analysis was based on examining different factors separately, but the report included detailed information on multiple needs experienced by the subset of individuals currently in substance treatment services. Qualitative research involving interviews and focus groups with service providers and clients are also included within the local report. The needs assessment is a first step in examining multiple unmet needs in Hull, and has revealed a number of key areas for focus and gaps in provision or gaps in data and knowledge.
Child Poverty
The percentage of children (under 16s) living in absolute or relative low income families is given within The Office for Health Improvement & Disparities’ Fingertips.
A family must have claimed one or more of Universal Credit, Tax Credits or Housing Benefit at any point in the year to be classed as low income based on the definitions for absolute and relative low income.
Absolute low income is defined as a family in low income before housing costs in the reference year in comparison with incomes in 2010/11. Absolute low income takes the 60% of average (median) income threshold from 2010/11 and then fixes this in real terms (i.e. in line with inflation). This is designed to assess how low incomes are faring with reference to inflation. It measures the number and percentage of individuals who have incomes below this threshold. The percentage of individuals in absolute low income will decrease if individuals with lower incomes see their incomes rise by more than inflation.
Equivalised income is income before housing costs and includes contributions from earnings, state support and pensions. Equivalisation adjusts income for family size and composition, taking an adult couple with no children as the reference point. Relative low income is defined as a family in a low income before housing costs in the reference year. Relative low income sets a threshold as 60% of the UK average (median) income and moves each year as average income changes. It is used to measure the number and percentage of individuals who have income below this threshold. The percentage of individuals in relative low income will decrease if: (i) average (median) income stays the same or rises, and individuals with lower incomes see their incomes rise more than the average; or (ii) average (median) income fall, and individuals with lower incomes see their incomes fall less than average incomes.
In 2023/24, 33.2% of under 16s lived in absolute low income families and 38.2% of under 16s lived in relative low income families in Hull which was much higher than England (19.1% and 22.1% respectively).
Compared with benchmark
| Indicator | Period | England | Yorkshire and the Humber region (statistical) | Kingston upon Hull | East Riding of Yorkshire | North East Lincolnshire | North Lincolnshire | York | North Yorkshire UA | Barnsley | Doncaster | Rotherham | Sheffield | Bradford | Calderdale | Kirklees | Leeds | Wakefield |
|---|---|---|---|---|---|---|---|---|---|---|---|---|---|---|---|---|---|---|
Children in absolute low income families (under 16s) (Persons <16 yrs) | 2023/24 | 19.1 | 26.6 | 33.2 | 17.4 | 29.8 | 25.7 | 13.3 | 14.1 | 26.4 | 29.7 | 25.9 | 27.4 | 40.2 | 27.1 | 30.2 | 25.2 | 22.7 |
Children in relative low income families (under 16s) (Persons <16 yrs) | 2023/24 | 22.1 | 30.4 | 38.2 | 20.3 | 34.5 | 29.6 | 15.8 | 17.0 | 30.6 | 34.0 | 30.0 | 31.2 | 44.2 | 30.5 | 33.7 | 28.8 | 26.6 |
The percentage of children living in absolute low income families in Hull second highest across the region.
Compared with benchmark
Children in absolute low income families (under 16s) (Persons <16 yrs) 2023/24
| Area |
Recent
Trend |
Count
|
Value
|
95%
Lower CI |
95%
Upper CI |
|
|---|---|---|---|---|---|---|
| England | 2030841 | 19.1 | 19.0 | 19.1 | ||
| Yorkshire and the Humber region (statistical) | 275289 | 26.6 | 26.5 | 26.8 | ||
| Kingston upon Hull | 18060 | 33.2 | 32.6 | 33.7 | ||
| East Riding of Yorkshire | 9546 | 17.4 | 17.0 | 17.9 | ||
| North East Lincolnshire | 8801 | 29.8 | 29.1 | 30.6 | ||
| North Lincolnshire | 7807 | 25.7 | 25.1 | 26.5 | ||
| York | 4064 | 13.3 | 12.8 | 13.9 | ||
| North Yorkshire UA | 14177 | 14.1 | 13.8 | 14.5 | ||
| Barnsley | 12016 | 26.4 | 25.9 | 27.0 | ||
| Doncaster | 17569 | 29.7 | 29.2 | 30.3 | ||
| Rotherham | 13381 | 25.9 | 25.4 | 26.5 | ||
| Sheffield | 27869 | 27.4 | 27.0 | 27.8 | ||
| Bradford | 50293 | 40.2 | 39.8 | 40.6 | ||
| Calderdale | 10787 | 27.1 | 26.5 | 27.7 | ||
| Kirklees | 26394 | 30.2 | 29.7 | 30.6 | ||
| Leeds | 39169 | 25.2 | 24.9 | 25.5 | ||
| Wakefield | 15362 | 22.7 | 22.3 | 23.2 |
Source: OHID, based on Department for Work and Pensions and Office for National Statistics data
The percentage of children living in relative low income families in Hull second highest across the region.
Compared with benchmark
Children in relative low income families (under 16s) (Persons <16 yrs) 2023/24
| Area |
Recent
Trend |
Count
|
Value
|
95%
Lower CI |
95%
Upper CI |
|
|---|---|---|---|---|---|---|
| England | 2354691 | 22.1 | 22.1 | 22.1 | ||
| Yorkshire and the Humber region (statistical) | 313918 | 30.4 | 30.3 | 30.5 | ||
| Kingston upon Hull | 20791 | 38.2 | 37.6 | 38.8 | ||
| East Riding of Yorkshire | 11104 | 20.3 | 19.8 | 20.7 | ||
| North East Lincolnshire | 10181 | 34.5 | 33.7 | 35.3 | ||
| North Lincolnshire | 8986 | 29.6 | 28.9 | 30.4 | ||
| York | 4816 | 15.8 | 15.2 | 16.4 | ||
| North Yorkshire UA | 16992 | 17.0 | 16.6 | 17.3 | ||
| Barnsley | 13901 | 30.6 | 30.0 | 31.2 | ||
| Doncaster | 20097 | 34.0 | 33.5 | 34.6 | ||
| Rotherham | 15495 | 30.0 | 29.5 | 30.6 | ||
| Sheffield | 31783 | 31.2 | 30.8 | 31.6 | ||
| Bradford | 55331 | 44.2 | 43.8 | 44.6 | ||
| Calderdale | 12150 | 30.5 | 29.9 | 31.2 | ||
| Kirklees | 29477 | 33.7 | 33.2 | 34.1 | ||
| Leeds | 44849 | 28.8 | 28.5 | 29.2 | ||
| Wakefield | 17950 | 26.6 | 26.1 | 27.0 |
Source: OHID, based on Department for Work and Pensions and Office for National Statistics data
It was estimated in 2023/24 that 18,060 children aged under 16 years in Hull were living in absolute low income families.
The percentage in Hull has increased sharply in the last two years and at a faster rate compared to England, so the inequalities gap between Hull and England has increased.
Compared with benchmark
Children in absolute low income families (under 16s) (Persons <16 yrs)
|
Period
|
Kingston upon Hull |
Yorkshire and the Humber region (statistical)
|
England
|
||||
|---|---|---|---|---|---|---|---|
|
Count
|
Value
|
95%
Lower CI |
95%
Upper CI |
||||
| 2014/15 | • | 13289 | 26.5% | 25.9% | 27.0% | 20.5% | 15.0% |
| 2015/16 | • | 13400 | 26.3% | 25.8% | 26.9% | 20.4% | 14.9% |
| 2016/17 | • | 12547 | 24.2% | 23.6% | 24.7% | 19.1% | 13.8% |
| 2017/18 | • | 14792 | 28.1% | 27.6% | 28.7% | 22.2% | 16.0% |
| 2018/19 | • | 14549 | 27.4% | 26.9% | 28.0% | 21.9% | 15.6% |
| 2019/20 | • | 14920 | 27.8% | 27.3% | 28.4% | 22.4% | 16.1% |
| 2020/21 | • | 13947 | 26.1% | 25.6% | 26.6% | 20.9% | 15.2% |
| 2021/22 | • | 13936 | 26.3% | 25.8% | 26.9% | 21.2% | 14.9% |
| 2022/23 | • | 16386 | 30.6% | 30.1% | 31.2% | 24.5% | 17.4% |
| 2023/24 | • | 18060 | 33.2% | 32.6% | 33.7% | 26.6% | 19.1% |
Source: OHID, based on Department for Work and Pensions and Office for National Statistics data
In 2023/24, it is estimated that 20,791 children aged under 16 years in Hull lived in relative low income families.
The percentage in Hull has increased in the last two years and at a faster rate compared to England, so the inequalities gap between Hull and England has increased.
Compared with benchmark
Children in relative low income families (under 16s) (Persons <16 yrs)
|
Period
|
Kingston upon Hull |
Yorkshire and the Humber region (statistical)
|
England
|
||||
|---|---|---|---|---|---|---|---|
|
Count
|
Value
|
95%
Lower CI |
95%
Upper CI |
||||
| 2014/15 | • | 14393 | 28.7% | 28.1% | 29.2% | 22.0% | 16.1% |
| 2015/16 | • | 15863 | 31.2% | 30.6% | 31.8% | 23.7% | 17.2% |
| 2016/17 | • | 15923 | 30.7% | 30.1% | 31.2% | 23.7% | 17.1% |
| 2017/18 | • | 18396 | 35.0% | 34.4% | 35.5% | 26.9% | 19.4% |
| 2018/19 | • | 17074 | 32.2% | 31.6% | 32.7% | 25.3% | 18.2% |
| 2019/20 | • | 19690 | 36.7% | 36.2% | 37.3% | 29.1% | 21.1% |
| 2020/21 | • | 17098 | 32.0% | 31.4% | 32.6% | 25.4% | 18.6% |
| 2021/22 | • | 17828 | 33.7% | 33.1% | 34.3% | 26.9% | 19.3% |
| 2022/23 | • | 19930 | 37.3% | 36.7% | 37.8% | 29.4% | 21.3% |
| 2023/24 | • | 20791 | 38.2% | 37.6% | 38.8% | 30.4% | 22.1% |
Source: OHID, based on Department for Work and Pensions and Office for National Statistics data
Free School Meals and Food Insecurity
Children in state-funded schools in England are entitled to received free school meals if a parent or carer were in receipt of any of the following benefits:
- Income Support
- Income-based Jobseekers Allowance
- Income-related Employment and Support Allowance
- Support under Part VI of the Immigration and Asylum Act 1999
- the guarantee element of the State Pension Credit
- Child Tax Credit (provided they were not also entitled to Working Tax Credit and had an annual gross income of no more than £16,190, as assessed by Her Majesty’s Revenue and Customs)
- Working Tax Credit run-on – paid for four weeks after having stopped being qualified for Working Tax Credit
- Universal Credit – if applied on or after 1 April 2018 and the household income is less than £7,400 a year (after tax and not including any benefits)
Pupils in families with no recourse to public funds can also be eligible for free school meals. Since 1 April 2018, transitional protections have been in place which will continue during the roll out of Universal Credit. This has meant that pupils eligible for free school meals on or after 1 April 2018 retain their free school meal eligibility even if their circumstances change. Prior to the pandemic, this had been the main driver in the increase in the proportion of pupils eligible for free school meals as pupils continue to become eligible but fewer pupils stop being eligible. Any pupil gaining eligibility for free school meals after 1 April 2018 will be protected against losing free school meals until March 2025. After March 2025, any existing claimants that no longer meet the eligibility criteria will continue to receive free school meals until the end of their current phase of education (i.e. primary or secondary).
The percentage of school children eligible for free school meals is given on Fingertips and illustrates that over one-third of school children in Hull are eligible for free school meals in 2024/25 compared to just over one-quarter for England.
Compared with benchmark
| Indicator | Period | England | Yorkshire and the Humber region (statistical) | Kingston upon Hull | East Riding of Yorkshire | North East Lincolnshire | North Lincolnshire | York | North Yorkshire UA | Barnsley | Doncaster | Rotherham | Sheffield | Bradford | Calderdale | Kirklees | Leeds | Wakefield |
|---|---|---|---|---|---|---|---|---|---|---|---|---|---|---|---|---|---|---|
Children eligible for free school meals (Persons School age) | 2024/25 | 25.7 | 27.8 | 34.7 | 20.7 | 33.8 | 30.8 | 17.6 | 18.6 | 29.4 | 29.6 | 29.1 | 34.1 | 30.4 | 27.1 | 27.5 | 27.1 | 26.3 |
Between 2015/16 and 2018/19, the numbers of pupils eligible for free school meals remained relatively unchanged between 22.5% and 23.3%. However, the percentage increased during the 2019/20 school year due to the COVID-19 pandemic (with lockdowns commencing at the end of March 2020), and has continued to increase relatively sharply to reach a new high of 34.7% for 2024/25.
Automatic enrolment has commenced in Hull recently so it is likely that this figure will increase further as the auto-enrolment process has revealed children who should be eligible for free school meals but have not previously been receiving free school meals.
Around 43,020 pupils attended Hull schools in 2024/25, and 14,928 of them are eligible for free school meals.
The increase in eligibility has also increased across England and the region at a relatively similar rate to Hull.
Compared with benchmark
Children eligible for free school meals (Persons School age)
|
Period
|
Kingston upon Hull |
Yorkshire and the Humber region (statistical)
|
England
|
||||
|---|---|---|---|---|---|---|---|
|
Count
|
Value
|
95%
Lower CI |
95%
Upper CI |
||||
| 2014/15 | • | 9273 | 24.8% | 24.4% | 25.2% | 16.2% | 15.2% |
| 2015/16 | • | 8932 | 23.1% | 22.7% | 23.5% | 15.5% | 14.3% |
| 2016/17 | • | 9244 | 23.2% | 22.8% | 23.6% | 15.8% | 14.0% |
| 2017/18 | • | 9148 | 22.5% | 22.1% | 22.9% | 15.5% | 13.6% |
| 2018/19 | • | 9682 | 23.3% | 22.9% | 23.7% | 17.4% | 15.4% |
| 2019/20 | • | 10804 | 25.6% | 25.2% | 26.1% | 19.4% | 17.3% |
| 2020/21 | • | 12583 | 29.8% | 29.4% | 30.3% | 23.0% | 20.8% |
| 2021/22 | • | 13332 | 31.2% | 30.7% | 31.6% | 24.8% | 22.5% |
| 2022/23 | • | 14182 | 32.9% | 32.4% | 33.3% | 26.0% | 23.8% |
| 2023/24 | • | 14594 | 33.7% | 33.2% | 34.1% | 26.8% | 24.6% |
| 2024/25 | • | 14928 | 34.7% | 34.2% | 35.1% | 27.8% | 25.7% |
Source: Department for Education
Further information relating to children eligible for free school meals can be found under Schools, Education and Qualifications and information relating to food insecurity (concerns over being able to provide food for the family) can be found under Financial Resilience both under Health and Wellbeing Influences.
Fuel Poverty
A household is considered to be fuel poor if they are living in a property with a fuel poverty energy efficiency rating of band D or below and when they spend the required amount to heat their home, they are left with a residual income below the official poverty line. This is referred to the ‘low income, low energy efficiency’ methodology. The ‘residual income’ is the disposable income after housing and energy needs. There are three important elements in determining whether a household is fuel poor: household income, household energy requirements and fuel prices.
For 2023, it was estimated that 17.9% of households experienced fuel poverty based on the ‘low income, low energy efficiency’ methodology which was considerably higher than England (11.4%).
Compared with benchmark
| Indicator | Period | England | Yorkshire and the Humber region (statistical) | Kingston upon Hull | East Riding of Yorkshire | North East Lincolnshire | North Lincolnshire | York | North Yorkshire UA | Barnsley | Doncaster | Rotherham | Sheffield | Bradford | Calderdale | Kirklees | Leeds | Wakefield |
|---|---|---|---|---|---|---|---|---|---|---|---|---|---|---|---|---|---|---|
Fuel poverty (low income, low energy efficiency methodology) (Not applicable Not applicable) | 2023 | 11.4 | 14.7 | 17.9 | 13.0 | 16.2 | 14.3 | 12.3 | 14.2 | 15.8 | 16.1 | 14.5 | 14.3 | 15.9 | 15.2 | 15.0 | 13.8 | 13.7 |
This equated to 21,457 households in Hull for 2023 who were in fuel poverty.
Compared with benchmark
Fuel poverty (low income, low energy efficiency methodology) (Not applicable Not applicable)
|
Period
|
Kingston upon Hull |
Yorkshire and the Humber region (statistical)
|
England
|
||||
|---|---|---|---|---|---|---|---|
|
Count
|
Value
|
95%
Lower CI |
95%
Upper CI |
||||
| 2019 | • | 23434 | 19.6% | - | - | 16.8% | 13.4% |
| 2020 | • | 25209 | 20.8% | - | - | 17.5% | 13.2% |
| 2021 | • | 23567 | 19.9% | - | - | 16.5% | 13.1% |
| 2022 | • | 24308 | 20.4% | - | - | 17.0% | 13.1% |
| 2023 | • | 21457 | 17.9% | - | - | 14.7% | 11.4% |
Source: Department for Energy Security and Net Zero
COVID-19 and the Cost of Living Crisis
COVID-19 Pandemic
Some of the information relating to deprivation and poverty predates March 2020 and thus predates the COVID-19 pandemic. There were many low income households in Hull working on zero hour contracts or on furlough during the COVID-19 pandemic and this resulted in income loss for many households in Hull.
Increase to Inflation Rate and Energy and Food Costs
Furthermore, at the end of 2021 and in 2022, the cost of gas and electricity increased dramatically, and these increases have continued into 2023. The cost of food and other products also increased, as well as the overall inflation figure for the the UK. In April 2021, the annual inflation rate was 1.5% but has increased since then to a high of 11.1% in October 2022. This was the highest inflation rate recorded since March 1992. Between October 2022 and December 2023, the inflation rate has decreased considerably to 4.0% but is still twice as high as the national target for inflation, although the inflation rate reached the target of 2% for the first time when figures were released in June 2024. Furthermore, existing high rate of inflation over the last couple of years have meant that the overall prices have remained high. Whilst salaries and some benefits have increased over the last year for many, in particular those working in the private sector, the inflation rate is considerably higher than those increases meaning that salaries and benefits have reduced in real terms (after adjusting for inflation).
For those not on fixed price energy contracts, the cost of energy prices started to increase in 2021. Whilst the government put a cap (maximum) on the unit cost of electricity and gas through the Energy Price Guarantee, the cap was considerably higher than the prices in 2020 and early 2021. This meant that energy bills were substantially higher than those at the beginning in 2021 for all households and businesses (frequently two or three times higher). These high prices have persisted.
Increase on Bank of England’s Base Interest Rate and Impact on the Cost of Mortgages and Rent
Furthermore, between 2009 and 2020, the Bank of England’s interest rate had been below 1%, and fell to a low of 0.1% between May 2020 and December 2021. With the increasing inflationary pressures on the economy as a way to attempt to reduce the inflation rate, the Bank of England started to increase the base interest rate in December 2021 with increases every six weeks or so when they meet to decide the base rate until August 2023. Between August 2023 and July 2024, the base rate remained at 5.25% with January 2008 being the last time the base rate was this high. The base rate has fallen and currently stands (as at December 2025) at 4% which is considerably higher than base rate between 2009 and 2021.
For home-owners paying a mortgage who are not on a fixed-interest rate deal, their monthly mortgage payments have increased dramatically, by hundreds of pounds a month. This may have also affected landlords, and household rents have also increased in the last 2-3 years.
Exacerbating Impact
Households in Hull were already struggling financially following in the COVID-19 pandemic which increased the inequalities gap in Hull. The current and future impact on energy, food, mortgage and rents, and other costs will only magnify this further and further increase the significant inequalities that already exist when comparing Hull with other places in England, as well as exacerbating the inequalities within Hull.
Further information relating to the increases in the rental properties and mortgage and landlord repossessions can be found within Housing and Households under Health and Wellbeing Influences.
Further information is given within Financial Resilience under Health and Wellbeing Influences from Citizens Advice within their Cost of Living Crisis Dashboard.
From the Health Foundation’s report into children and young people’s mental health and COVID-19 and the road ahead, in 2021, children and adolescents with a probable mental health condition were twice as likely to live in households newly falling behind on bills (12.8%, compared with 6.7% of 6 to 16-year-olds without a mental health condition).
Strategic Need and Service Provision
Improving education, training, skills and the labour market are all key drivers to reducing poverty and deprivation.
Increasing secure employment was a key strategic need, strongly identified in Hull’s City Plan which was launched in the summer 2013. The aim was to create 7,500 jobs for local people over the next 10 years sits at the heart of the developing ‘energy estuary’, making Hull the UK hub for renewable energy industries and investment due to its location. It is necessary to ensure that local residents have the health, skills, education and training required to take up these employment opportunities. Since the launch, Hull has seen significant economic benefit with thousands of jobs being created for local people and unprecedented levels of investment. Further information can be found at https://cityplanhull.co.uk.
It is necessary to support the ‘Fuel, Food and Finance’ anti-poverty initiatives that help people minimise the health impact of welfare reform and cost of living rises (e.g. initiatives that enable people to prevent, manage or recover from debt), and support the Living Wage. Suitable affordable housing is also required.
Benefit can be obtained from projects in the community that raise resilience, confidence, self-worth and self-esteem to raise aspirations for life. Children, young people and adults should have the best life opportunities in terms of education, training and employment so that they have financial stability. This will improve health and wellbeing.
The most vulnerable citizens should be identified so that their specific needs can be addressed by working with them, and it needs to be acknowledgement that in order to help people improve their health and wellbeing, needs unrelated to health might need to be addressed prior to health needs as people generally need to be in a stable environment before they can change their lifestyle and behaviour and improve their health and wellbeing.
People’s circumstances can often be improved by early help, and any early help and intervention for all families should be timely, accessible and appropriate for their circumstances. Hull’s Early Help and Prevention offer is focused on a whole family approach which aims to identify individuals and families with problems and brings together different services and agencies to collectively look at what support is needed and then work together to deliver the required support in a coordinated way. The framework outlines the approach to ensure that collaboration and alignment of services, and that early help may be ‘early in life or at the earliest opportunity’ which is also part of the day job, helpful, non-stigmatising, preventative, targeted and tailored.
The Social Prescribing Service aims to help people feel more linked in with their local communities and provide advice and support on a range of issues including money and benefits.
The impact of the COVID-19 pandemic have adversely affected the poorest, most deprived areas of the country the most. This is the case for Hull. The educational and training opportunities, labour market, employment opportunities and circumstances of people in Hull as well as levels of poverty, debt and financial insecurity were already considerably worse than most local authorities in England prior to COVID-19, and the consequences of COVID-19 will have widened the inequalities gap in relation to education, employment, the labour market, poverty, debt and financial insecurity. This has now been compounded by the marked increases in energy costs which has impacted on food and other costs increasing the rate of inflation to the highest rate it has been in the UK for 30 years. Furthermore, the prices are anticipated to increase even further.
Resources
Index of Multiple Deprivation 2019: https://www.gov.uk/government/statistics/english-indices-of-deprivation-2019
Index of Multiple Deprivation 2025: https://www.gov.uk/government/statistics/english-indices-of-deprivation-2025
The Office for Health Improvement & Disparities’ Fingertips: https://fingertips.phe.org.uk/
Wilkinson P, Landon M, Armstrong B, Stevenson S, Pattenden S, McKee M and Fletcher T (2001) Cold Comfort: The Social and Environmental Determinants of Excess Winter Deaths in England, 1986 to 96. Bristol: The Policy Press.
University College London Institute of Health Equity (2011). The Health Impacts of Cold Homes and Fuel Poverty.
Bramley G, Fitzpatrick S, Edwards J, Ford D, Johnsen S, Sosenko F and Watkins D. Hard Edges: mapping severe and multiple disadvantage in England. Heriot-Watt University, 2015. https://lankellychase.org.uk/publication/hard-edges/
Changing Lives & Agenda Alliance. Dismantling Disadvantage: Levelling up public services for women with multiple unmet needs, 2023. www.agendaalliance.org/news/transforming-services-final-report-launch-something-needs-to-change/
Trading Economics. United Kingdom Inflation Rate. https://tradingeconomics.com/united-kingdom/inflation-cpi
Bank of England. Interest Rates and Bank Rate. www.bankofengland.co.uk/monetary-policy/the-interest-rate-bank-rate
Official Labour Market Statistics (nomis). Annual Population Survey – Households by combined economic activity status. https://www.nomisweb.co.uk/
Hull’s Early Help and Prevention Strategy 2021-25. https://www.hull.gov.uk/downloads/file/1726/Hull_Early_Help_and_Prevention_Strategy_2021_25.pdf
Updates
This page was last updated / checked on 16 December 2025.
This page is due to be updated / checked in October 2026.