Index
This topic area covers statistics and information relating to life expectancy and healthy life expectancy including local strategic need and service provision. Further information relating to Causes of Death is given under Population, and further information relating to Stillbirth and Infant Mortality is given under Pregnancy, Infants and Early Years within Children and Young People. Further information on how life expectancy and healthy life expectancy are calculated is given within Life Expectancy within the Glossary.
This page contains information from the Office for Health Improvement & Disparities’ Fingertips. Information is taken ‘live’ from the site so uses the latest available data from Fingertips and displays it on this page. As a result, some comments on this page may relate to an earlier period of time until this page is next updated (see review dates at the end of this page).
Local mortality data is available before national data is published. Because of this, the local analysis of life expectancy comparing areas within Hull may be for a more recent period than the nationally produced comparisons.
Summary Infographic
Headlines
- Life expectancy at birth does not give the expected duration of life for a newborn; it gives a measure of expected life expectancy if the current age-specific mortality rates are applied throughout an entire lifetime, but of course, these are subject to changes over time. So, life expectancy gives an indication of the current health status of a population, rather than an expected duration of life. Life expectancy can be estimated at any age, and it is also common to estimate life expectancy at age 65 years. As contemporary morality rates will be more comparable to the actual mortality rates in the future over the next 15-20 years, life expectancy at age 65 years is more likely to represent a reasonable estimate of duration of life.
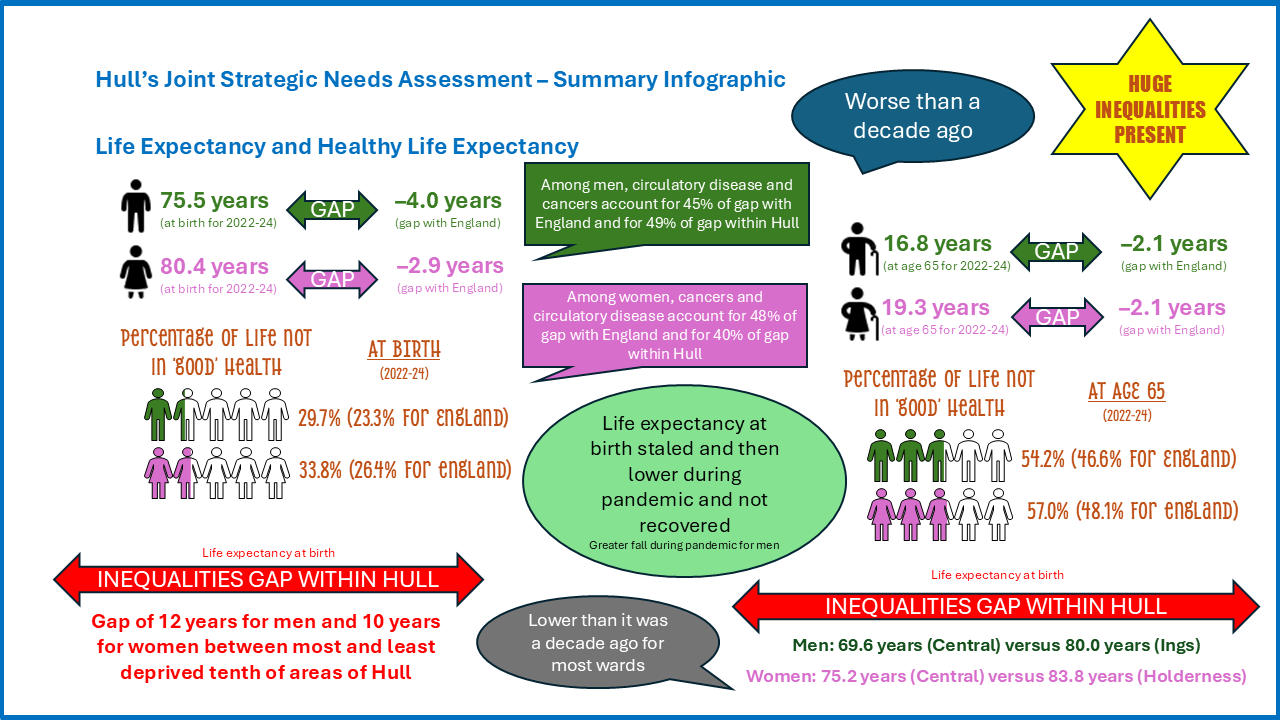
- Life expectancy at birth in Hull in 2023-25 was 75.5 years for men and 80.7 years for women. This compares with 79.7 years for men (a difference of 4.2 years) and 83.5 years for women (a difference of 2.8 years) for England.
- Life expectancy increased slightly in Hull for females in 2023-25 to 80.7 years, but remained unchanged for men.
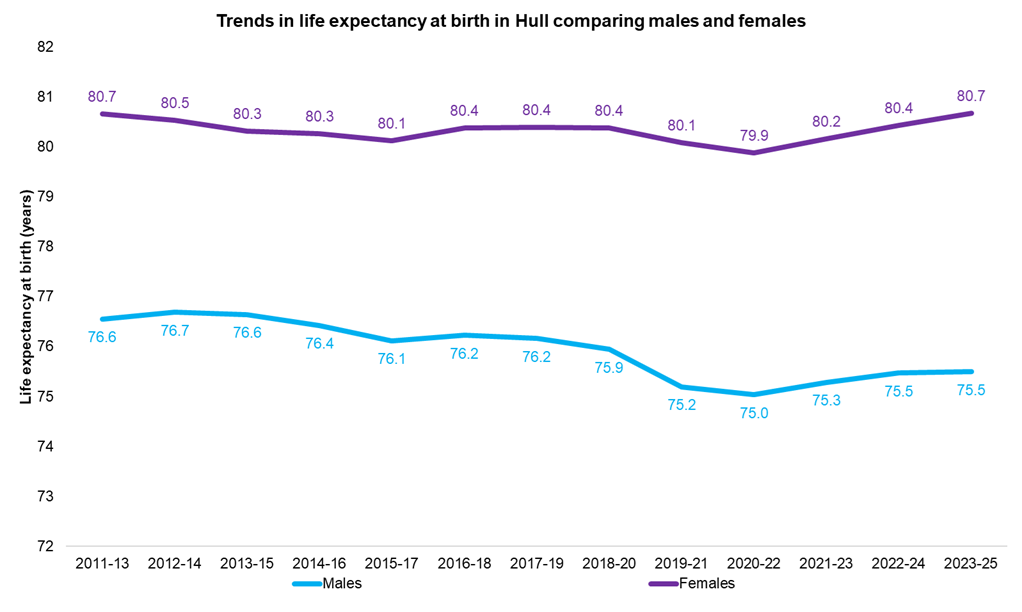
- When examining the trends over time, a relatively similar pattern over time occurred for men and women in Hull. Life expectancy at birth increased in Hull between 2001-03 and 2011-14, but then increases stalled, and decreased between 2011-14 and 2017-19 prior to the COVID-19 pandemic. In contrast, life expectancy at birth increased throughout the entire period 2001-03 and 2017-19 across England although the increases were smaller more recently compared to the start of the century.
- In Hull, life expectancy decreased between 2017-19 to a recent low in 2020-22 due to the COVID-19 pandemic. This was particularly the case for men, and whilst there were decreases nationally, they were not as large as the decreases in Hull. Life expectancy increased in Hull (and across the region and England too) between 2020-22 and 2021-23 as the year 2020 (with the highest mortality rate) was removed from the three-year moving average. Further increases have been observed between 2021-23, 2022-24 and 2023-25 for women, but only 2021-23 and 2022-24 for men. However, among men, the recent small increases are much smaller than the initial decreases due to the pandemic, and life expectancy for 2023-25 is lower than before the pandemic. Furthermore, life expectancy at birth increased by 0.6 years between 2021-23 and 2023-25 for men across England compared to 0.2 years for men in Hull which has further increased the inequalities gap between Hull and England for men. In the last year, female life expectancy at birth increased by 0.3 years for Hull but and by 0.2 years for England so the inequalities gap between Hull and England decreased slightly.
- Life expectancy in Hull for 2023-25 is similar to what it was in 2008-10 years for men and 2011-13 for women, and the highest it has ever been.
- For 2022-24, male healthy life expectancy is 53.1 years so it is estimated that men in Hull spend 22.4 years of their life not in ‘good’ health which represents 29.7% of their lives (18.6years for England representing 23.4%). For women, healthy life expectancy was 53.3 years so it is estimated that women in Hull spend 27.1 years of their life not in ‘good’ health representing 33.7% of their lives (22.0 years for England representing 26.4%). There has been a decrease in healthy life expectancy in England in the last year between 2021-23 by 0.6 years for men and by 1.0 years for women, but the decreases have been greater in Hull decreasing by 1.2 years for Hull men and by 1.3 years for Hull women.
- From local calculations, life expectancy at birth for 2023-25 ranged across Hull’s 21 wards from 69.2 years to 79.7 years for men and between 75.1 years and 85.5 years for women. Life expectancy was lowest in Central for both men and women, and highest in Boothferry ward for men and in Holderness ward for women. There was a clear and statistically significant trend in life expectancy at birth between men and women living in the most deprived areas of Hull compared to the least deprived areas of Hull. Life expectancy at birth was 10.8 years lower for men and 9.0 years lower for women living in the most deprived tenth of areas of Hull compared to those living in the least deprived tenth of areas of Hull.
- When examining changes in life expectancy over time, there were substantial differences among the wards in Hull, and there were a number of wards where life expectancy at birth had decreased between 2013-15 and 2023-25. For men, decreases occurred for 17 wards, the exceptions being Bricknell, North Carr and Holderness, which each saw increases in male life expectancy at birth, while in Marfleet male life expectancy at birth was unchanged in 2023-25 compared with 2013-25. Among women, life expectancy at birth decreased for ten wards. Increases were seen in Pickering, Newington & Gipsyville, St Andrew’s & Docklands, Avenue, Bricknell, Orchard Park, University, Sutton, Holderness, Sutton and Southcoates.
- For 2022-23, there was a 3.8 year gap for men and a 2.9 year gap for women between life expectancy at birth between England and Hull. Circulatory disease accounted for the greatest contribution to that gap being 1.10 years for men and 0.79 years for women. For men, external causes contributed 0.83 years to the gap and cancer contributed 0.68 years. For women, cancer contributed 0.77 years to the gap and respiratory disease contributed 0.64 years to the gap.
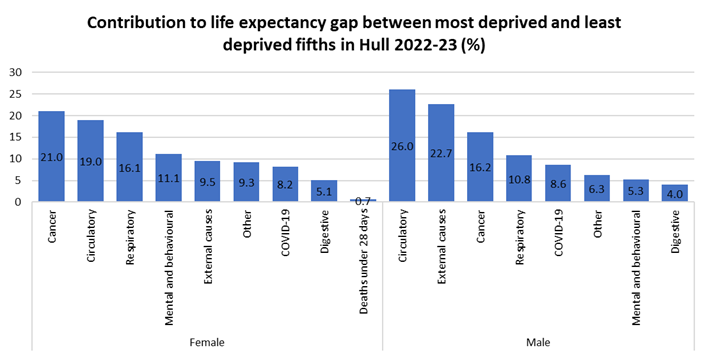
- For 2022-23, there was a gap of 9.6 years for men and 8.1 years for women in life expectancy at birth between the most deprived fifth of areas of Hull and the least deprived fifth of areas of Hull. Circulatory disease (2.42 years), external causes (2.12 years) and cancer (1.151 years) contributed the most to the gap for men, and cancer (1.56 years), circulatory disease (1.41 years) and respiratory disease (1.20 years) contributed the most to the gap for women.
- Life expectancy at age 65 years and healthy life expectancy (years in ‘good’ health) at birth and at age 65 years are also lower in Hull. People in Hull live more of their lives not in ‘good’ health. For 2022-24, it is estimated that men in Hull who are aged 65 years will spend 9.1 years of their estimated remaining 16.8 years not in good health which represents 54.2% of their remaining life (compared to 8.8 years for England equating to 46.6% of their remaining life). For women aged 65 years, it is estimated they will spend 11.0 years of their estimated remaining 19.3 years not in good health which represents 57.0% of their remaining life (compared to 10.3 years for England equating to 48.1% of their remaining life).
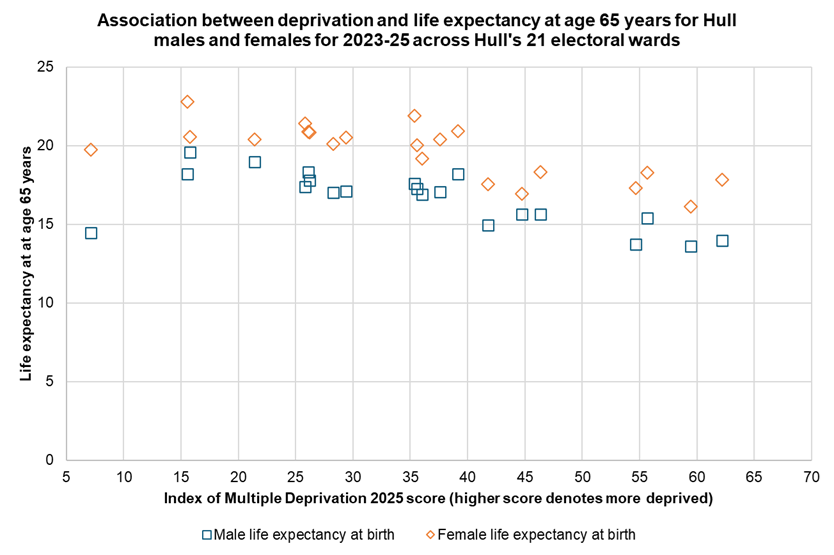
- From local calculations, for 2023-25, people aged 65 years who are living in the most deprived tenth of areas of Hull are living 6.2 years less for men and 5.1 years less for women compared to people living in the least deprived tenth of areas of Hull (14.0 versus 20.2 years for men and 17.0 versus 22.1 years for women). There are also significant differences across Hull’s wards for 2023-25 with life expectancy at age 65 years varying from 13.6 years for St Andrew’s & Docklands ward to 19.6 years in Bricknell ward among men and from 16.1 years for St Andrew’s & Docklands ward to 22.8 years in Holderness ward among women.
- The national inequalities gap between Hull and England has been increasing over time, and whilst the local inequalities gap between people living in the most and least deprived areas of Hull is variable, in general it has increased. The difference in the national and local inequalities gap is larger for men compared to women.
- People in Hull are dying earlier than they should and there are wide inequalities / differences in life expectancy both between Hull and England, and within Hull.
- From the A Matter of Life and Death report, “Social and economic conditions such as poverty, poor-quality housing, low-paid or unstable jobs all impact people’s physical and mental health. These ‘wider determinants of health’ are harming health and cutting lives short.”
The Population Affected – Why Is It Important?
Life expectancy at birth is used to assess health improvements over time, as well as differences in health between different groups, whether comparing different geographical areas, such as wards or local authorities; comparing between groups defined by deprivation status; or looking at different time periods within the same geographical area.
Life expectancy at birth does not give the expected duration of life for a newborn; it gives a measure of expected life expectancy if the current age-specific mortality rates are applied throughout an entire lifetime, but of course, these are subject to changes over time. So, life expectancy gives an indication of the current health status of a population, rather than an expected duration of life.
It is calculated from the mid-year population estimates produced by the Office for National Statistics, and the number of deaths that were registered in the respective year (not based on the year of the death occurrence). It is generally presented as a rolling average over three years to help reduce the impact on year-on-year variability.
Life expectancy can also be calculated for other ages, for instance, life expectancy at age 65 years is often reported. This will be more of a measure of the expectation of life as it is likely that the age-specific mortality rates over the next 15-20 years will be similar to the current age-specific mortality rates (assuming nothing dramatic happens to the current mortality rates such as a change due to a war, pandemic, miraculous medical intervention, etc).
Life expectancy estimates can be calculated for smaller geographies providing the total population of that geographical area is 5,000 or more.
However, life expectancy does not measure the quality of life. For this reason, Healthy Life Expectancy is calculated, using a statistical model to estimate the length of life expectancy likely to be lived in ‘good health’. This measure is the overarching indicator used within the Public Health Outcomes Framework published by the Office for Health Improvement and Disparities. From health surveys, men and women are asked about their health status to obtain the prevalence of ‘in good health’, and this is incorporated into the life expectancy calculations for each age group.
A related measure is disability adjusted life years (DALYs) which is a measure of overall disease burden, and broadly speaking is defined as the number of years of life lost due to ill health, disability or death. Medical conditions with high DALYs are conditions which impact on quality of life substantially for a long period of time.
Where there is a difference in the life expectancy between two geographical areas, it is also possible to examine the causes of death which contribute to the difference in the gap to assess where there is an excess of deaths for the geographical area with the lower life expectancy. Such analyses using been undertaken within The Office for Health Improvement & Disparities’ Segment Tool.
The Hull Picture
Summary
Further details are given below but the overall figures are summarised in the following tables for 2022-24 for men and women.
Men
For 2022-24, life expectancy at birth is 4.0 years lower (or 5.0% lower) among Hull men compared to England for deaths registered during 2022-24, while healthy life expectancy at birth among men is 7.8 years lower than for England.
| Measure | Hull men | England men | Absolute difference | Relative difference |
| Life expectancy at birth | 75.5 | 79.5 | -4.0 | -5.0 |
| Healthy life expectancy at birth | 53.1 | 60.9 | -7.8 | -12.8 |
| Total years not in ‘good’ health | 22.4 | 18.6 | 3.8 | 20.4 |
| Percentage of life not in ‘good’ health | 29.7 | 23.4 | 6.3 | 26.8 |
| Life expectancy at age 65 | 16.8 | 18.9 | -2.1 | -11.1 |
| Healthy life expectancy at age 65 | 7.7 | 10.1 | -2.4 | -23.8 |
| Years not in ‘good’ health at age 65 | 9.1 | 8.8 | 0.3 | 3.4 |
| Percentage of life not in ‘good’ health at age 65 | 54.2 | 45.6 | 7.6 | 16.3 |
Women
For 2022-24, life expectancy at birth is 4.0 years lower (or 5.0% lower) among Hull men compared to England for deaths registered during 2022-24, while healthy life expectancy at birth among women is 8.0 years lower than for England.
| Measure | Hull women | England women | Absolute difference | Relative difference |
| Life expectancy at birth | 80.4 | 83.3 | -2.9 | -3.5 |
| Healthy life expectancy at birth | 53.3 | 61.3 | -8.0 | -13.1 |
| Total years not in ‘good’ health | 27.1 | 22.0 | 5.1 | 23.2 |
| Percentage of life not in ‘good’ health | 33.7 | 26.4 | 7.3 | 27.6 |
| Life expectancy at age 65 | 19.3 | 21.4 | -2.1 | -9.8 |
| Healthy life expectancy at age 65 | 8.3 | 11.1 | -2.8 | -25.2 |
| Years not in ‘good’ health at age 65 | 11.0 | 10.3 | 0.7 | 6.8 |
| Percentage of life not in ‘good’ health at age 65 | 57.0 | 48.1 | 8.9 | 18.4 |
Life Expectancy at Birth
Latest Estimates for Men and Women
In Hull, life expectancy at birth is estimated to be 75.5 years for men and 80.7 years for women for 2023-25 which is 4.2 years lower for men and 2.8 years lower for women in Hull compared to England.
Male life expectancy at birth in Hull is the second lowest among the 151 upper-tier local authorities in England, the lowest being Blackpool (74.2years), with Kensington and Chelsea having the highest male life expectancy at 83.3 years for 2023-25.
Female life expectancy at birth in Hull is the seventh lowest among the 151 upper-tier local authorities in England. Blackpool has the lowest female life expectancy at 79.3 years and Richmond upon Thames has the highest female life expectancy at 87.2 years for 2023-25.
Compared with benchmark
| Indicator | Period | England | Yorkshire and the Humber region (statistical) | Kingston upon Hull | East Riding of Yorkshire | North East Lincolnshire | North Lincolnshire | York | North Yorkshire UA | Barnsley | Doncaster | Rotherham | Sheffield | Bradford | Calderdale | Kirklees | Leeds | Wakefield |
|---|---|---|---|---|---|---|---|---|---|---|---|---|---|---|---|---|---|---|
Life expectancy at birth (Male All ages) | 2023 - 25 | 79.7 | 78.5 | 75.5 | 80.1 | 76.0 | 77.5 | 80.1 | 80.7 | 77.6 | 77.2 | 78.2 | 78.9 | 77.4 | 78.4 | 78.4 | 78.9 | 77.8 |
Life expectancy at birth (Female All ages) | 2023 - 25 | 83.5 | 82.5 | 80.7 | 83.7 | 81.7 | 82.0 | 84.0 | 84.4 | 81.5 | 81.6 | 81.8 | 82.4 | 81.9 | 82.6 | 82.3 | 82.7 | 81.8 |
Trends Over Time Among Men
Among Hull men, whilst life expectancy had increased between 2001-03 and 2010-12 from 73.7 years to 76.6 years, it remained relatively static between 2010-12 and 2014-16 (ranging from 76.5 to 76.7 years). Since 2014-16, life expectancy had declined among Hull men to 76.2 years for 2017-19. However, there was a sharp fall to 75.0 years for 2020-22 which is mainly attributable to the COVID-19 pandemic (further information on the number of COVID-19 deaths can be found within Causes of Death in Hull under Population). The largest number of deaths where COVID-19 was the underlying cause of the death were registered between April and June 2020 and between November 2020 and February 2021 (further information is given within Coronavirus (COVID-19) within Health Factors under Adults). Among both men and women, there were 388 COVID-19 deaths registered during 2020, 323 deaths in 2021 and 116 deaths in 2022 among Hull residents. Whilst there was a decrease between 2017-19 and 2018-20, the impact on life expectancy was greatest for 2019-21 and 2020-22 as these included two and three years of COVID-19 deaths rather than one year of deaths as 2018-20 did.
Life expectancy increased slightly in Hull between 2020-22 and 2022-24 by 0.5 years. The high mortality rate from the year 2020 is no longer included in the periods 2021-23 onwards. Life expectancy in Hull remained unchanged in 2023-25 at 75.5 years.
Since the high of 76.7 years for 2012-14, male life expectancy has decrease by 0.7% to 2017-19 and by 2.2% to 2020-22. However, even with the recent increases, life expectancy remains 1.6% lower in 2023-25 than it was in 2012-14.
Between 2017-19 and 2021-23, life expectancy reduced by 0.9 years for Hull men. The reductions for England and the region (both 0.6 years) were lower.
Over the entire period between 2001-03 and 2021-23, male life expectancy at birth in Hull has increased by 1.6 years representing a 2.1% increase. Life expectancy increased by 2.6 years (3.4%) across the region and by 2.9 years (3.8%) for England. Thus the inequalities gap between Hull and England has increased.
Male life expectancy increased by 0.2 years between 2021-23 and 2023-25 (both 2020 and 2021 years – which has the highest COVID-19 mortality rates – are no longer included in these time periods). However, the increases in the last two years have not been sufficient to balance out the decrease due to the pandemic, and life expectancy at birth among Hull men in 2023-25 is 0.7 years lower than it was in 2017-19. Furthermore, life expectancy among men in England increased by 0.6 years over this period, increasing the inequalities gap between Hull and England for men.
Life expectancy at birth among Hull men in 2023-25 is the similar to what it was in 2008-10.
Compared with benchmark
Life expectancy at birth (Male All ages)
|
Period
|
Kingston upon Hull |
Yorkshire and the Humber region (statistical)
|
England
|
||||
|---|---|---|---|---|---|---|---|
|
Count
|
Value
|
95%
Lower CI |
95%
Upper CI |
||||
| 2001 - 03 | • | - | 73.7 | 73.3 | 74.2 | 75.5 | 76.2 |
| 2002 - 04 | • | - | 74.2 | 73.8 | 74.7 | 75.8 | 76.5 |
| 2003 - 05 | • | - | 74.3 | 73.9 | 74.7 | 76.1 | 76.8 |
| 2004 - 06 | • | - | 74.6 | 74.1 | 75.0 | 76.5 | 77.2 |
| 2005 - 07 | • | - | 74.6 | 74.2 | 75.1 | 76.8 | 77.5 |
| 2006 - 08 | • | - | 74.8 | 74.3 | 75.2 | 77.0 | 77.8 |
| 2007 - 09 | • | - | 74.9 | 74.5 | 75.4 | 77.3 | 78.1 |
| 2008 - 10 | • | - | 75.4 | 75.0 | 75.9 | 77.6 | 78.4 |
| 2009 - 11 | • | - | 75.9 | 75.4 | 76.3 | 78.0 | 78.8 |
| 2010 - 12 | • | - | 76.6 | 76.1 | 77.0 | 78.2 | 79.1 |
| 2011 - 13 | • | - | 76.6 | 76.1 | 77.0 | 78.4 | 79.3 |
| 2012 - 14 | • | - | 76.7 | 76.3 | 77.1 | 78.6 | 79.4 |
| 2013 - 15 | • | - | 76.6 | 76.2 | 77.1 | 78.6 | 79.4 |
| 2014 - 16 | • | - | 76.5 | 76.0 | 76.9 | 78.7 | 79.5 |
| 2015 - 17 | • | - | 76.2 | 75.7 | 76.6 | 78.6 | 79.5 |
| 2016 - 18 | • | - | 76.3 | 75.8 | 76.7 | 78.7 | 79.6 |
| 2017 - 19 | • | - | 76.2 | 75.8 | 76.6 | 78.7 | 79.7 |
| 2018 - 20 | • | - | 75.9 | 75.5 | 76.4 | 78.3 | 79.3 |
| 2019 - 21 | • | - | 75.2 | 74.8 | 75.6 | 78.1 | 79.0 |
| 2020 - 22 | • | - | 75.0 | 74.6 | 75.5 | 77.9 | 78.9 |
| 2021 - 23 | • | - | 75.3 | 74.9 | 75.7 | 78.1 | 79.1 |
| 2022 - 24 | • | - | 75.5 | 75.0 | 75.9 | 78.3 | 79.5 |
| 2023 - 25 | • | - | 75.5 | 75.1 | 76.0 | 78.5 | 79.7 |
Source: Office for National Statistics
Trends Over Time Among Women
Life expectancy at birth among Hull women show a reasonably similar pattern compared to men although the increase overall were smaller, and the impact of the COVID-19 pandemic was smaller.
Female life expectancy decreased between 2001-03 to 2002-04 from 79.4 years to 79.1 years, and then remained relatively unchanged until 2005-07 when it increased to 79.4 years in 2006-08. Female life expectancy at birth did then increase in Hull to a high of 80.7 years in 2011-13. The rate then fell to 80.1 years in 2015-17, and whilst there was an increase to 80.4 years in 2016-18, life expectancy remained unchanged until 2017-19 at 80.4 years. Life expectancy decreased from 80.4 years prior to the pandemic to 79.9 years for 2020-22, and similarly to men, life expectancy has increased between 2020-22 and 2023-25 to 80.7 years. As the mortality rate from COVID-19 was higher among men, female life expectancy was less affected by the pandemic than male life expectancy (further information on the number of COVID-19 deaths can be found within Causes of Death in Hull under Population).
Over the entire period between 2001-03 and 2021-23, female life expectancy at birth in Hull has increased by 0.8 years representing a 1.0% increase. Life expectancy increased by 1.8 years (2.2%) across the region and by 2.4 years (3.0%) for England. Thus the inequalities gap between Hull and England has increased.
Female life expectancy increased by 0.5 years between 2021-23 and 2023-25 (both 2020 and 2021 years – which has the highest COVID-19 mortality rates – are no longer included in these time periods). Female life expectancy at birth for women in England increased by 0.4 years between 2021-23 and 2023-25 so the inequalities gap between Hull and England decreased slightly.
Female life expectancy in Hull for 2023-25 is now the highest it has been, and the same as in 2011-13.
Compared with benchmark
Life expectancy at birth (Female All ages)
|
Period
|
Kingston upon Hull |
Yorkshire and the Humber region (statistical)
|
England
|
||||
|---|---|---|---|---|---|---|---|
|
Count
|
Value
|
95%
Lower CI |
95%
Upper CI |
||||
| 2001 - 03 | • | - | 79.4 | 79.0 | 79.8 | 80.3 | 80.7 |
| 2002 - 04 | • | - | 79.1 | 78.7 | 79.5 | 80.4 | 80.9 |
| 2003 - 05 | • | - | 79.0 | 78.5 | 79.4 | 80.6 | 81.1 |
| 2004 - 06 | • | - | 79.0 | 78.5 | 79.4 | 80.9 | 81.5 |
| 2005 - 07 | • | - | 79.0 | 78.6 | 79.5 | 81.0 | 81.7 |
| 2006 - 08 | • | - | 79.4 | 79.0 | 79.8 | 81.2 | 81.9 |
| 2007 - 09 | • | - | 79.9 | 79.4 | 80.3 | 81.3 | 82.1 |
| 2008 - 10 | • | - | 80.1 | 79.7 | 80.5 | 81.6 | 82.3 |
| 2009 - 11 | • | - | 80.2 | 79.8 | 80.7 | 81.9 | 82.7 |
| 2010 - 12 | • | - | 80.4 | 80.0 | 80.8 | 82.1 | 82.9 |
| 2011 - 13 | • | - | 80.7 | 80.3 | 81.1 | 82.2 | 83.0 |
| 2012 - 14 | • | - | 80.5 | 80.1 | 80.9 | 82.3 | 83.1 |
| 2013 - 15 | • | - | 80.3 | 79.9 | 80.7 | 82.3 | 83.1 |
| 2014 - 16 | • | - | 80.3 | 79.8 | 80.7 | 82.4 | 83.1 |
| 2015 - 17 | • | - | 80.1 | 79.7 | 80.5 | 82.3 | 83.1 |
| 2016 - 18 | • | - | 80.4 | 80.0 | 80.8 | 82.4 | 83.2 |
| 2017 - 19 | • | - | 80.4 | 80.0 | 80.8 | 82.4 | 83.3 |
| 2018 - 20 | • | - | 80.4 | 80.0 | 80.8 | 82.1 | 83.1 |
| 2019 - 21 | • | - | 80.1 | 79.7 | 80.5 | 82.0 | 82.9 |
| 2020 - 22 | • | - | 79.9 | 79.5 | 80.3 | 81.9 | 82.8 |
| 2021 - 23 | • | - | 80.2 | 79.8 | 80.6 | 82.1 | 83.1 |
| 2022 - 24 | • | - | 80.4 | 80.0 | 80.8 | 82.3 | 83.3 |
| 2023 - 25 | • | - | 80.7 | 80.3 | 81.2 | 82.5 | 83.5 |
Source: Office for National Statistics
Inequalities Gap Between Men and Women
From the locally calculated figures, the difference between males and females for 2023-25 is 5.2 years which has been increasing over time. The difference in life expectancy at birth between males and females was 4.1 years in 2011-13, but decreased to 3.7 years in 2013-15 and then gradually increased to 4.2 years in 2017-19. However, the higher mortality rate among men during the COVID-19 pandemic has increased the inequalities gap between Hull men and women increase, with increases in life expectancy at birth since then large in women than in men, leading the gap to increase to 5.2 years in 2023-25.
Causes of Death with Excess Deaths in Hull Contributing to the Gap in Life Expectancy
The Office for Health Improvement & Disparities have produced a Life Expectancy Segment Tool, which examines the gap or difference in life expectancy and assesses the excess deaths that contributed to the difference in relation to different causes of death.
Population estimates from the 2021 Census and mid-year 2023 population estimates have been used to calculate life expectancy at birth.
The latest version uses mortality data for the two years 2022-23 and is based on the Index of Multiple Deprivation 2019. The Index of Multiple Deprivation 2025 was published at the end of October 2025 so the Segment Tool has not yet been updated for the new Index of Multiple Deprivation.
Gap in Life Expectancy Between Hull and England
For women, circulatory disease, cancer and respiratory disease were the three causes of death which had the highest excess deaths in Hull contributing to the gap in life expectancy between Hull and England for 2022-23. If the age-specific mortality rates from these three diseases were the same in Hull as they were for England, then female life expectancy would be 0.79 years higher due to circulatory disease, 0.77 years higher due to cancer and 0.64 years due to respiratory disease.
For men, circulatory disease, external causes and cancer were the three causes of death which had the highest excess deaths in Hull contributing to the gap in life expectancy between Hull and England for 2022-23. If the age-specific mortality rates from these three diseases were the same in Hull as they were for England, then male life expectancy would be 1.10 years higher due to circulatory disease, 0.83 higher due to external causes, and 0.68 years higher due to cancer.
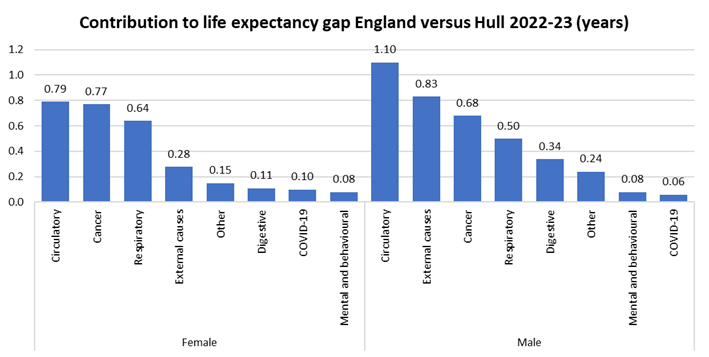
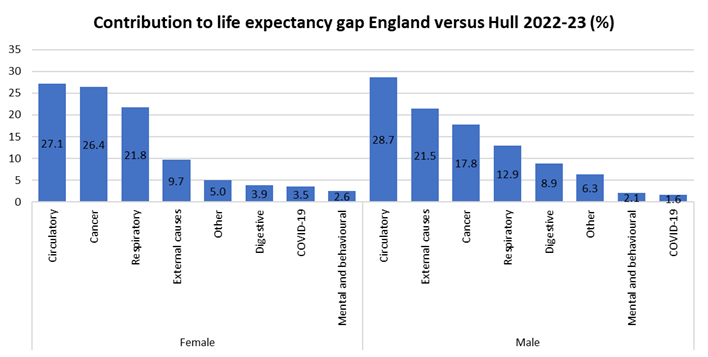
The gap in life expectancy between Hull and England for 2022-23 was 2.9 years for women (life expectancy 80.5 years in Hull compared to 83.2 years in England) and 3.8 years for men (life expectancy 75.5 years in Hull compared to 79.3 years in England). Thus circulatory disease accounts for 27% of the life expectancy gap for women and 29% of the gap for men, and cancer accounts for 26% of the gap for women and 18% of the gap for men. For women, respiratory disease accounts for 22% of the life expectancy gap between Hull and England for women. For men, external causes account for 22% of the life expectancy gap between Hull and England for men.
Gap in Life Expectancy Between Most and Least Deprived Areas of Hull
The Segment Tool also examines the gap in life expectancy between the most deprived fifth of areas and the least deprived fifth of areas within each local authority. It is based on the Index of Multiple Deprivation 2019.
In Hull for 2022-23, they estimate that life expectancy at birth is 76.4 years for women living in the most deprived fifth of areas of Hull compared to 84.5 years for women living in the least deprived fifth of areas of Hull giving a gap of 8.1 years. For men, their life expectancy at birth estimates are 71.3 and 80.8 years for the most and least deprived fifth of areas respectively giving a gap of 9.6 years.
Among women, circulatory disease contributes 1.56 years to this life expectancy gap, circulatory disease 1.41 years and respiratory disease 1.20 years. Among men, the causes with the greatest excess deaths contributing to the local life expectancy gap are for circulatory disease (2.42 years), external causes (2.12 years) and cancer (1.51 years).
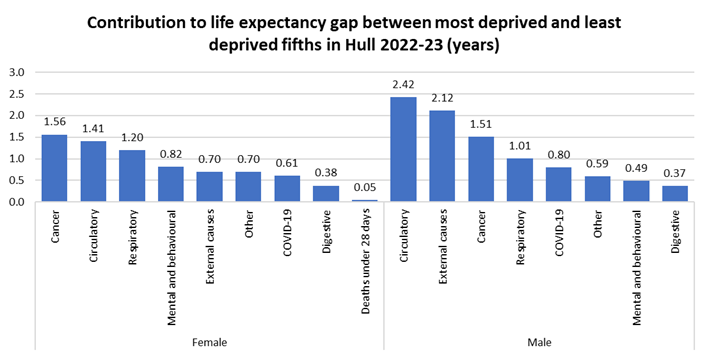
Among women, excess deaths due to cancer contributes to 21% of the gap in life expectancy between people living in the most deprived fifth of areas of Hull compared to the least deprived fifth of areas of Hull, circulatory disease contributes 19% and respiratory disease contributes 16%.
Among men, excess deaths due to circulatory disease contributes to 26% of the gap in life expectancy between people living in the most deprived fifth of areas of Hull compared to the least deprived fifth of areas of Hull, external causes contributes 23% and cancer disease contributes 16%.
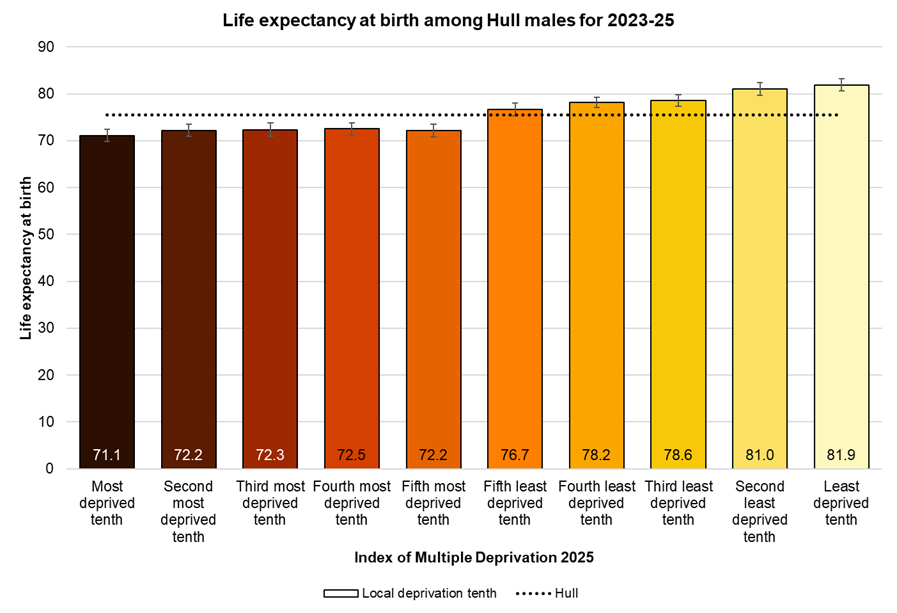
Life Expectancy at Birth Among Local Deprivation Groups And Slope Index of Inequality
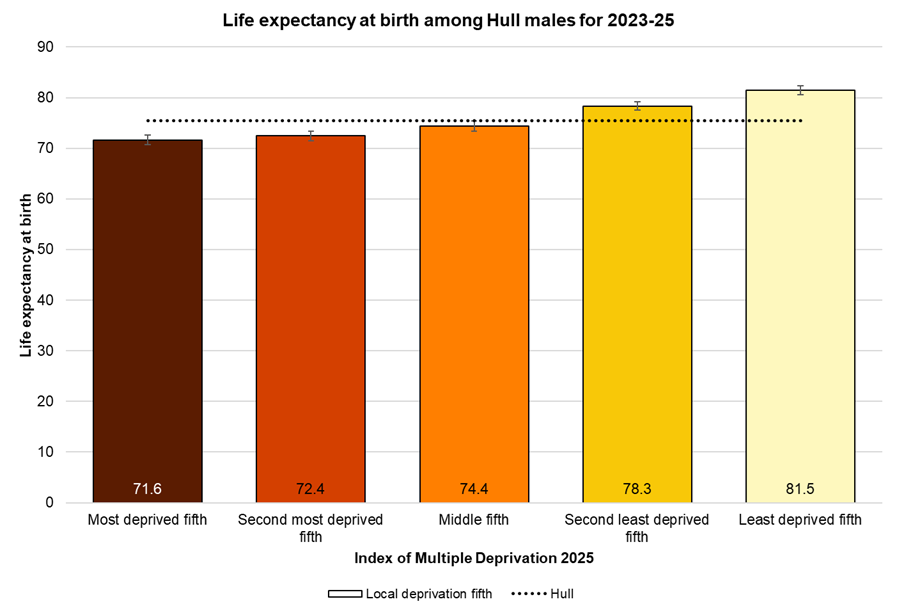
Life expectancy at birth differs among the local deprivation tenths defined on the basis of the Index of Multiple Deprivation 2025. The 95% confidence intervals are shown (for more information see Confidence Intervals in the Glossary). If the confidence intervals do not overlap then there is a statistically significant difference in life expectancy, although the reverse cannot necessarily be said if there is overlap (it is possible for statistically significant differences to exist when there is a small overlap between groups).
Latest Estimates for Men
It can be seen that there is a clear trend in life expectancy at birth among Hull men based on where they live. Life expectancy at birth among men living in the most deprived tenth of areas of Hull is 71.1 years compared to 81.9 for men living in the least deprived tenth of areas of Hull for 2023-25. This is a difference of 10.8 years.
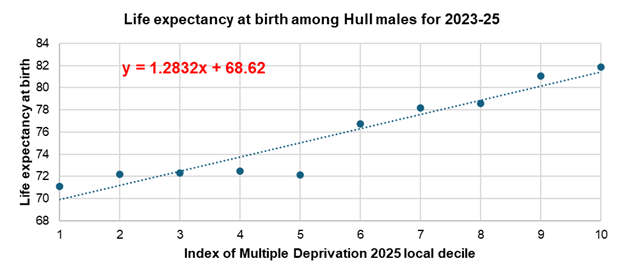
The Slope Index of Inequality is also presented on Fingertips. This is a measure of the difference in life expectancy at birth between the most deprived and least deprived tenths of areas of the local authority, but it is not a straightforward difference between the most and least deprived tenth but uses the information from all ten data points by using linear regression and calculating the ‘slope’ of the line.
The locally calculated Slope Index of Inequality is 11.5 years for males as the estimated male life expectancy at birth for people living in the most deprived tenth of areas of Hull is 68.62 + 1 x 1.2832 or 69.9 years compared to 68.62 + 10 x 1.2832 or 81.5 years for people living in the least deprived tenth of areas of Hull. This equates to a Slope Index of Inequality of 11.5 years for men in Hull for 2023-25.
When comparing local deprivation fifths, the gap in male life expectancy at birth is 9.9 years, lower among men living in the most deprived fifth of areas of Hull compared to men living in the least deprived fifth of areas of Hull for 2023-25.
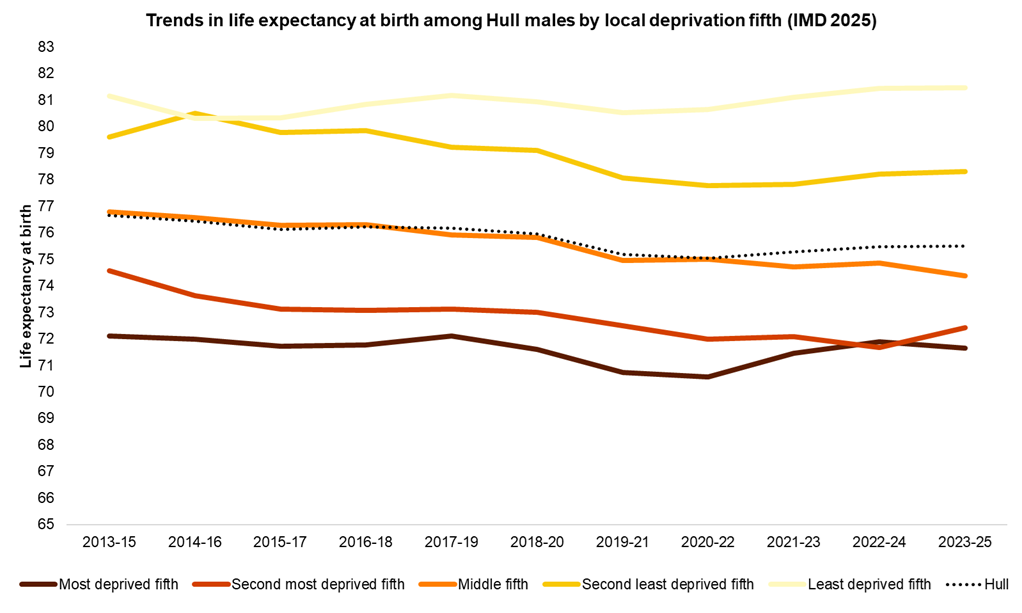
Trends Over Time Among Men
The local calculations of the Slope Index of Inequality show an increase between 2013-15 and 2023-25 for men based on the Index of Multiple Deprivation 2025.
| Period | Male life expectancy among most deprived tenth | Male life expectancy among least deprived tenth | Slope | Intercept | Slope Index of Inequality |
| 2013-15 | 71.6 | 80.0 | 1.11 | 70.8 | 10.0 |
| 2014-16 | 72.5 | 80.0 | 1.13 | 70.4 | 10.2 |
| 2015-17 | 72.4 | 80.1 | 1.16 | 69.9 | 10.5 |
| 2016-18 | 72.0 | 81.3 | 1.25 | 69.5 | 11.2 |
| 2017-19 | 71.6 | 80.9 | 1.21 | 69.7 | 10.9 |
| 2018-20 | 70.5 | 81.5 | 1.24 | 69.3 | 11.2 |
| 2019-21 | 70.0 | 81.3 | 1.25 | 68.5 | 11.2 |
| 2020-22 | 69.9 | 82.0 | 1.29 | 68.1 | 11.6 |
| 2021-22 | 71.1 | 82.2 | 1.25 | 68.6 | 11.2 |
| 2022-24 | 71.3 | 82.3 | 1.29 | 68.6 | 11.6 |
| 2023-25 | 71.1 | 81.9 | 1.28 | 68.6 | 11.5 |
The trends over time for the Slope Index of Inequality are also presented on Fingertips for males, although based on the Index of Multiple Deprivation 2019 so will differ from the local calculations above.
The same pattern is evident though with an increase between 2011-13 and 2022-24, although for males the highest inequalities gap occurred during 2016-18 when the Slope Index of Inequality was 12.7 years and for 2020-22 when the Slope Index of Inequality was 13.5 years.
Compared with benchmark
Inequality in life expectancy at birth (Male All ages)
|
Period
|
Kingston upon Hull |
Yorkshire and the Humber region (statistical)
|
England
|
||||
|---|---|---|---|---|---|---|---|
|
Count
|
Value
|
95%
Lower CI |
95%
Upper CI |
||||
| 2011 - 13 | • | - | 11.9 | 10.3 | 13.4 | 9.7 | 9.1 |
| 2012 - 14 | • | - | 11.7 | 10.1 | 13.2 | 9.8 | 9.1 |
| 2013 - 15 | • | - | 11.2 | 9.7 | 12.7 | 10.1 | 9.3 |
| 2014 - 16 | • | - | 11.7 | 10.2 | 13.2 | 10.5 | 9.5 |
| 2015 - 17 | • | - | 12.0 | 10.5 | 13.5 | 10.6 | 9.6 |
| 2016 - 18 | • | - | 12.7 | 11.3 | 14.1 | 10.6 | 9.6 |
| 2017 - 19 | • | - | 12.1 | 10.6 | 13.5 | 10.7 | 9.5 |
| 2018 - 20 | • | - | 12.3 | 10.9 | 13.7 | 11.0 | 9.9 |
| 2019 - 21 | • | - | 12.5 | 11.0 | 14.0 | 11.7 | 10.3 |
| 2020 - 22 | • | - | 13.5 | 11.8 | 15.1 | 12.0 | 10.7 |
| 2021 - 23 | • | - | 12.6 | 11.0 | 14.2 | 12.0 | 10.5 |
| 2022 - 24 | • | - | 12.7 | 11.2 | 14.2 | 12.1 | 10.4 |
Source: OHID, based on Ministry of Housing, Communities and Local Government and Office for National Statistics data
Male life expectancy at birth has decreased between 2013-15 and 2023-25 across four of the local deprivation fifths, with the largest decrease among men living in the third most deprived fifth of areas of Hull. Life expectancy decreased by 0.5 years, 2.1 years, 2.4 years and 1.3 years for men living in the most deprived fifth, second most deprived fifth, middle fifth most deprived and second least deprived fifth of areas of Hull respectively. Only among men living in the least deprived fifth of areas of Hull was a small increase in life expectancy of 0.3 years found over this period.
The difference in male life expectancy at birth between men living in the most deprived fifth of areas of Hull compared to the least deprived fifth of areas of Hull has varied from 8.3 years to 10.1 years between 2013-15 and 2023-25. The inequalities gap was 9.0 years for 2013-15 but decreased to a low of 8.3 years in 2014-16, before increasing to 9.1 years in 2017-19 prior to the pandemic. the inequalities gap then increased to 9.3 years, 9.8 years and 10.1 years for 2018-20, 2019-21 and 2020-22 respectively, before decreasing to 9.6 years for 2021-23 and 2022-24, before increasing to 9.8 years for 2023-25.
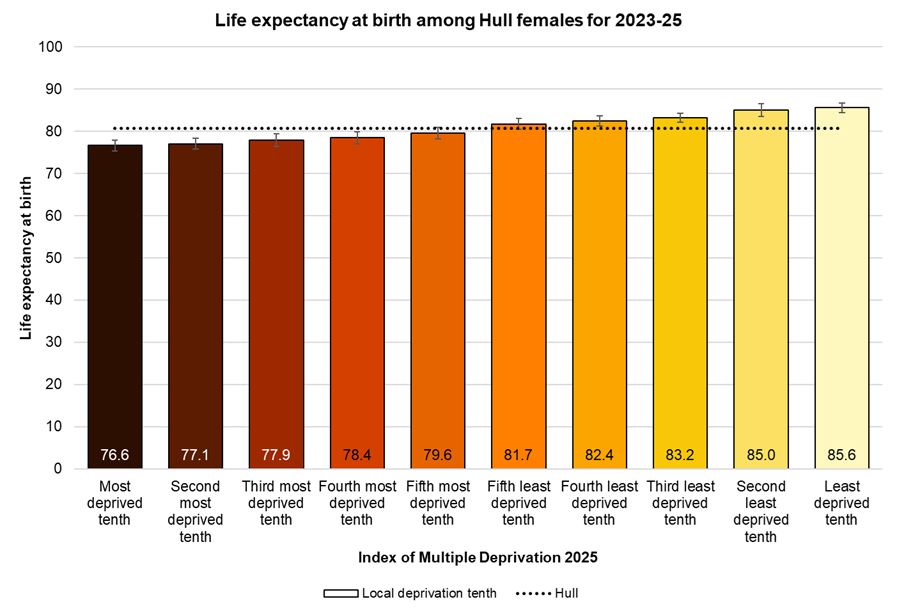
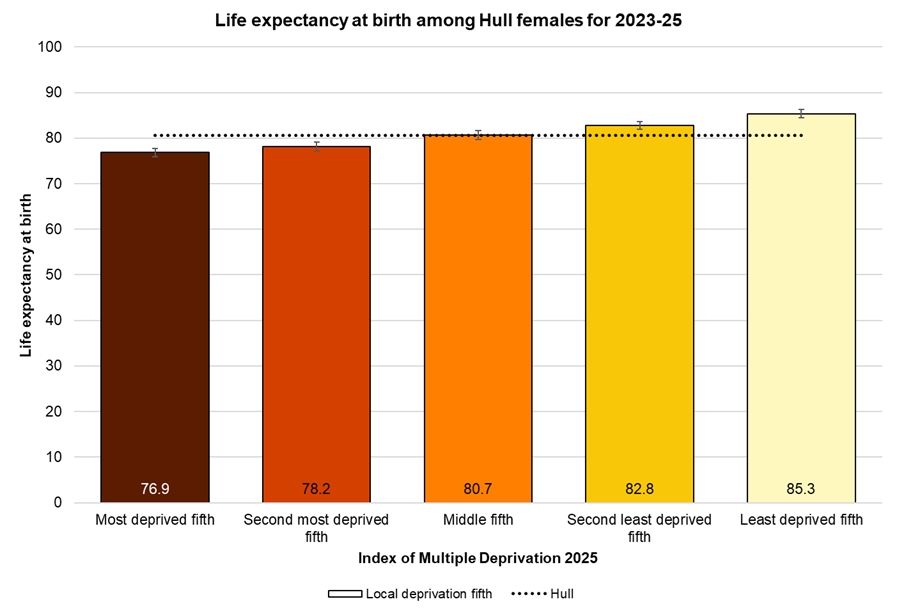
Latest Estimates for Women
It can be seen that there is also a clear trend in life expectancy at birth among Hull women based on where they live. Life expectancy at birth among women living in the most deprived tenth of areas of Hull is 76.6 years compared to 85.6 for women living in the least deprived tenth of areas of Hull for 2023-28. This is a difference of 9.0 years.
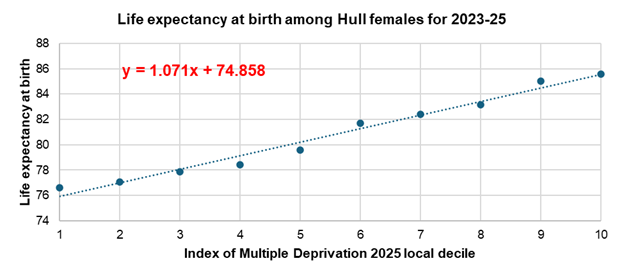
The Slope Index of Inequality is also presented on Fingertips. This is a measure of the difference in life expectancy at birth between the most deprived and least deprived tenths of areas of the local authority, but it is not a straightforward difference between the most and least deprived tenth but uses the information from all ten data points by using linear regression and calculating the ‘slope’ of the line.
The locally calculated Slope Index of Inequality is 9.6 years for females as the estimated female life expectancy at birth for people living in the most deprived tenth of areas of Hull is 74.858 + 1 x 1.071 or 75.9 years compared to 74.858 + 10 x 1.071 or 85.6 years for people living in the least deprived tenth of areas of Hull. This equates to a Slope Index of Inequality of 9.6 years for women in Hull for 2023-25.
When comparing local deprivation fifths, the gap in female life expectancy at birth is 8.4 years, lower among women living in the most deprived fifth of areas of Hull compared to women living in the least deprived fifth of areas of Hull for 2023-25.
Trends Over Time Among Women
The local calculations of the Slope Index of Inequality show an increase between 2013-15 and 2023-25 for women based on the Index of Multiple Deprivation 2025.
| Period | Female life expectancy among most deprived tenth | Female life expectancy among least deprived tenth | Slope | Intercept | Slope Index of Inequality |
| 2013-15 | 76.1 | 83.6 | 0.96 | 75.3 | 8.6 |
| 2014-16 | 76.3 | 83.9 | 0.98 | 75.1 | 8.8 |
| 2015-17 | 76.4 | 84.0 | 0.95 | 75.1 | 8.6 |
| 2016-18 | 76.5 | 85.4 | 0.90 | 75.6 | 8.1 |
| 2017-19 | 76.2 | 85.1 | 0.86 | 75.8 | 7.8 |
| 2018-20 | 76.7 | 85.4 | 0.89 | 75.6 | 8.0 |
| 2019-21 | 76.5 | 85.4 | 0.91 | 75.1 | 8.2 |
| 2020-22 | 76.1 | 84.3 | 0.98 | 74.6 | 8.8 |
| 2021-22 | 76.2 | 85.1 | 1.03 | 74.5 | 9.3 |
| 2022-24 | 76.2 | 85.8 | 1.11 | 74.4 | 10.0 |
| 2023-25 | 76.6 | 85.6 | 1.07 | 74.9 | 9.6 |
The trends over time for the Slope Index of Inequality is also presented on Fingertips for females, although is based on the Index of Multiple Deprivation 2019 so will differ from the local calculations above.
The same pattern is evident though with an increase between 2011-13 and 2022-24, although for females the highest inequalities gap occurred during 2014-16 and 2015-17 when the Slope Index of Inequality was 10.7 years with the second highest inequalities gap for 2021-23 at 10.5 years.
Compared with benchmark
Inequality in life expectancy at birth (Female All ages)
|
Period
|
Kingston upon Hull |
Yorkshire and the Humber region (statistical)
|
England
|
||||
|---|---|---|---|---|---|---|---|
|
Count
|
Value
|
95%
Lower CI |
95%
Upper CI |
||||
| 2011 - 13 | • | - | 9.8 | 7.6 | 11.9 | 7.6 | 6.9 |
| 2012 - 14 | • | - | 9.5 | 7.8 | 11.2 | 7.8 | 6.9 |
| 2013 - 15 | • | - | 10.4 | 8.8 | 11.9 | 8.1 | 7.1 |
| 2014 - 16 | • | - | 10.7 | 9.2 | 12.2 | 8.1 | 7.3 |
| 2015 - 17 | • | - | 10.7 | 9.1 | 12.4 | 8.4 | 7.4 |
| 2016 - 18 | • | - | 10.1 | 8.5 | 11.7 | 8.5 | 7.5 |
| 2017 - 19 | • | - | 9.8 | 8.1 | 11.5 | 8.5 | 7.5 |
| 2018 - 20 | • | - | 9.4 | 7.9 | 10.9 | 8.8 | 7.8 |
| 2019 - 21 | • | - | 10.3 | 8.6 | 12.1 | 9.4 | 8.3 |
| 2020 - 22 | • | - | 10.2 | 8.7 | 11.7 | 9.9 | 8.5 |
| 2021 - 23 | • | - | 10.5 | 9.1 | 12.0 | 9.7 | 8.3 |
| 2022 - 24 | • | - | 11.0 | 9.6 | 12.4 | 9.5 | 8.0 |
Source: OHID, based on Ministry of Housing, Communities and Local Government and Office for National Statistics data
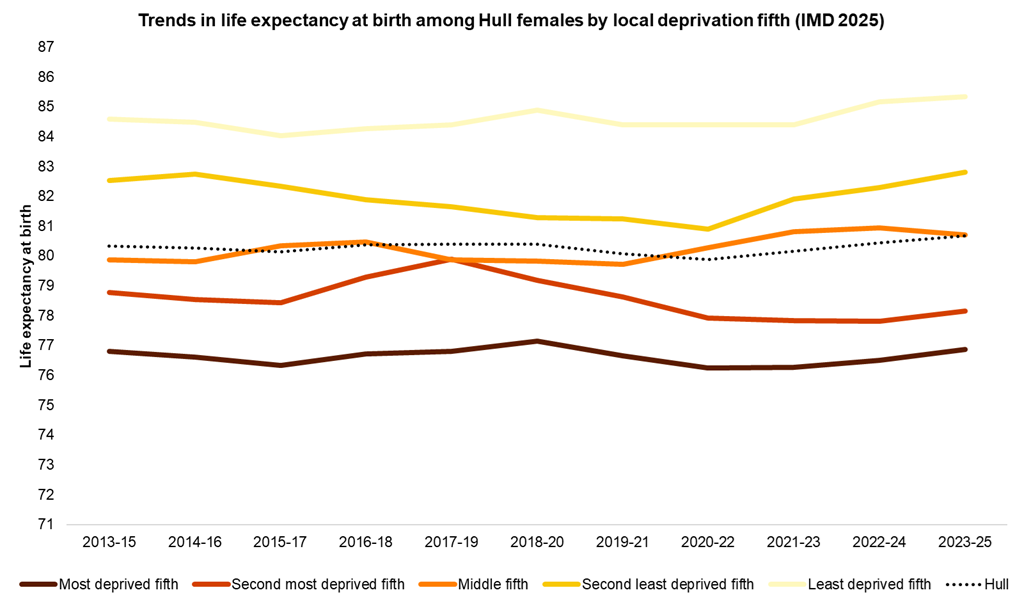
Female life expectancy at birth has decreased between 2012-14 and 2022-24 for women living in the second most deprived fifth of areas of Hull by 0.6. Life expectancy at birth increased among women living in the other four deprivation fifths, by 0.1 years in the most deprived fifth, by 0.8 years for women living in the middle fifth, by 0.3 years in the second least deprived fifth and by 0.7 years in the least deprived fifth of areas of Hull.
The difference in female life expectancy at birth between women living in the most deprived fifth of areas of Hull compared to the least deprived fifth of areas of Hull has steadily increased from 7.8 years in 2013-15 to 7.9 years in 2014-16 before decreasing to 7.6 years prior to the pandemic for 2017-19. The inequalities gap among women in Hull has increased relatively sharply between 2017-19 and 2022-24 to 8.7 years in 2022-24, remaining high at 8.5 years in 2023-25. The inequalities gap for 2023-24 is the second largest it has been in the past ten years, having been slightly higher in 2022-24 at 8.7 years.
Life Expectancy at Birth Among Hull’s Wards
Association with Deprivation
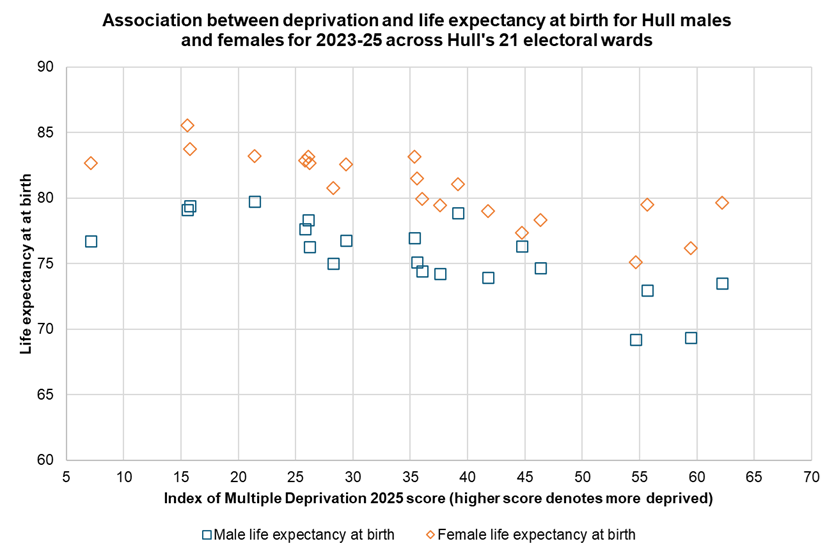
There are considerable differences in life expectancy across Hull’s 21 electoral wards with a gap between the wards with the highest and lowest life expectancies at birth of 10.5 years for men and 10.4 years for women in Hull for deaths registered during 2023-25.
When linked to ward rankings based on the Index of Multiple Deprivation 2025 these inequalities tend to follow a trend of wards with the lowest deprivation ranking having some of the highest average life expectancies and wards with the highest deprivation ranking having some of the lowest life expectancies (although there were some exceptions to this trend).
On average (based on linear regression), life expectancy at birth for 2023-25 was 1.5 years lower for men and 1.5 years lower women for every 10 unit increase in the ward deprivation score.
Latest Estimates for Men
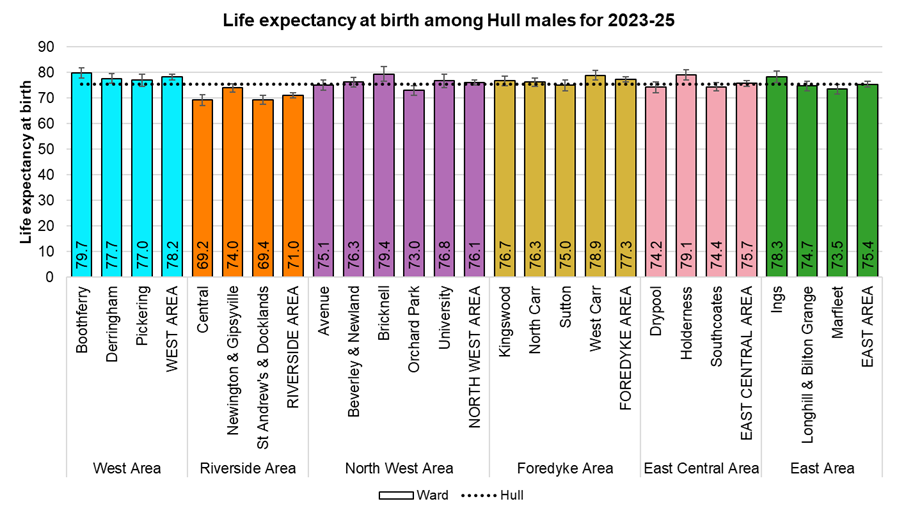
Male life expectancy at birth for 2023-25 varied from 69.2 years in Central ward to 79.7 years in Boothferry ward. Life expectancy at birth was lowest for men living in Central, St Andrew’s & Docklands, Newington & Gipsyville, Orchard Park and Marfleet.
Trends Over Time Among Men
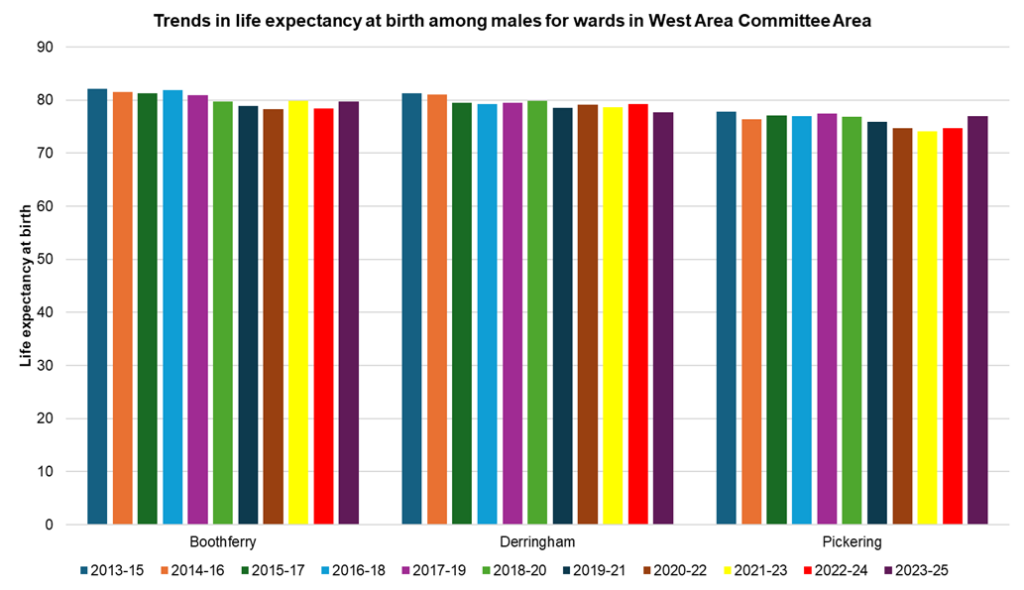
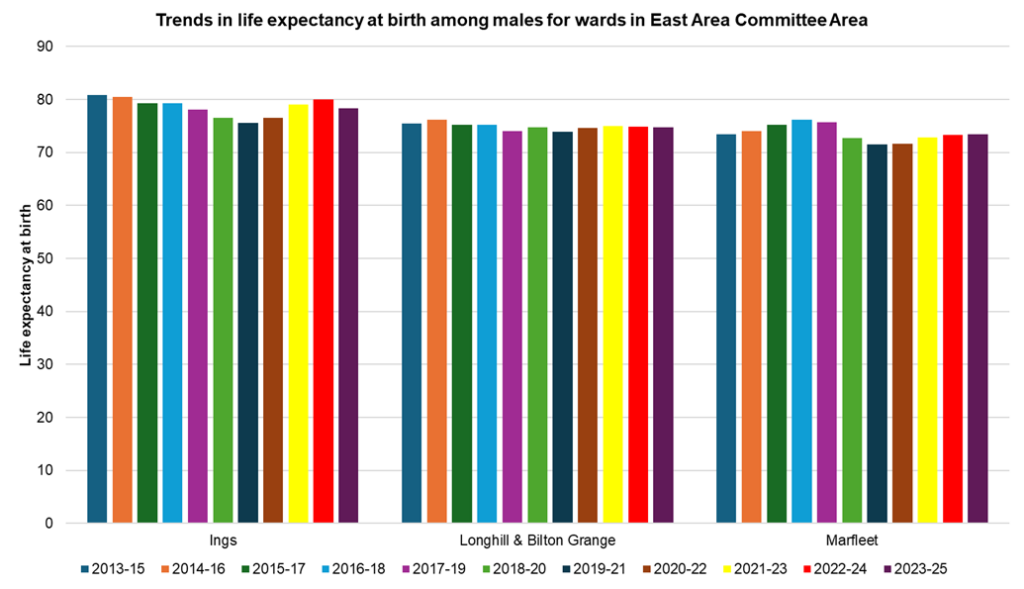
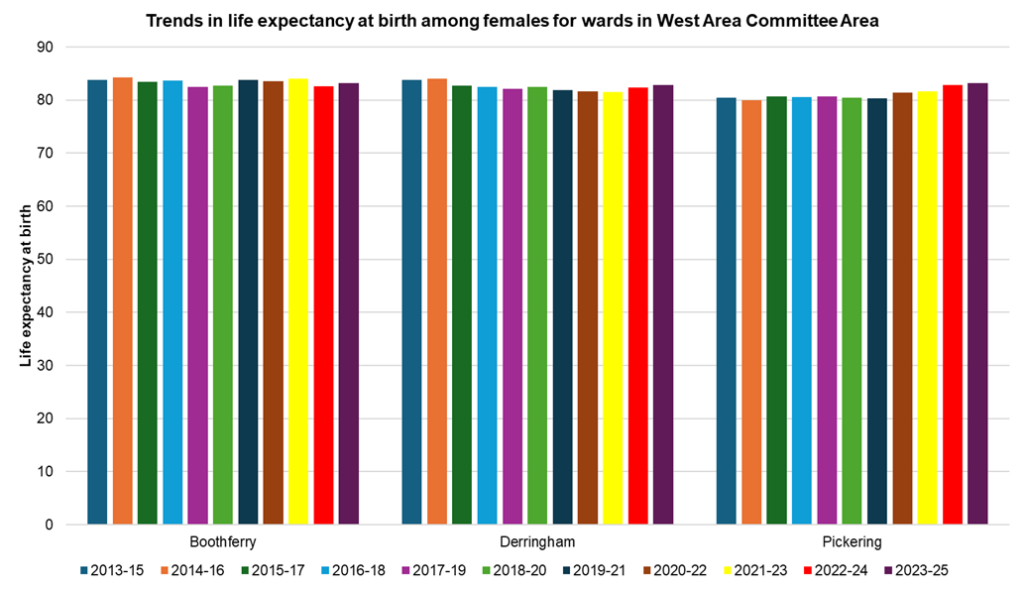
The charts below illustrate the trends in male life expectancy across Hull’s wards for West, Riverside, North West, Foredyke, East Central and East Area Committee Areas between 2013-15 and 2023-25 (rolling average).
Male life expectancy decreased between 2013-15 and 2023-25 for all wards in West Area Committee Area. Male life expectancy at birth decreased by 3.7 years for Derringham, by 2.4 years for Boothferry and by 0.9 years for Pickering.
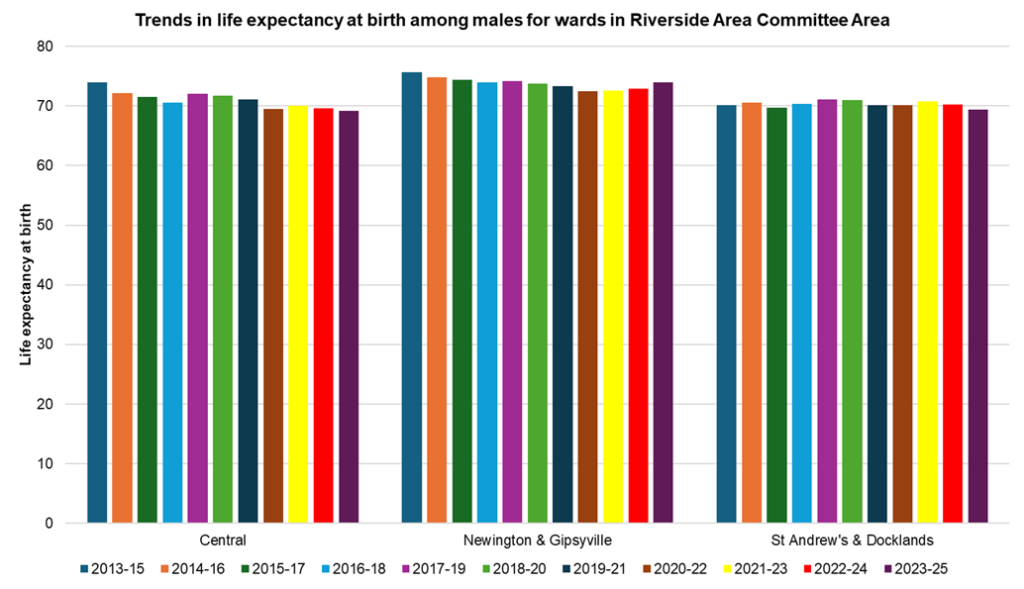
Male life expectancy decreased between 2013-15 and 2023-25 for all wards in Riverside Area Committee Area. Male life expectancy at birth decreased by 4.7 years for Central, by 1.7 years for Newington & Gipsyville and by 0.7 years for St Andrew’s & Docklands.
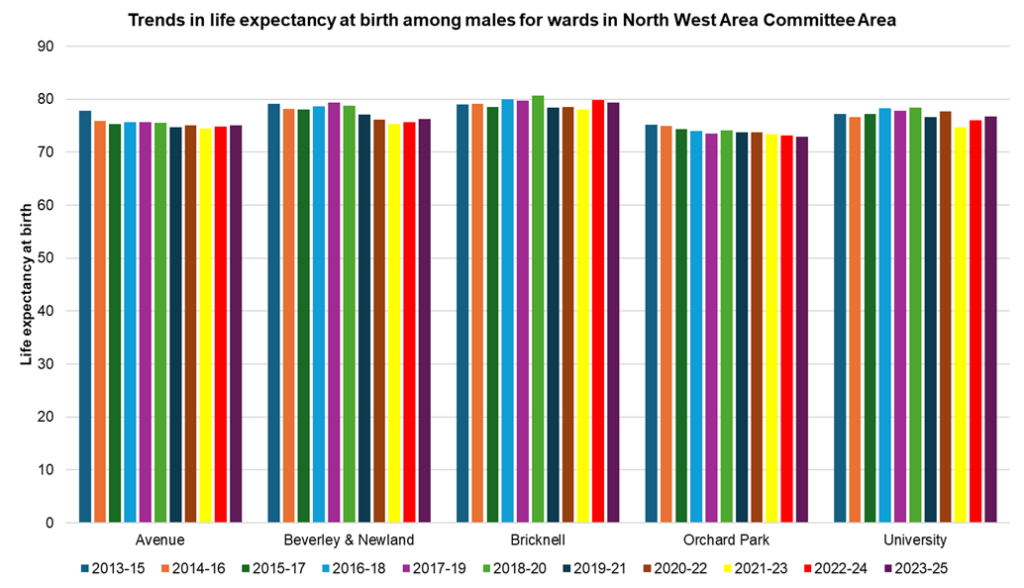
Male life expectancy at birth decreased for four of the five wards in North West Area Committee Area between 2013-15 and 2023-25. Male life expectancy at birth decreased by 2.8 years for Beverley & Newland, by 2.7 years for Avenue, by 2.2 years for Orchard Park and by 0.5 years for University. Male life expectancy at birth increased between 2013-15 and 2023-25 for Bricknell by 0.5 years.
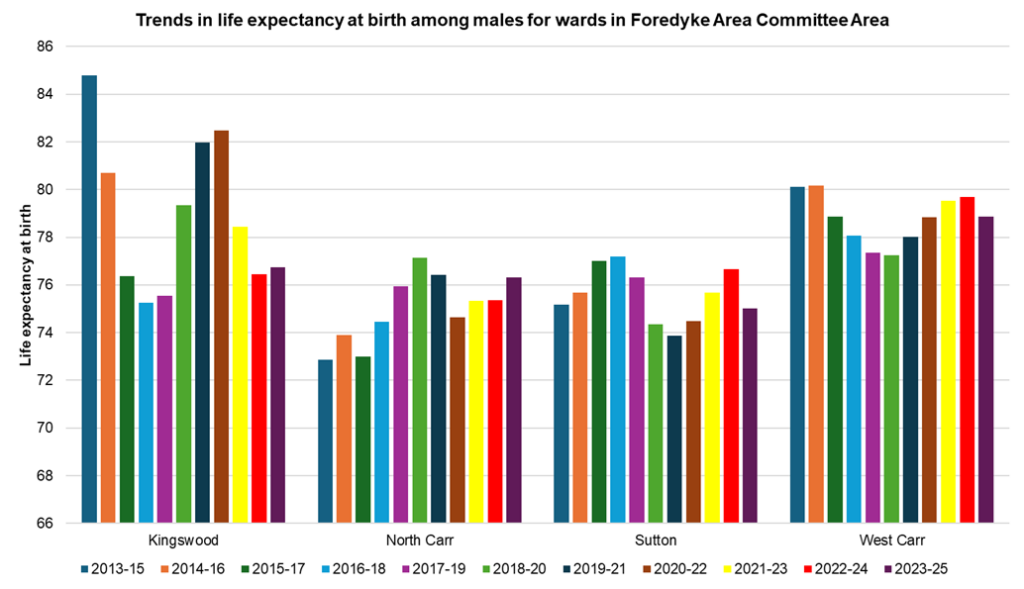
Male life expectancy decreased between 2013-15 and 2023-25 for three of the four wards in Foredyke Area Committee Area. Male life expectancy decreased in Kingswood by 8.1 years, but the confidence intervals were wide for 2013-15 (76.4 to 93.2 years) and 2014-16 (73.2 to 88.3 years). This denotes uncertainty around the life expectancy estimates for these earlier periods which was associated with the relatively low number of deaths and the population, particularly in the older ages. Between 2012-14 and 2022-24, male life expectancy at birth also decreased in West Carr by 1.3 years and in Sutton by 0.2 years. Conversely, male life expectancy at birth increased between 2013-15 and 2023-25 in North Carr by 3.4 years.
Male life expectancy decreased between 203-15 and 2023-25 for two wards in East Central Area Committee Area. Male life expectancy decreased in Southcoates by 3.5 years and in Drypool by 3.0 years. Male life expectancy increased in Holderness by 0.4 years.
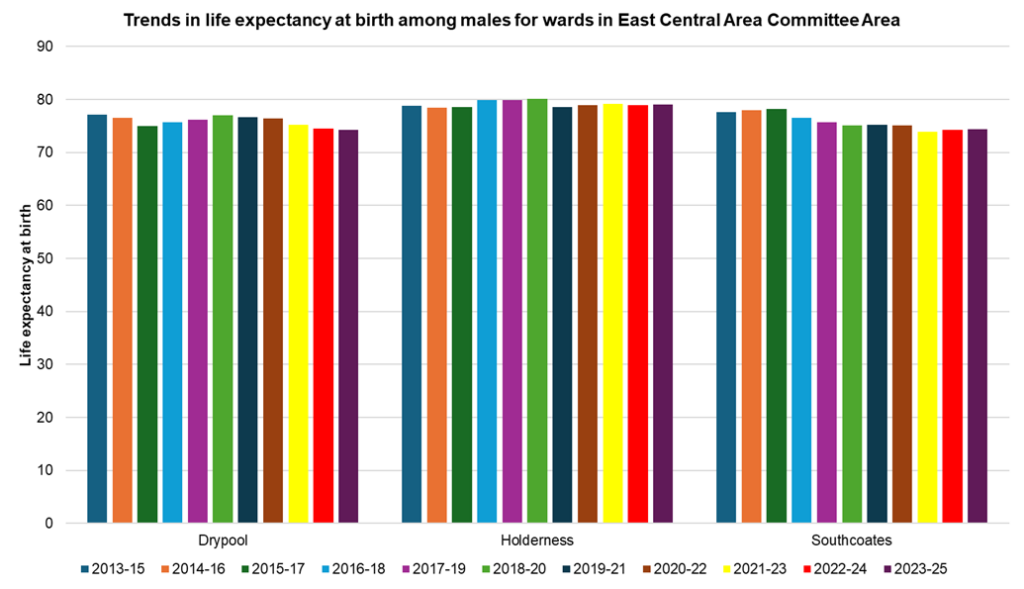
Male life expectancy decreased between 2013-15 and 2023-25 for two wards in East Area Committee Area. Male life expectancy at birth decreased between by 2.5 years for Ings and by 0.8 years for Longhill & Bilton Grange. Male life expectancy remained unchanged for Marfleet.
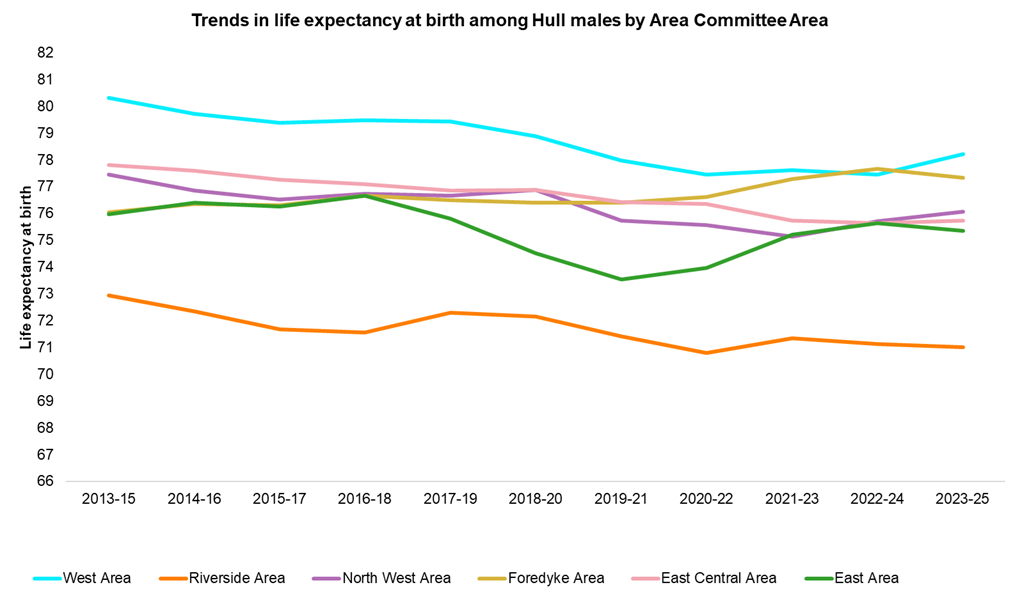
Between 2013-15 and 2023-25, male life expectancy increased for just one Area Committee Area, up by 1.3 years in Foredyke. Decreases in the other five Area Committee Areas ranged from 0.6 years in East to 2.1 years in West. Decreases of 2.1 years were seen for East Central, 1.9 years for Riverside and 1.4 years for North West.
Life expectancy at birth among males in Riverside is consistently lower than for each other Area Committee Area, between 2.1 and 5.1 years lower than the Area committee Area with the next lowest life expectancy. Conversely male life expectancy in West has been consistently higher than each other Area Committee Area, with the exception of 2022-24 when it was overtaken by Foredyke. Difference between the remaining four Area Committee Areas were generally between one and three years.
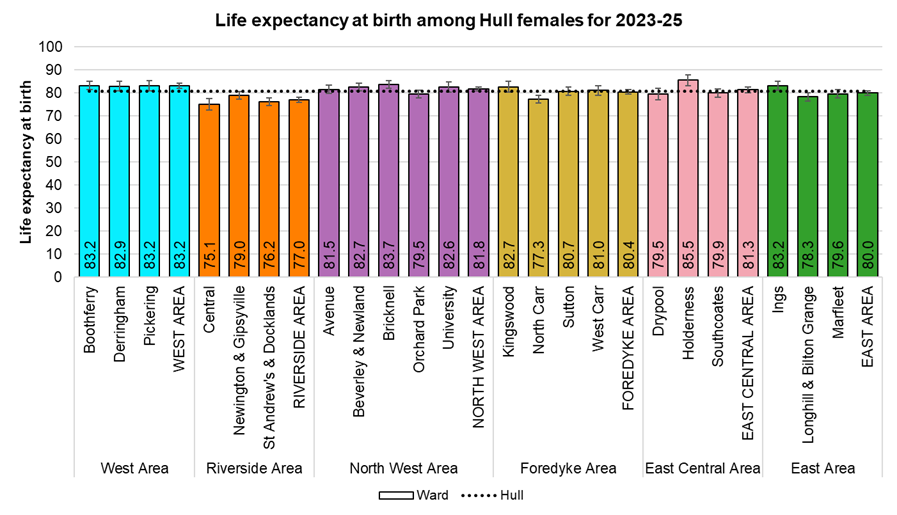
Latest Estimates for Women
For 2023-25, female life expectancy at birth varied between 75.1 years in Central to 85.5 years in Holderness. Life expectancy at birth was lowest for women living in Central, St Andrew’s & Docklands, Marfleet, North Carr, and Newington & Gipsyville.
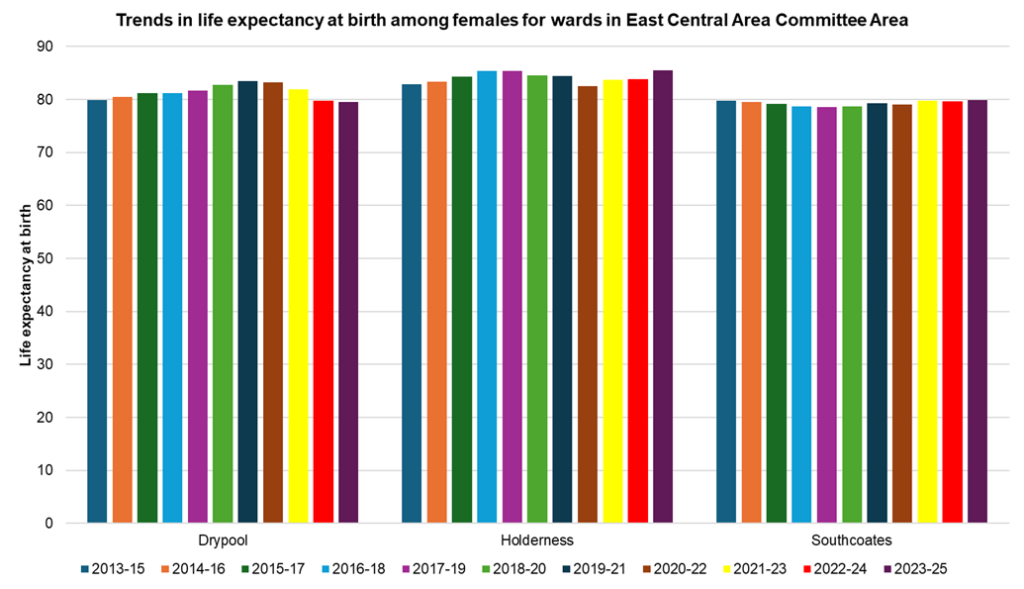
Trends Over Time Among Women
For females living in West Area Committee Area, life expectancy at birth decreased between 2013-15 and 2023-25 in Derringham by 0.9 years and in Boothferry by 0.6 years. By contrast, female life expectancy at birth increased for Pickering by 2.7 years.
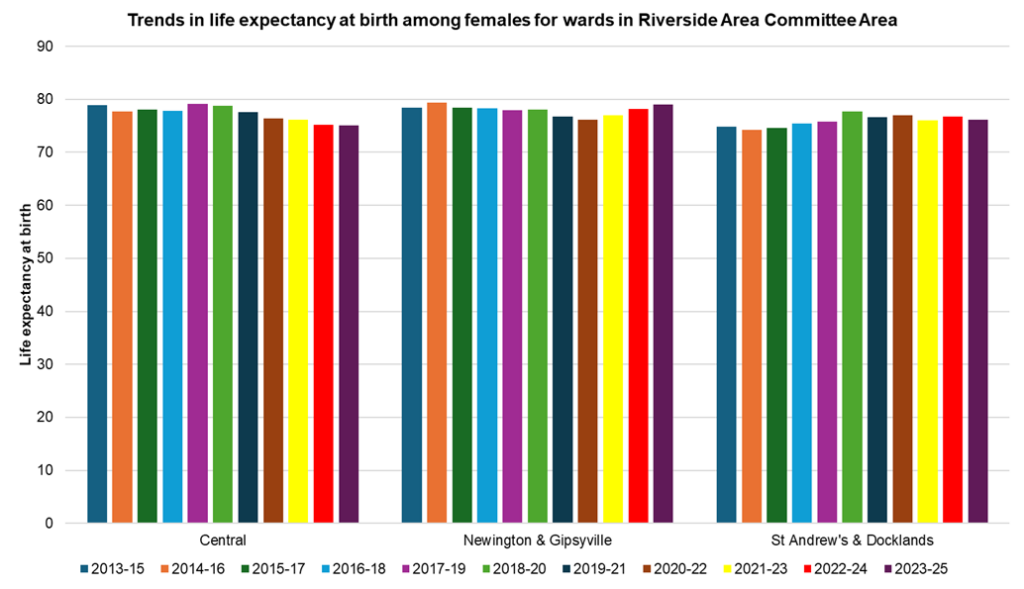
Between 2013-15 and 2023-25 in Riverside Area Committee Area, female life expectancy at birth decreased in Central by 3.8 years. By contrast, female life expectancy at birth increased by 1.4 years in St Andrew’s & Docklands and by 0.6 years in Newington & Gipsyville.
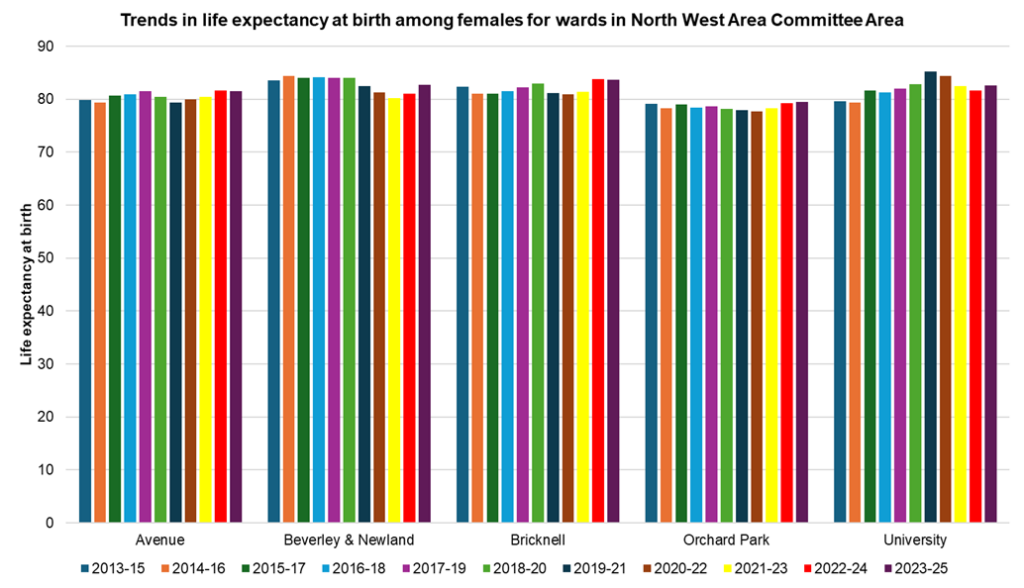
Across North West Area Committee, female life expectancy increased between 2013-15 and 2023-25 in four of the five wards. Female life expectancy increased by 3.0 years in University, by 1.6 years in Avenue, by 1.3 years in Bricknell and by 0.3 years in Orchard Park. The only ward in North West Area Committee Area to see female life expectancy at birth decrease over this period was Beverley & Newland, where it decreased by 0.9 years.
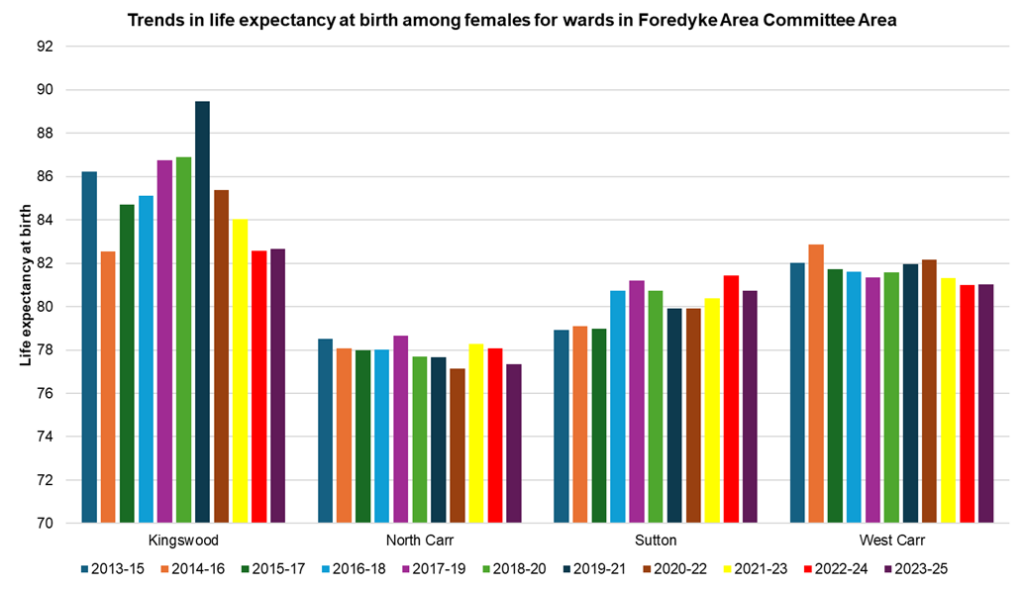
Within Foredyke Area Committee Area female life expectancy at birth fell between 2013-15 and 2023-25 in three of the four wards. Female life expectancy at birth decreased by 3.6 years in Kingswood, by 1.2 years in North Carr and by 1.0 years in West Carr. Over this same period, female life expectancy at birth increased by 1.8 years in Sutton.
Among the three wards in East Central Area Committee Area, a small decrease in female life expectancy at birth between 2013-15 and 2023-25 was seen in Drypool (down by 0.4 years), while female life expectancy at birth increased in Holderness by 2.7 years, and a very small increase of 0.1 years was seen in Southcoates.
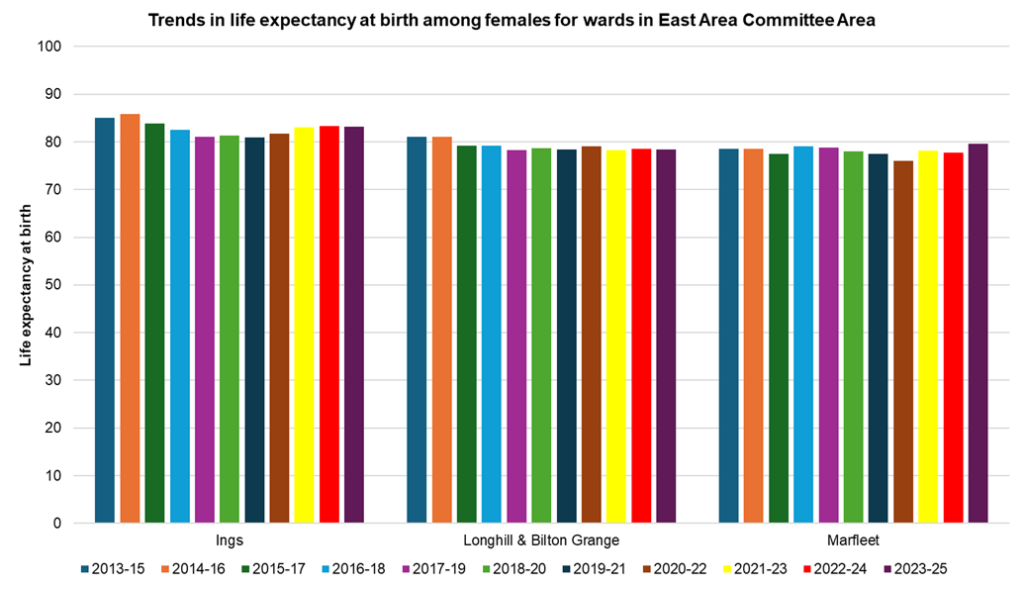
Female life expectancy at birth decreased in two of the three wards in East Area Committee Area between 2013-15 and 2023-25. Female life expectancy at birth decreased by 2.8 years in Longhill & Bilton Grange and by 1.9 years in Ings. By contrast, female life expectancy at birth increased by 1.1 years in Marfleet.
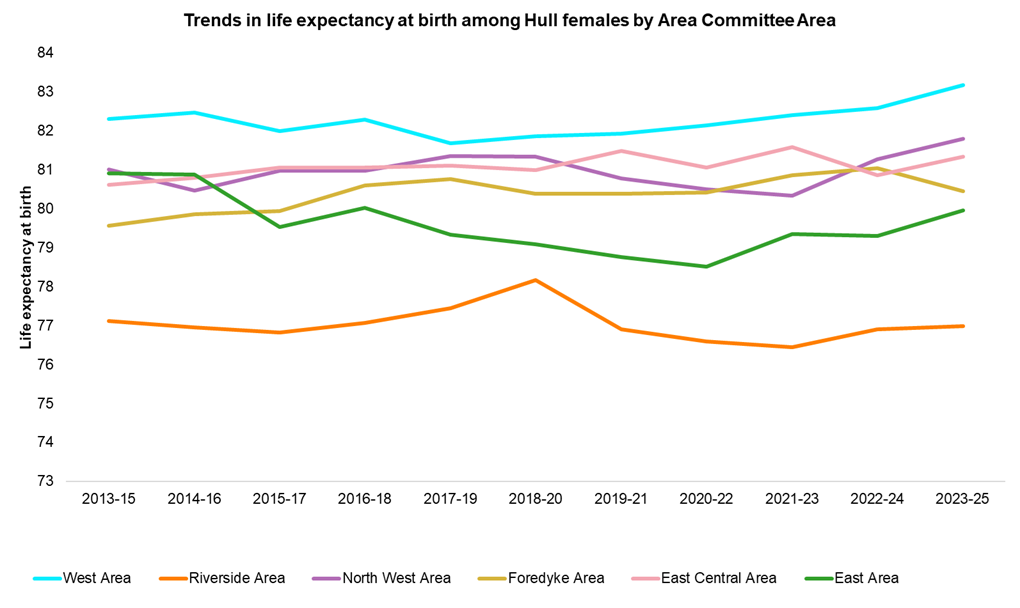
In general, the inequalities gap in female life expectancy at birth among the six Area Committee Areas has remained fairly consistent over the last 10 years at between around five and six years. Female life expectancy at birth has been consistently lower in Riverside Area Committee Area (between 1 and 3 years lower than the second lowest area), and consistently higher in West Area Committee.
Between 2013-15 and 2023-25, female life expectancy has decreased for two of the six Area Committee Areas, decreasing by 1.0 years in East and by a marginal 0.1 years in Riverside. Female life expectancy at birth increased over this period by 0.9 years in West, 0.9 years in Foredyke, 0.8 years in North West and 0.7 years in East Central.
Healthy Life Expectancy At Birth
Latest Estimates for Men and Women
Healthy life expectancy is a measure of the average number of years a person would expect to live in good health based on contemporary mortality rates and prevalence of self-reported ‘good’ health. Healthy life expectancy is lower in Hull compared to England, and furthermore, when comparing life expectancy and healthy life expectancy, people in Hull live a shorter time in good health.
Healthy life expectancy at birth is 53.1 years for men and 53.3 years for women in Hull for 2022-24. This is lower than for England by 7.8 years for men and 8.0 years for women.
Compared with benchmark
| Indicator | Period | England | Yorkshire and the Humber region (statistical) | Kingston upon Hull | East Riding of Yorkshire | North East Lincolnshire | North Lincolnshire | York | North Yorkshire UA | Barnsley | Doncaster | Rotherham | Sheffield | Bradford | Calderdale | Kirklees | Leeds | Wakefield |
|---|---|---|---|---|---|---|---|---|---|---|---|---|---|---|---|---|---|---|
Healthy life expectancy at birth (Male All ages) | 2022 - 24 | 60.9 | 58.2 | 53.1 | 59.5 | 54.7 | 58.7 | 60.8 | 64.5 | 55.2 | 55.1 | 55.6 | 57.4 | 57.4 | 60.2 | 57.8 | 60.4 | 54.0 |
Healthy life expectancy at birth (Female All ages) | 2022 - 24 | 61.3 | 58.6 | 53.3 | 59.5 | 54.9 | 59.6 | 61.4 | 65.4 | 55.3 | 55.4 | 55.1 | 57.4 | 58.2 | 60.9 | 58.0 | 60.9 | 53.8 |
Trends Over Time Among Men
Examining trends over time show that healthy life expectancy at birth has remained relatively static with more apparent changes in the last couple of years.
Between 2011-13 and 2017-19, healthy life expectancy among Hull men increased slightly from 56.3 to 57.8 years, but decreased to a low of 53.8 years for 2020-22. There has been a slight recovery to 54.3 years for 2021-22 as the excess deaths (mainly from COVID-19) from the year 2020 are no longer included. Nevertheless, in the last ten years, healthy life expectancy among Hull men has reduced by 2.0 years representing a decrease of 3.6%.
Over the same period, male healthy life expectancy has decreased by 2.1 years across the region (-3.6%) and by 1.5 years for England (-2.4%). Over the entire period, the inequalities gap between Hull and England has increased.
Between 2021-23 and 2022-24, healthy life expectancy at birth has decreased by 1.2 years for Hull men to 53.1 years and by 0.6 years for men in England to 60.9 years.
Compared with benchmark
Healthy life expectancy at birth (Male All ages)
|
Period
|
Kingston upon Hull |
Yorkshire and the Humber region (statistical)
|
England
|
||||
|---|---|---|---|---|---|---|---|
|
Count
|
Value
|
95%
Lower CI |
95%
Upper CI |
||||
| 2011 - 13 | • | - | 56.3 | 54.0 | 58.7 | 60.9 | 63.0 |
| 2012 - 14 | • | - | 56.3 | 53.8 | 58.8 | 61.0 | 63.2 |
| 2013 - 15 | • | - | 56.4 | 53.9 | 58.9 | 61.3 | 63.2 |
| 2014 - 16 | • | - | 56.2 | 53.6 | 58.7 | 61.0 | 63.3 |
| 2015 - 17 | • | - | 57.3 | 54.9 | 59.6 | 61.5 | 63.3 |
| 2016 - 18 | • | - | 56.9 | 54.5 | 59.4 | 61.2 | 63.3 |
| 2017 - 19 | • | - | 57.8 | 55.2 | 60.3 | 61.2 | 63.2 |
| 2018 - 20 | • | - | 56.1 | 53.0 | 59.1 | 61.2 | 63.1 |
| 2019 - 21 | • | - | 55.6 | 51.9 | 59.4 | 60.5 | 62.7 |
| 2020 - 22 | • | - | 53.8 | 50.3 | 57.4 | 60.1 | 62.3 |
| 2021 - 23 | • | - | 54.3 | 50.2 | 58.4 | 58.8 | 61.5 |
| 2022 - 24 | • | - | 53.1 | 48.5 | 57.7 | 58.2 | 60.9 |
Source: Office for National Statistics
Trends Over Time Among Women
Healthy life expectancy increased among women between 2011-13 and 2017-19 by 1.5 years, but has since fallen to a low of 53.2 years for 2020-22, although as for men, the female healthy life expectancy has recovered to 54.6 years for 2021-23. Despite the increase in the last year, over the entire ten year period, healthy life expectancy among Hull women has reduced by 2.4 years representing a decrease of 4.2%.
Over the same period, female healthy life expectancy has decreased by 2.3 years across the region (-3.7%) and by 2.0 years for England (-3.1%).
Between 2021-23 and 2022-24, healthy life expectancy at birth has decreased by 1.3 years for Hull women to 53.3 years and by 1.0 years for women in England to 61.3 years.
Compared with benchmark
Healthy life expectancy at birth (Female All ages)
|
Period
|
Kingston upon Hull |
Yorkshire and the Humber region (statistical)
|
England
|
||||
|---|---|---|---|---|---|---|---|
|
Count
|
Value
|
95%
Lower CI |
95%
Upper CI |
||||
| 2011 - 13 | • | - | 57.0 | 54.6 | 59.3 | 61.7 | 63.9 |
| 2012 - 14 | • | - | 56.7 | 54.3 | 59.1 | 61.7 | 63.9 |
| 2013 - 15 | • | - | 56.6 | 54.1 | 59.0 | 61.9 | 64.2 |
| 2014 - 16 | • | - | 56.5 | 53.9 | 59.1 | 61.7 | 64.0 |
| 2015 - 17 | • | - | 57.2 | 54.4 | 59.9 | 61.7 | 64.0 |
| 2016 - 18 | • | - | 57.7 | 54.7 | 60.7 | 62.1 | 64.1 |
| 2017 - 19 | • | - | 58.5 | 55.4 | 61.6 | 61.9 | 63.7 |
| 2018 - 20 | • | - | 56.5 | 53.0 | 60.0 | 62.0 | 64.0 |
| 2019 - 21 | • | - | 56.0 | 52.3 | 59.6 | 61.0 | 63.7 |
| 2020 - 22 | • | - | 53.2 | 49.4 | 57.1 | 60.1 | 62.8 |
| 2021 - 23 | • | - | 54.6 | 50.5 | 58.7 | 59.3 | 61.9 |
| 2022 - 24 | • | - | 53.3 | 49.2 | 57.5 | 58.6 | 61.3 |
Source: Office for National Statistics
It is possible to examine the life expectancy and healthy life expectancy, to estimate the number of years a person will live in ‘not good’ health.
Percentage of Live Spent Not in ‘Good’ Health
For 2022-24, male healthy life expectancy was 53.1 years and life expectancy at birth was 75.5 years, so it is estimated that men spend 22.4 years of their life not in ‘good’ health which represents 29.7% of their lives (18.6 years for England representing 23.3% of their lives). For women, healthy life expectancy was 53.3 years and life expectancy at birth was 80.4 years, so it is estimated that women spend 27.1 years of their life not in ‘good’ health representing 33.8% of their lives (22.0 years for England representing 26.4% of their lives).
Life Expectancy at Age 65 Years
Latest Estimates for Men and Women
Life expectancy estimates are also available at age 65 years. Contemporary mortality rates will be more comparable to the actual mortality rates in future over the next 15-20 years, so life expectancy at age 65 years will be a more accurate estimate of the additional life expectancy or duration of life among those currently aged 65 years.
Life expectancy at aged 65 years is 16.8 years for men and 19.7 years for women in Hull for 2023-25. These are 2.3 years and 1.8 years lower than for England for men and women respectively.
Compared with benchmark
| Indicator | Period | England | Yorkshire and the Humber region (statistical) | Kingston upon Hull | East Riding of Yorkshire | North East Lincolnshire | North Lincolnshire | York | North Yorkshire UA | Barnsley | Doncaster | Rotherham | Sheffield | Bradford | Calderdale | Kirklees | Leeds | Wakefield |
|---|---|---|---|---|---|---|---|---|---|---|---|---|---|---|---|---|---|---|
Life expectancy at 65 (Male 65) | 2023 - 25 | 19.1 | 18.6 | 16.8 | 19.4 | 17.5 | 18.1 | 19.4 | 19.9 | 18.2 | 17.9 | 18.3 | 18.5 | 18.0 | 18.7 | 18.6 | 18.5 | 18.0 |
Life expectancy at 65 (Female 65) | 2023 - 25 | 21.5 | 20.9 | 19.7 | 21.6 | 20.6 | 20.9 | 21.7 | 22.2 | 20.2 | 20.2 | 20.2 | 20.7 | 20.6 | 20.7 | 20.8 | 21.1 | 20.2 |
Trends Over Time Among Men
Life expectancy among Hull men at the age of 65 years gradually increased from 15.2 years in 2001-03 to a high of 16.8 years in 2012-14 decreasing slightly to 16.6 years in 2017-19 prior to the pandemic. Male life expectancy fell to 16.2 years for 2019-21 but has increased slightly since and is now 0.2 years higher than pre-pandemic levels.
Between 2001-03 and 2023-25, male life expectancy at age 65 years has increased in Hull by 1.6 years (10.5%) although across the region there was a 2.7 years increase (17.0%) and in England the increase was 2.8 years (17.2%).
Compared with benchmark
Life expectancy at 65 (Male 65)
|
Period
|
Kingston upon Hull |
Yorkshire and the Humber region (statistical)
|
England
|
||||
|---|---|---|---|---|---|---|---|
|
Count
|
Value
|
95%
Lower CI |
95%
Upper CI |
||||
| 2001 - 03 | • | - | 15.2 | 14.9 | 15.5 | 15.9 | 16.3 |
| 2002 - 04 | • | - | 15.4 | 15.1 | 15.7 | 16.1 | 16.5 |
| 2003 - 05 | • | - | 15.5 | 15.2 | 15.8 | 16.4 | 16.8 |
| 2004 - 06 | • | - | 15.7 | 15.4 | 16.0 | 16.7 | 17.1 |
| 2005 - 07 | • | - | 15.8 | 15.5 | 16.1 | 16.9 | 17.3 |
| 2006 - 08 | • | - | 15.9 | 15.6 | 16.2 | 17.1 | 17.5 |
| 2007 - 09 | • | - | 16.0 | 15.6 | 16.3 | 17.3 | 17.7 |
| 2008 - 10 | • | - | 16.3 | 16.0 | 16.6 | 17.4 | 18.0 |
| 2009 - 11 | • | - | 16.4 | 16.1 | 16.8 | 17.7 | 18.2 |
| 2010 - 12 | • | - | 16.8 | 16.5 | 17.1 | 17.9 | 18.4 |
| 2011 - 13 | • | - | 16.8 | 16.5 | 17.1 | 17.9 | 18.5 |
| 2012 - 14 | • | - | 16.8 | 16.5 | 17.1 | 18.1 | 18.6 |
| 2013 - 15 | • | - | 16.7 | 16.4 | 17.0 | 18.1 | 18.6 |
| 2014 - 16 | • | - | 16.6 | 16.3 | 16.9 | 18.2 | 18.7 |
| 2015 - 17 | • | - | 16.5 | 16.2 | 16.8 | 18.2 | 18.7 |
| 2016 - 18 | • | - | 16.6 | 16.3 | 16.8 | 18.2 | 18.8 |
| 2017 - 19 | • | - | 16.6 | 16.3 | 16.8 | 18.3 | 18.9 |
| 2018 - 20 | • | - | 16.4 | 16.1 | 16.6 | 18.1 | 18.6 |
| 2019 - 21 | • | - | 16.2 | 15.9 | 16.5 | 18.0 | 18.5 |
| 2020 - 22 | • | - | 16.3 | 16.1 | 16.6 | 17.9 | 18.4 |
| 2021 - 23 | • | - | 16.7 | 16.4 | 16.9 | 18.3 | 18.7 |
| 2022 - 24 | • | - | 16.8 | 16.5 | 17.1 | 18.4 | 18.9 |
| 2023 - 25 | • | - | 16.8 | 16.6 | 17.1 | 18.6 | 19.1 |
Source: Office for National Statistics
Trends Over Time Among Women
Among Hull women, life expectancy at age 65 years increased from 18.1 years in 2001-03 to a high of 19.3 years in 2011-13, followed by a decrease to 19.0 years for 2017-19 prior to the pandemic. Female life expectancy at age 65 years decreased to 18.8 years for 2020-22, but has increased since to 19.7 years which is 0.7 years higher than pre-pandemic levels.
Over the entire period, 2001-03 to 2023-25, life expectancy at age 65 years increased by 1.6 years (8.8%) for Hull compared to a 2.0 years increase (10.6%) across the region and a 2.3 years increase (12.0%) for England.
Compared with benchmark
Life expectancy at 65 (Female 65)
|
Period
|
Kingston upon Hull |
Yorkshire and the Humber region (statistical)
|
England
|
||||
|---|---|---|---|---|---|---|---|
|
Count
|
Value
|
95%
Lower CI |
95%
Upper CI |
||||
| 2001 - 03 | • | - | 18.1 | 17.9 | 18.4 | 18.9 | 19.2 |
| 2002 - 04 | • | - | 18.0 | 17.7 | 18.3 | 19.0 | 19.4 |
| 2003 - 05 | • | - | 18.1 | 17.8 | 18.4 | 19.2 | 19.6 |
| 2004 - 06 | • | - | 18.3 | 18.0 | 18.6 | 19.5 | 19.9 |
| 2005 - 07 | • | - | 18.3 | 18.0 | 18.6 | 19.6 | 20.0 |
| 2006 - 08 | • | - | 18.5 | 18.2 | 18.8 | 19.7 | 20.2 |
| 2007 - 09 | • | - | 18.8 | 18.5 | 19.1 | 19.8 | 20.3 |
| 2008 - 10 | • | - | 19.1 | 18.8 | 19.4 | 20.1 | 20.5 |
| 2009 - 11 | • | - | 19.3 | 19.0 | 19.6 | 20.3 | 20.9 |
| 2010 - 12 | • | - | 19.3 | 19.0 | 19.6 | 20.4 | 20.9 |
| 2011 - 13 | • | - | 19.3 | 19.0 | 19.6 | 20.4 | 21.0 |
| 2012 - 14 | • | - | 19.2 | 18.9 | 19.5 | 20.5 | 21.1 |
| 2013 - 15 | • | - | 19.0 | 18.7 | 19.3 | 20.5 | 21.1 |
| 2014 - 16 | • | - | 19.0 | 18.7 | 19.3 | 20.6 | 21.1 |
| 2015 - 17 | • | - | 18.9 | 18.7 | 19.2 | 20.5 | 21.0 |
| 2016 - 18 | • | - | 19.0 | 18.7 | 19.3 | 20.6 | 21.1 |
| 2017 - 19 | • | - | 19.0 | 18.7 | 19.3 | 20.6 | 21.2 |
| 2018 - 20 | • | - | 19.0 | 18.7 | 19.3 | 20.4 | 21.0 |
| 2019 - 21 | • | - | 19.0 | 18.7 | 19.3 | 20.4 | 21.0 |
| 2020 - 22 | • | - | 18.8 | 18.5 | 19.1 | 20.3 | 20.9 |
| 2021 - 23 | • | - | 19.1 | 18.8 | 19.4 | 20.6 | 21.1 |
| 2022 - 24 | • | - | 19.3 | 19.0 | 19.6 | 20.7 | 21.4 |
| 2023 - 25 | • | - | 19.7 | 19.4 | 20.0 | 20.9 | 21.5 |
Source: Office for National Statistics
Life Expectancy at Age 65 Years Among Local Deprivation Groups
Latest Estimates for Men
Life expectancy at birth differs among the local deprivation tenths defined on the basis of the Index of Multiple Deprivation 2025. The 95% confidence intervals are shown (for more information see Confidence Intervals in the Glossary). If the confidence intervals do not overlap then there is a statistically significant difference in life expectancy, although the reverse cannot necessarily be said if there is overlap (it is possible for statistically significant differences to exist when there is a small overlap between groups).
There is a 6.2 year difference in life expectancy at age 65 years between the local deprivation tenths for men. Life expectancy at age 65 years is estimated to be 14.20 years among men living in the most deprived tenth of areas of Hull compared to 20.2 years among men living in the least deprived tenth of areas of Hull. There is a strong association between deprivation and male life expectancy at age 65 years.

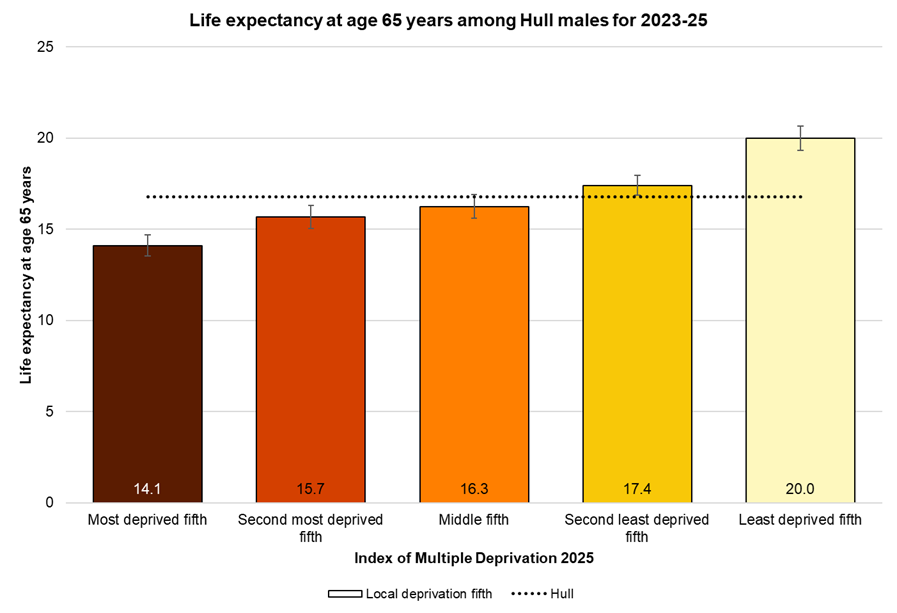
There is a 5.9 year difference in life expectancy at age 65 years between the local deprivation fifths for men. Life expectancy at age 65 years is estimated to be 14.1 years among men living in the most deprived fifth of areas of Hull compared to 20.0 years among men living in the least deprived fifth of areas of Hull.
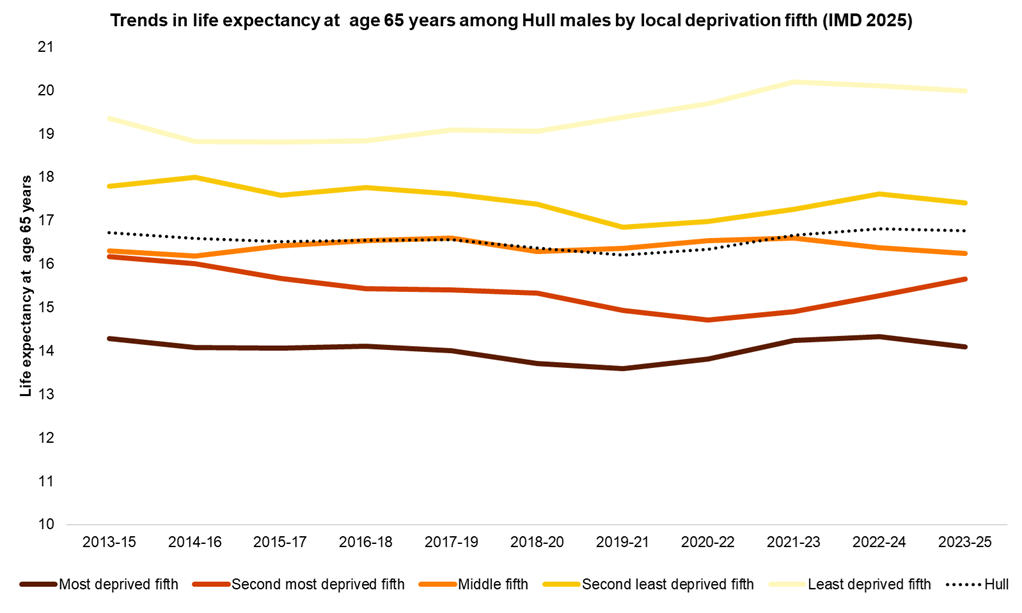
Trends Over Time Among Men
For males, life expectancy at age 65 years has decreased between 2013-15 and 2023-25 for people living in the four most deprived fifths of areas of Hull and increased for people living in the least deprived fifth of areas of Hull. Over the decade, the decreases were 0.2 years for the most deprived fifth, 0.5 for the second most deprived fifth, 0.1 years for the middle fifth and 0.4 years for the second least deprived fifth, with an increase of 0.6 years for men living in the least deprived fifth of areas of Hull.
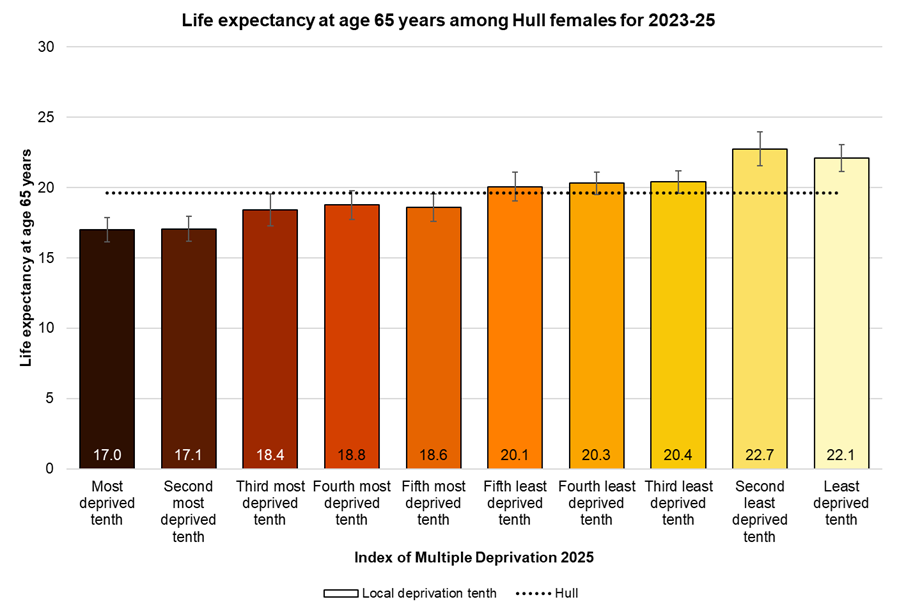
Latest Estimates for Women
For women, there is a 5.1 year difference in life expectancy at age 65 years between the local deprivation tenths. Life expectancy at age 65 years is estimated to be 17.0 years among women living in the most deprived tenth of areas of Hull compared to 22.1 years among women living in the least deprived tenth of areas of Hull, although even higher at 22.7 years for women living in the second lest deprived tenth of areas of the city. There is a strong association between deprivation and female life expectancy at age 65 years.
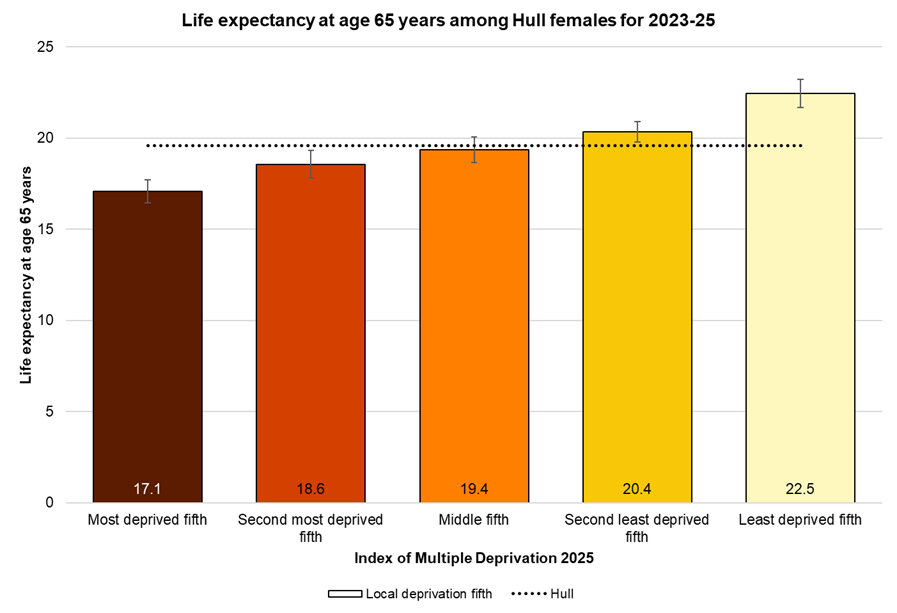
There is a 5.4 year difference in life expectancy at age 65 years between the local deprivation fifths for women. Often the difference is smaller for the local deprivation fifths compared to the local deprivation tenths, but this is not the case here. Life expectancy at age 65 years is estimated to be 17.1 years among women living in the most deprived fifth of areas of Hull compared to 22.5 years among women living in the least deprived fifth of areas of Hull.
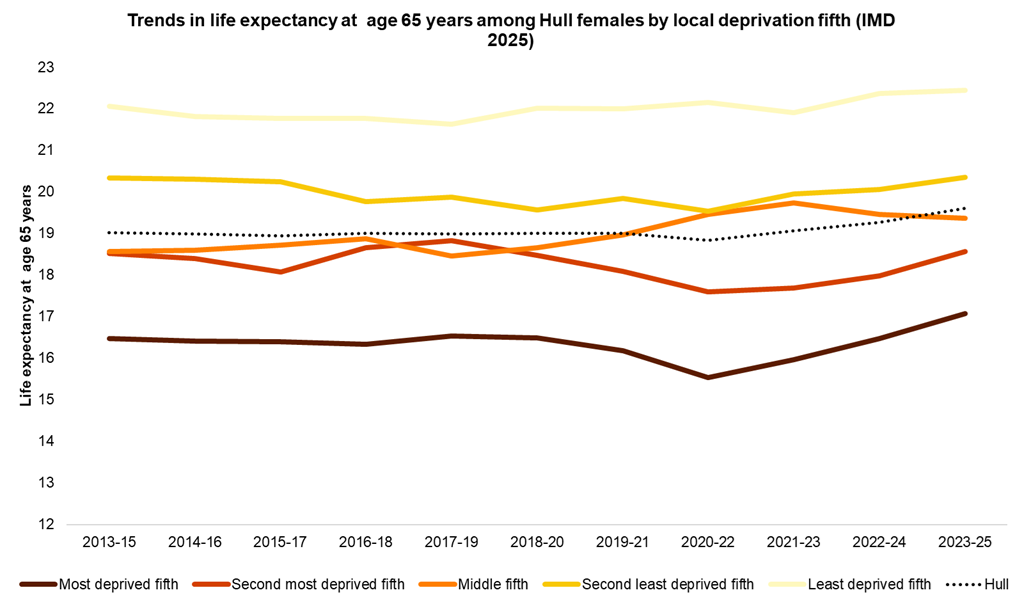
Trends Over Time Among Women
For women, life expectancy at age 65 years has increased between 2013-15 and 2023-25 for women living in the most deprived fifth of areas of Hull (by 0.6 years), the middle fifth (by 0.8 years) and the least deprived fifth of areas (by 04 years). Life expectancy at age 65 remained the same in 2023-25 as it was in 2013-15 for women in the second most deprived fifth of areas of Hull and women in the second least deprived fifth of areas.
Life Expectancy at Age 65 Years Among Hull’s Wards
Association With Deprivation
When linked to ward rankings based on the Index of Multiple Deprivation 2019 these inequalities tend to follow a trend of wards with the lowest deprivation ranking having some of the highest average life expectancies and wards with the highest deprivation ranking having some of the lowest life expectancies (although there were some exceptions to this trend).
For every increase of 10 in the Index of Multiple Deprivation 2025 score, life expectancy at age 65 years is 0.8 years less for men and 0.9 years less for women.
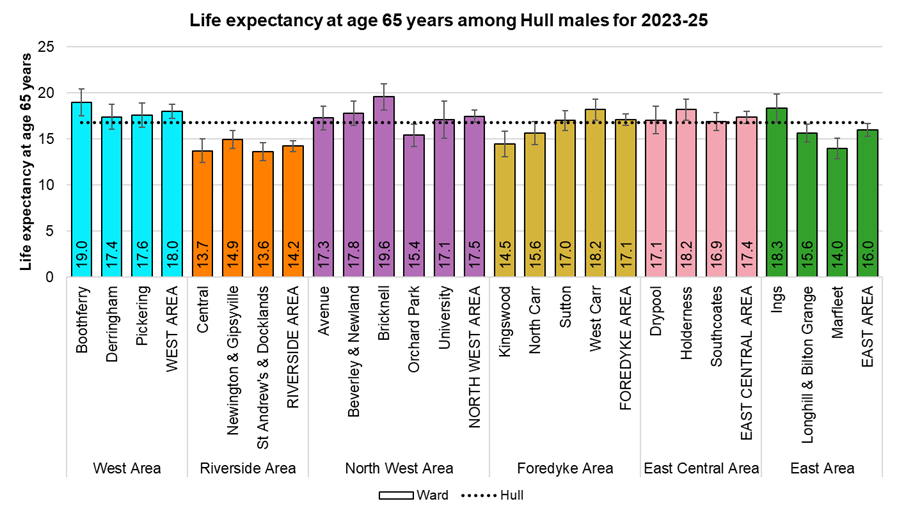
Latest Estimates for Men
Male life expectancy at age 65 for 2023-25 varied by 5.9 years from 13.6 years in St Andrew’s & Docklands ward to 19.6 years in Bricknell ward. Life expectancy at age 65 years was lowest for men living in St Andrew’s & Docklands, Central, Marfleet, Kingswood and Newington & Gipsyville.
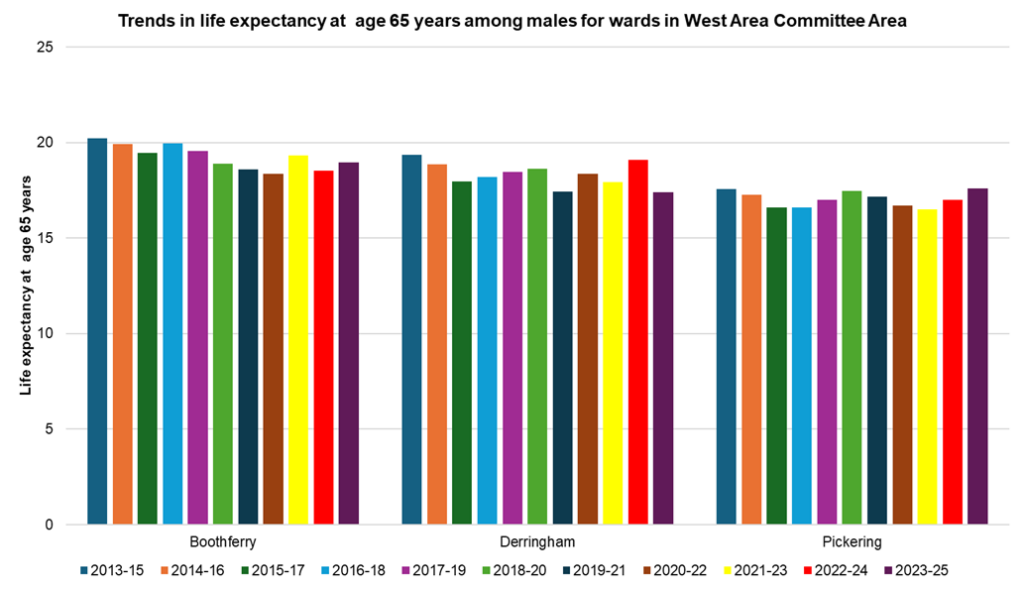
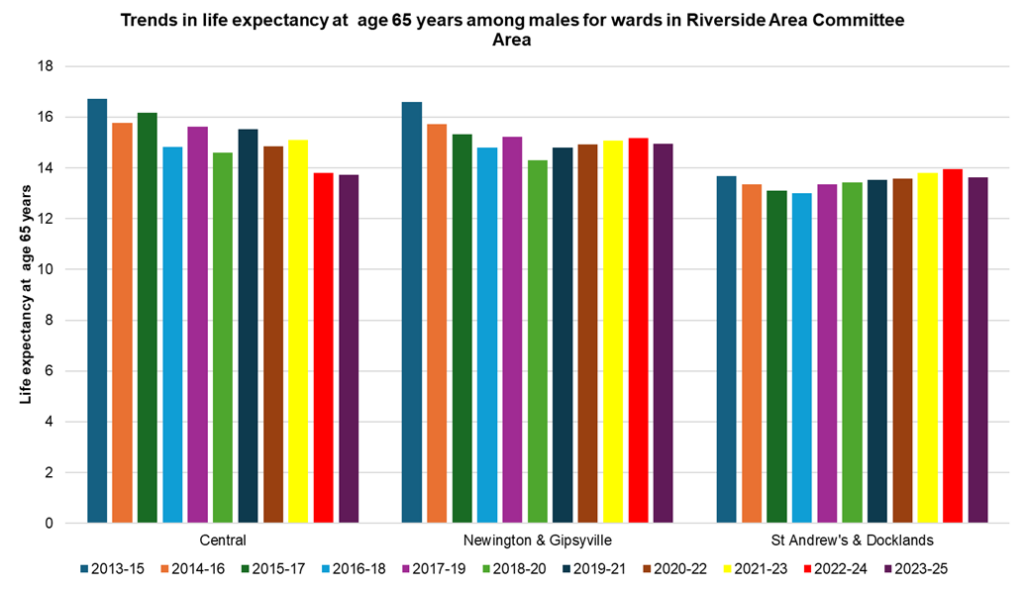
Trends Over Time Among Men
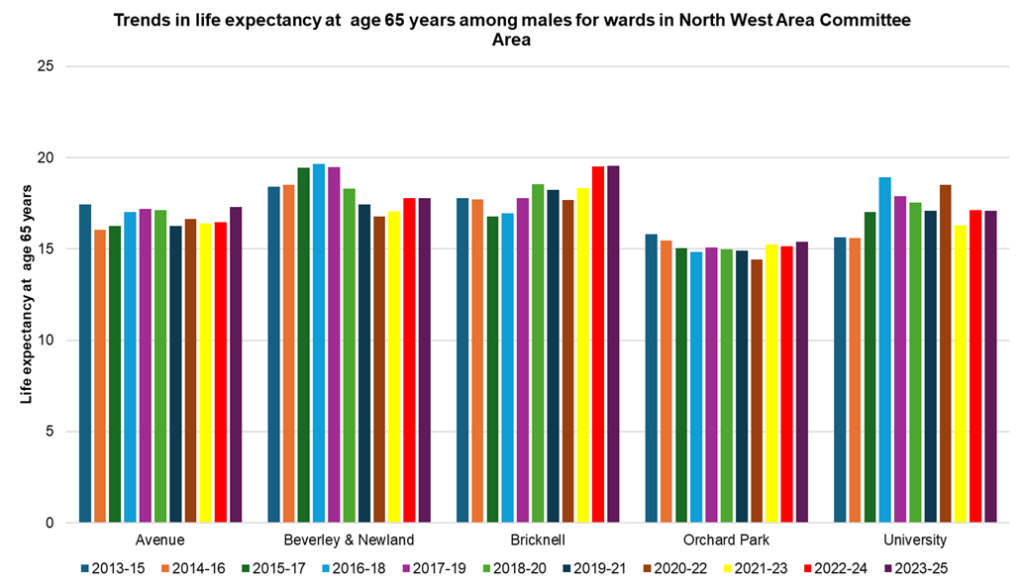
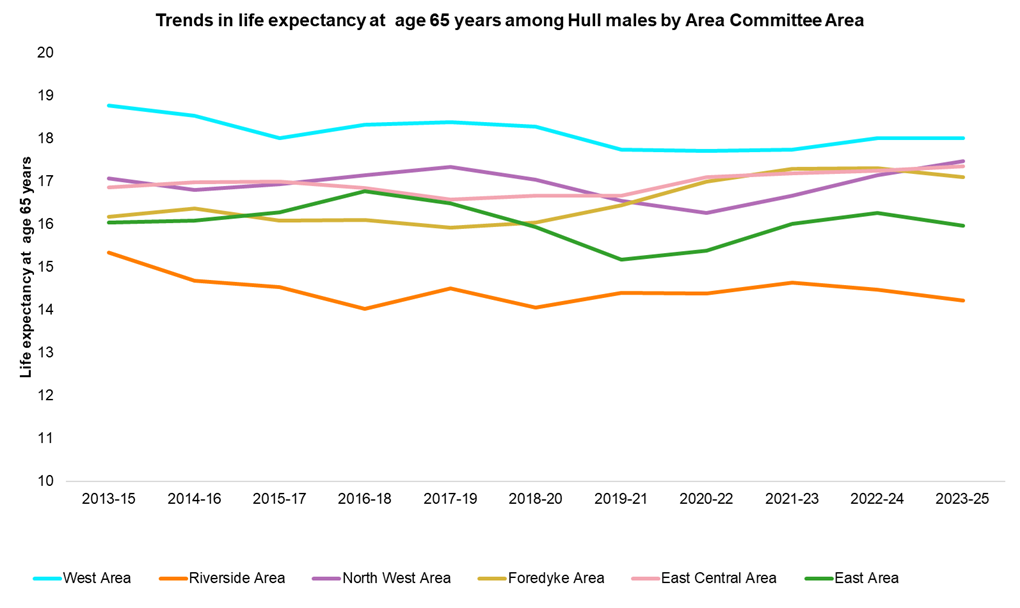
The charts below illustrate the trends in male life expectancy at age 65 across Hull’s wards for West, West Central, North West, North East, East Central and East Area Committee Areas for 2013-15 to 2023-25 (rolling average).
In West Area Committee Area, male life expectancy at age 65 years remained unchanged between 2013-15 and 2023-25 in Pickering (by 0.1 years), but decreased in the other two wards, by 2.0 years in Derringham and by 1.2 years in Boothferry.
In Riverside Area Committee Area, male life expectancy at age 65 years decreased between 2013-15 and 2023-25 in all three wards. Males life expectancy at age 65 years decreased by 3.0 years in Central, by 1.6 years in Newington & Gipsyville, and decreased marginally by 0.1 years in St Andrew’s & Docklands.
In North West Area Committee Area, male life expectancy at age 65 years decreased in three wards between 2013-15 and 2023-25, by 0.6 years in Beverley & Newland, by 0.4 years in Orchard Park and by a marginal 0.1 years in Avenue. Male life expectancy at age 65 years increased between 2013-15 and 2023-25 by 1.8 years in Bricknell and by 1.4 years in University.
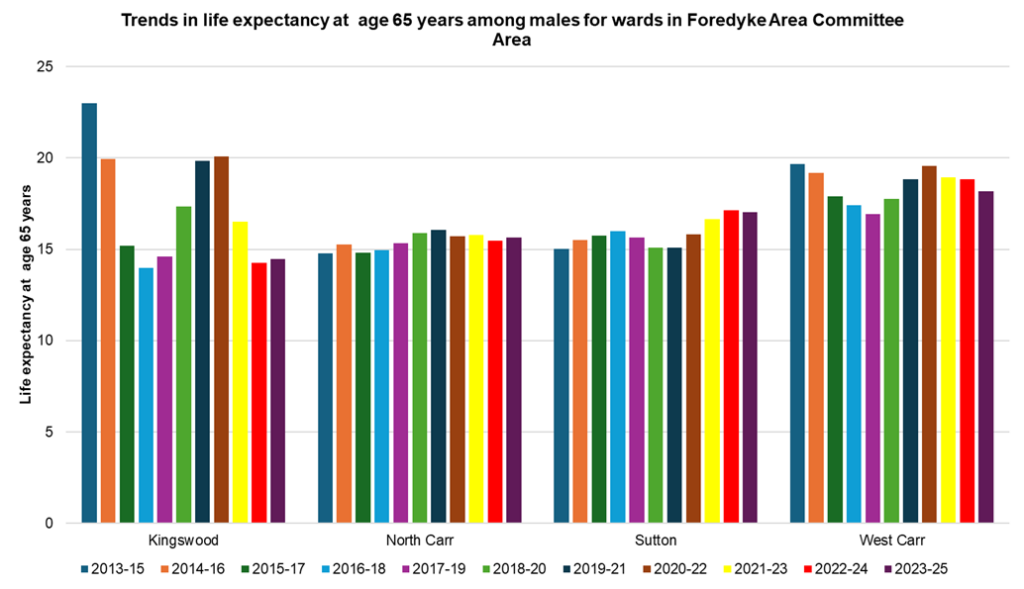
In Foredyke Area Committee Area, male life expectancy at age 65 years increased between 2013-15 and 2023-25 in Sutton by 2.0 years and in North Carr by 0.9 years. Life expectancy at age 65 years decreased in West Carr by 1.5 years.
Life expectancy at age 65 years in Kingswood has decreased drastically among men, but the number of men aged 65+ years and the number of deaths were very low in the earlier years and subject to considerable variability and were not very reliable.
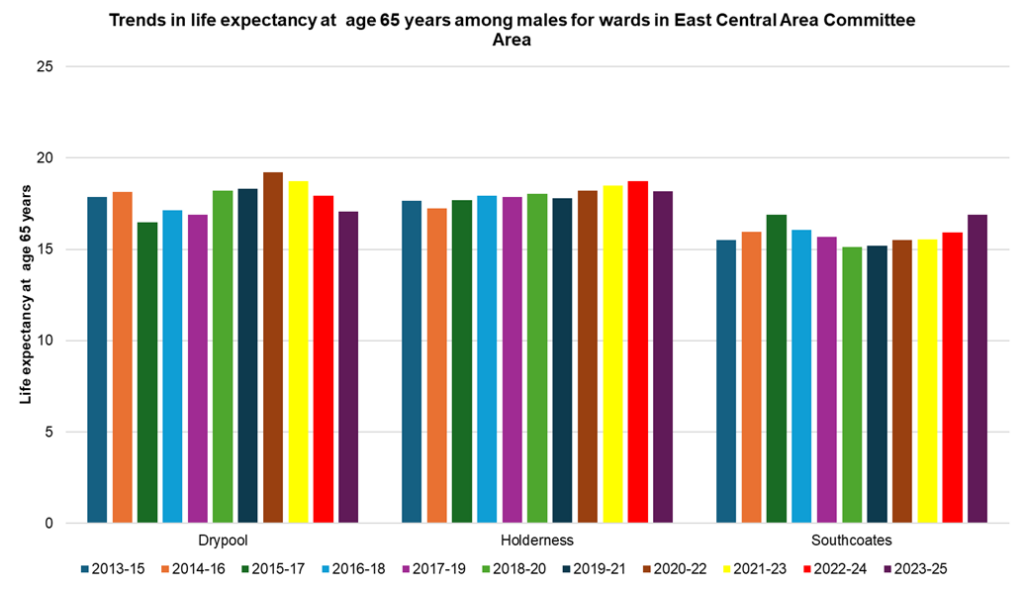
Within East Central Area Committee Area, male life expectancy at age 65 years increased between 2013-15 and 2023-25 by 1.4 years in Southcoates and by 0.5 years in Holderness. By contrast, male life expectancy at age 65 years decreased over this same period by 0.8 years in Drypool.
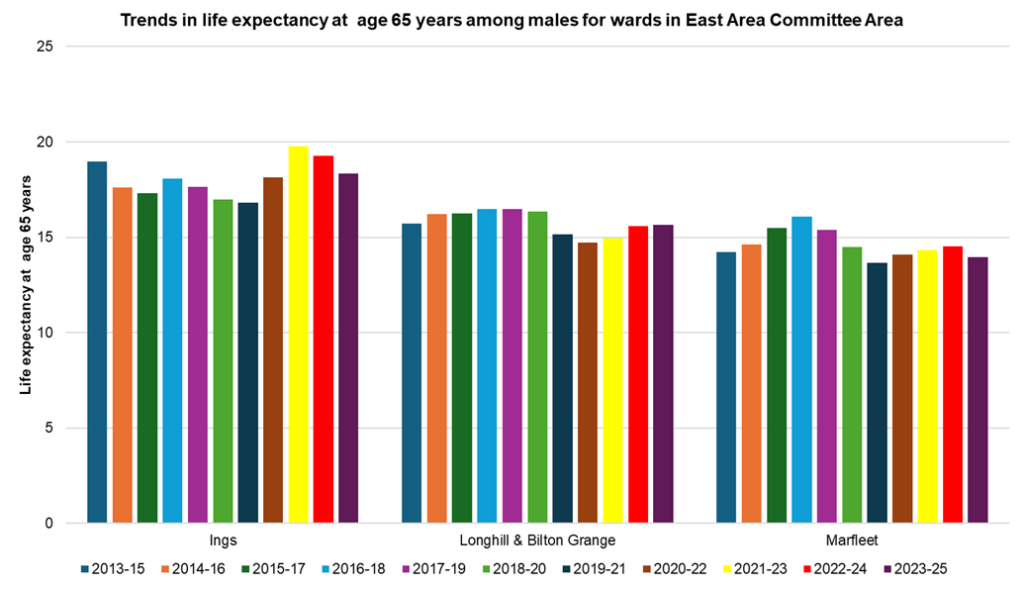
Within East Area Committee Area, male life expectancy at age 65 years decreased in all three wards between 2013-15 and 2023-25. Male life expectancy at age 65 years decreased by 0.7 years in Ings, by 0.3 years in Marfleet, with a marginal decrease of 0.1 years in Longhill & Bilton Grange.
The difference in male life expectancy at age 65 years between the six Area Committee Areas is 3.8 years for 2023-25, and has remained between 3 and 4 years for most of the last ten years. Life expectancy at age 65 years has been consistently highest in West Area Committee Area, and consistently lowest in Riverside Area Committee Area.
Between 2013-15 and 2023-25, male life expectancy at age 65 years increased by 0.9 years in Foredyke, by 0.5 years in East Central and by 0.4 years in North West, but decreased in the remaining three Area Committee Areas, by 1.1 years in Riverside, by 0.8 years in West and a marginal decrease of 0.1 years in East Area Committee Area.
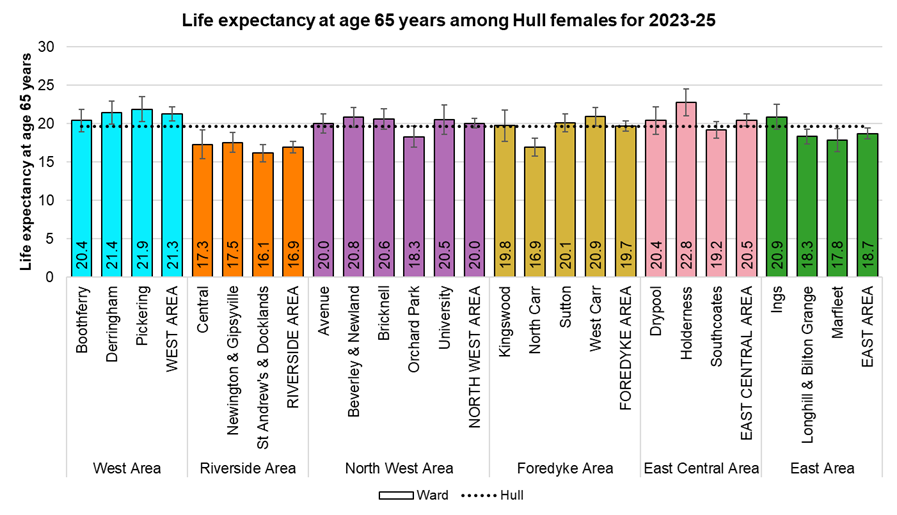
Latest Estimates for Women
For females, life expectancy at age 65 years varied by 6.6 years from 16.1 years in St Andrew’s & Docklands ward to 22.8 years in Holderness. Life expectancy at age 65 years was lowest for women living in St Andrew’s & Docklands, North Carr, Central, Newington & Gipsyville and Marfleet.
Trends Over Time Among Women
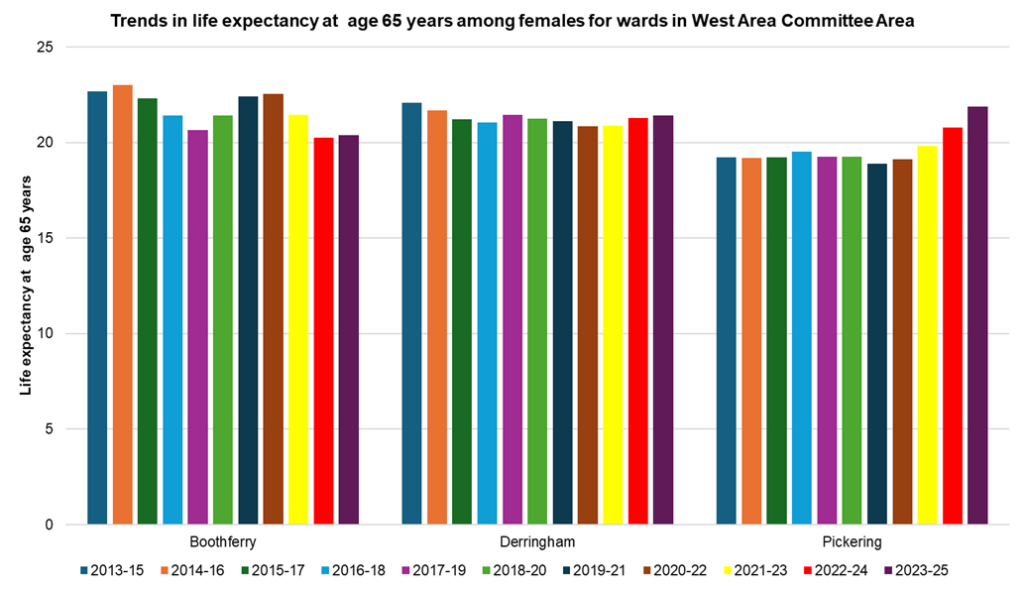
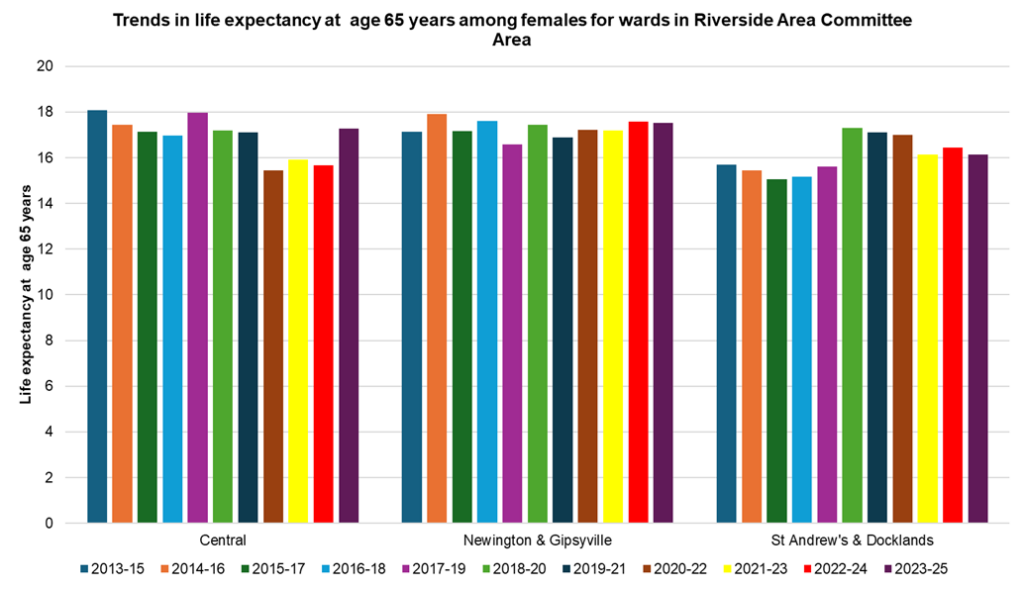
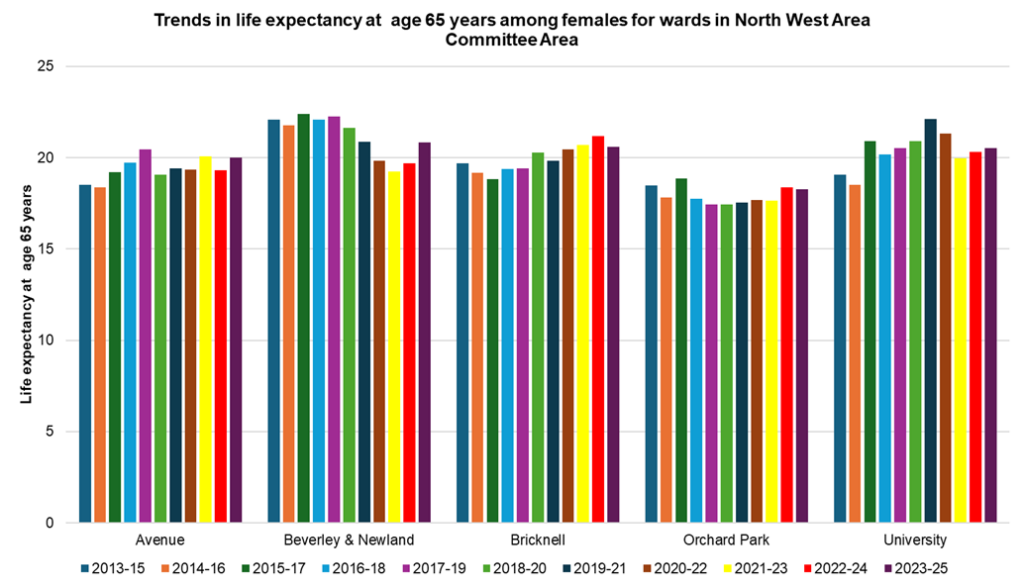
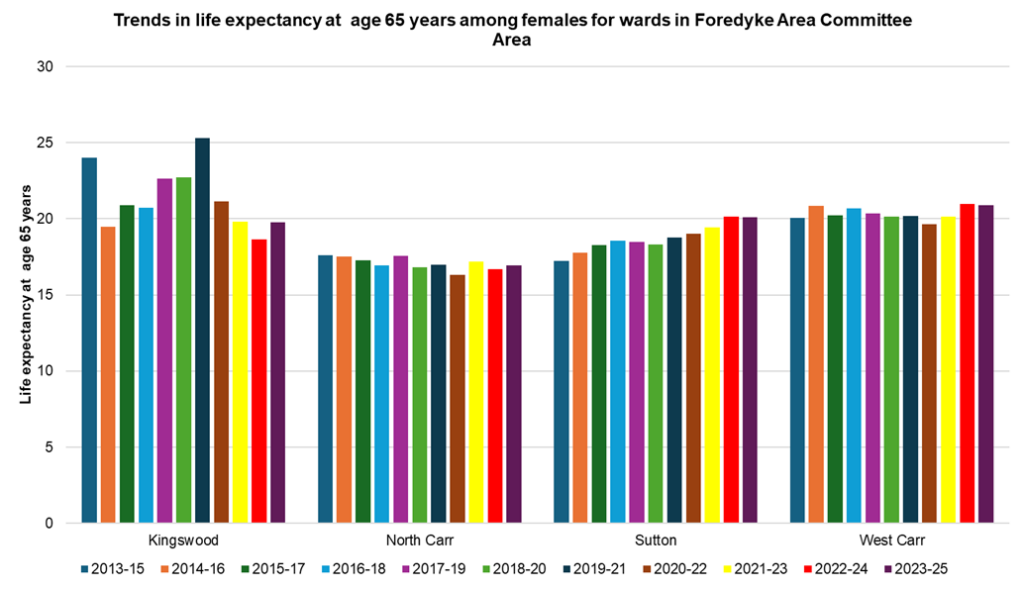
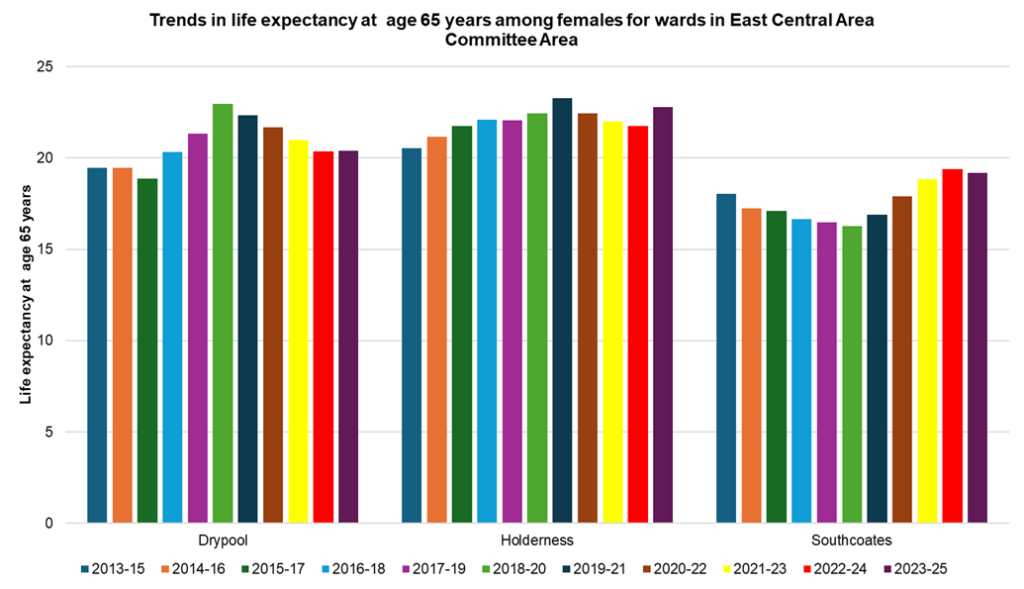
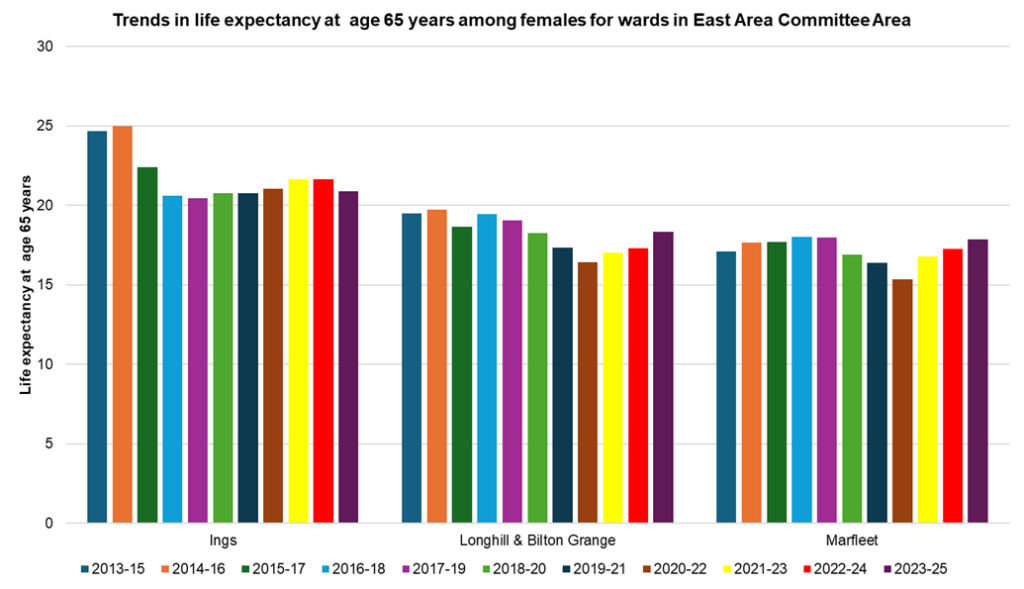
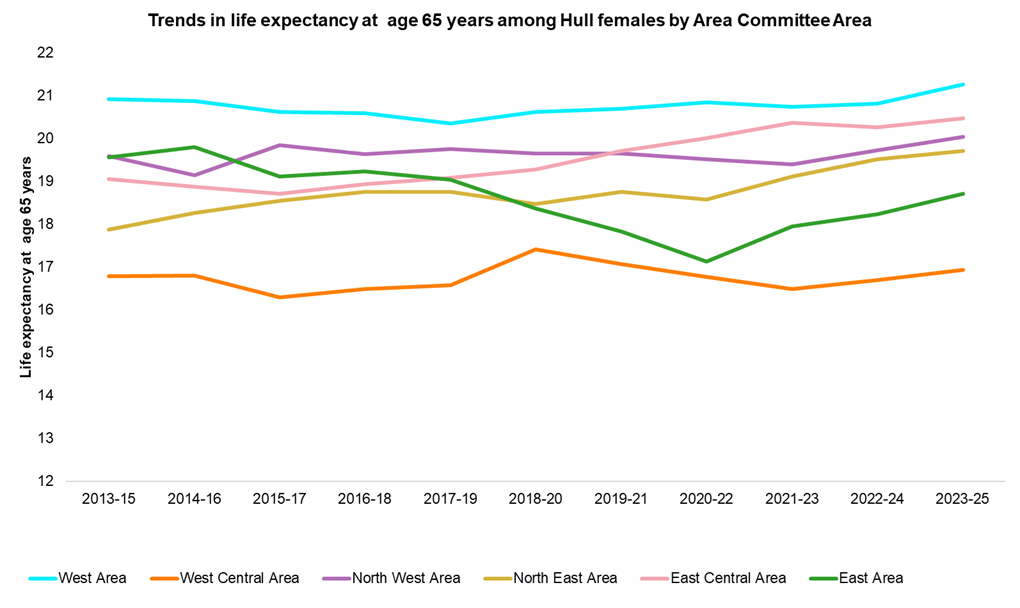
The charts below illustrate the trends in female life expectancy at age 65 across Hull’s wards for West, West Central, North West, North East, East Central and East Area Committee Areas for 2013-15 to 2023-25 (rolling average).
In West Area Committee Area, female life expectancy at age 65 years decreased between 2013-15 and 2023-25 by 2.3 years in Boothferry and by 0.6 years in Derringham. Female life expectancy at age 65 years increased over the same period by 2.7 years in Pickering.
In Riverside Area Committee, female life expectancy at age 65 years decreased between 2013-15 and 2023-25 by 0.8 years in Central, but increased by 0.4 years in both St Andrew’s & Docklands and Newington & Gipsyville.
In North West Area Committee Area, female life expectancy at age 65 years decreased between 2013-15 and 2023-25 by 1.2 years in Beverley & Newland and by 0.2 years in Orchard Park. Over the same period female life expectancy at age 65 years increased by 1.5 years in Avenue, by 1.5 years in University and by 0.9 years in Bricknell.
In Foredyke Area Committee Area, female life expectancy at age 65 years decreased between 2013-15 and 2023-25 by 4.3 years years in Kingswood and by 0.7 years in North Carr. Over the same period female life expectancy at age 65 years increased by 2.9 years in Sutton and by 0.8 years in West Carr.
Life expectancy at age 65 years in Kingswood has decreased drastically among women, but the number of women aged 65+ years and the number of deaths were very low in the earlier years and subject to considerable variability and were not very reliable.
In East Central Area Committee Area, female life expectancy at age 65 years increased between 2013-15 and 2023-25 in all three wards, increasing by 2.3 years in Holderness, by 1.2 years in Southcoates and by 0.9 years in Drypool. East Central is the only Area Committee Area where female life expectancy at age 65 years increased in all wards over this time period.
In East Area Committee Area, female life expectancy at age 65 years decreased between 2013-15 and 2023-25 in two of the three wards, decreasing by 3.3 years in Ings and by 1.2 years in Longhill & Bilton Grange. By contrast, female life expectancy at age 65 years increased in Marfleet, by 0.8 years.
The difference in female life expectancy at age 65 years between the six Area Committee Areas was 4.3 years for 2023-25, and has remained between 3 and 4 years for most of the last ten years. Female life expectancy at age 65 years has been consistently highest in West Area Committee Area, and consistently lowest in Riverside Area Committee Area.
Between 2013-15 and 2023-25, female life expectancy at age 65 years increased by 1.8 years in Foredyke, by 1.4 years in East Central, by 0.4 years in North West, by 0.4 years in West and by 0.2 years in Riverside. The only Area Committee Area that saw female life expectancy at age 65 years decrease was East, where it decreased by 0.9 years over this period. This decrease in East was driven by the large decreases seen during the COVID pandemic, the greatest decrease among the Area Committee Areas.
Healthy Life Expectancy At Age 65 Years
Latest Estimates for Men and Women
Healthy life expectancy is a measure of the average number of years a person would expect to live in good health based on contemporary mortality rates and prevalence of self-reported ‘good’ health. Healthy life expectancy is lower in Hull compared to England, and furthermore, when comparing life expectancy and healthy life expectancy, people in Hull live a shorter time in good health.
Fingertips has only partially updated life expectancy indicators for 2022-24, as healthy life expectancy from Fingertips is still presented for 2021-23.
For 2022-24, healthy life expectancy at age 65 years was 7.7 years for men and 8.3 years for women in Hull which is lower than for England by 2.4 years among men and 2.8 years among women.
Compared with benchmark
| Indicator | Period | England | Yorkshire and the Humber region (statistical) | Kingston upon Hull | East Riding of Yorkshire | North East Lincolnshire | North Lincolnshire | York | North Yorkshire UA | Barnsley | Doncaster | Rotherham | Sheffield | Bradford | Calderdale | Kirklees | Leeds | Wakefield |
|---|---|---|---|---|---|---|---|---|---|---|---|---|---|---|---|---|---|---|
Healthy life expectancy at 65 (Male 65) | 2022 - 24 | 10.1 | 9.5 | 7.7 | 9.8 | 8.2 | 9.6 | 10.4 | 11.8 | 8.3 | 8.4 | 8.6 | 9.0 | 9.2 | 10.1 | 9.2 | 10.0 | 8.3 |
Healthy life expectancy at 65 (Female 65) | 2022 - 24 | 11.1 | 10.4 | 8.3 | 10.6 | 9.1 | 10.6 | 11.2 | 12.8 | 9.1 | 9.2 | 9.0 | 9.8 | 10.1 | 11.0 | 10.1 | 11.1 | 8.6 |
Trends Over Time Among Men
Among men in Hull, healthy life expectancy at age 65 years increased between 2011-13 and 2017-19 from 7.5 years to 8.5 years. There was a sharp decrease to 7.3 years for 2020-22, but an increase in 2021-23 to 7.8 years.
Between 2021-23 and 2022-24, healthy life expectancy at age 65 has decreased by 0.1 years for Hull men to 7.7 years and remained the same at 10.1 years for men in England. The latest estimate is 0.8 years lower than the pre-pandemic estimate for Hull men.
Compared with benchmark
Healthy life expectancy at 65 (Male 65)
|
Period
|
Kingston upon Hull |
Yorkshire and the Humber region (statistical)
|
England
|
||||
|---|---|---|---|---|---|---|---|
|
Count
|
Value
|
95%
Lower CI |
95%
Upper CI |
||||
| 2011 - 13 | • | - | 7.4 | 5.9 | 9.0 | 9.2 | 10.0 |
| 2012 - 14 | • | - | 7.5 | 5.8 | 9.2 | 9.3 | 10.1 |
| 2013 - 15 | • | - | 7.4 | 5.6 | 9.1 | 9.3 | 10.2 |
| 2014 - 16 | • | - | 7.4 | 5.9 | 8.9 | 9.3 | 10.3 |
| 2015 - 17 | • | - | 7.9 | 6.6 | 9.3 | 9.6 | 10.4 |
| 2016 - 18 | • | - | 8.1 | 6.7 | 9.4 | 9.7 | 10.5 |
| 2017 - 19 | • | - | 8.5 | 7.1 | 9.8 | 9.9 | 10.5 |
| 2018 - 20 | • | - | 7.9 | 6.5 | 9.4 | 9.9 | 10.5 |
| 2019 - 21 | • | - | 8.0 | 6.6 | 9.5 | 9.9 | 10.4 |
| 2020 - 22 | • | - | 7.3 | 5.7 | 8.8 | 9.5 | 10.2 |
| 2021 - 23 | • | - | 7.8 | 6.0 | 9.6 | 9.3 | 10.1 |
| 2022 - 24 | • | - | 7.7 | 6.1 | 9.3 | 9.5 | 10.1 |
Source: Office for National Statistics
Trends Over Time Among Women
Among women in Hull, healthy life expectancy at age 65 years increased between 2011-13 and 2017-19 from 8.2 years to 9.3 years. There was a sharp decrease to 8.1 years for 2020-22, but an increase in the 2021-23 to 8.6 years.
Between 2021-23 and 2022-24, healthy life expectancy at age 65 decreased by 0.3 years for Hull women to 8.3 years and by 0.1 years for women in England to 11.1 years. The latest estimate is 0.9 years lower than the pre-pandemic estimate for Hull women.
Compared with benchmark
Healthy life expectancy at 65 (Female 65)
|
Period
|
Kingston upon Hull |
Yorkshire and the Humber region (statistical)
|
England
|
||||
|---|---|---|---|---|---|---|---|
|
Count
|
Value
|
95%
Lower CI |
95%
Upper CI |
||||
| 2011 - 13 | • | - | 8.2 | 6.7 | 9.7 | 10.0 | 10.8 |
| 2012 - 14 | • | - | 8.4 | 6.8 | 9.9 | 10.2 | 11.0 |
| 2013 - 15 | • | - | 8.4 | 6.9 | 10.0 | 10.4 | 11.1 |
| 2014 - 16 | • | - | 8.3 | 6.7 | 9.9 | 10.2 | 11.3 |
| 2015 - 17 | • | - | 8.8 | 7.0 | 10.6 | 10.6 | 11.3 |
| 2016 - 18 | • | - | 9.1 | 7.0 | 11.2 | 10.9 | 11.4 |
| 2017 - 19 | • | - | 9.2 | 7.6 | 10.9 | 10.8 | 11.4 |
| 2018 - 20 | • | - | 8.8 | 7.3 | 10.3 | 11.0 | 11.7 |
| 2019 - 21 | • | - | 9.0 | 7.4 | 10.5 | 11.0 | 11.7 |
| 2020 - 22 | • | - | 8.1 | 6.3 | 9.9 | 10.6 | 11.4 |
| 2021 - 23 | • | - | 8.6 | 6.5 | 10.7 | 10.5 | 11.2 |
| 2022 - 24 | • | - | 8.3 | 6.4 | 10.2 | 10.4 | 11.1 |
Source: Office for National Statistics
The pattern for healthy life expectancy at age 65 years is slightly different to that observed for healthy life expectancy at birth as healthy life expectancy at age 65 years showed an increase prior to the pandemic and appears to have shown a smaller change due to the pandemic. It is possible that perception of health could have changed due to the pandemic particularly among people aged 65 years which could impact on the prevalence of good health and ultimately impact on healthy life expectancy.
Percentage of Live Spent Not in ‘Good’ Health
For men in Hull aged 65 years, life expectancy in 2022-24 was 16.8 years and healthy life expectancy was 7.7 years so it was estimated that men aged 65 years would spend 9.1 years of their estimated remaining 16.8 years not in good health which represents 54% of their remaining life (compared to 8.8 years for England equating to 47% of their remaining life) for 2022-24.
For women in Hull aged 65 years, life expectancy in 2022-24 was 19.3 years and healthy life expectancy was 8.3 years so it was estimated that women aged 65 years would spend 11.0 years of their estimated remaining 19.3 years not in good health which represents 57% of their remaining life (compared to 10.3 years for England equating to 48% of their remaining life) for 2022-24.
Disability Adjusted Life Years
Nationally, lower back and neck pain, coronary heart disease, stroke, chronic obstructive pulmonary disease, lung cancer, Alzheimer’s disease, sense organ diseases, depressive disorders, falls and skin diseases are the top 10 causes of disability, that is they are responsible for the highest number of disability adjusted life years (DALYs).
Strategic Need and Service Provision
Whilst increasing life expectancy is important, this needs to be achieved in conjunction with improvements in the quality of life. This is particularly so with an ageing population and the consequent increased demand on scarce health and social care resources.
Resources
L’Hôte E, Castellina M, Volmert A, Conklin L, and O’Shea P. A Matter of Life and Death: Explaining the Wider Determinants of Health in the UK. FrameWorks, 2022. Commissioned by The Health Foundation. https://www.health.org.uk/publications/a-matter-of-life-or-death
Office for Health Improvement & Disparities’ Fingertips: https://fingertips.phe.org.uk/
The Office for Health Improvement & Disparities’ Segment Tool. https://analytics.phe.gov.uk/apps/segment-tool/
Updates
This page was last updated / checked on 14 July 2026.
This page is due to be updated / checked in August 2026.