Index
This topic area covers statistics and information relating to accidents and injuries among children and young people in Hull including local strategic need and service provision. Statistical information includes hospital admissions caused by unintentional and deliberate injuries, and from road traffic accidents among children and young people aged 0-24 years. Additional information relating to A&E (Emergency Department) attendances and hospital admissions can be found within A&E Attendances and Hospital Admissions Among Children and Young People under Health Factors under Children and Young People.
This page contains information from the Office for Health Improvement & Disparities’ Fingertips. Information is taken ‘live’ from the site so uses the latest available data from Fingertips and displays it on this page. As a result, some comments on this page may relate to an earlier period of time until this page is next updated (see review dates at the end of this page).
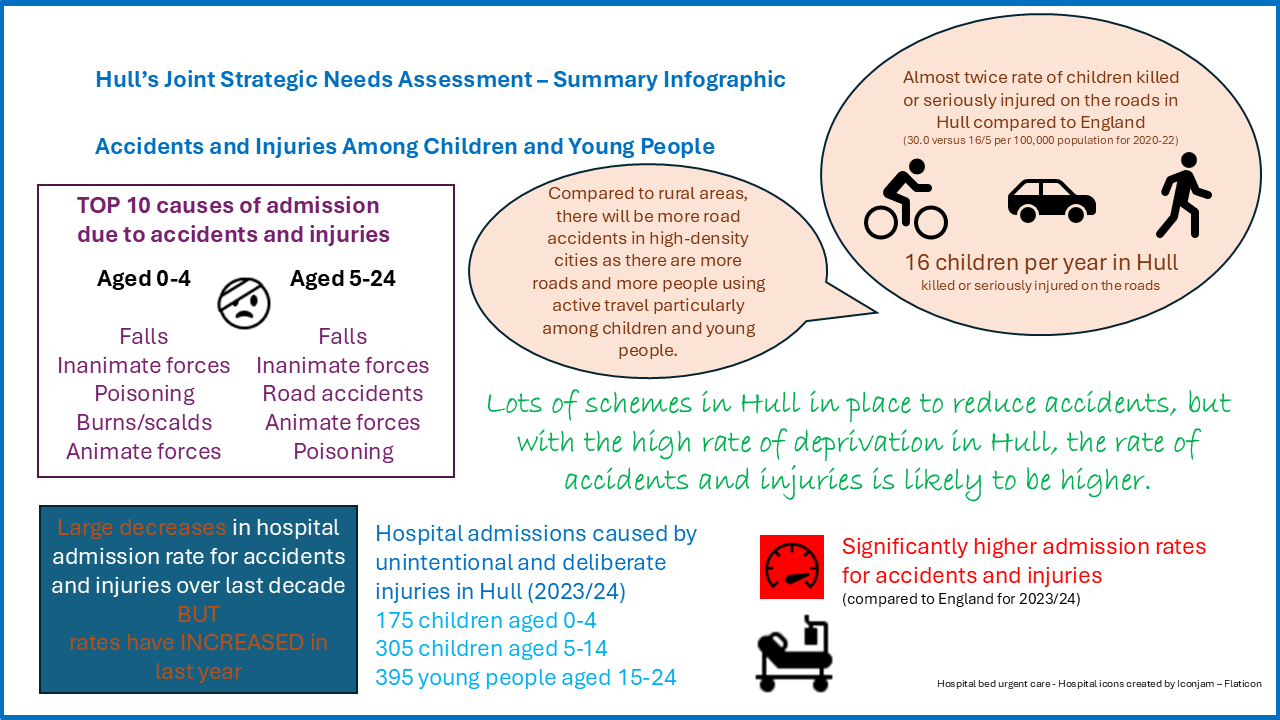
Summary Infographic
Headlines
- Comprehensive, accurate data relating to all accidents and injuries among children and young people is not available as many accidents and injuries will not need hospital treatment and will be treated in primary and/or Urgent Care Centres. In addition, the availability and accuracy of A&E data is limited. Whilst the hospital admissions data is generally examined, it is recognised that this will not evidence the true impact of all accidents and injuries on children and young people.
- During 2024/25, the rate of hospital admissions caused by unintentional and deliberate injuries in children and young people in Hull was statistically significantly higher than England among children and young people aged 0-14 and 15-24 years, while non-significantly higher among children aged 0-4 years.
- The admission rates caused by unintentional and deliberate injuries had been falling in recent years for those aged 0-4, 0-14 and 15-24 years, and at a slightly faster rate of decrease compared to England. The rate also fell more sharply among those aged 0-14 years due to the COVID-19 pandemic (less so for 15-24 year olds). Whilst the admission rates in Hull have increased since 2020/21, the rates are lower in 2024/25 than they were pre-pandemic in 2019/20.
- During 2023/24, there were 170, 275 and 400 hospital admissions caused by unintentional and deliberate injuries among children and young people aged 0-4, 5-14 and 15-24 years respectively (numbers rounded to nearest five). This represents a considerable decrease from its peak in 2010/11 when there were 326 admissions among 0-4s and 388 admissions among 5-14s, and from its peak in 2010/11 of 899 admissions among young people aged 15-24 years.
- There is significant research and evidence of the association between deprivation and higher rates of hospital admissions in the most deprived areas. This was evident in local data analyses completed from 2015/16. Nationally, there is also a higher rate of road traffic accidents among children and young people living in more deprived areas.
- During 2020-22, there were 48 Hull children who were killed or seriously injured on England’s roads giving a rate of 30.0 per 100,000 population which was almost twice as high as England (16.5 per 100,000 population). The rate had fallen from 45.7 per 100,000 population in 2017-19 (71 children killed or seriously injured), but the reduction is likely associated with the COVID-19 pandemic with fewer children travelling to and from school during 2020 and early 2021. It is possible that the numbers have increased since then.
The Population Affected – Why Is It Important?
More than one million children under the age of 15 experience accidents in and around the home every year in the UK which result in attendance at their local A&E.
From the report on Preventing Unintentional Injuries: A Guide for All Staff Working With Children Under Five from the The Office for Health Improvement & Disparities (formerly Public Health England) and the Child Accident Prevention Trust:
- Choking, suffocation and strangulation was the leading cause of accidental death among the under fives with an average of 28 deaths each year in England, and half of children who die are aged under one year. Hospital admissions are very rare.
- Falls are the main cause of injury-related admission for under fives (20,000 per year) with most admissions resulting from falls from furniture although falls from stairs and steps are also significant. Deaths are rare with about five per year. Children under one mostly fall from beds or highchairs, or while being carried.
- Poisoning is the third most common cause of injury-related hospital admission for under fives (4,000 per year) with 70% of admissions from medicines and 20% from household or garden chemicals. Deaths are very rare. Other hazards include carbon monoxide, button batteries (and chemical burns), certain plants and e-cigarette refills.
- Burns and scalds are the fourth highest cause of hospital admission for under fives, and the injuries can be disabling and disfiguring and are expensive to treat. Hot drinks cause the majority of the injuries. Admissions peak at ages 12 to 23 months, but hot bathwater causes the most serious injuries with 21% of admissions from bathwater scalds resulting in hospital stays of more than three days. Burns and scalds also result from hot water on cookers, kettles, radiators and pipes, and hair straighteners.
- Drowning is the second leading cause of injury-related death for under fives with, on average, 13 children dying each year (90% of which are aged 1-4 years). Where the cause is known, 40% of deaths are from drowning in the bath, but drowning can also occur in ponds, paddling pools and swimming pools. Hospital admissions are rare.
- Smoke, fire and flames kill four under fives each year. Smoke kills, but burns can result in very serious injuries requiring long periods of treatment. The main causes of accidental house fire (2014 to 2015) were cooking appliances and the misuse of equipment or appliances, but smoking materials lead to the most deaths. Half of house fires attended by Fire and Rescue Services were homes without a working smoke alarm).
- Seven children aged 0-4 years were killed and 231 seriously injured on the roads in 2014. Seven in ten (69%) of the children injured were pedestrians. Seven in ten children travel in incorrectly fitted car seats.
From Accidents Don’t Have to Happen report published by the Royal Society for the Prevention of Accidents in 2018, the top five causes of hospital admission (2012/13 to 2016/17) were detailed by age of the child. Inanimate forces include striking, being struck or being crushed by an object, and animate forces include striking, being struck or being crushed by a person or injured by an animal.
| Top cause of admission | 0-4s | 5-14s | 15-24s | |
| 1 | Falls | Falls | Falls | |
| 2 | Inanimate forces | Inanimate forces | Inanimate forces | |
| 3 | Poisoning | Road accidents | Road accidents | |
| 4 | Burns or scalds | Animate forces | Animate forces | |
| 5 | Animate forces | Poisoning | Poisoning |
The report also details the top five causes of death (2013-2016) by age of the child. Threats to breathing covers suffocation, strangulation and choking.
| Top cause of death | 0-4s | 5-14s | 15-24s | |
| 1 | Threats to breathing | Road accidents | Road accidents | |
| 2 | Road accidents | Threats to breathing | Poisoning | |
| 3 | Drowning | Drowning | Drowning | |
| 4 | Inanimate forces | Falls | Threats to breathing | |
| 5 | Fire | Poisoning | Falls |
The top five causes differ slightly from those stated within the Preventing Unintentional Injuries report although report similar conclusions related to the different risks related to injury. The slight differences could be because a different time period has been used, different data sources or different definitions have been used related to either injury or the cause of the injury.
From the report on Reducing Unintentional Injuries In and Around the Home Among Children Under Five Years from the The Office for Health Improvement & Disparities (formerly Public Health England), the Royal Society for the Prevention of Accidents and the Child Accident Prevention Trust, in the UK, accidental injuries are the most common cause of death in children under one year of age. Children under five are most at risk from an injury in the home, with boys more likely to be injured than girls. Choking, suffocation and strangulation, falls, poisoning, burns and scalds and drowning are the most common accidental injuries among children under five years accounting for 90% of hospital admissions in the under fives. They go on to state that they are a significant cause of preventable death and serious long term harm. There is a strong association between deprivation and unintentional injuries, with children and young people living in the most deprived areas more at risk of been killed or serious injured from an unintentional injury. For example, children living in the most disadvantaged areas have a 50% higher risk of being burned, scalded or poisoned resulting in primary or secondary care attendance than those in the most advantaged areas.
A report on reducing unintentional injuries on the roads among children and young people under 25 years by The Office for Health Improvement & Disparities (formerly Public Health England) in 2018 in partnership with Royal Society for the Prevention of Accidents and the Child Accident Prevention Trust stated that although the rate of children and young people aged 0-24 years killed or seriously injured in road traffic collisions have fallen in recent years, there were 69 child deaths in 2016 in England up from 54 the year before and that this was the highest number since 2009.
Their report discusses a range of other guidance on active travel, spatial planning and healthy high streets that also provide a range of actions for local authorities from overall policy to practical implementation that can improve transport and the build environment which can impact on accident prevention. They describe a four-step model to help build robust injury prevention strategies focusing on three priority areas:
- Improving safety for children travelling to and from school.
- Introduce 20 mile an hour limits and zones in priority areas as part of a safe system approach to road safety.
- Action to prevent traffic injury and improve health works best when it is coordinated.
Their report also examines the economic case for prevention. They state that the cost of road traffic accidents is high, and reference that The Chief Medical Officer highlighted that the average medical and ambulance cost to the NHS was around £14,000 for every serious injury. This excludes other costs such as accident and emergency attendances, long-term treatment, social care, social security costs and productivity losses.
Over all ages, the Department for Transport estimate that the total costs in 2020 prices are £2,948 million for fatal accidents, £4,517 million for serious accidents and £1,783 million for slightly accidents totalling £9,248 million per year across the UK. Furthermore, they estimate that damage only accidents cost £3,261 million and that there is a further £15,872 million per year in terms of cost from non-fatal accidents not reported to the police. This gives a total of £28,380 million which includes casualty-related costs (lost economical productivity, medical and ambulance costs, and human cost) and accident-related costs (police costs, insurance and administrative costs, and damage to property).
The Hull Picture
Accidents and Injuries
Comprehensive, accurate data relating to all accidents and injuries among children and young people is not available as many accidents and injuries will not need hospital treatment and will be treated in primary and/or Urgent Care Centres. In addition, the availability and accuracy of A&E data is limited. Whilst the hospital admissions data is generally examined, it is recognised that this will not evidence the true impact of all accidents and injuries on children and young people.
Hospital Admissions Caused by Unintentional and Deliberate Injuries
For 2024/25, the hospital admission rate was in Hull for unintentional and deliberate injuries was statistically significantly higher in Hull compared to England for children aged 0-14 years and young people aged 15-24 years.
The Office for Health Improvement & Disparities’ Fingertips gives the total number of admission rates for unintentional and deliberate injuries to children and young people per 10,000 population.
Compared with benchmark
| Indicator | Period | England | Yorkshire and the Humber region (statistical) | Kingston upon Hull | East Riding of Yorkshire | North East Lincolnshire | North Lincolnshire | York | North Yorkshire UA | Barnsley | Doncaster | Rotherham | Sheffield | Bradford | Calderdale | Kirklees | Leeds | Wakefield |
|---|---|---|---|---|---|---|---|---|---|---|---|---|---|---|---|---|---|---|
Hospital admissions caused by unintentional and deliberate injuries in children (aged 0 to 4 years) (Persons 0-4 yrs) | 2024/25 | 88.7 | 98.2 | 104.5 | 108.5 | 156.6 | 155.0 | 145.7 | 116.4 | 93.5 | 92.1 | 75.8 | 56.5 | 135.3 | 101.3 | 102.7 | 57.7 | 102.3 |
Hospital admissions caused by unintentional and deliberate injuries in children (aged 0 to 14 years) (Persons <15 yrs) | 2024/25 | 68.5 | 72.9 | 85.7 | 87.3 | 104.7 | 107.5 | 88.4 | 84.6 | 67.2 | 77.7 | 62.1 | 52.3 | 85.2 | 67.6 | 69.3 | 50.3 | 74.5 |
Hospital admissions caused by unintentional and deliberate injuries in young people (aged 15 to 24 years) (Persons 15-24 yrs) | 2024/25 | 79.8 | 83.4 | 114.3 | 101.4 | 127.6 | 145.1 | 63.2 | 89.9 | 137.4 | 139.6 | 82.9 | 68.1 | 77.1 | 76.3 | 83.2 | 40.8 | 125.3 |
The rate of admissions in Hull has decreased among those aged 0-4 years. The rate reduced by one-third from 2011/12 when the rate was at its highest at 167.7 admissions per 10,000 population to 2019/20 (to 124.4 per 10,000 population). There was a relatively sharp decrease between 2019/20 and 2020/21 (decreasing by 22%), which is likely to have occurred – at least in part – due to the COVID-19 pandemic. People’s behaviours changed throughout the pandemic which could have influenced the number of accidents and injuries that occurred. Furthermore, people may have been less likely to attend A&E for instance which may have reduced the likelihood of hospital admission. Over the same period of time, the decreases in England and across the region have not been as marked. Between 2020/21 and 2022/23, there was a further sharp reduction in the admission rate in Hull so that the rate in Hull was lower than England, but the admission rate in Hull has increased sharply in 2023/24 before a small reduction in 2024/25. The rate in Hull remains lower than pre-pandemic levels, but in 2024/25 was not statistically significantly different to England.
Among children aged 0-4 years living in Hull, there were 170 hospital admissions caused by unintentional and deliberate injuries in 2024/25 which was almost half the number for 2011/12 when there were 326 admissions (numbers generally are rounded to the nearest five on Fingertips).
Compared with benchmark
Hospital admissions caused by unintentional and deliberate injuries in children (aged 0 to 4 years) (Persons 0-4 yrs)
|
Period
|
Kingston upon Hull |
Yorkshire and the Humber region (statistical)
|
England
|
||||
|---|---|---|---|---|---|---|---|
|
Count
|
Value
|
95%
Lower CI |
95%
Upper CI |
||||
| 2010/11 | • | 265 | 156.1 | 137.9 | 176.1 | 153.1 | 143.4 |
| 2011/12 | • | 326 | 187.5 | 167.7 | 208.9 | 152.1 | 148.3 |
| 2012/13 | • | 305 | 170.0 | 150.9 | 189.6 | 136.2 | 135.1 |
| 2013/14 | • | 330 | 180.9 | 163.0 | 202.7 | 146.6 | 141.5 |
| 2014/15 | • | 315 | 172.5 | 155.0 | 193.8 | 136.3 | 138.7 |
| 2015/16 | • | 270 | 148.6 | 131.9 | 168.0 | 128.5 | 131.4 |
| 2016/17 | • | 260 | 144.2 | 128.2 | 164.0 | 127.7 | 128.8 |
| 2017/18 | • | 250 | 141.7 | 125.2 | 161.0 | 125.5 | 123.9 |
| 2018/19 | • | 235 | 137.2 | 120.2 | 155.9 | 130.0 | 126.5 |
| 2019/20 | • | 210 | 125.3 | 108.9 | 143.5 | 121.2 | 120.4 |
| 2020/21 | • | 160 | 97.4 | 82.9 | 113.7 | 107.8 | 112.1 |
| 2021/22 | • | 155 | 98.2 | 83.9 | 115.6 | 108.8 | 103.6 |
| 2022/23 | • | 120 | 75.6 | 63.8 | 91.8 | 101.9 | 92.0 |
| 2023/24 | • | 175 | 107.6 | 93.4 | 126.1 | 111.6 | 92.7 |
| 2024/25 | • | 170 | 104.5 | 88.2 | 120.1 | 98.2 | 88.7 |
Source: OHID, based on NHS England and Office for National Statistics data
Rates also decreased by around one-third among children and young people aged 0-14 years falling from 157.6 to 106.3 per 10,000 population between 2011/12 and 2019/20. There was a sharp decrease between 2019/20 and 2020/21 with the hospital admission rate falling by 35% in Hull. Again, this is likely to have been caused – at least in part – by the COVID-19 pandemic. The rate then increased between 2020/21 and 2023/24 in Hull, before a small decrease in 2024/25, with the rate remaining lower than pre-pandemic levels.
Among children aged 0-14 years living in Hull, there were 445 hospital admissions caused by unintentional and deliberate injuries in 2024/25. The numbers are considerably lower than a decade ago (with a peak of 714 admissions during 2011/12).
Compared with benchmark
Hospital admissions caused by unintentional and deliberate injuries in children (aged 0 to 14 years) (Persons <15 yrs)
|
Period
|
Kingston upon Hull |
Yorkshire and the Humber region (statistical)
|
England
|
||||
|---|---|---|---|---|---|---|---|
|
Count
|
Value
|
95%
Lower CI |
95%
Upper CI |
||||
| 2010/11 | • | 643 | 143.1 | 132.3 | 154.6 | 127.3 | 115.2 |
| 2011/12 | • | 714 | 157.6 | 146.3 | 169.6 | 128.0 | 118.3 |
| 2012/13 | • | 635 | 138.4 | 127.6 | 149.3 | 109.7 | 104.0 |
| 2013/14 | • | 655 | 140.1 | 129.8 | 151.5 | 121.2 | 112.5 |
| 2014/15 | • | 680 | 143.3 | 132.9 | 154.7 | 116.4 | 110.1 |
| 2015/16 | • | 635 | 131.3 | 121.7 | 142.4 | 108.8 | 104.9 |
| 2016/17 | • | 625 | 126.6 | 117.3 | 137.3 | 108.0 | 102.4 |
| 2017/18 | • | 600 | 119.9 | 110.3 | 129.7 | 106.4 | 97.8 |
| 2018/19 | • | 570 | 112.9 | 104.2 | 123.0 | 105.0 | 98.1 |
| 2019/20 | • | 525 | 103.7 | 94.8 | 112.8 | 97.5 | 93.6 |
| 2020/21 | • | 345 | 68.5 | 61.6 | 76.3 | 76.3 | 78.2 |
| 2021/22 | • | 455 | 91.4 | 83.2 | 100.2 | 85.4 | 84.3 |
| 2022/23 | • | 405 | 80.3 | 72.8 | 88.7 | 80.7 | 75.3 |
| 2023/24 | • | 480 | 93.3 | 85.0 | 101.9 | 81.4 | 72.3 |
| 2024/25 | • | 445 | 85.7 | 77.5 | 93.6 | 72.9 | 68.5 |
Source: OHID, based on NHS England and Office for National Statistics data
Among young people aged 15-24 years, large decreases were seen between 2010/11 and 2014/15, the rate then remained relatively unchanged until 2018/19, after which the rates again decreased although there was a smaller reduction in the rate between 2019/20 and 2020/21 due to the pandemic when compared to younger children. Apart from a blip in 2022/23, the rate has remained relatively unchanged since the pandemic.
In 2024/25, there were 400 hospital admissions caused by unintentional and deliberate injuries among those aged 15-24 years.
Compared with benchmark
Hospital admissions caused by unintentional and deliberate injuries in young people (aged 15 to 24 years) (Persons 15-24 yrs)
|
Period
|
Kingston upon Hull |
Yorkshire and the Humber region (statistical)
|
England
|
||||
|---|---|---|---|---|---|---|---|
|
Count
|
Value
|
95%
Lower CI |
95%
Upper CI |
||||
| 2010/11 | • | 899 | 215.3 | 201.4 | 229.8 | 167.4 | 154.9 |
| 2011/12 | • | 753 | 183.8 | 170.9 | 197.4 | 167.8 | 145.6 |
| 2012/13 | • | 655 | 160.5 | 148.2 | 173.0 | 145.9 | 131.5 |
| 2013/14 | • | 690 | 175.5 | 162.9 | 189.3 | 151.6 | 137.1 |
| 2014/15 | • | 555 | 143.2 | 131.8 | 155.9 | 139.0 | 131.9 |
| 2015/16 | • | 555 | 145.9 | 134.0 | 158.5 | 141.3 | 133.4 |
| 2016/17 | • | 600 | 160.9 | 148.8 | 174.9 | 141.2 | 128.2 |
| 2017/18 | • | 560 | 149.3 | 137.0 | 162.0 | 146.7 | 131.5 |
| 2018/19 | • | 540 | 147.1 | 135.2 | 160.4 | 145.9 | 135.7 |
| 2019/20 | • | 445 | 123.3 | 112.1 | 135.3 | 134.7 | 130.7 |
| 2020/21 | • | 395 | 112.8 | 102.3 | 124.8 | 106.5 | 112.1 |
| 2021/22 | • | 390 | 113.1 | 102.2 | 124.9 | 110.6 | 118.4 |
| 2022/23 | • | 430 | 126.6 | 114.3 | 138.5 | 92.5 | 93.9 |
| 2023/24 | • | 395 | 115.0 | 104.2 | 127.2 | 89.9 | 88.2 |
| 2024/25 | • | 400 | 114.3 | 102.8 | 125.5 | 83.4 | 79.8 |
Source: OHID, based on NHS England and Office for National Statistics data
With such a large relatively decrease in the admission rate during the COVID-19 pandemic, it might be expected the rates would ‘bounce back’ and increase subsequently, and whilst this has been the case, the current levels remain below pre-pandemic admission rates.
Effect of Deprivation on Hospital Admissions for Accidents and Injuries
Local data were available for 2015/16, and it was found that there was a much higher admission rate among the most deprived fifth compared to least deprived fifth of areas of Hull (35% higher for 0-14s and 23% higher for 0-4s) with significant differences across the wards (admissions of 66 in Avenue and 155 in Newland per 100,000 population for 0-14s). Among young people aged 15-24 years, there were also significant local inequalities (220 versus 107 admissions per 100,000 population for most and least deprived fifths of areas in Hull) and across the wards (admissions of 63 and 279 per 100,000 population in Boothferry and St Andrew’s wards respectively).
Road Traffic Accidents
The Office for Health Improvement & Disparities’ Fingertips also includes information on the rate of children and young people killed or seriously injured on England’s roads among those aged under 16 years. The rate is given as the number per 100,000 population.
The rate in Hull is 80% higher than England for 2021-23 (35.3 versus 19.7 per 100,000 population).
Safer Roads Humber also provide information on road traffic accidents across the Humberside region including the number of engagement activities, maps showing all collisions (by severity) across the Humberside, and casualty statistics across Humberside. Information is also available separately for each local authority.
Details of non-injury road traffic collisions can also be reported online in the Humberside Police area. It is possible that more less serious injuries are reported locally due to the ease of reporting non-injury road traffic collisions. This could mean that reported figures for Hull are higher than England if there is a higher rate of reporting of non-injury road traffic collisions.
Compared with benchmark
| Indicator | Period | England | Yorkshire and the Humber region (statistical) | Kingston upon Hull | East Riding of Yorkshire | North East Lincolnshire | North Lincolnshire | York | North Yorkshire UA | Barnsley | Doncaster | Rotherham | Sheffield | Bradford | Calderdale | Kirklees | Leeds | Wakefield |
|---|---|---|---|---|---|---|---|---|---|---|---|---|---|---|---|---|---|---|
Children killed and seriously injured (KSI) on England's roads (Persons <16 yrs) | 2021 - 23 | 19.7 | 33.3 | 35.3 | 17.1 | 49.8 | 25.3 | 9.0 | 21.8 | 38.3 | 50.4 | 34.0 | 30.9 | 39.0 | 36.9 | 30.1 | 40.1 | 30.8 |
Over the three year period 2020-22, there were 48 children aged 0-15 years who were killed or seriously injured on Hull’s roads equating to on average 16 children per year. There had been 71 during the three year period 2017-19 equating to an average of 24 children per year. The numbers decreased in 2020 and 2021 due to the COVID-19 pandemic and fewer children travelling to and from school. It is possible that the numbers will increase in the next couple of years (without any other changes) at levels return to pre-pandemic levels.
Compared with benchmark
Children killed and seriously injured (KSI) on England's roads (Persons <16 yrs)
|
Period
|
Kingston upon Hull |
Yorkshire and the Humber region (statistical)
|
England
|
||||
|---|---|---|---|---|---|---|---|
|
Count
|
Value
|
95%
Lower CI |
95%
Upper CI |
||||
| 2011 - 13 | • | 57 | 39.1 | - | - | 40.2 | 26.7 |
| 2012 - 14 | • | 61 | 41.5 | - | - | 37.7 | 25.1 |
| 2013 - 15 | • | 63 | 42.0 | - | - | 36.5 | 23.8 |
| 2014 - 16 | • | 55 | 36.1 | - | - | 34.3 | 23.0 |
| 2015 - 17 | • | 57 | 36.9 | - | - | 33.6 | 22.0 |
| 2016 - 18 | • | 62 | 39.3 | 30.2 | 50.4 | 32.8 | 21.2 |
| 2017 - 19 | • | 71 | 44.6 | 34.8 | 56.2 | 32.6 | 20.8 |
| 2018 - 20 | • | 57 | 35.6 | 27.0 | 46.1 | 29.5 | 18.8 |
| 2019 - 21 | • | 47 | 29.4 | 21.6 | 39.1 | 28.0 | 18.1 |
| 2020 - 22 | • | 48 | 30.0 | 22.1 | 39.7 | 29.9 | 18.1 |
| 2021 - 23 | • | 57 | 35.3 | 26.7 | 45.7 | 33.3 | 19.7 |
Source: OHID, based on Department for Transport and Office for National Statistics data
Effect of COVID-19 Pandemic on Road Traffic Accidents
Analysis of the local data compared with national data has shown that in many areas of the country, the number of road traffic accidents reduced as there were fewer people travelling on the roads and fewer vehicles. However, for Hull, it has been noted that the speed of vehicles travelling on Hull’s roads increased as there were fewer cars and vehicles and less congestion. This resulted in an increase in the number of speed-related accidents in Hull. However, as road traffic usage returned to pre-pandemic levels, the number of speed-related accidents fell.
This observation might not be reflected in the hospital admission rates and casualty rates above as not all accidents will result in the accident being recorded or result in a hospital admission.
Strategic Need and Service Provision
The five priorities relating to accidents among under fives given by the Office for Health Improvement & Disparities (formerly Public Health England) are drowning, choking and strangulation, poisoning, burns and scalds, and falls.
Parents and carers of children under the age of five years should be aware of the risks and dangers to young children in the home and whilst travelling, and should be given information, advice, guidance and support to reduce these dangers. These introduced risks and dangers are generally discussed during pregnancy and post-natal period through to early years by staff working across maternity and early years services, who are in a vital position to raise parental awareness and offer advice and guidance through routine and specific contacts across the maternity and early years journey. Routine contacts including home visits provide ideal opportunities to promote accident prevention measures.
The Hull and East Riding Safe Sleeping Group promotes safe sleeping habits for babies. Other events promoting home safety are the National Play Day event and Christmas Child Safety Campaign. Free resources are also available in the form of a downloadable book looking at accidents and how to avoid them, road safety and children’s car seat safety.
The Humber Children’s Partnership Programme includes a focus on health promotion and prevention and reducing health inequalities through a system-wide approach. The Children’s Community Care (The Ill Child) project includes improving the health literacy of families across the Humber, with parents and staff understanding when and where to access advice and support services in their local community with an emphasis on self-management. The project is also developing the system response in reducing accidental injuries within the most deprived communities.
Hull City Council have also produced some Accident Prevention Videos which cover the prevention of accidents among under fives relating to poisoning, drowning, stairs, hot drinks and other hazards around the home.
Hull also has a dedicated service which focuses on unintentional injuries in children aged 0-5 years of age as well as the promotion of safer sleep practices with children up to 12 months of age. The service provides specialist training to key professionals working with families as well as direct work with families in Hull, with the sole aim of reducing hospital admissions due to unintentional injuries and raise awareness of safer sleep practices.
The rates of pedestrian, pedal cyclists and motorcyclist casualty in Hull are higher than the England average, this is likely due to the high number of pedestrians, pedal cyclists and motorcyclist using the roads in Hull compared to rural areas., as well as the reporting system used by Humberside Police, which allows members of the public to directly report incidents through their website, resulting in a greater likelihood of road traffic accidents being reported in Hull compared to other areas that do not have that facility.
There is growing anecdotal evidence that more children are being injured as passengers in cars in Hull, which is a trend mirroring the national trend. This is perhaps not surprising, given that car seat safety checks undertaken in Hull consistently show that around 80% of child seats are fitted incorrectly.
Road Safety services and other key partners attend the monthly Hull Birth Preparation and Parent Education ‘Hey Baby Carousel’ and provide information related to car seat safety and accident prevention information for parents-to-be. This service has been temporarily paused due to the pandemic, with plans for this to be reinstated as services across the NHS are restored.
Cycle Safety continues to be at the forefront of Road Safety starting with the provision of free Bikeability cycle training across school Years 5 (aged 9-10) and 6 (aged 10-11) across the City which is complimented by Hull City Council giving a free cycle helmet to each child that takes part in the Council’s scheme. This is complimented by an adult cycle training programme, Rusty Riders. This is complimented with Operation Safe pass, a joint initiative between Humberside Police and Hull City Council to highlight to motorist the legal requirements to give all cyclists plenty of room when passing.
Pupils in Years 3 (aged 7-8) or 4 (aged 8-9) also benefit from Pedestrian Skills training (Green Cross Code) in all Hull primary schools.
Kid Alert is an annual initiative involving around 2,000 Year 6 (aged 10-11) children who go through a series of scenarios looking at different areas of safety.
In relation to unintentional and deliberate injuries and road traffic accidents to children and young people aged 0-24 years, the numbers are relatively small when examining some specific types of causes of injury, and from a statistical point of view this present its own problems when presenting and interpreting the data. For further information, see Small Numbers in the Glossary.
Resources
The Office for Health Improvement & Disparities’ Fingertips: https://fingertips.phe.org.uk/
UK Government. Preventing injuries in the under 5s: https://www.gov.uk
NICE. Unintentional injuries – prevention strategies for under 15s: https://www.nice.org.uk/guidance/ph29
Royal Society for the Protection of Accidents: www.rospa.com
NHS: www.nhs.uk
Unintentional injuries prevention in children under 5 years. https://www.gov.uk/government/publications/unintentional-injuries-prevention-in-children-under-5-years
Reducing Unintentional Injuries In and Around the Home Among Children Under Five Years. The Office for Health Improvement & Disparities (formerly Public Health England), the Royal Society for the Prevention of Accidents and the Child Accident Prevention Trust. https://assets.publishing.service.gov.uk/government/uploads/system/uploads/attachment_data/file/696646/Unintentional_injuries_under_fives_in_home.pdf#:~:text=Unintentional%20injuries%20in%20and%20around%20home%20are%20a,of%20the%20children%20aged%201%20to%204%20yearsb.
Reducing Unintentional Injuries on the Roads Among Children and Young People Under 25 Years. The Office for Health Improvement & Disparities (formerly Public Health England), the Royal Society for the Prevention of Accidents and the Child Accident Prevention Trust. https://assets.publishing.service.gov.uk/government/uploads/system/uploads/attachment_data/file/695781/Reducing_unintentional_injuries_on_the_roads_among_children_and_young_people_.pdf
Child Accident Prevention Trust. https://www.capt.org.uk
Hull City Council. Accident Prevention Videos. https://www.hull.gov.uk/children-and-families/family-support/accident-prevention-under-fives
Good Egg Safety Guides. https://hull.goodeggsafety.com/
The Office for Health Improvement & Disparities (formerly Public Health England), Royal Society of the Protection of Accidents, and the Child Accident Prevention Trust. Reducing unintentional injuries on the roads among children and young people under 25 years. The Office for Health Improvement & Disparities, 2018.
Department for Transport. Total value of prevention of reported accidents by severity and cost element, 2020.
Safer Roads Humber. http://www.saferroadshumber.com/
Humberside Police. Collisions and Incidents. https://www.humberside.police.uk/advice/advice-and-information/rs/road-safety/collisions/
Humberside Police. Non-Injury Road Traffic Collision. https://www.humberside.police.uk/ro/report/rti/rti-beta-2.1/report-a-road-traffic-incident/
Updates
This page was last updated / checked on 17 June 2026.
This page is due to be updated / checked in July 2026.