Background
There are specific individual pages relating to the health needs of Children and Young People within the main menu. However, this page combines this information relating to those specific topic areas together with other factors influential relating to the health needs of children and young people. This includes information on population and population projections found under Population, and information on the wider determinants of health such as deprivation and education mentioned under Health and Wellbeing Influences into a single – rather long – page of information relating to children and young people. As parental, carer and adult, and family circumstances, behaviours and lifestyles are hugely influential on children and young people, some factors below relate to adults with further information covered in more detail within the Adults or Vulnerable Groups.
Key Points
- Hull has a relatively young population compared to England.
- In 2019, it is estimated that 259,778 people live in Hull with almost one-quarter (24.4%) of them aged 0-19 years (63,469).
- In January 2019, 22.8% of children attending Hull schools were from Black and Minority Ethnic groups (9,701 children out of 42,613).
- There are just over 3,000 births each year in Hull.
- In January 2020, there were 70,852 children and young people aged 0-19 years who were registered with Hull GPs.
- The population of 0-19s is projected to increase slightly (by 130-260 per year) to a high of 64,246 for the year 2023 before decreasing until 2038 with the greatest decrease of around 400-500 per year around 2030. Many factors can influence births, deaths and migration, so estimates further into the future are more likely to be more inaccurate. This masks changes for different single years of age and age groups though. Between 2018 and 2025, the number of 0-4s and 5-9s are projected to decrease by 10% and 8% respectively whereas the number of 10-14s and 15-19s are projected to increase by 10% and 18% respectively.
- High levels of deprivation and child poverty which impact severely on all aspects of life for children, adults, families and communities, as well as many other issues associated with deprivation and poverty.
- Hull is among most deprived 2% of local authorities in England (fourth out of 317).
- Three in ten children in Hull living in relative poverty compared to 18% for England.
- The rate of households with dependent children or pregnant women as unintentionally homeless and eligible for assistance was twice as high as England in 2017/18 (3.6 versus 1.7 per 1,000 households).
- Parental arguments and separation can have an impact on children. As might be expected, issues to do with work can be associated with tensions in a relationship. National research from Public Health England’s Improving Health Outcomes for Vulnerable Children and Young People has shown that children living in workless couple-parent families were almost three times more likely (27.6%) to have a parent reporting a distressed relationship as those where both parents worked (9.7%). This may lead to parental separation.
- Parental alcohol and substance abuse, parental mental health and domestic abuse rates are all high in Hull can can have a dramatic effect on children and their families. These three factors are often referred to as the ‘toxic trio’.
- The rates of children with Special Educational Needs or Disabilities is also relatively high in Hull.
- Children and young people have limited ability to influence their circumstances to improve their health and wellbeing so the focus must be on families. They are dependent in terms of:
- housing (quality of housing, space to eat together, garden to play in, quiet suitable place to do homework, etc);
- domestic and family circumstances (domestic abuse, parental employment, parental mental health, parental substance abuse, caring responsibilities, lone parent families, step families, etc);
- lifestyle factors (diet, physical activity, healthy weight, smoking, alcohol, substance abuse, etc);
- education (quality of school, parental support, access to books, the internet and home tablets and computers, etc); and
- a host of other factors outside their control.
- The health of babies and infants gets off to a poor start in Hull.
- One in five pregnancy women in Hull smoked during their pregnancy twice as many as England.
- Only one-third of babies were breastfed at 6-8 weeks compared to over 45% in England.
- Fewer children in Hull are ready for school.
- The rate of children in need and looked after children is high in Hull.
- In 2018, 2,513 children were identified as ‘in need’ has abuse or neglect identified as the primary reason which represents a rate of 445 per 10,00 children which is more than twice as high as England (181).
- There is a very high rate of looked after children in Hull with twice the rate of looked after children compared to England.
- Use of healthcare is high in Hull and dental health is poor in Hull.
- Vaccination rates among young children (under fives) are generally comparable to or higher than England, although in some cases are still below the national targets. The exception is the flu vaccination among 2-3 year olds and primary school pupils. Vaccination rates among secondary school pupils are worse though in relation to vaccinations for human papillomavirus (HPV) and the Meningococcal ACWY conjugate.
- From Hull’s Young People Health and Wellbeing Survey conducted in 2016, 23% of boys and 14% of girls stated their general health was excellent and a further 37% of boys and 36% of girls stated it was very good. Overall, 9% of boys and 12% of girls stated their health was fair and 2.2% of boys and 2.9% of girls stated their health was poor. Self-reported health deteriorated with age.
- One in ten boys and 13% of girls reported having a long-term illness or disability that limited their daily activities.
- Improvements have been made in dental health, but the percentage of 5 year olds with experience of visually obvious dental decay is 50% higher than England.
- Attendance at A&E and admissions to hospital are generally higher than England, although this is not across all age groups or medical conditions. However, in the case of those aged 0-4 years, A&E attendances and admissions relating to diabetes, epilepsy, alcohol and substance abuse the rates in Hull are substantially higher than England. Across all age groups, A&E admission rates in Hull have increased sharply between 2016/17 and 2018/19, and whilst emergency hospital have decreased slightly in Hull between 2015/16 and 2018/19 they are still higher than England.
- High levels of poor lifestyle choices among children such as smoking, poor diet, inactivity, alcohol and drug consumption, and obesity.
- Smoking, poor diet, inactivity, obesity, and alcohol and substance misuse are high among adults in Hull which has a high impact on children, and can also impact on children’s future health and health behaviours.
- Just under a half of young people in Hull live with a smoker.
- High levels of child obesity.
- Low levels of children in Hull eating 5-A-DAY.
- High levels of physical inactivity.
- High levels of hospital admission rates for alcohol and substance abuse among young people in Hull.
- Outcomes are also worse among teenagers.
- Educational attainment is lower than England.
- The percentage of 16-17 year olds not in education, employment or training (NEET) is higher than England.
- Despite considerable progress in the rate of under 18 conceptions in the last 10-15 years the rate is still much higher than England.
- The rate of first time entrants into the youth justice system is around 40% much higher than England.
Factor Influencing Health and Wellbeing
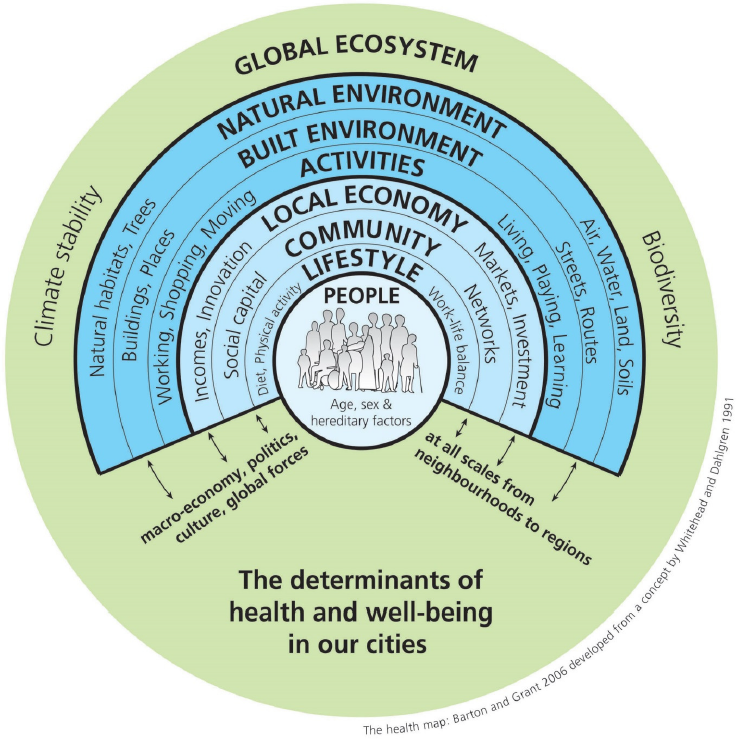
Everything affects our health and wellbeing. There are factors that cannot be changed such as age, gender and hereditary factors. However, lifestyle and behaviour, the local community, economy, and environment all influence health and wellbeing.

Two key influential factors on health and wellbeing are having good quality education and employment. Being in good work is better for your health than being out of work. ‘Good work’ is defined as having a safe and secure job with good working hours and conditions, supportive management and opportunities for training and development. There is clear evidence that good work improves health and wellbeing across people’s lives and protects against social exclusion. Conversely, unemployment is bad for health and wellbeing, as it is associated with an increased risk of mortality and morbidity. Unemployment and being in poor quality employment can have a profound affect on children and young people growing up in these households. Poverty and deprivation which result have a huge effect on everybody affected. However, they can also have an impact their social norm, motivation, life expectations and ultimately on their education.
Good education improves career prospects, raises aspirations, and gives people more financial control over their lives. Poor education and training, and low educational attainment can affect confidence, aspirations, and increase the risk of lifelong unemployment, benefit dependency or low paid employment. These factors have a strong influence on health and wellbeing. Children (and adults) with low confidence and aspirations, and with low educational attainment are more likely to make poor choices in their lives, are less likely to achieve well-paid satisfying regular employment, have poor resilience, and increase the likelihood of poor health and wellbeing.
Children and young people have limited ability to influence their circumstances to improve their health and wellbeing so the focus must be on families and crucially giving children the best start in life. Children and young people can mimic parental behaviour, and poor life choices, poor parenting, mental health problems and domestic abuse can result in cyclic behaviour from generation to generation if it is not addressed.
Further information relating to external factors which affect health such as Deprivation and Poverty, Housing, Environment Factors, Educati0n and Qualifications, Employment, Economy and Healthy Workplaces, and Financial Resilience are given for Hull. Lifestyle and behavioural factors which influence health are examined within Adults and within Children and Young People.
Health Needs Assessments
Various health needs assessments have been completed in Hull for children and young people, and these include the following:
- Special Educational Needs and Disability
- Learning Disability
- Oral Health
- Mental Health and Emotional Wellbeing
- Maternity
Deprivation and Poverty
—Impact on Health, Wellbeing and Society
Poverty is not having enough money to get by on whereas deprivation refers to a more general lack of resources and opportunities. Unemployment, poor housing, lack of qualifications, debt, low income, fuel poverty, crime and many other social and environmental factors all indirectly affect the health of the population. Increased deprivation means that there is poorer health, but this is compounded as poor health also affects other measures such as employment and motivation to improve employment, education and the person’s environment such as housing. People in more deprived areas also tend to have lower health expectations and potentially fewer GPs per population so there are more likely to be delays in diagnosis and treatment which will influence survival. People living in more affluent areas tend to be among the first to initiate positive health changes whereas people living in more deprived areas find it more difficult to change due to the stress of poverty and increased pressures of life. Consequently, those who live in the most deprived areas are more likely to have individual risk factors for ill health such as smoking, poor diet and lack of exercise. There may also be more barriers in relation to access to health improvement services such as financial barriers, transport issues, access to local cheap good quality fresh fruit and vegetables, and safe access to parks.
Poverty and deprivation affect everyone who is affected but the effects are high for children and young people as they have even less control in relation to these influential factors.
Children living in more deprived areas are more likely to grow up thinking that poverty, poor housing, and unemployment are the norm, which could result in cyclic behaviours with these children behaving as their parents do as they reach adulthood.
High levels of inequalities exist in children and young people when comparing those living in the most deprived areas of England and those living in the least deprived areas of Hull. Some of the health inequalities are illustrated by Public Health England below, although inequalities are not restricted to health alone and occur in all aspects of a child’s life.

—Deprivation Levels in Hull
Hull has high levels of both poverty and deprivation. In general, in relation to national averages, Hull has a higher unemployment rate, more poor housing, residents qualified to a lower level and higher levels of crime.
Based on the Index of Multiple Deprivation 2019 score, Hull is the fourth most deprived local authority in England (out of 317) which is in the most 2% of local authorities in England. Nationally an IMD score is calculated for each lower layer super output area (LSOA) in England which is a geographical area of around 1,500 residents and there are 166 such areas in Hull. More than half (54%) of Hull’s LSOAs are amongst the most deprived 20% nationally. Only four of Hull’s 166 LSOAs were in the least deprived fifth of LSOAs nationally. Hull has the fourth highest percentage of LSOAs within the most deprived 10% within England.

As Hull has so few geographical areas in the least deprived fifth nationally, local analyses generally use the local deprivation fifths. Hull’s 166 geographical areas are divided into five groups (approximately 33 areas each) from most deprived fifth to least deprived fifth.

—Child Poverty and Free School Meals
Child poverty measured as a family having claimed one or more of Universal Credit, Tax Credits or Housing Benefit at any point in the year to be classed as low income using income before housing costs and equivalised to adjust for family size and composition. Based on this definition, in 2018/19, there were 15,872 children aged under 16 years representing 30.7% of children who were defined to be in living in relative low income. Using this definition, the rate has increased in Hull since 2014/15.

The number of children aged under 16 years living in relatively low income households is also available for each ward in Hull. For the latest period 2018/19, the percentage vary from 9.4% in Kingswood to 48.7% in St Andrew’s and Docklands. There are 7,428 wards in England, and it is possible to rank the wards in order of percentage of relatively low income households. Almost half of Hull’s wards (ten out of 21) are in the top 5% nationally for having the highest percentage of under 16s living in relatively low income households. Given that Hull is in the most deprived 2% of local authorities nationally, it is not surprising that the percentage of under 16s living in households with a relatively low income is so high.

The following map illustrates the percentages of under 16s living in relative low income households for 2018/19 for each ward in Hull.

Another measure of child poverty relates to the number children aged 0-15 years who are living in households with below 60% median income before housing costs. Based on this definition, the percentage of children in low income households is even higher at 36.8% with 19,026 children aged 0-15 living in low income households using this definition. Hull is ranked 47 out of 379 local authorities in the UK (bottom 12%), and ranked 45 out of 314 local authorities in England (bottom 14%). The rate has increased over time using this definition by more than one-fifth from 30.0% in 2014/15.
Area | 2014/15 | 2015/16 | 2016/17 | 2017/18 | 2018/19 |
Hull (numbers) | 14,873 | 16,387 | 17,020 | 17,884 | 19,026 |
Hull (%) | 30.0 | 32.8 | 33.5 | 34.8 | 36.5 |
Y&H (%) | 28 | 29 | 30 | 30 | 32 |
England (%) | 29 | 29 | 30 | 31 | 31 |
Unsurprisingly, the percentage of children eligible for free school meals is high in Hull compared to England.
Compared with benchmark
Indicator | Period | England | Yorkshire and the Humber region | Kingston upon Hull | East Riding of Yorkshire | North East Lincolnshire | North Lincolnshire | York | Barnsley | Doncaster | Rotherham | Sheffield | Bradford | Calderdale | Kirklees | Leeds | Wakefield | North Yorkshire Cty |
---|---|---|---|---|---|---|---|---|---|---|---|---|---|---|---|---|---|---|
Free school meals: % uptake among all pupils (Persons School age) | 2018 | 13.5 | 15.5 | 22.3 | 11.7 | 15.8 | 13.7 | 7.4 | 18.0 | 15.3 | 15.0 | 20.2 | 17.6 | 14.3 | 19.0 | 15.6 | 13.0 | 8.1 |
The rate in Hull is highest in the Yorkshire and Humber region.
Compared with benchmark
Free school meals: % uptake among all pupils (Persons School age) 2018
Area |
Recent
Trend |
Count
|
Value
|
95%
Lower CI |
95%
Upper CI |
|
---|---|---|---|---|---|---|
England | 1099810 | 13.5 | 13.5 | 13.5 | ||
Yorkshire and the Humber region | 127876 | 15.5 | 15.4 | 15.5 | ||
Kingston upon Hull | 8989 | 22.3 | 21.9 | 22.7 | ||
East Riding of Yorkshire | 5347 | 11.7 | 11.5 | 12.0 | ||
North East Lincolnshire | 3743 | 15.8 | 15.3 | 16.2 | ||
North Lincolnshire | 3337 | 13.7 | 13.3 | 14.1 | ||
York | 1874 | 7.4 | 7.1 | 7.8 | ||
Barnsley | 6055 | 18.0 | 17.6 | 18.4 | ||
Doncaster | 7256 | 15.3 | 15.0 | 15.6 | ||
Rotherham | 6703 | 15.0 | 14.6 | 15.3 | ||
Sheffield | 16200 | 20.2 | 19.9 | 20.5 | ||
Bradford | 17656 | 17.6 | 17.4 | 17.9 | ||
Calderdale | 5203 | 14.3 | 13.9 | 14.6 | ||
Kirklees | 12818 | 19.0 | 18.7 | 19.3 | ||
Leeds | 19147 | 15.6 | 15.4 | 15.8 | ||
Wakefield | 6854 | 13.0 | 12.7 | 13.3 | ||
North Yorkshire Cty | 6694 | 8.1 | 7.9 | 8.3 |
Source: Department for Education School Census
The percentage uptake of free school meals has decreased in Hull, although it is possible that percentages will have increased in 2020 with the COVID-19 pandemic and its impact on employment.
Compared with benchmark
Free school meals: % uptake among all pupils (Persons School age)
Period
|
Kingston upon Hull |
Yorkshire and the Humber region
|
England
|
||||
---|---|---|---|---|---|---|---|
Count
|
Value
|
95%
Lower CI |
95%
Upper CI |
||||
2014 | • | 10192 | 27.7% | 27.3% | 28.2% | 17.3% | 16.3% |
2015 | • | 9273 | 24.8% | 24.4% | 25.2% | 16.2% | 15.2% |
2016 | • | 8776 | 22.9% | 22.5% | 23.3% | 15.5% | 14.3% |
2017 | • | 9130 | 23.1% | 22.7% | 23.5% | 15.7% | 13.9% |
2018 | • | 8989 | 22.3% | 21.9% | 22.7% | 15.5% | 13.5% |
Source: Department for Education School Census
Information relating to food insecurity (concerns over being able to provide food for the family) can be found under Financial Resilience both under Health and Wellbeing Influences.
Population Estimates
Based on mid-year resident population estimates from the Office for National Statistics, the population of Hull is around 260,000 with just over 3,000 births per year. Further information for both adults and children is given under Population Estimates under Population. With the University and other further educational establishments in Hull, and the tendency for young people to move into cities, there is a relatively large population aged 19-34 years in Hull compared to England.
Compared to England for children and young people, Hull has a higher percentage of its resident population aged 0-7 and 19 years, but lower percentages for the other ages under 20 years.

The table below gives the estimated number of residents in Hull as at mid-2019 for children and young people aged 0-19 years. Overall, almost one-fifth (24.4%) of all Hull’s resident population is aged 0-19 years.

Compared to England, the percentage of Black, Asian and Minority Ethnic (BAME) groups in Hull is relatively low, but there was a threefold increase in the BAME population between the 2001 and 2011 Censuses in Hull.
Over one in five children attending Hull schools are from BAME groups and this has doubled in the last decade. Currently around one in six pupils do not have English as their first language. There is also considerable variation across the wards and hence across Hull schools. Further information for both adults and children is available within Race and Ethnicity under Population, and also below for school children in the section relating to Schools and Educational Attainment.
Based on the GP registration file, the number of people living in Hull is around 20,000 higher than the official resident population estimate for Hull from the Office for National Statistics (ONS). Furthermore, around one in eleven patients registered with Hull GPs do not live in Hull with virtually all of them living in East Riding of Yorkshire. Further information on the resident population estimates and registered GP population from the GP registration file for both adults and children is given under Population Estimates under Population.
If services are delivered at GP or CCG level, these additional patients need to be taken into consideration, and this equally applies to primary care services for children and young people.
Information is not available on age of these patients so we do not know how many of these patients who are registered with Hull GPs but live outside Hull are aged 0-19 years. However, we do know that the total number of patients registered with Hull GPs who are aged 0-19 years (just not where they live).
In January 2020, there were 70,852 patients registered with Hull GPs who were aged 0-19 years. For every single year of age, except for infants where (delays in registration may explain the difference), the number of patients registered with Hull GPs is higher than ONS’s resident population estimates.

Population Projections
The Office for National Statistics produce population projections every two years, and their latest estimates are based on the population for 2018. They project that there will be relatively small changes in the total resident population in Hull as detailed further (adults and children) in Population Projections under Population.
In 2018, it was estimated that there were 63,248 children and young people aged 0-19 years living in Hull. ONS project that this will increase to a high of 64,246 in 2023 before decreasing slightly to 64,163 in 2025. They project the population will decrease by around 250 per year to 63,643 in 2027 before decreasing by around 400 per year to 60,972 in 2033 following by further decreases but at a slightly slower rate of around 200 per year to 60,022 in 2037. Many factors can influence births, deaths and migration, so estimates further into the future are more likely to be more inaccurate. The table below shows ONS’s population projects for selected years to 2040.

Examining changes overall masks individual age differences though. From 2018 to 2025, the number of 0-4s is projected to decrease by 10% from 15,304 in 2018 to 15,474 in 2025 with a slightly smaller decrease of 8% among those aged 5-9 years (from 17,211 to 15,839) and increases for those aged 10-19 years. It is projected that there will be a 10% increase in the resident population for those aged 10-14 years (from 14,880 to 16,400) and a 18% increase for those aged 15-19 years (from 13,950 to 16,451).
From 2018 to 2030, the number of 0-4s is projected to decrease by 11% with decreases of 14% among those aged 5-9 years and increases of 2% for 10-14s and 23%for 15-19s.
Furthermore, examining changes for each five year age group though also masks differences by single year of age. The percentage change in population between 2018 and 2025 ranges from -6% (infants) to -12% (aged 2), from -1% (aged 8) to -16% (aged 6), from -1% (aged 10) to +26% (aged 13), and from +10% (aged 19) to +27% (aged 15).
The four figures below show the population projections by single year of age for those aged 0-4, 5-9, 10-14 and 15-19 years respectively.


Pregnancy and Births
—Impact on Health, Wellbeing and Society
Maternity services cover care for the women from when they become pregnant and access care until they are signed off by the midwife (around 10 days after the birth) and care formally handed over to health visitors.
Good antenatal care and support can identify potential problems early, and provide information to aid informed choice. Poor care during the birth can increase the risks to both mother and baby. Good maternity services should respond to the physical, psychological, emotional and social needs of women and their family in a structured and systematic way.
There is a higher risk of adverse events in pregnancy and during the birth for women who are teenagers, who are older, who smoke, who are overweight and who have other risk factors such as diabetes. The proportion of births to older women and women who are overweight has increased giving rise to an increase in the likelihood of adverse events. This, together with the higher number of births overall, has placed additional pressure on already stretched maternity services nationally.
Women who lack social support have been found to be at increased risk of antenatal and postnatal depression, and having a poor relationship with a partner is also a risk factor for postnatal depression. As well as having a profound effect on the individual affected (often the mother but could be the father), poor perinatal mental health has a strong effect on the whole family and can influence the bond established between parent and child, which can have long-lasting implications.
There are a number of screening programmes in place in the UK relating to antenatal and newborn. Tests in pregnancy and in the newborn after birth are designed to help make the pregnancy safer, check and assess the development and wellbeing of the women and her baby, and screen for particular conditions. Nationally there are several screening programmes for pregnant women, although most are only for specific women at increased risk. Uptake of screening for HIV, syphilis, hepatitis B, and sickle cell and thalassaemia for pregnant women and fetal anomaly screening is available for England and Yorkshire and Humber at Public Health England Fingertips, although this information is not available at local authority level.
—Mother’s Health Whilst Pregnant
Women in Hull are much less likely to take folic acid supplements before becoming pregnant, and are more likely to be obese or smoke in early pregnancy. The percentages are presented below.
Compared with benchmark
Indicator | Period | England | Yorkshire and the Humber region | Kingston upon Hull | East Riding of Yorkshire | North East Lincolnshire | North Lincolnshire | York | Barnsley | Doncaster | Rotherham | Sheffield | Bradford | Calderdale | Kirklees | Leeds | Wakefield | North Yorkshire Cty |
---|---|---|---|---|---|---|---|---|---|---|---|---|---|---|---|---|---|---|
Folic acid supplements before pregnancy (Female Not applicable) | 2018/19 | 27.3 | 26.1 | 13.9 | 40.4 | 19.1 | 22.1 | - | - | 18.8 | - | - | 18.7 | 21.2 | 20.5 | - | 24.6 | 51.0 |
Early access to maternity care (Female Not applicable) | 2018/19 | 57.8 | 64.6 | 63.9 | 74.3 | 77.3 | 72.6 | 79.1 | 70.8 | 74.8 | 42.5 | 69.3 | 45.3 | 72.9 | 59.5 | 64.2 | 62.2 | 72.0 |
Obesity in early pregnancy (Female Not applicable) | 2018/19 | 22.1 | 24.0 | 30.5 | 24.4 | 29.0 | 26.3 | 19.0 | 28.9 | 28.2 | 28.3 | 25.6 | 24.1 | 24.9 | 23.6 | - | 25.6 | 22.4 |
Smoking in early pregnancy (Female Not applicable) | 2018/19 | 12.8 | 17.4 | 23.2 | 14.3 | 22.5 | 19.4 | 10.8 | 24.7 | 24.6 | 27.9 | 13.2 | 16.5 | 19.6 | 15.4 | - | 19.7 | 12.2 |
—Smoking in Pregnancy
The NHS provide information the risks of smoking during pregnancy:
“The risks of smoking during pregnancy are serious from premature delivery to increased risk of miscarriage, stillbirth or sudden infant death. Quitting smoking is one of the best things you and your partner can do to help your baby develop healthily during pregnancy and beyond.
When you smoke you breathe in more than 4,000 chemicals from the cigarette. The smoke goes from your lungs into your bloodstream. That blood flows to your placenta and umbilical cord, right into your baby’s tiny body. This causes your baby to struggle for oxygen. One of the chemicals found in cigarettes is carbon monoxide, a dangerous chemical that gets into your bloodstream. This restricts the supply of oxygen that’s essential for your baby’s healthy growth and development. This causes your baby’s tiny heart to pump even harder.
Your baby’s tiny body is completely dependent on yours, so if you smoke throughout your pregnancy, your baby will go through nicotine withdrawal once it is born. This can make your baby stressed and irritable and it may be difficult to stop them crying. Smoking while you are pregnant also increases the risk of your baby dying from cot death by at least 25%.
Second-hand smoke is very dangerous for anyone exposed to it, but it is particularly dangerous for children. Children exposed to second-hand smoke are at risk of ear infections, bronchitis, pneumonia, asthma attacks and meningitis. Last year in the UK, 300,000 GP visits and 9,500 hospital admissions were caused by children breathing in other people’s cigarette smoke. Furthermore, nearly three quarters of children worry that their mum or dad will die because they smoke. Not only that, but if you smoke, your children are three times more likely to smoke when they grow up. By quitting, your children will be less likely to take up smoking. Children exposed to a smoky atmosphere are more likely to suffer from breathing problems, allergies and chest infections. By not smoking, you protect the health of those close to you.”
The percentage of women who continue to smoke throughout their entire pregnancy is high. The percentage of women known to be current smokers at the time of their delivery is around twice as high in Hull compared to England.
Compared with benchmark
Indicator | Period | England | Yorkshire and the Humber region | Kingston upon Hull | East Riding of Yorkshire | North East Lincolnshire | North Lincolnshire | York | Barnsley | Doncaster | Rotherham | Sheffield | Bradford | Calderdale | Kirklees | Leeds | Wakefield | North Yorkshire Cty |
---|---|---|---|---|---|---|---|---|---|---|---|---|---|---|---|---|---|---|
Smoking status at time of delivery (Female All ages) | 2021/22 | 9.1 | 12.0 | 17.5 | 10.9 | 20.3 | 16.5 | 8.0 | 13.6 | 12.4 | 12.8 | 9.4 | 12.1 | 9.6 | 10.4 | 11.4 | 14.7 | 8.3 |
The percentage of smoking throughout pregnancy has reduced slightly over the last decade but the reduction has been relatively slow, although comparable to reductions in England and the Yorkshire and Humber region.
Compared with benchmark
Smoking status at time of delivery (Female All ages)
Period
|
Kingston upon Hull |
Yorkshire and the Humber region
|
England
|
||||
---|---|---|---|---|---|---|---|
Count
|
Value
|
95%
Lower CI |
95%
Upper CI |
||||
2010/11 | • | 883 | 23.4% | 22.0% | 24.7% | 16.9% | 13.6% |
2011/12 | • | 910 | 23.2% | 21.9% | 24.5% | 16.7% | 13.3% |
2012/13 | • | 900 | 23.1% | 21.8% | 24.5% | 16.6% | 12.8% |
2013/14 | • | 798 | 21.9% | 20.6% | 23.3% | 16.3% | 12.2% |
2014/15 | • | 759 | 21.0% | 19.7% | 22.4% | 15.7% | 11.7% |
2015/16 | • | 777 | 21.5% | 20.2% | 22.9% | 14.6% | 11.0% |
2016/17 | • | 878 | 23.1% | 21.8% | 24.5% | 14.4% | 10.7% |
2017/18 | • | 431 | 20.4% | 18.7% | 22.2% | 14.2% | 10.8% |
2018/19 | • | 663 | 19.9% | 18.6% | 21.3% | 14.4% | 10.6% |
2019/20 | • | 675 | 20.6% | 19.2% | 22.0% | 14.0% | 10.4% |
2020/21 | • | 669 | 20.8% | 19.5% | 22.3% | 13.1% | 9.6% |
2021/22 | • | 574 | 17.5% | 16.2% | 18.8% | 12.0% | 9.1% |
Source: Calculated by PHE from the NHS Digital return on Smoking Status At Time of delivery (SATOD)
—Screening in Pregnancy
There are a number of screening programmes in place in the UK relating to antenatal and newborn. Tests in pregnancy and in the newborn after birth are designed to help make the pregnancy safer, check and assess the development and wellbeing of the woman and her baby, and screen for particular conditions. However, uptake rates for screening of pregnant women are only available for England and for each region and not available at local authority level. Uptake rates are also not available at local authority level for the physical examination of infants after birth or the infant ‘blood spot’ screening, although information is available for the infant hearing test.
—Births
Hull has a relatively low percentage of deliveries to mothers from Black, Asian and Minority Ethnic groups. Further information such as the trends over time is given within Birth and Infant Health under Pregnancy, Infants and Early Years under Children and Young People.
Compared with benchmark
Indicator | Period | England | Yorkshire and the Humber region | Kingston upon Hull | East Riding of Yorkshire | North East Lincolnshire | North Lincolnshire | York | Barnsley | Doncaster | Rotherham | Sheffield | Bradford | Calderdale | Kirklees | Leeds | Wakefield | North Yorkshire Cty |
---|---|---|---|---|---|---|---|---|---|---|---|---|---|---|---|---|---|---|
Percentage of deliveries to women from ethnic minority groups (Female All ages) | 2021/22 | 22.9 | 21.6 | 13.8 | 3.8 | 5.2 | 8.7 | 7.4 | 4.1 | 10.5 | 11.6 | 30.7 | 48.3 | 22.9 | 38.4 | 29.6 | 10.2 | 4.9 |
The percentage of caesarean sections is slightly lower in Hull compared to England. There are more births among under 18s in Hull and fewer among women aged 35+ years in Hull compared to England.
The information below gives the percentage of caesareans, the rate of under 18 conceptions per 1,000 women aged 15-17 years, the rate of under 16 conceptions per 1,000 women aged 13-15 years, the percentage of teenage mothers out of all deliveries, and the percentage of mothers aged 35+ years out of all deliveries.
Further information such as the trends over time is given within Birth and Infant Health under Pregnancy, Infants and Early Years under Children and Young People.
Compared with benchmark
Indicator | Period | England | Yorkshire and the Humber region | Kingston upon Hull | East Riding of Yorkshire | North East Lincolnshire | North Lincolnshire | York | Barnsley | Doncaster | Rotherham | Sheffield | Bradford | Calderdale | Kirklees | Leeds | Wakefield | North Yorkshire Cty |
---|---|---|---|---|---|---|---|---|---|---|---|---|---|---|---|---|---|---|
Caesarean section % (Female All ages) | 2021/22 | 34.7 | 31.7 | 32.4 | 33.4 | 30.0 | 29.6 | 27.0 | 33.6 | 37.0 | 33.2 | 35.4 | 28.1 | 30.3 | 32.3 | 29.2 | 33.7 | 31.1 |
Under 18s conception rate / 1,000 (Female <18 yrs) | 2021 | 13.1 | 17.1 | 29.1 | 11.1 | 27.3 | 18.2 | 10.2 | 23.3 | 22.0 | 23.1 | 16.5 | 14.9 | 11.9 | 12.6 | 19.3 | 20.5 | 10.8 |
Under 16s conception rate / 1,000 (Female <16 yrs) | 2021 | 2.1 | 3.2 | 5.7 | 2.1 | 5.0 | 4.5 | 1.7 | 4.2 | 3.9 | 4.9 | 3.1 | 2.3 | 2.1 | 2.4 | 3.5 | 3.4 | 2.3 |
Teenage mothers (Female 12-17 yrs) | 2021/22 | 0.6 | 0.9 | 1.8 | 0.6 | 2.4 | 1.0 | - | 0.9 | 1.2 | 1.3 | 0.8 | 0.9 | 0.5 | 0.6 | 0.9 | 0.7 | 0.5 |
Percentage of deliveries to women aged 35 years and above (Female 35+ yrs) | 2021/22 | 24.2 | 19.6 | 14.3 | 19.4 | 14.3 | 16.4 | 28.3 | 14.5 | 14.6 | 15.3 | 23.2 | 20.1 | 20.0 | 18.8 | 23.6 | 16.6 | 22.1 |
The percentage of women with multiple births in Hull is lower than England, but the rate of premature births and the percentage of babies born with a low birth weight are both higher in Hull compared to England.
The rate of multiple births figure is per 1,000 maternities. Premature births is the number of births with a gestational age between 24-36 weeks and all stillbirths (also 24+ weeks gestational age) also given as a rate per 1,000 live births and stillbirths.
The figures relating to low birth weight are all given as percentages. Low birth weight is the number of live births of full-term babies (at least a gestational age of 37 complete weeks) born with a low birth weight (under 2,500 grams) out of all live full-term births. The number of low birth weight (under 2,500 grams) and very low birth weight (under 1,500 grams) babies is also given for all live births and stillbirths (24+ weeks gestational age).
Further information such as the trends over time is given within Birth and Infant Health under Pregnancy, Infants and Early Years under Children and Young People.
Compared with benchmark
Indicator | Period | England | Yorkshire and the Humber region | Kingston upon Hull | East Riding of Yorkshire | North East Lincolnshire | North Lincolnshire | York | Barnsley | Doncaster | Rotherham | Sheffield | Bradford | Calderdale | Kirklees | Leeds | Wakefield | North Yorkshire Cty |
---|---|---|---|---|---|---|---|---|---|---|---|---|---|---|---|---|---|---|
Multiple births (Female 15-44 yrs) | 2021 | 13.7 | 11.8 | 11.5 | 10.0 | 10.7 | 14.5 | 13.7 | 10.4 | 13.6 | 10.4 | 14.6 | 10.5 | 8.9 | 11.5 | 9.6 | 12.6 | 15.0 |
Premature births (less than 37 weeks gestation) (Persons <37 weeks gestational age at birth) | 2019 - 21 | 77.9 | 79.5 | 98.2 | 81.5 | 109.8 | 96.5 | 73.3 | 81.3 | 85.9 | 88.7 | 76.3 | 80.3 | 78.6 | 77.1 | 66.0 | 80.5 | 72.0 |
Low birth weight of term babies (Persons >=37 weeks gestational age at birth) | 2021 | 2.8 | 3.0 | 2.9 | 1.8 | 3.2 | 2.8 | 1.8 | 2.4 | 2.9 | 3.3 | 2.8 | 4.2 | 3.1 | 3.4 | 3.5 | 2.7 | 1.7 |
Low birth weight of all babies (Persons 0 yrs) | 2021 | 6.8 | 7.1 | 8.1 | 6.4 | 8.6 | 7.5 | 6.1 | 6.2 | 8.0 | 8.3 | 7.7 | 7.6 | 6.2 | 7.1 | 6.6 | 7.0 | 5.7 |
Very low birth weight of all babies (Persons 0 yrs) | 2021 | 1.0 | 1.0 | 1.2 | 1.1 | 1.8 | 1.2 | 0.7 | 1.1 | 1.9 | 1.2 | 1.3 | 0.7 | 0.7 | 1.1 | 0.5 | 1.0 | 1.0 |
—Hearing Test Screening
Public Health England’s Fingertips presents data on the percentage uptake of the infant hearing screening test. The percentage uptake in Hull is generally high compared to England.
Compared with benchmark
Indicator | Period | England | Yorkshire and the Humber region | Kingston upon Hull | East Riding of Yorkshire | North East Lincolnshire | North Lincolnshire | York | Barnsley | Doncaster | Rotherham | Sheffield | Bradford | Calderdale | Kirklees | Leeds | Wakefield | North Yorkshire Cty |
---|---|---|---|---|---|---|---|---|---|---|---|---|---|---|---|---|---|---|
Newborn Hearing Screening: Coverage (Persons <1 yr) | 2021/22 | 98.7 | 98.6 | 99.8 | 99.1 | 99.3 | 99.4 | 99.9 | 99.4 | 95.1 | 99.3 | 98.4 | 99.2 | 99.9 | 99.1 | 97.3 | 98.7 | 99.3 |
—New Birth and 6-8 Week Visits
The percentage of new birth visits completed within the first 14 days and the percentage of 6-8 week visits completed within the time period are high in Hull, and are higher than England.
Compared with benchmark
Indicator | Period | England | Yorkshire and the Humber region | Kingston upon Hull | East Riding of Yorkshire | North East Lincolnshire | North Lincolnshire | York | Barnsley | Doncaster | Rotherham | Sheffield | Bradford | Calderdale | Kirklees | Leeds | Wakefield | North Yorkshire Cty |
---|---|---|---|---|---|---|---|---|---|---|---|---|---|---|---|---|---|---|
Proportion of New Birth Visits (NBVs) completed within 14 days (Persons <14 days) | 2021/22 | 82.7 | 77.9 | 87.9 | 93.2 | 87.5 | 81.1 | 78.6 | 46.5 | 70.6 | 85.8 | 87.3 | 91.6 | 55.8 | 9.5 | 90.2 | 92.1 | 91.1 |
Proportion of infants receiving a 6 to 8 week review (Persons 6-8 weeks) | 2021/22 | 81.6 | 85.4 | 91.8 | 95.0 | 87.7 | 85.3 | 86.9 | 91.8 | 85.7 | 88.8 | 90.2 | 93.5 | 78.0 | 65.8 | 73.5 | 91.1 | 91.7 |
—Breastfeeding
——Benefits of Breastfeeding
The NHS states that “the benefits of breastfeeding are:
- your breast milk is perfectly designed for your baby;
- breast milk protects your baby from infections and diseases;
- breastfeeding provides health benefits for you;
- breast milk is available for your baby whenever your baby needs it; and
- breastfeeding can build a strong emotional bond between you and your baby.
Formula milk does not provide the same protection from illness and does not give you any health benefits.
Breastfeeding has long-term benefits for your baby, lasting right into adulthood.
Any amount of breast milk has a positive effect. The longer you breastfeed, the longer the protection lasts and the greater the benefits.
Breastfeeding can help to reduce your baby’s risk of:
- infections, with fewer visits to hospital as a result;
- diarrhoea and vomiting, with fewer visits to hospital as a result;
- sudden infant death syndrome;
- obesity; and
- cardiovascular disease in adulthood.
Some studies have also found that breastfeeding for at least 6 months may reduce your baby’s chance of getting childhood leukaemia. But more research is needed into this.
Giving nothing but breast milk is recommended for about the first 6 months (26 weeks) of your baby’s life. After that, giving your baby breast milk alongside solid foods for as long as you and your baby want will help them grow and develop healthily.
Breast milk adapts as your baby grows to meet your baby’s changing needs.
Breastfeeding and making breast milk also has health benefits for you. The more you breastfeed, the greater the benefits.
Breastfeeding lowers your risk of:
- breast cancer;
- ovarian cancer;
- osteopororsis;
- cardiovascular disease; and
- obesity.”
Furthermore, breastfeeding also is considerably cheaper as it avoids the need to buy infant formula milk.
Nationally, if all babies were breastfed, it is estimated that £35 million each year could be saved by the NHS due to treating gastroenteritis alone. Even if breastfeeding prevalence at 6 months was increased by 10%, it is estimated that the NHS could save at least £5.6 million over 4-5 years due to the prevention of cases of otitis media, gastroenteritis and asthma. The cost savings in Hull from these three conditions is estimated to be £33,945 per year (although not all savings will be realised in the first year).
——Breastfeeding in Hull
Rates of breastfeeding are lower in Hull.
Compared with benchmark
Indicator | Period | England | Yorkshire and the Humber region | Kingston upon Hull | East Riding of Yorkshire | North East Lincolnshire | North Lincolnshire | York | Barnsley | Doncaster | Rotherham | Sheffield | Bradford | Calderdale | Kirklees | Leeds | Wakefield | North Yorkshire Cty |
---|---|---|---|---|---|---|---|---|---|---|---|---|---|---|---|---|---|---|
Baby's first feed breastmilk (previous method) (Persons Newborn) | 2018/19 | 67.4 | 56.4 | 51.8 | 64.5 | 52.0 | 60.1 | 76.0 | 47.4 | 62.9 | 59.6 | 71.7 | 59.3 | 64.6 | 59.2 | - | 49.2 | 71.2 |
Breastfeeding prevalence at 6-8 weeks after birth - current method (Persons 6-8 weeks) | 2021/22 | 49.2 | - | 34.2 | 48.9 | 29.3 | - | - | 35.5 | 32.7 | 37.5 | 54.0 | 44.9 | - | - | - | 33.9 | 51.4 |
However, breastfeeding rates at 6-8 weeks has increased slightly over the last five years, although only at a similar rate of increase to that in England.
Compared with benchmark
Breastfeeding prevalence at 6-8 weeks after birth - current method (Persons 6-8 weeks)
Period
|
Kingston upon Hull |
Yorkshire and the Humber region
|
England
|
||||
---|---|---|---|---|---|---|---|
Count
|
Value
|
95%
Lower CI |
95%
Upper CI |
||||
2015/16 | • | 1171 | 30.1% | 28.7% | 31.6% | - | 43.2% |
2016/17 | • | 1236 | 30.1% | 28.7% | 31.5% | - | 44.4% |
2018/19 | • | 1240 | 32.6% | 31.2% | 34.1% | - | 46.2% |
2019/20 | • | 1223 | 33.7% | 32.2% | 35.3% | - | 48.0% |
2020/21 | • | 1239 | 34.8% | 33.3% | 36.4% | - | 47.6% |
2021/22 | • | 1199 | 34.2% | 32.7% | 35.8% | - | 49.2% |
Source: OHID's (formerly PHE) interim reporting of health visiting metrics
Stillbirths and Infant Mortality
The rate of stillbirths, and neonatal, post-neonatal and infant deaths are all higher than England.
Stillbirths are classified as fetal deaths occurring after 24 weeks of gestation. Neonatal deaths are those that occur under 28 days, and post-neonatal deaths are those that occur aged 28 days or older but less then one year. Infant deaths are those that occur within the first year of life. The numbers given below are given as rates. The number of stillbirths and neonatal deaths are given as a rate per 1,000 live births and stillbirths, and for post-neonatal and infant deaths the rates presented per 1,000 live births.
Further information such as the trends over time is given within Stillbirths and Infant Mortality under Pregnancy, Infants and Early Years under Children and Young People.
Compared with benchmark
Indicator | Period | England | Yorkshire and the Humber region | Kingston upon Hull | East Riding of Yorkshire | North East Lincolnshire | North Lincolnshire | York | Barnsley | Doncaster | Rotherham | Sheffield | Bradford | Calderdale | Kirklees | Leeds | Wakefield | North Yorkshire Cty |
---|---|---|---|---|---|---|---|---|---|---|---|---|---|---|---|---|---|---|
Stillbirth rate (Persons 0 yrs) | 2019 - 21 | 3.9 | 4.1 | 4.0 | 3.7 | 4.8 | 4.6 | 3.0 | 3.6 | 3.8 | 3.8 | 4.2 | 6.0 | 3.0 | 4.3 | 4.3 | 3.3 | 3.0 |
Neonatal mortality rate (Persons <28 days) | 2019 - 21 | 2.8 | 3.0 | 3.0 | 2.9 | 3.2 | 1.9 | 2.0 | 2.7 | 3.8 | 2.3 | 2.4 | 4.2 | 2.3 | 3.1 | 3.7 | 2.6 | 2.1 |
Neonatal mortality and stillbirth rate (Persons <28 days) | 2020 | 6.5 | 6.4 | 7.0 | 6.9 | 7.0 | 8.3 | 5.9 | 7.6 | 7.6 | 4.4 | 5.2 | 9.9 | 4.3 | 6.5 | 6.2 | 3.6 | 4.3 |
Post-neonatal mortality rate (Persons 28 days - 1 yr) | 2019 - 21 | 1.1 | 1.4 | 1.8 | 0.8 | 1.3 | 0.6 | 0.8 | 1.4 | 1.5 | 1.1 | 1.1 | 2.2 | 1.7 | 1.7 | 1.3 | 1.2 | 0.9 |
Infant mortality rate (Persons <1 yr) | 2019 - 21 | 3.9 | 4.4 | 4.8 | 3.7 | 4.4 | 2.5 | 2.8 | 4.2 | 5.3 | 3.3 | 3.5 | 6.4 | 4.1 | 4.8 | 5.0 | 3.8 | 3.1 |
A&E Attendance and Hospital Admissions
—Children Aged 0-4 Years
A&E attendances among those aged under 1 year and 0-4 years in Hull are considerably higher in Hull compared to England (per 1,000 population).
Compared with benchmark
Indicator | Period | England | Yorkshire and the Humber region | Kingston upon Hull | East Riding of Yorkshire | North East Lincolnshire | North Lincolnshire | York | Barnsley | Doncaster | Rotherham | Sheffield | Bradford | Calderdale | Kirklees | Leeds | Wakefield | North Yorkshire Cty |
---|---|---|---|---|---|---|---|---|---|---|---|---|---|---|---|---|---|---|
A&E attendances (under 1 year) (previous method) (Persons <1 yr) | 2019/20 | 1000.1 | 948.0 | 1441.6 | 901.7 | 715.2 | 870.9 | 1073.5 | 1227.7 | 877.7 | 1113.0 | 1409.7 | 709.1 | 783.1 | 944.6 | 768.7 | 1041.4 | 673.5 |
A&E attendances (0 to 4 years) (previous method) (Persons 0-4 yrs) | 2019/20 | 659.8 | 638.2 | 1071.5 | 679.0 | 516.0 | 580.6 | 666.3 | 773.2 | 630.7 | 748.3 | 868.5 | 497.0 | 520.9 | 664.5 | 494.8 | 698.5 | 455.2 |
Emergency admissions (0 to 4 years) (Persons 0-4 yrs) | 2021/22 | 161.5 | 170.3 | 157.7 | 173.0 | 255.4 | 233.2 | 252.3 | 219.8 | 97.3 | 191.6 | 69.3 | 207.9 | 213.8 | 191.0 | 98.8 | 203.3 | 235.7 |
The rate in Hull was comparable to England in 2016/17, but has since increased markedly for both infants under one year and those aged 0-4 years. In 2018 there were 3,300 live birth and in 2019 there were 3,175 live births in Hull, and with almost 5,000 attendances at A&E for infants under one year of age during 2018/19, this means that significantly numbers are attending more than once. The Office for National Statistics estimate there are 16,883 children aged 0-4 years living in Hull in mid-year 2019, and with 18,110 attendances at A&E for children aged 0-4 years in Hull, this also means that significant numbers are attending more than once as it is likely that a high proportion of children will not attend at all in the year.
Compared with benchmark
A&E attendances (under 1 year) (previous method) (Persons <1 yr)
Period
|
Kingston upon Hull |
Yorkshire and the Humber region
|
England
|
||||
---|---|---|---|---|---|---|---|
Count
|
Value
|
95%
Lower CI |
95%
Upper CI |
||||
2010/11 | • | 2184 | 607.5 | 582.3 | 633.5 | 632.6 | 637.4 |
2011/12 | • | 2097 | 572.3 | 548.1 | 597.4 | 634.8 | 659.6 |
2012/13 | • | 2334 | 604.2 | 579.9 | 629.2 | 655.3 | 703.7 |
2013/14 | • | 2385 | 641.3 | 615.8 | 667.6 | 618.4 | 688.3 |
2014/15 | • | 2212 | 614.8 | 589.4 | 641.0 | 641.1 | 719.6 |
2015/16 | • | 2398 | 692.5 | 665.0 | 720.8 | 686.9 | 798.6 |
2016/17 | • | 2803 | 786.3 | 757.4 | 815.9 | 736.4 | 859.9 |
2017/18 | • | 4285 | 1210.1 | 1174.7 | 1247.5 | 739.5 | 885.1 |
2018/19 | • | 4960 | 1499.4 | 1458.0 | 1541.7 | 897.0 | 957.4 |
2019/20 | • | 4665 | 1441.6 | 1400.5 | 1483.6 | 948.0 | 1000.1 |
Source: OHID based on NHS Digital, Hospital Episode Statistics (HES), and Office for National Statistics, mid-year Population estimates
A&E attendances (0 to 4 years) (previous method) (Persons 0-4 yrs)
Period
|
Kingston upon Hull |
Yorkshire and the Humber region
|
England
|
||||
---|---|---|---|---|---|---|---|
Count
|
Value
|
95%
Lower CI |
95%
Upper CI |
||||
2010/11 | • | 7807 | 467.2 | 456.9 | 477.7 | 494.4 | 483.9 |
2011/12 | • | 7668 | 440.9 | 431.1 | 450.9 | 496.9 | 510.8 |
2012/13 | • | 9470 | 531.8 | 521.1 | 542.6 | 512.3 | 535.1 |
2013/14 | • | 10320 | 573.1 | 562.1 | 584.3 | 498.1 | 525.8 |
2014/15 | • | 9496 | 528.2 | 517.7 | 539.0 | 502.1 | 540.7 |
2015/16 | • | 10431 | 583.3 | 572.2 | 594.6 | 538.9 | 588.1 |
2016/17 | • | 11091 | 621.4 | 609.9 | 633.1 | 544.7 | 601.8 |
2017/18 | • | 16010 | 912.7 | 898.6 | 927.0 | 544.2 | 619.0 |
2018/19 | • | 18110 | 1052.5 | 1037.3 | 1068.0 | 624.5 | 655.3 |
2019/20 | • | 18090 | 1071.5 | 1055.9 | 1087.2 | 638.2 | 659.8 |
Source: Hospital Episode Statistics (HES) Copyright © 2022, Re‐used with the permission of NHS Digital. All rights reserved.
Hospital admissions are for babies aged under 14 days are much lower in Hull compared to England (admissions per 1,000 population). Further information can be found within Hospital Admissions Among Children and Young People under Health Factors under Children and Young People.
Compared with benchmark
Recent trends
Indicator | Period | England | Yorkshire and the Humber region | Kingston upon Hull | East Riding of Yorkshire | North East Lincolnshire | North Lincolnshire | York | Barnsley | Doncaster | Rotherham | Sheffield | Bradford | Calderdale | Kirklees | Leeds | Wakefield | North Yorkshire Cty |
---|---|---|---|---|---|---|---|---|---|---|---|---|---|---|---|---|---|---|
Admissions of babies under 14 days (Persons <14 days) | 2021/22 | 81.6 | 79.1 | 50.5 | 83.0 | 94.1 | 86.8 | 119.0 | 198.7 | 90.0 | 130.6 | 24.3 | 61.5 | 90.4 | 90.7 | 45.0 | 80.3 | 109.8 |
However, hospital admissions for gastroenteritis in infants is higher in Hull compared to England among those aged under two years with around 100 such admissions in total, but rates are lower in Hull among children aged 2-4 years with around 30 admissions. Rates are given as admissions per 10,000 population. Further information such as trends over time can be found within Hospital Admissions Among Children and Young People under Health Factors under Children and Young People.
Compared with benchmark
Recent trends
Indicator | Period | England | Yorkshire and the Humber region | Kingston upon Hull | East Riding of Yorkshire | North East Lincolnshire | North Lincolnshire | York | Barnsley | Doncaster | Rotherham | Sheffield | Bradford | Calderdale | Kirklees | Leeds | Wakefield | North Yorkshire Cty |
---|---|---|---|---|---|---|---|---|---|---|---|---|---|---|---|---|---|---|
Admissions for gastroenteritis (under 1 year) (Persons <1 yr) | 2021/22 | - 123.0 | - 129.0 | - 134.2 | - 150.7 | - 231.5 | - 188.9 | - 150.0 | - 222.9 | - 45.8 | - 181.3 | - 44.7 | - 189.2 | - 240.3 | - 106.6 | - 57.7 | - 117.6 | - 167.8 |
Admissions for gastroenteritis (aged 1 year) (Persons 1 yr) | 2021/22 | - 97.7 | - 98.2 | - 109.3 | - 105.8 | - 242.9 | - 215.9 | - 177.9 | - 129.9 | - 43.3 | - 141.9 | - 33.7 | - 113.0 | - 112.0 | - 80.9 | - 43.7 | - 75.5 | - 160.9 |
Admissions for gastroenteritis (2 to 4 years) (Persons 2-4 yrs) | 2021/22 | - 49.1 | - 52.9 | - 57.3 | - 65.2 | - 105.8 | - 96.2 | - 57.6 | - 67.1 | - 34.4 | - 61.4 | - 19.0 | - 79.1 | - 57.8 | - 42.4 | - 26.3 | - 41.2 | - 69.7 |
Hospital admissions for lower respiratory tract infections in infants under one year is higher in Hull compared to England with over 250 admissions in Hull. However, admission rates in Hull are lower than England for children aged 1-4 years. Rates are given as admissions per 10,000 population. Further information such as trends over time can be found within Hospital Admissions Among Children and Young People under Health Factors under Children and Young People.
Compared with benchmark
Recent trends
Indicator | Period | England | Yorkshire and the Humber region | Kingston upon Hull | East Riding of Yorkshire | North East Lincolnshire | North Lincolnshire | York | Barnsley | Doncaster | Rotherham | Sheffield | Bradford | Calderdale | Kirklees | Leeds | Wakefield | North Yorkshire Cty |
---|---|---|---|---|---|---|---|---|---|---|---|---|---|---|---|---|---|---|
Admissions for lower respiratory tract infections (under 1 year) (Persons <1 yr) | 2021/22 | - 707.1 | - 809.9 | - 738.3 | - 810.1 | - 1223.5 | - 1070.5 | - 1139.8 | - 972.8 | - 534.7 | - 942.7 | - 339.3 | - 1029.1 | - 913.0 | - 799.6 | - 605.8 | - 849.2 | - 1095.3 |
Admissions for lower respiratory tract infections (aged 1 year) (Persons 1 yr) | 2021/22 | - 167.8 | - 184.5 | - 171.7 | - 194.0 | - 121.4 | - 215.9 | - 296.6 | - 241.2 | - 129.8 | - 195.2 | - 143.4 | - 247.3 | - 313.6 | - 202.3 | - 158.6 | - 75.5 | - 170.4 |
Admissions for lower respiratory tract infections (2 to 4 years) (Persons 2-4 yrs) | 2021/22 | - 26.9 | - 30.2 | - 20.8 | - 21.7 | - 28.8 | - 28.9 | - 48.0 | - 18.3 | - 29.5 | - 22.3 | - 21.7 | - 49.7 | - 43.4 | - 32.6 | - 31.5 | - 20.6 | - 29.0 |
Emergency admissions among those aged 0-4 years caused by unintentional and deliberate injuries are higher in Hull compared to England. Rates are given as admissions per 10,000 population.
Compared with benchmark
Indicator | Period | England | Yorkshire and the Humber region | Kingston upon Hull | East Riding of Yorkshire | North East Lincolnshire | North Lincolnshire | York | Barnsley | Doncaster | Rotherham | Sheffield | Bradford | Calderdale | Kirklees | Leeds | Wakefield | North Yorkshire Cty |
---|---|---|---|---|---|---|---|---|---|---|---|---|---|---|---|---|---|---|
Hospital admissions caused by unintentional and deliberate injuries in children (aged 0 to 4 years) (Persons 0-4 yrs) | 2021/22 | 103.6 | 108.8 | 98.2 | 81.7 | 155.5 | 119.0 | 116.8 | 101.1 | 91.7 | 123.8 | 66.8 | 148.0 | 169.2 | 118.2 | 79.8 | 92.9 | 137.8 |
Whilst admissions caused by unintentional and deliberate injuries are higher in Hull, they have been decreasing in Hull.
Compared with benchmark
Hospital admissions caused by unintentional and deliberate injuries in children (aged 0 to 4 years) (Persons 0-4 yrs)
Period
|
Kingston upon Hull |
Yorkshire and the Humber region
|
England
|
||||
---|---|---|---|---|---|---|---|
Count
|
Value
|
95%
Lower CI |
95%
Upper CI |
||||
2021/22 | • | 155 | 98.2 | 83.9 | 115.6 | 108.8 | 103.6 |
Source: Office for Health Improvement and Disparities, using data from Hospital Episode Statistics (HES), NHS Digital for the respective financial year, England. Hospital Episode Statistics (HES) Copyright © 2023, Reused with the permission of NHS Digital. All rights reserved. Local Authority estimates of resident population, Office for National Statistics (ONS)
Further information relating to hospital admissions as a result of unintentional and deliberate injuries such as the types of injury and causes of injury can be found within Accidents and Injuries Among Children and Young People under Health Factors under Children and Young People.
—Children Aged 0-9 Years
Hospital admissions among children aged 0-9 years were lower in Hull compared to England for asthma, diabetes and epilepsy compared to England (admissions per 100,000 population). Further information such as trends over time can be found within Hospital Admissions Among Children and Young People under Health Factors under Children and Young People.
Compared with benchmark
Recent trends
Indicator | Period | England | Yorkshire and the Humber region | Kingston upon Hull | East Riding of Yorkshire | North East Lincolnshire | North Lincolnshire | York | Barnsley | Doncaster | Rotherham | Sheffield | Bradford | Calderdale | Kirklees | Leeds | Wakefield | North Yorkshire Cty |
---|---|---|---|---|---|---|---|---|---|---|---|---|---|---|---|---|---|---|
Admissions for asthma (0 to 9 years) (Persons 0-9 yrs) | 2021/22 | - 172.7 | - 172.9 | - 75.8 | - 156.2 | - 195.9 | - 222.1 | - 54.3 | - 181.0 | - 242.9 | - 180.2 | - 88.8 | - 279.1 | - 208.1 | - 257.6 | - 114.7 | - 219.7 | - 127.3 |
Admissions for diabetes (0 to 9 years) (Persons 0-9 yrs) | 2021/22 | - 37.0 | - 39.4 | - 60.6 | - 62.5 | - 56.0 | - 55.5 | - - | - 54.3 | - 57.1 | - 32.8 | - 32.3 | - 39.9 | - 41.6 | - 28.6 | - 26.1 | - 36.6 | - 34.0 |
Admissions for epilepsy (0 to 9 years) (Persons 0-9 yrs) | 2021/22 | - 89.7 | - 95.7 | - 121.2 | - 78.1 | - 139.9 | - 166.6 | - 135.6 | - 126.7 | - 28.6 | - 65.5 | - 48.4 | - 172.8 | - 104.1 | - 76.3 | - 67.8 | - 97.7 | - 110.3 |
—Young People Aged 10-18 Years
Compared to England, young people aged 10-18 years living in Hull had fewer hospital admissions for asthma, but considerably more admissions for epilepsy and for diabetes (for the year 2018/19). The numbers of admissions were relatively low though and it is possible that there could be multiple admissions from the same young people, and that numbers could change markedly from year to year.
Compared with benchmark
Recent trends
Indicator | Period | England | Yorkshire and the Humber region | Kingston upon Hull | East Riding of Yorkshire | North East Lincolnshire | North Lincolnshire | York | Barnsley | Doncaster | Rotherham | Sheffield | Bradford | Calderdale | Kirklees | Leeds | Wakefield | North Yorkshire Cty |
---|---|---|---|---|---|---|---|---|---|---|---|---|---|---|---|---|---|---|
Admissions for asthma (10 to 18 years) (Persons 10-18 yrs) | 2021/22 | - 87.6 | - 86.0 | - 51.8 | - 45.5 | - 59.5 | - 112.6 | - 79.2 | - 100.6 | - 46.4 | - 104.2 | - 52.4 | - 157.6 | - 128.8 | - 118.3 | - 47.7 | - 82.9 | - 97.6 |
Admissions for diabetes (10 to 18 years) (Persons 10-18 yrs) | 2021/22 | - 80.4 | - 89.4 | - 155.5 | - 121.4 | - 118.9 | - 84.4 | - 52.8 | - 100.6 | - 92.9 | - 69.5 | - 61.1 | - 89.1 | - 128.8 | - 88.7 | - 83.4 | - 96.8 | - 65.0 |
Admissions for epilepsy (10 to 18 years) (Persons 10-18 yrs) | 2021/22 | - 56.4 | - 63.9 | - 121.0 | - 60.7 | - 59.5 | - 140.7 | - 52.8 | - 60.4 | - - | - 52.1 | - 34.9 | - 61.7 | - - | - 78.9 | - 23.8 | - 27.6 | - 162.6 |
Admissions from diabetes have generally been similar to or higher than England, but increased in 2018/19 although decreased again in 2019/20.
Compared with benchmark
Admissions for diabetes (10 to 18 years) (Persons 10-18 yrs)
Period
|
Kingston upon Hull |
Yorkshire and the Humber region
|
England
|
||||
---|---|---|---|---|---|---|---|
Count
|
Value
|
95%
Lower CI |
95%
Upper CI |
||||
2021/22 | • | 45 | 155.5 | 113.4 | 208.1 | 89.4 | 80.4 |
Source: OHID based on NHS Digital, Hospital Episode Statistics (HES), and Office for National Statistics, mid-year Population estimates
The same is true for epilepsy with admissions generally been similar to or higher than England, but there was a peak in 2014/15 with rates having decreased since then. However, it is possible that one or two young people in 2014/15 could have had a number of admissions which inflated the figures that particular year. The admission rates for epilepsy have increased over the last couple of years, and are now significantly higher than England.
Compared with benchmark
Admissions for epilepsy (10 to 18 years) (Persons 10-18 yrs)
Period
|
Kingston upon Hull |
Yorkshire and the Humber region
|
England
|
||||
---|---|---|---|---|---|---|---|
Count
|
Value
|
95%
Lower CI |
95%
Upper CI |
||||
2021/22 | • | 35 | 121.0 | 87.1 | 172.3 | 63.9 | 56.4 |
Source: OHID based on NHS Digital, Hospital Episode Statistics (HES), and Office for National Statistics, mid-year Population estimates
—All Children and Young People
The number of attendences at A&E among those aged under 18 years is considerably higher in Hull compared to England. Rates are given as admissions per 1,000 population.
Compared with benchmark
Indicator | Period | England | Yorkshire and the Humber region | Kingston upon Hull | East Riding of Yorkshire | North East Lincolnshire | North Lincolnshire | York | Barnsley | Doncaster | Rotherham | Sheffield | Bradford | Calderdale | Kirklees | Leeds | Wakefield | North Yorkshire Cty |
---|---|---|---|---|---|---|---|---|---|---|---|---|---|---|---|---|---|---|
A&E attendances ( under 18 years) (previous method) (Persons <18 yrs) | 2019/20 | 415.6 | 403.0 | 693.7 | 453.8 | 358.2 | 380.8 | 389.8 | 469.7 | 416.0 | 456.6 | 488.6 | 322.5 | 358.9 | 439.4 | 313.7 | 471.6 | 278.9 |
The number of A&E attendances per 1,000 children and young people in Hull aged under 18 years has consistently been higher than England, but there has been a dramatic increase in the rate of attendance in Hull recently.
Compared with benchmark
A&E attendances ( under 18 years) (previous method) (Persons <18 yrs)
Period
|
Kingston upon Hull |
Yorkshire and the Humber region
|
England
|
||||
---|---|---|---|---|---|---|---|
Count
|
Value
|
95%
Lower CI |
95%
Upper CI |
||||
2011/12 | • | 18939 | 346.1 | 341.2 | 351.1 | 364.5 | 364.8 |
2012/13 | • | 23770 | 433.4 | 427.9 | 438.9 | 366.2 | 370.9 |
2013/14 | • | 25594 | 463.5 | 457.8 | 469.2 | 363.4 | 370.3 |
2014/15 | • | 23014 | 415.7 | 410.4 | 421.1 | 364.9 | 383.0 |
2015/16 | • | 25198 | 453.9 | 448.3 | 459.5 | 381.9 | 405.2 |
2016/17 | • | 26767 | 478.0 | 472.3 | 483.7 | 385.0 | 412.2 |
2017/18 | • | 35530 | 629.4 | 622.8 | 635.9 | 374.2 | 410.4 |
2018/19 | • | 39275 | 688.8 | 682.0 | 695.6 | 406.3 | 422.2 |
2019/20 | • | 39795 | 693.7 | 686.9 | 700.5 | 403.0 | 415.6 |
Source: OHID based on NHS Digital, Hospital Episode Statistics (HES), and Office for National Statistics, mid-year Population estimates
Emergency hospital admissions among those aged under 18 years are higher in Hull compared to England. Rates are given as admissions per 1,000 population.
Compared with benchmark
Indicator | Period | England | Yorkshire and the Humber region | Kingston upon Hull | East Riding of Yorkshire | North East Lincolnshire | North Lincolnshire | York | Barnsley | Doncaster | Rotherham | Sheffield | Bradford | Calderdale | Kirklees | Leeds | Wakefield | North Yorkshire Cty |
---|---|---|---|---|---|---|---|---|---|---|---|---|---|---|---|---|---|---|
Emergency admissions (under 18 years) (Persons <18 yrs) | 2021/22 | 70.7 | 72.4 | 69.9 | 68.8 | 103.7 | 94.8 | 98.3 | 88.5 | 45.6 | 78.8 | 38.6 | 91.4 | 84.9 | 77.7 | 45.6 | 80.1 | 92.5 |
Whilst there has been relatively little change over the last decade, the difference in the rate between Hull and England has reduced, but this is mainly because the rate in England has increased slightly over time.
Compared with benchmark
Emergency admissions (under 18 years) (Persons <18 yrs)
Period
|
Kingston upon Hull |
Yorkshire and the Humber region
|
England
|
||||
---|---|---|---|---|---|---|---|
Count
|
Value
|
95%
Lower CI |
95%
Upper CI |
||||
2021/22 | • | 4130 | 69.9 | 67.8 | 72.1 | 72.4 | 70.7 |
Source: OHID based on NHS Digital, Hospital Episode Statistics (HES), and Office for National Statistics, mid-year Population estimates
Admissions among all children and young people aged 0-18 years was lower in Hull compared to England for asthma, but higher for diabetes and epilepsy, although the numbers are relatively small and can be influenced by a relatively high number of admissions from a small number of children and young people. Rates are given as admissions per 100,000 population. Further information such as trends over time can be found within Hospital Admissions Among Children and Young People under Health Factors under Children and Young People.
Compared with benchmark
Recent trends
Indicator | Period | England | Yorkshire and the Humber region | Kingston upon Hull | East Riding of Yorkshire | North East Lincolnshire | North Lincolnshire | York | Barnsley | Doncaster | Rotherham | Sheffield | Bradford | Calderdale | Kirklees | Leeds | Wakefield | North Yorkshire Cty |
---|---|---|---|---|---|---|---|---|---|---|---|---|---|---|---|---|---|---|
Hospital admissions for asthma (under 19 years) (Persons 0-18 yrs) | 2021/22 | - 131.5 | - 130.7 | - 64.6 | - 100.0 | - 129.8 | - 167.7 | - 80.3 | - 133.4 | - 148.6 | - 134.9 | - 71.3 | - 222.7 | - 158.5 | - 189.1 | - 80.6 | - 149.1 | - 112.1 |
Admissions for diabetes (under 19 years) (Persons 0-18 yrs) | 2021/22 | - 58.0 | - 63.7 | - 105.0 | - 92.3 | - 86.5 | - 69.9 | - 40.1 | - 66.7 | - 74.3 | - 50.6 | - 50.3 | - 64.1 | - 84.5 | - 63.0 | - 52.8 | - 64.8 | - 49.8 |
Admissions for epilepsy (under 19 years) (Persons 0-18 yrs) | 2021/22 | - 73.6 | - 80.6 | - 121.1 | - 69.3 | - 115.3 | - 153.7 | - 107.1 | - 95.3 | - 22.3 | - 50.6 | - 41.9 | - 118.1 | - 52.8 | - 72.7 | - 47.3 | - 58.3 | - 132.9 |
—Admissions Due to Injuries
Hospital admissions caused by unintentional and deliberate injuries in children have decreased in Hull recently and are now only slightly higher than England among children and young people aged 0-14 years, and rates in Hull are comparable to England among those aged 15-24 years. During 2019/20, there were 210, 315 and 445 admissions among children and young people aged 0-4, 5-14 and 15-24 years respectively.
Public Health England’s Fingertips gives the total number of admission rates for unintentional and deliberate injuries to children and young people per 10,000 population.
Compared with benchmark
Indicator | Period | England | Yorkshire and the Humber region | Kingston upon Hull | East Riding of Yorkshire | North East Lincolnshire | North Lincolnshire | York | Barnsley | Doncaster | Rotherham | Sheffield | Bradford | Calderdale | Kirklees | Leeds | Wakefield | North Yorkshire Cty |
---|---|---|---|---|---|---|---|---|---|---|---|---|---|---|---|---|---|---|
Hospital admissions caused by unintentional and deliberate injuries in children (aged 0 to 4 years) (Persons 0-4 yrs) | 2021/22 | 103.6 | 108.8 | 98.2 | 81.7 | 155.5 | 119.0 | 116.8 | 101.1 | 91.7 | 123.8 | 66.8 | 148.0 | 169.2 | 118.2 | 79.8 | 92.9 | 137.8 |
Hospital admissions caused by unintentional and deliberate injuries in children (aged 0 to 14 years) (Persons <15 yrs) | 2021/22 | 84.3 | 85.4 | 91.4 | 80.3 | 122.0 | 94.1 | 87.0 | 83.2 | 82.9 | 95.6 | 64.4 | 106.0 | 105.9 | 77.7 | 69.7 | 67.1 | 99.9 |
Hospital admissions caused by unintentional and deliberate injuries in young people (aged 15 to 24 years) (Persons 15-24 yrs) | 2021/22 | 118.6 | 110.7 | 113.3 | 115.1 | 117.9 | 128.0 | 91.7 | 188.8 | 130.7 | 107.7 | 83.3 | 106.3 | 95.5 | 120.4 | 73.9 | 175.3 | 144.0 |
Further information relating to hospital admissions as a result of unintentional and deliberate injuries such as the types of injury and causes of injury among under fives can be found within Accidents and Injuries Among Children and Young People under Health Factors under Children and Young People.
The rate of admissions in Hull has decreased among those aged 0-4 years.
Compared with benchmark
Hospital admissions caused by unintentional and deliberate injuries in children (aged 0 to 4 years) (Persons 0-4 yrs)
Period
|
Kingston upon Hull |
Yorkshire and the Humber region
|
England
|
||||
---|---|---|---|---|---|---|---|
Count
|
Value
|
95%
Lower CI |
95%
Upper CI |
||||
2021/22 | • | 155 | 98.2 | 83.9 | 115.6 | 108.8 | 103.6 |
Source: Office for Health Improvement and Disparities, using data from Hospital Episode Statistics (HES), NHS Digital for the respective financial year, England. Hospital Episode Statistics (HES) Copyright © 2023, Reused with the permission of NHS Digital. All rights reserved. Local Authority estimates of resident population, Office for National Statistics (ONS)