Index
This topic area covers statistics and information relating to learning disabilities, Down’s syndrome and Autistic Spectrum Disorders for children and adults in Hull including local strategic need and service provision. Further information is also available on Children with Special Educational Needs or Disabilities under Health Factors under Children and Young People, and further information can also be found on Neurodiversity under Health Factors within both Children and Young People and Adults.
This page contains information from the Office for Health Improvement & Disparities’ Fingertips. Information is taken ‘live’ from the site so uses the latest available data from Fingertips and displays it on this page. As a result, some comments on this page may relate to an earlier period of time until this page is next updated (see review dates at the end of this page).
Headlines
- The overall number of school aged children with an Education, Health and Care Plan (EHCP) or with Special Educational Needs Support (SEN Support) steadily increased in Hull between 2015/16 and 2022/23 from 17.3% to 18.3% with larger increases in the last two years. For 2024/25, 9,305 (21.1%) of the 44,100 pupils in Hull have an EHCP or require SEN Support which is higher than England and the region (both 19.6%). Some of the increase could be due to increased awareness, testing and better recording.
- Across all ages, in 2024/25, there were 2,236 people registered with Hull GPs who had a learning disability. This equates to 0.7% of all registered patients, compared to 0.6% for England. There was a statistically significant association between the prevalence and deprivation. Practices serving the patients living in the most deprived areas of Hull had a higher prevalence of diagnosed learning disabilities than those practices serving patients living in the least deprived areas of Hull.
- Three-quarters of supported working-age adults with a learning disability in Hull were living in settled accommodation, but less than 1% were in paid employment.
The Population Affected – Why Is It Important?
There are systems in place to identify children with a learning disability in school, and approaches to their education can be modified to maximise educational attainment. As indicated, there are varying degrees of learning disability and definitions used, accordingly different data sources and models often produce quite different estimates.
Following the Children and Families Act 2014, there are two levels of Special Educational Needs (SEN) provision in schools. Children and young people (under the age of 25 years) who have SEN may have an Education, Health and Care (EHC) plan, developed by all professionals and the family working together, to address all needs that a child or young person has within education, health and care. An EHC plan is the highest level of SEN provision. Children with a learning disability assessment should have an EHC plan.
Lower levels of SEN are addressed by pupils being in receipt of SEN Support. Under the Children and Families Act 2014, all pupils with SEN must have an identified primary need.
The diagnosed prevalence of learning disabilities can be examined from data collected as part of the Quality and Outcomes Framework within primary care. Quality of care indicators are also included, and it means that patients diagnosed with learning disabilities should have annual reviews at their GP practice. Local analysis of the QOF data has been completed with prevalence calculated for each GP practice and Primary Care Network group.
The National Institute of Health and Care Excellence (NICE) states that a learning disability is generally defined by three core criteria: lower intellectual ability, reduced social skills or ‘adaptive’ functioning difficulties appearing before adulthood.
The World Health Organisation classifies the disability as:
- Mild – Likely to result in some learning difficulties in school. Many adults will be able to work and maintain good social relationships.
- Moderate – Likely to result in marked developmental delays. Adults will need varying degree of support to live and work in the community.
- Severe – Likely to result in continuous need for support.
- Profound – Results in severe limitation in self-care, communication, and mobility.
A child with a specific learning difficulty is as able as any other child, except in one or two areas of their learning. For instance, they may find it difficult to recognise letters, or to cope with numbers.
The Hull Picture
Pupils with Special Educational Needs
The Office for Health Improvement & Disparities’ Fingertips presents information on the percentages of school children who have Education, Health and Care (EHC) Plans or are on SEN Support.
For the 2024/25 school year, a statistically significantly higher percentage of children in Hull had special educational needs (21.1%) compared to England and the region (both 19.6%). The percentage in Hull is second highest in the region after Rotherham.
Compared with benchmark
| Indicator | Period | England | Yorkshire and the Humber region (statistical) | Kingston upon Hull | East Riding of Yorkshire | North East Lincolnshire | North Lincolnshire | York | North Yorkshire UA | Barnsley | Doncaster | Rotherham | Sheffield | Bradford | Calderdale | Kirklees | Leeds | Wakefield |
|---|---|---|---|---|---|---|---|---|---|---|---|---|---|---|---|---|---|---|
Pupils with special educational needs (SEN) (Persons School age) | 2024/25 | 19.6 | 19.6 | 21.1 | 18.2 | 19.5 | 19.9 | 16.1 | 18.5 | 18.6 | 18.2 | 23.5 | 20.4 | 19.4 | 19.7 | 19.2 | 19.8 | 20.2 |
The rates in Hull have steadily increased in Hull between 2015/16 and 2022/23 from 17.3% to 18.3% although the increases in the last two years have been greater increasing to 19.7% for 2023/24 and to 21.1% for 2024/25. Some of the increase could be due to increased awareness, testing and better recording.
Across the region and England, the percentages have also increased, and at a faster rate between 2015/16 and 2022/23 so the difference between Hull and England reduced. The increases in the last two years have been slightly greater in Hull though.
There were 9,305 pupils in Hull with EHC Plans or requiring SEN Support in the 2024/25 school year out of the estimated 44,100 pupils attending Hull schools.
Compared with benchmark
Pupils with special educational needs (SEN) (Persons School age)
|
Period
|
Kingston upon Hull |
Yorkshire and the Humber region (statistical)
|
England
|
||||
|---|---|---|---|---|---|---|---|
|
Count
|
Value
|
95%
Lower CI |
95%
Upper CI |
||||
| 2015/16 | • | 6883 | 17.3% | 16.9% | 17.7% | 13.9% | 14.4% |
| 2016/17 | • | 6831 | 16.7% | 16.3% | 17.0% | 14.0% | 14.4% |
| 2017/18 | • | 7110 | 17.0% | 16.6% | 17.4% | 14.5% | 14.6% |
| 2018/19 | • | 7475 | 17.5% | 17.2% | 17.9% | 15.0% | 14.9% |
| 2019/20 | • | 7824 | 18.1% | 17.8% | 18.5% | 15.4% | 15.5% |
| 2020/21 | • | 7955 | 18.4% | 18.0% | 18.8% | 15.7% | 15.8% |
| 2021/22 | • | 8028 | 18.3% | 17.9% | 18.7% | 16.4% | 16.5% |
| 2022/23 | • | 8110 | 18.3% | 17.9% | 18.7% | 17.3% | 17.3% |
| 2023/24 | • | 8774 | 19.7% | 19.3% | 20.1% | 18.3% | 18.4% |
| 2024/25 | • | 9305 | 21.1% | 20.7% | 21.4% | 19.6% | 19.6% |
Source: Department for Education
Further information relating to Children with Special Educational Needs or Disabilities can be found under Health Factors under Children and Young People, and the Joint Needs Assessment for Children and Young People with Special Educational Needs and Disabilities for 2021/22.
Diagnosed Prevalence of Learning Disability Among Patients Registered with Hull GPs
The Office for Health Improvement & Disparities’ Fingertips gives information on the prevalence of diagnosed learning disability from the Quality and Outcomes Framework so represents the percentage of patients who are registers with a GP in Hull and have a learning disability.
The sub Integrated Care Board areas which include Hull are within the Humber and North Yorkshire Integrated Care Board. In Fingertips, the sub-ICB area referenced by 03F relates to Hull (see Integrated Care Board for the codes relating to the other local sub-ICB areas).
In 2024/25, there were 2,236 patients registered with Hull GPs with diagnosed learning disability that was recorded within their GP records representing 0.7% of Hull’s registered patient population which was marginally higher than England at 0.6%.
Compared with benchmark
| Indicator | Period | England | NHS Humber and North Yorkshire Integrated Care Board - QOQ | Humber and North Yorkshire ICB - 02Y | Humber and North Yorkshire ICB - 03F | Humber and North Yorkshire ICB - 03H | Humber and North Yorkshire ICB - 03K | Humber and North Yorkshire ICB - 03Q | Humber and North Yorkshire ICB - 42D |
|---|---|---|---|---|---|---|---|---|---|
Learning disability: QOF prevalence (Persons All ages) | 2024/25 | 0.6 | 0.6 | 0.6 | 0.7 | 0.7 | 0.7 | 0.4 | 0.6 |
The percentages have increased in Hull between 2014/15 and 2023/24 although the majority of the increase occurred between 2014/15 and 2017/18 whilst case finding occurred for this newly introduced indicator. There has only been a relatively small increase in Hull and England since 2017/18.
Compared with benchmark
Learning disability: QOF prevalence (Persons All ages)
|
Period
|
Humber and North Yorkshire ICB - 03F |
NHS Humber and North Yorkshire Integrated Care Board - QOQ
|
England
|
||||
|---|---|---|---|---|---|---|---|
|
Count
|
Value
|
95%
Lower CI |
95%
Upper CI |
||||
| 2014/15 | • | 1250 | 0.4% | 0.4% | 0.5% | 0.4% | 0.4% |
| 2015/16 | • | 1457 | 0.5% | 0.5% | 0.5% | 0.5% | 0.5% |
| 2016/17 | • | 1565 | 0.5% | 0.5% | 0.5% | 0.5% | 0.5% |
| 2017/18 | • | 1734 | 0.6% | 0.6% | 0.6% | 0.5% | 0.5% |
| 2018/19 | • | 1769 | 0.6% | 0.6% | 0.6% | 0.5% | 0.5% |
| 2019/20 | • | 1846 | 0.6% | 0.6% | 0.6% | 0.5% | 0.5% |
| 2020/21 | • | 1965 | 0.6% | 0.6% | 0.7% | 0.5% | 0.5% |
| 2021/22 | • | 2032 | 0.7% | 0.6% | 0.7% | 0.6% | 0.5% |
| 2022/23 | • | 2072 | 0.7% | 0.6% | 0.7% | 0.6% | 0.6% |
| 2023/24 | • | 2171 | 0.7% | 0.7% | 0.7% | 0.6% | 0.6% |
| 2024/25 | • | 2236 | 0.7% | 0.7% | 0.7% | 0.6% | 0.6% |
Source: NHS England
There was a statistically significant association between average deprivation score of registered patients (based on the Index of Multiple Deprivation 2025) and the prevalence of diagnosed learning disabilities across the 25 practices in Hull for 2024/25. The prevalence was 0.53% among practices serving the patients living in the least deprived areas of Hull compared to 0.78% among practices serving the patients living in the most deprived areas of Hull. For every increase in the deprivation score of 10 units, the prevalence of learning disabilities increased by 0.1 percentage points. Further analysis of diagnosed disease by the average deprivation score of practice patients is given within Local Analysis of Quality and Outcomes Framework Data.
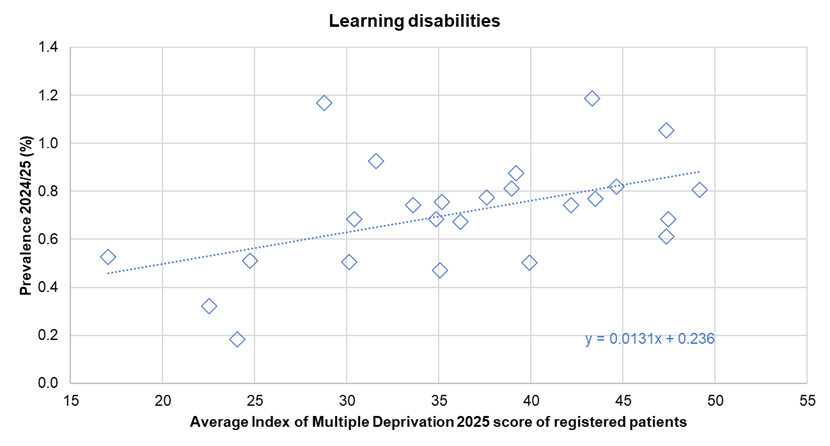
There was no statistically significant association between the prevalence of diagnosed learning disabilities and the average age of registered patients across the 25 practices.
People with Learning Disabilities in Paid Employment
Fingertips also provides information on the percentages of people with learning disabilities who are in paid employment. If numbers are too low then the percentages are not presented.
For 2022/23, there is a very large gap between the employment rate among those with a learning disability and the overall employment rate. For 2022/23, the overall employment rate was 71.5% and with 0.4% of people with a learning disability employment in Hull, this equates to a gap of 71.1 percentage points.
Compared with benchmark
| Indicator | Period | England | Yorkshire and the Humber region (statistical) | Kingston upon Hull | East Riding of Yorkshire | North East Lincolnshire | North Lincolnshire | York | North Yorkshire UA | Barnsley | Doncaster | Rotherham | Sheffield | Bradford | Calderdale | Kirklees | Leeds | Wakefield |
|---|---|---|---|---|---|---|---|---|---|---|---|---|---|---|---|---|---|---|
Percentage of people in employment (Persons 16-64 yrs) | 2024/25 | 75.7 | 73.5 | 72.9 | 79.3 | 73.5 | 66.6 | 77.9 | 78.9 | 75.6 | 72.8 | 71.2 | 74.1 | 69.1 | 72.8 | 77.1 | 69.3 | 72.9 |
Gap in the employment rate between those who are in receipt of long term support for a learning disability (aged 18 to 64) and the overall employment rate (Persons 18-64 yrs) | 2022/23 | 70.9 | 69.6 | 71.1 | 73.1 | 60.1 | 74.6 | 76.3 | 75.1 | 66.7 | 69.3 | 70.3 | 68.5 | 65.1 | 68.5 | 64.7 | 70.9 | 69.5 |
The percentage of the population who are in receipt of long term support for a learning disability that are in paid employment (aged 18 to 64) (Persons 18-64 yrs) | 2022/23 | 4.8 | 4.8 | 0.4 | 4.5 | 12.8 | 2.2 | 7.3 | 5.0 | 5.7 | 4.1 | 2.3 | 3.3 | 4.2 | 5.5 | 6.2 | 5.5 | 5.4 |
The overall employment rate has been increasing with the exception between 2019/20 and 2021/22 likely associated with the COVID-19 pandemic and the higher percentages of people aged 50+ years deciding to retire from the work. While the percentage of people aged 16-64 years in employment increased in 2022/23, there was a further decrease in 2023/24 to 69.3%, lower than during the pandemic. However, the inequalities gap in employment among people with learning disabilities has also been increasing in Hull with only very small numbers of people with learning disabilities in employment with fewer people with a learning disability being employed in Hull.
Only three individuals who are in receipt of long-term support for a learning disability were recorded as being employed in 2022/23 in Hull.
Compared with benchmark
Percentage of people in employment (Persons 16-64 yrs)
|
Period
|
Kingston upon Hull |
Yorkshire and the Humber region (statistical)
|
England
|
||||
|---|---|---|---|---|---|---|---|
|
Count
|
Value
|
95%
Lower CI |
95%
Upper CI |
||||
| 2011/12 | • | 104100 | 60.8% | 58.0% | 63.6% | 67.5% | 70.2% |
| 2012/13 | • | 105800 | 62.1% | 59.3% | 64.9% | 69.6% | 71.0% |
| 2013/14 | • | 106300 | 63.1% | 60.1% | 66.1% | 69.9% | 71.7% |
| 2014/15 | • | 109600 | 65.3% | 62.4% | 68.2% | 71.0% | 72.9% |
| 2015/16 | • | 112500 | 66.9% | 63.9% | 69.9% | 72.2% | 73.9% |
| 2016/17 | • | 115600 | 68.8% | 65.5% | 72.1% | 72.8% | 74.4% |
| 2017/18 | • | 118400 | 70.8% | 67.7% | 73.9% | 73.5% | 75.2% |
| 2018/19 | • | 120100 | 71.1% | 67.9% | 74.3% | 73.7% | 75.6% |
| 2019/20 | • | 124700 | 74.0% | 70.5% | 77.5% | 74.0% | 76.2% |
| 2020/21 | • | 123500 | 73.2% | 69.3% | 77.1% | 73.8% | 75.1% |
| 2021/22 | • | 118700 | 70.5% | 66.5% | 74.5% | 74.3% | 75.4% |
| 2022/23 | • | 120800 | 71.5% | 67.1% | 75.9% | 74.4% | 75.7% |
| 2023/24 | • | 117500 | 69.3% | 63.9% | 74.7% | 73.1% | 75.7% |
| 2024/25 | • | 122600 | 72.9% | 68.6% | 77.2% | 73.5% | 75.7% |
Source: NOMIS, Official Census and Labour Market Statistics
Gap in the employment rate between those who are in receipt of long term support for a learning disability (aged 18 to 64) and the overall employment rate (Persons 18-64 yrs)
|
Period
|
Kingston upon Hull |
Yorkshire and the Humber region (statistical)
|
England
|
||||
|---|---|---|---|---|---|---|---|
|
Count
|
Value
|
95%
Lower CI |
95%
Upper CI |
||||
| 2014/15 | • | - | 64.5 | 61.5 | 67.5 | 64.3 | 66.9 |
| 2015/16 | • | - | 66.0 | 62.9 | 69.1 | 65.9 | 68.1 |
| 2016/17 | • | - | 67.9 | 64.5 | 71.3 | 66.1 | 68.7 |
| 2017/18 | • | - | 70.2 | 67.1 | 73.4 | 66.1 | 69.2 |
| 2018/19 | • | - | 70.5 | 67.3 | 73.8 | 68.0 | 69.7 |
| 2019/20 | • | - | 73.5 | 69.9 | 77.0 | 67.7 | 70.6 |
| 2020/21 | • | - | 72.9 | 69.0 | 76.8 | 67.8 | 70.0 |
| 2021/22 | • | - | 70.2 | 66.2 | 74.2 | 69.4 | 70.6 |
| 2022/23 | • | - | 71.1 | 66.7 | 75.5 | 69.6 | 70.9 |
Source: OHID, based on NHS England and Office for National Statistics data
The percentage of the population who are in receipt of long term support for a learning disability that are in paid employment (aged 18 to 64) (Persons 18-64 yrs)
|
Period
|
Kingston upon Hull |
Yorkshire and the Humber region (statistical)
|
England
|
||||
|---|---|---|---|---|---|---|---|
|
Count
|
Value
|
95%
Lower CI |
95%
Upper CI |
||||
| 2016/17 | • | 6 | 0.9% | 0.4% | 2.0% | 6.7% | 5.7% |
| 2017/18 | • | 4 | 0.6% | 0.2% | 1.5% | 7.4% | 6.0% |
| 2018/19 | • | 4 | 0.6% | 0.2% | 1.5% | 5.7% | 5.9% |
| 2019/20 | • | 3 | 0.4% | 0.1% | 1.3% | 6.3% | 5.6% |
| 2020/21 | • | 2 | 0.3% | 0.1% | 1.1% | 6.0% | 5.1% |
| 2021/22 | • | 2 | 0.3% | 0.1% | 1.0% | 4.9% | 4.8% |
| 2022/23 | • | 3 | 0.4% | 0.1% | 1.2% | 4.8% | 4.8% |
Source: OHID, based on NHS England data
Current Estimates and Future Projections of Number of People with a Learning Disability in Hull
The Projecting Adult Needs and Service Information (PANSI) and the Projecting Older People Population Information Service (POPPI) provide current estimates and future projections at local authority level of the number of people with different health needs.
The models use estimates from national surveys and research and apply these models to local populations. Different prevalence estimates are used for age groups and gender. Although, for many conditions, there is an increased prevalence in populations with high levels of deprivation, in most models deprivation is not taken into consideration. Thus, in many cases, estimates for Hull are likely to be low due to high levels of deprivation.
As there are four measures under learning disability that are the same for both PANSI and POPPI the information has been combined into a single table. Additional PANSI tables are given below for those aged 18 to 64 years only.
Further definitions are available from www.pansi.org.uk and www.poppi.org.uk.
PANSI estimate that around 4,200 people in Hull aged 18 to 64 years have a learning disability and this will remain relatively unchanged in the future. POPPI estimate that there are over 900 people with a learning disability in Hull aged 65+ years, and that this will increase to just almost 1,100 by 2045.
| Age | 2025 | 2030 | 2035 | 2040 | 2045 |
| 18-24 | 731 | 802 | 799 | 751 | 694 |
| 25-34 | 1,031 | 939 | 954 | 998 | 989 |
| 35-44 | 954 | 1,008 | 986 | 934 | 949 |
| 45-54 | 736 | 742 | 819 | 874 | 860 |
| 55-64 | 766 | 690 | 635 | 646 | 714 |
| 18-64 | 4,185 | 4,180 | 4,193 | 4,203 | 4,205 |
| 65-74 | 520 | 572 | 592 | 561 | 522 |
| 75-84 | 294 | 324 | 341 | 386 | 401 |
| 85+ | 95 | 98 | 125 | 137 | 156 |
| 65+ | 909 | 995 | 1,059 | 1,083 | 1,079 |
| Total aged 18+ | 5,094 | 5,175 | 5,252 | 5,286 | 5,284 |
PANSI estimate that there are around 950 people in Hull aged 18 to 64 years who have a moderate or severe learning disability, and again that this will remain relatively unchanged in the future. POPPI estimate that there are around 120 people with a moderate or severe learning disability living in Hull who are aged 65+ years, and that this will increase slightly to around 140 by 2045.
| Age | 2025 | 2030 | 2035 | 2040 | 2045 |
| 18-24 | 171 | 187 | 186 | 175 | 161 |
| 25-34 | 222 | 202 | 205 | 215 | 212 |
| 35-44 | 240 | 253 | 248 | 235 | 239 |
| 45-54 | 166 | 168 | 186 | 198 | 194 |
| 55-64 | 158 | 149 | 137 | 141 | 155 |
| 18-64 | 956 | 959 | 962 | 962 | 962 |
| 65-74 | 85 | 93 | 96 | 90 | 84 |
| 75-84 | 31 | 33 | 35 | 40 | 41 |
| 85+ | 9 | 9 | 12 | 13 | 15 |
| 65+ | 124 | 136 | 143 | 144 | 140 |
| Total 18+ | 1,080 | 1,095 | 1,105 | 1,106 | 1,102 |
PANSI estimate that there are around 260 people in Hull aged 18-64 years who have a severe learning disability, and again that this will remain relatively unchanged in the future.
| Age | 2025 | 2030 | 2035 | 2040 | 2045 |
| 18-24 | 56 | 62 | 61 | 58 | 53 |
| 25-34 | 62 | 56 | 57 | 60 | 59 |
| 35-44 | 65 | 68 | 67 | 63 | 64 |
| 45-54 | 37 | 38 | 41 | 44 | 43 |
| 55-64 | 37 | 35 | 32 | 33 | 36 |
| Total 18-64 | 257 | 259 | 260 | 258 | 256 |
PANSI estimate that there are around 370 people in Hull aged 18 to 64 years who have a learning disability who are living with a parent, and again that this will remain relatively unchanged in the future.
| Age | 2025 | 2030 | 2035 | 2040 | 2045 |
| 18-24 | 113 | 124 | 123 | 115 | 106 |
| 25-34 | 114 | 104 | 106 | 110 | 109 |
| 35-44 | 94 | 99 | 97 | 92 | 93 |
| 45-54 | 38 | 39 | 43 | 45 | 44 |
| 55-64 | 14 | 13 | 12 | 13 | 14 |
| Total 18-64 | 373 | 379 | 380 | 375 | 367 |
PANSI estimate that there are around 120 people in Hull aged 18 to 64 years who have Down’s syndrome, and again that this will remain relatively unchanged in the future. POPPI estimates very low numbers living in Hull aged 65+ years with Down’s syndrome.
| Age | 2025 | 2030 | 2035 | 2040 | 2045 |
| 18-24 | 25 | 27 | 27 | 25 | 24 |
| 25-34 | 30 | 27 | 28 | 29 | 29 |
| 35-44 | 23 | 25 | 24 | 23 | 23 |
| 45-54 | 25 | 25 | 27 | 29 | 29 |
| 55-64 | 14 | 13 | 12 | 12 | 14 |
| 18-64 | 116 | 117 | 118 | 119 | 118 |
| 65+ | 4 | 4 | 4 | 4 | 4 |
| Total 18+ | 120 | 121 | 122 | 123 | 122 |
PANSI estimate that there are around 80 people in Hull aged 18 to 64 years who have challenging behaviour, and again that this will remain relatively unchanged in the future.
| Age | 2025 | 2030 | 2035 | 2040 | 2045 |
| 18-24 | 12 | 13 | 13 | 13 | 12 |
| 25-34 | 19 | 17 | 17 | 18 | 18 |
| 35-44 | 17 | 18 | 18 | 17 | 17 |
| 45-54 | 14 | 14 | 16 | 17 | 16 |
| 55-64 | 15 | 14 | 13 | 13 | 14 |
| Total 18-64 | 77 | 77 | 77 | 77 | 77 |
PANSI estimate that there are around 1,730 people in Hull aged 18 to 64 years who have autistic spectrum disorders, and again that this will remain relatively unchanged in the future. POPPI estimate that there are over 400 people in Hull aged 65+ years who have autistic spectrum disorders, and that this will increase over time to almost 500 people by 2045.
| Age | 2025 | 2030 | 2035 | 2040 | 2045 |
| 18-24 | 282 | 304 | 304 | 284 | 263 |
| 25-34 | 417 | 383 | 392 | 410 | 406 |
| 35-44 | 388 | 413 | 408 | 393 | 400 |
| 45-54 | 319 | 319 | 348 | 374 | 372 |
| 55-64 | 324 | 306 | 280 | 284 | 311 |
| 18-64 | 1,729 | 1,725 | 1,731 | 1,744 | 1,751 |
| 65-74 | 239 | 259 | 267 | 253 | 235 |
| 75+ | 175 | 194 | 213 | 213 | 254 |
| 65+ | 413 | 454 | 480 | 491 | 489 |
| Total 18+ | 2,142 | 2,179 | 2,211 | 2,235 | 2,240 |
Strategic Need and Service Provision
It is necessary to work with schools and early years settings to identify children and young people who need additional support. It is important that needs and specific circumstances are identified early in order for the most appropriate help and support to be provided.
A Joint Needs Assessment for Children and Young People with Special Educational Needs and Disabilities has been produced in Hull and this will inform local strategy.
Hull’s Early Help and Prevention Strategy sets out proposals to continue to build an integrated Early Help delivery model for children, young people and families in Hull and the vision of the Hull Children and Young People’s Plan gives a commitment to working together to make Hull an inspiring and enterprising city – safe and healthy to learn, play, work and live in.
“We want all children, young people and their families to be able to make healthy lifestyle choices, be safe from harm and have the confidence to be ambitious and achieve their aspirations”.
The Early Help and Prevention strategy outlines an approach to ensure the collaboration and alignment of services, stating that preventative, targeted and tailored early help may be ‘early in life or at the earliest opportunity’. There are four thresholds of need with higher levels of targeted support given to children and families with additional or complex needs.
There is a need to work with partners to ensure that services are integrated, high quality and accessible in ways that offer people appropriate choices in order to improve health and wellbeing. Working with partners to promote self-care, reablement or mutual support in community settings and, where appropriate, ensuring that the provision of specialist and adapted housing is fit for purpose will reduce reliance on residential or home care.
The period of transition for young people who have a learning difficulty into adulthood is known to be a time of considerable change and often uncertainty. There needs to be a clear transition pathway identified with partners across adult social care, children’s services, education and health in order to facilitate a smooth transition into adulthood.
There is also a need to explore meaningful employment opportunities for people with a learning disability as the figures for Hull are considerably lower than national and regional averages. Given the links between employment and wellbeing and between unemployment, poverty and impaired health, it could be reasonably expected that positive health and wellbeing outcomes will arise from improved employment opportunities.
People registered with Hull GPs who are diagnosed as having learning disabilities should be encouraged to attend annual reviews (generally within primary care) in order to receive the best on-going treatment and advice. Carers should be involved, where appropriate, and information should be provided in a format that is easily understood.
Progress has been made across the health and care system to transform care for people with learning disabilities and/or autism, who have a mental illness or whose behaviour challenges services, but it is recognised that much more needs to be done. Sir Stephen Bubb’s report, commissioned by NHS England, describes how to accelerate this transformation of care.
“The work to be taken forward through this programme will be wide-ranging and will be co-designed and co-produced in partnership with people with learning disabilities and/or autism, their families, clinicians, commissioners, providers, and other national organisations in the health and care system”.
Resources
Joint Needs Assessment for Children and Young People with Special Educational Needs and Disabilities, 2021/22.
The Office for Health Improvement & Disparities’ Fingertips. https://fingertips.phe.org.uk/
NHS Digital. Quality and Outcomes Framework. https://qof.digital.nhs.uk/
NHS Choices, What is a learning disability? www.nhs.uk. 2013, NHS Choices: London.
Association of Directors of Social Services, et al., Transforming care for people with learning disabilities – next steps. 2015, Association of Directors of Social Services, Care Quality Commission, Department of Health, Health Education England, Local Government Association and NHS England: London.
North East Lincolnshire Clinical Commissioning Group, et al., Learning Disability Transforming Care Partnership. Humber Transforming Care Partnership Joint Transformation Plan 2016-2019. 2015, North East Lincolnshire Clinical Commissioning Group, Hull Clinical Commissioning Group, East Riding of Yorkshire Clinical Commissioning Group, North East Lincolnshire Council, Hull City Council, East Riding of Yorkshire Council: North East Lincolnshire, Hull and East Riding of Yorkshire.
Houlden, A., et al., Building the Right Support: A national plan to develop community services and close inpatient facilities for people with a learning disability and/or autism who display behaviour that challenges, including those with a mental health condition. 2015, Local Government Association, Directors of Adult Social Services, and NHS England: London.
Hull Early Help Service Guide and Performance Review 2024/25. Hull City Council, 2025.
Updates
This page was last updated / checked on 15 January 2026.
This page is due to be updated / checked in July 2026.