Index
This topic area covers statistics and information relating to A&E attendances and hospital admissions among children and young people including local strategic need and service provision. Further information relating to hospital admissions as a result of unintentional and deliberate injuries can be found within Accidents and Injuries Among Children and Young People under Health Factors under Children and Young People. Information on hospital admissions for specific diseases and medical conditions among adults can be found on the specific pages for that disease or medical condition within Health Factors under Adults.
This page contains information from the Office for Health Improvement & Disparities’ Fingertips. Information is taken ‘live’ from the site so uses the latest available data from Fingertips and displays it on this page. As a result, some comments on this page may relate to an earlier period of time until this page is next updated (see review dates at the end of this page).
Summary Infographic
Headlines
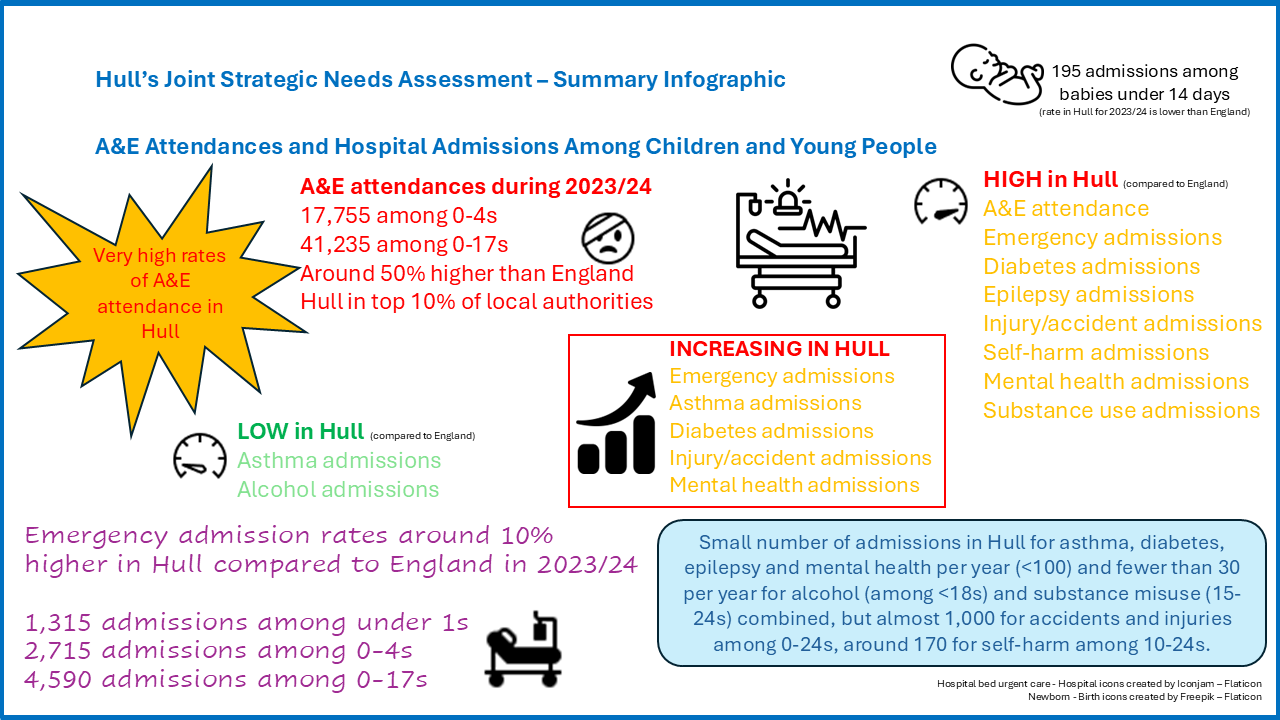
- The rate of A&E attendances in Hull among children aged under five and all children and young people aged under 18 years were comparable to England in 2016/17, but have increased sharply and both rates are both 46% higher than England for 2023/24. The A&E admission rates are the highest in the region by some margin for both under fives and under 18s. On average, children aged 0-4 years in Hull attended A&E on 1.10 occasions in 2023/24, and children and young people aged under 18 years attended A&E on average 0.68 occasions in 2023/24.
- For 2023/24, the rate of emergency hospital admissions for babies under 14 days is statistically significantly lower than England and this has consistently been the case for the last decade. In contrast, the rate of emergency hospital admissions for infants under one year, children aged 0-4 years and all children and young people aged under 18 years are all statistically significantly higher than England for 2023/34 with admission rates around 10% higher among under fives and just under 10% higher among under 18s.
- The rate of emergency hospital admissions among babies under 14 years has increased gradually from 44 admissions per 1,000 population in 2013/14 to 64 admissions per 1,000 population in 2023/24. For older ages, the rate of emergency hospital admissions has been reasonably steady between 2010/11 and 2019/20, but fell sharply in 2020/21 due the pandemic. Whilst the rate has increased between 2020/21 and 2023/24, the rates are lower than pre-pandemic levels for under fives and under 18s. This is not the case for infants under the age of one, where the increase since the pandemic has resulted in the highest admission rate since 2010/11.
- Admission rates are given as the number of admissions in relation to the size of the population. The admission rates for specific conditions or diseases can be relatively small which results in year-on-year variability. Furthermore, as the number of admissions are recorded (which measures impact on the NHS and health services), it does mean that the rates can be influenced by a small number of patients with multiple admissions within a single financial year or multiple admissions each year for a number of financial years.
- For 2023/24, the hospital admission rate for asthma is statistically significantly lower in Hull compared to England, but for diabetes and epilepsy the admission rates are statistically significantly higher in Hull compared to England. Admission rates for asthma among those aged 0-18 years have increased drastically over time in Hull between 2013/14 and 2020/21, and whilst the rates have increased since the low of 2020/21, the rates remain statistically significantly lower than England for 2023/24. The admission rate in Hull for diabetes among those aged 0-18 years have been quite variable over the last decade, but have not shown any great increase or decrease over time. The rate was among the lowest it had been in 2020/21 likely associated with the pandemic, and particularly high in 2021/22 but this could be one or a small number of individuals having multiple admissions over the year. However, the latest admission rate in Hull for diabetes among those aged 0-18 years is relatively high for 2023/24 compared to levels observed between 2013/14 and 2023/24. The admission rate for epilepsy among 0-18s decreased in Hull between 2013/14 and 2017/18, but there has been relatively little change since then.
- During 2023/24 among children and young people aged 0-18 years, there were 65 emergency hospital admissions for asthma, 45 for diabetes and 70 for epilepsy (numbers rounded to nearest five).
- During 2023/24, hospital admission rate for self-harm in Hull among young people aged 10-24 years was statistically significantly higher than England (332 versus 267 admissions per 100,000 population). There were 170 admissions for self-harm in total among Hull’s young people aged 10-24 years during 2023/24.
- Hospital admissions for mental health in Hull were around 50% higher in Hull compared to England during 2023/24 for under 18s. Over the entire 11-year period 2010/11 to 2020/21, the hospital admission rate was lower in Hull compared to England and in some cases statistically significantly lower in Hull than England. However, the rate almost tripled from 68 to 186 admissions per 100,000 population between 2020/21 and 2021/22, and whilst the rate has decreased in the last two years, the rate is still very high relatively to pre-pandemic rates. During 2023/24, there were 75 hospital admissions for mental health in Hull among under 18s.
- The admission rate for alcohol-specific conditions among under 18s in Hull was comparable to England for the three year period 2021/22-2023/24 having reduced sharply (almost halved) between 2016/17-2018/19. There were around 11 admissions per year among under 18s in Hull for alcohol-specific conditions.
The Population Affected – Why Is It Important?
Hospitals and the NHS are currently under extreme stress and pressure in terms of increased numbers of people attending A&E and being admitted to hospital. This has always been the case during winter months, but increasingly this pressure is arising throughout the entire year, and this has increased dramatically with the COVID pandemic.
Thus, whilst it is important that people seek medical help early in an emergency or where there is serious medical need, it is also important that people do not attend A&E when a more appropriate service should have been accessed instead. Such attendances will potentially mean that treatment is delayed for those most in need of urgent medical help.
Furthermore, attendances at A&E and admissions to hospital, particularly emergency hospital admissions which are the most expensive for the NHS can be minimised through prevention such as reducing exposure to second-hand smoke, accident prevention, improved road safety, and access to other early help community services such as pharmacies and urgent treatment centres.
The rates of A&E attendance and hospital admissions are given on The Office for Health Improvement & Disparities’ Fingertips, and the information is presented for different age groups, and for different types of causes of admission and different medical conditions. Hospital admission rates are given for asthma, diabetes, epilepsy, unintentional and deliberate injuries, self-harm and mental health, and admissions due to alcohol and substance use. For children aged under five years, admission rates are also given for gastroenteritis and lower respiratory tract infections.
Note that most of the rates presented below are described as rates of hospital admissions with the exception of those relating to alcohol which are stated as rates of hospital episodes. Each hospital admission, hospital stay or hospital ‘spell’ is made up of one or more hospital episodes. Each hospital episode relates to a period of care for a patient under a single consultant within one hospital provider. Thus if a patient moves from one consultant to another (for example, if they move from one speciality to another), or if a patient is transferred to another hospital (for example, if they require specialist care) then there will be more than one hospital episode for that hospital stay. In most cases, a hospital stay has a single hospital episode, but for a small number of hospital stays there can be a relatively large number of hospital episodes. However, in relation to hospital admission data presented on The Office for Health Improvement & Disparities’ Fingertips for children and young people, only those relating to alcohol mention hospital episodes and despite this, the information presented appears to be hospital admissions rather than hospital episodes based on information presented in their definitions section. However, the figures do not generally relate to patients, and some children may have more than one hospital admission within a single specified period of time.
The number of hospital admissions are generally rounded to the nearest five. In most cases, the rates of A&E attendance and hospital admission are given as a crude rate, but the hospital admission rates for alcohol-specific conditions and substance use are given as directly standardised rates (adjusted to take into consideration the age distribution of the local population).
Note also that the rate of A&E attendances and hospital admission are influenced by local variation in referral and admission practices as well as variation in incidence or prevalence.
The Hull Picture
A&E Attendances
For 2023/24, the rate of A&E attendances in Hull is 46% higher than England for children aged under five. The rate in Hull is 16th highest out of the 151 upper-tier local authorities with data for 2023/24 (Hartlepool at 1,792 attendances per 1,000 population is considerably higher than Hull and Cornwall has the lowest attendance rate at 350 attendances per 1,000 population).
The figures for under 18s for 2024/25 are currently not been shown on Fingertips (as at March 2026) although the data is available for 2023/24 here. During 2023/24, there were 675 A&E attendances among under 18s in Hull per 1,000 population compared to 460 for England and 432 for the region. The A&E attendance rate in Hull was very high relative to other local authorities in the region as the next highest local authority had a rate of 519 attendances per 1,000 population. The rates in Hull were double that of Leeds (309) and Bradford (317). The rate in Hull is 14th highest out of the 151 upper-tier local authorities with data for 2023/24 (Hartlepool at 1,083 attendances per 1,000 population is considerably higher than Hull and Cornwall has the lowest attendance rate at 208 attendances per 1,000 population).
The number of A&E attendances are given as a rate per 1,000 population.
Compared with benchmark
| Indicator | Period | England | Yorkshire and the Humber region (statistical) | Kingston upon Hull | East Riding of Yorkshire | North East Lincolnshire | North Lincolnshire | York | North Yorkshire UA | Barnsley | Doncaster | Rotherham | Sheffield | Bradford | Calderdale | Kirklees | Leeds | Wakefield |
|---|---|---|---|---|---|---|---|---|---|---|---|---|---|---|---|---|---|---|
A&E attendances (0 to 4 years) (Persons 0-4 yrs) | 2023/24 | 750.7 | 696.1 | 1098.2 | 747.1 | 691.6 | 836.5 | 603.5 | 684.1 | 695.7 | 845.1 | 753.0 | 894.7 | 493.7 | 619.0 | 666.9 | 509.9 | 725.2 |
A&E attendances (under 18 years) (Persons <18 yrs) | 2023/24 | 460.3 | 432.3 | 675.2 | 468.7 | 466.7 | 507.1 | 351.9 | 436.3 | 446.5 | 519.1 | 452.1 | 513.7 | 317.1 | 401.0 | 433.3 | 308.5 | 482.0 |
For 2023/24, the A&E attendance rate for under fives is the highest in the region (by some margin).
Compared with benchmark
A&E attendances (0 to 4 years) (Persons 0-4 yrs) 2023/24
| Area |
Recent
Trend |
Count
|
Value
|
95%
Lower CI |
95%
Upper CI |
|
|---|---|---|---|---|---|---|
| England | 2300599 | 750.7 | 749.7 | 751.7 | ||
| Yorkshire and the Humber region (statistical) | 205790 | 696.1 | 693.1 | 699.2 | ||
| Kingston upon Hull | 17755 | 1098.2 | 1082.1 | 1114.5 | ||
| East Riding of Yorkshire | 10950 | 747.1 | 733.1 | 761.2 | ||
| North East Lincolnshire | 5565 | 691.6 | 673.4 | 709.8 | ||
| North Lincolnshire | 7005 | 836.5 | 817.2 | 856.5 | ||
| York | 5045 | 603.5 | 586.8 | 620.2 | ||
| North Yorkshire UA | 18815 | 684.1 | 674.4 | 694.0 | ||
| Barnsley | 9305 | 695.7 | 681.5 | 709.8 | ||
| Doncaster | 14770 | 845.1 | 831.4 | 858.7 | ||
| Rotherham | 11215 | 753.0 | 739.2 | 767.2 | ||
| Sheffield | 26760 | 894.7 | 884.0 | 905.5 | ||
| Bradford | 17700 | 493.7 | 486.4 | 501.0 | ||
| Calderdale | 6740 | 619.0 | 604.4 | 634.1 | ||
| Kirklees | 16545 | 666.9 | 656.7 | 677.1 | ||
| Leeds | 23050 | 509.9 | 503.3 | 516.4 | ||
| Wakefield | 14575 | 725.2 | 713.6 | 737.2 |
Source: OHID, based on NHS England and Office for National Statistics data
The A&E attendance rate among infants aged under five years in Hull was comparable to England in 2016/17 (not shown), but has considerably increased since then and the rate in Hull is now statistically significantly higher than England and has been for the latest three year period 2021/22 to 2023/24, although the rate has been relatively stable in Hull in that three year period varying between 1,100 and 1,150 A&E attendances per 1,000 children aged 0-4 years.
During 2023/24, there were 17,755 A&E attendances per 1,000 children aged 0-4 years. From the Office for National Statistics, resident population estimates for Hull for mid-year 2023, the population aged 0-4 years is estimated to be 16,168. Thus it is estimated, on average, each child aged 0-4 years attended A&E on 1.10 occasions during 2023/24. Some children will have not attended A&E at all, whereas other children will have attended multiple times over the year.
Compared with benchmark
A&E attendances (0 to 4 years) (Persons 0-4 yrs)
|
Period
|
Kingston upon Hull |
Yorkshire and the Humber region (statistical)
|
England
|
||||
|---|---|---|---|---|---|---|---|
|
Count
|
Value
|
95%
Lower CI |
95%
Upper CI |
||||
| 2021/22 | • | 17760 | 1124.6 | 1108.0 | 1141.2 | 727.5 | 762.6 |
| 2022/23 | • | 18075 | 1143.0 | 1126.5 | 1159.9 | 739.6 | 797.8 |
| 2023/24 | • | 17755 | 1098.2 | 1082.1 | 1114.5 | 696.1 | 750.7 |
Source: OHID, based on NHS England and Office for National Statistics data
Over the last three years, the rate of A&E attendances among children and young people aged under 18 years in Hull has remained relatively constant around 680 attendances per 1,000 population.
In 2023/24, there were 41,235 A&E attendances among children and young people aged under 18 years in Hull. The Office for National Statistics estimated that the total resident population of Hull aged under 18 years as 61,075 as at mid-year 2023. This equates to an average of 0.68 A&E attendances per child, although not all children will have attended but others will have attended A&E more than once during the year.
Compared with benchmark
A&E attendances (under 18 years) (Persons <18 yrs)
|
Period
|
Kingston upon Hull |
Yorkshire and the Humber region (statistical)
|
England
|
||||
|---|---|---|---|---|---|---|---|
|
Count
|
Value
|
95%
Lower CI |
95%
Upper CI |
||||
| 2021/22 | • | 39665 | 671.7 | 665.1 | 678.4 | 430.6 | 439.8 |
| 2022/23 | • | 41180 | 687.7 | 681.1 | 694.4 | 445.3 | 467.6 |
| 2023/24 | • | 41235 | 675.2 | 668.7 | 681.7 | 432.3 | 460.3 |
Source: OHID, based on NHS England and Office for National Statistics data
All Emergency Hospital Admissions
The rate of emergency hospital admissions for babies aged under 14 days (per 1,000 population) were considerably lower and statistically significantly lower in Hull compared to England for 2023/24. However, the emergency admission rate for both all young children aged under five years and aged under 18 years were statistically significantly higher in Hull compared to England for 2023/24. The rates in Hull are around 10% higher than England for infants aged under one year and young children aged under five years, and just under 10% higher for all children and young people aged under 18 years.
Compared with benchmark
| Indicator | Period | England | Yorkshire and the Humber region (statistical) | Kingston upon Hull | East Riding of Yorkshire | North East Lincolnshire | North Lincolnshire | York | North Yorkshire UA | Barnsley | Doncaster | Rotherham | Sheffield | Bradford | Calderdale | Kirklees | Leeds | Wakefield |
|---|---|---|---|---|---|---|---|---|---|---|---|---|---|---|---|---|---|---|
Admissions of babies under 14 days (Persons <14 days) | 2023/24 | 88.7 | 104.6 | 63.5 | 73.7 | 102.9 | 92.5 | 135.8 | 117.4 | 200.9 | 365.0 | 139.9 | 37.8 | 81.9 | 77.8 | 107.4 | 48.3 | 119.2 |
Emergency admissions (0 to 4 years) (Persons <1 yr) | 2023/24 | 387 | 471 | 428 | 449 | 673 | 608 | 627 | 589 | 664 | 972 | 638 | 181 | 546 | 430 | 440 | 193 | 449 |
Emergency admissions (0 to 4 years) (Persons 0-4 yrs) | 2023/24 | 151 | 179 | 168 | 173 | 258 | 224 | 241 | 236 | 216 | 315 | 246 | 73 | 225 | 169 | 161 | 81 | 168 |
Emergency admissions (under 18 years) (Persons <18 yrs) | 2023/24 | 69.1 | 78.3 | 75.2 | 69.7 | 118.3 | 97.1 | 99.2 | 98.9 | 89.0 | 123.2 | 98.9 | 39.1 | 101.1 | 75.8 | 69.0 | 40.0 | 76.5 |
The emergency hospital admission rate for babies under 14 days has also been significantly lower than England each year since 2013/14.
Compared with benchmark
Admissions of babies under 14 days (Persons <14 days)
|
Period
|
Kingston upon Hull |
Yorkshire and the Humber region (statistical)
|
England
|
||||
|---|---|---|---|---|---|---|---|
|
Count
|
Value
|
95%
Lower CI |
95%
Upper CI |
||||
| 2013/14 | • | 150 | 43.7 | 36.7 | 51.0 | 62.9 | 56.7 |
| 2014/15 | • | 130 | 39.2 | 32.5 | 46.2 | 65.5 | 60.7 |
| 2015/16 | • | 155 | 45.2 | 38.1 | 52.5 | 64.1 | 66.3 |
| 2016/17 | • | 140 | 41.1 | 35.1 | 49.1 | 61.1 | 71.0 |
| 2017/18 | • | 150 | 45.5 | 38.6 | 53.5 | 65.5 | 72.8 |
| 2018/19 | • | 145 | 45.5 | 37.8 | 52.8 | 65.1 | 77.0 |
| 2019/20 | • | 170 | 54.7 | 47.0 | 63.9 | 70.9 | 78.1 |
| 2020/21 | • | 125 | 41.6 | 35.3 | 50.3 | 67.8 | 77.6 |
| 2021/22 | • | 155 | 50.5 | 42.2 | 58.4 | 79.1 | 81.6 |
| 2022/23 | • | 155 | 52.2 | 44.6 | 61.5 | 89.9 | 85.7 |
| 2023/24 | • | 195 | 63.5 | 54.9 | 73.1 | 104.6 | 88.7 |
Source: OHID, based on NHS England data
Between 2019/20 and 2019/20, the emergency hospital admissions infants aged under one year were consistently higher in Hull compared to England, and for most years the difference was statistically significant. Between 2019/20 and 2020/21, the rates decreased sharply due to the COVID-19 pandemic, but the decrease was greater in Hull than England, so for the first time the admission rate was lower than England, and for 2020/21, the rate in Hull was statistically significantly lower than England. The rate in Hull returned to levels similar to before the pandemic for 2021/22 and 2022/23, but in contrast to prior to 2020/21, the rate were lower than England although not statistically significantly lower.
However, there has been a relatively sharp increase in the admission rate in Hull in the last year, and the admission rate is again statistically significantly higher in Hull compared to England. The latest rate at 428 admissions per 1,000 population is the highest it has been in Hull since 2010/11.
Compared with benchmark
Emergency admissions (0 to 4 years) (Persons <1 yr)
|
Period
|
Kingston upon Hull |
Yorkshire and the Humber region (statistical)
|
England
|
||||
|---|---|---|---|---|---|---|---|
|
Count
|
Value
|
95%
Lower CI |
95%
Upper CI |
||||
| 2010/11 | • | 1333 | 371 | 351 | 391 | 396 | 328 |
| 2011/12 | • | 1523 | 416 | 395 | 437 | 390 | 315 |
| 2012/13 | • | 1492 | 385 | 366 | 405 | 387 | 325 |
| 2013/14 | • | 1361 | 364 | 344 | 383 | 378 | 328 |
| 2014/15 | • | 1247 | 346 | 327 | 366 | 363 | 340 |
| 2015/16 | • | 1414 | 408 | 387 | 430 | 348 | 360 |
| 2016/17 | • | 1371 | 385 | 365 | 406 | 338 | 372 |
| 2017/18 | • | 1385 | 390 | 370 | 411 | 353 | 368 |
| 2018/19 | • | 1350 | 411 | 389 | 433 | 367 | 393 |
| 2019/20 | • | 1330 | 409 | 387 | 432 | 370 | 393 |
| 2020/21 | • | 695 | 218 | 202 | 235 | 234 | 254 |
| 2021/22 | • | 1045 | 351 | 330 | 373 | 382 | 367 |
| 2022/23 | • | 1175 | 366 | 345 | 387 | 417 | 375 |
| 2023/24 | • | 1315 | 428 | 406 | 452 | 471 | 387 |
Source: OHID, based on NHS England and Office for National Statistics data
A very similar pattern was observed among children aged 0-4 years as was observed for infants aged under one year, although there were two differences. Firstly, the rate was statistically significantly higher in Hull compared to England prior to the pandemic for more periods of time, and secondly, whilst the rate has increased in the last year, it is lower than all but one year prior to the pandemic. The latest rate is 168 per 1,000 population and in 2014/15 the rate was 164 per 1,000 population with the rate ranging from 171 to 188 for all other years between 2010/11 to 2019/20.
Compared with benchmark
Emergency admissions (0 to 4 years) (Persons 0-4 yrs)
|
Period
|
Kingston upon Hull |
Yorkshire and the Humber region (statistical)
|
England
|
||||
|---|---|---|---|---|---|---|---|
|
Count
|
Value
|
95%
Lower CI |
95%
Upper CI |
||||
| 2010/11 | • | 2961 | 174 | 168 | 181 | - | 150 |
| 2011/12 | • | 3275 | 188 | 182 | 195 | 170 | 144 |
| 2012/13 | • | 3280 | 183 | 176 | 189 | 171 | 150 |
| 2013/14 | • | 3170 | 174 | 168 | 180 | 165 | 146 |
| 2014/15 | • | 2995 | 164 | 158 | 170 | 155 | 148 |
| 2015/16 | • | 3270 | 180 | 174 | 186 | 150 | 157 |
| 2016/17 | • | 3075 | 171 | 164 | 177 | 147 | 161 |
| 2017/18 | • | 3100 | 176 | 170 | 182 | 154 | 160 |
| 2018/19 | • | 3025 | 177 | 170 | 183 | 162 | 172 |
| 2019/20 | • | 3025 | 181 | 174 | 187 | 157 | 167 |
| 2020/21 | • | 1340 | 82 | 77 | 86 | 86 | 94 |
| 2021/22 | • | 2490 | 158 | 151 | 164 | 170 | 161 |
| 2022/23 | • | 2470 | 156 | 150 | 162 | 172 | 158 |
| 2023/24 | • | 2715 | 168 | 162 | 174 | 179 | 151 |
Source: OHID, based on NHS England and Office for National Statistics data
The rate of emergency hospital admission among under 18s has been consistently statistically significantly higher in Hull compared to England between 2010/11 and 2019/20 prior to the pandemic. Whilst there has been relatively little change over the last decade in Hull with around 90 admissions per 1,000 population, the rate had been increasing for England from just over 70 to just under 80 admissions per 1,000 population prior to the pandemic. This meant that the inequalities gap between Hull and England had reduced between 2010/11 and 2019/20.
There was a dramatic decrease in the emergency admission rate in Hull between 2019/20 and 2020/21 due to the pandemic. There was a similar decrease for England and the region, although the decrease in Hull was slightly greater so that for the first time, the admission rate in Hull was statistically significantly lower than England.
Since 2020/21, the emergency admission rate in Hull has increased as it has for England and the region, although in the last year from 2022/23 and 2023/24 the rate of increase has been greater in Hull. As a result of a relatively large increase in Hull in the last year, the rate is for the first time since the pandemic, statistically significantly higher in Hull compared to England. However, the emergency admission rate in Hull for 2023/24 is lower than all pre-pandemic admission rates.
During 2023/24, there were 4,590 emergency hospital admissions among under 18s in Hull.
Compared with benchmark
Emergency admissions (under 18 years) (Persons <18 yrs)
|
Period
|
Kingston upon Hull |
Yorkshire and the Humber region (statistical)
|
England
|
||||
|---|---|---|---|---|---|---|---|
|
Count
|
Value
|
95%
Lower CI |
95%
Upper CI |
||||
| 2010/11 | • | 4796 | 88.0 | 85.5 | 90.5 | - | 73.3 |
| 2011/12 | • | 5070 | 92.7 | 90.1 | 95.2 | 81.0 | 70.8 |
| 2012/13 | • | 5010 | 91.0 | 88.5 | 93.6 | 81.0 | 73.2 |
| 2013/14 | • | 5070 | 90.9 | 88.5 | 93.5 | 79.7 | 72.4 |
| 2014/15 | • | 4920 | 87.6 | 85.2 | 90.1 | 76.0 | 73.6 |
| 2015/16 | • | 5250 | 92.9 | 90.4 | 95.5 | 73.7 | 76.0 |
| 2016/17 | • | 5065 | 88.5 | 86.1 | 91.0 | 72.3 | 76.5 |
| 2017/18 | • | 5000 | 86.6 | 84.2 | 89.0 | 74.8 | 76.3 |
| 2018/19 | • | 4845 | 83.2 | 80.8 | 85.5 | 76.7 | 79.2 |
| 2019/20 | • | 4875 | 82.9 | 80.6 | 85.3 | 73.5 | 76.7 |
| 2020/21 | • | 2580 | 43.6 | 42.0 | 45.4 | 43.9 | 47.9 |
| 2021/22 | • | 4130 | 69.9 | 67.8 | 72.1 | 72.4 | 70.7 |
| 2022/23 | • | 4285 | 71.6 | 69.4 | 73.7 | 74.5 | 70.2 |
| 2023/24 | • | 4590 | 75.2 | 73.0 | 77.4 | 78.3 | 69.1 |
Source: OHID, based on NHS England and Office for National Statistics data
Hospital Admissions for Asthma, Epilepsy and Diabetes
In 2023/24, the hospital admission rate among all children and young people aged 0-18 years were statistically significantly lower in Hull compared to England for asthma, but statistically significantly higher for both diabetes and epilepsy.
Rates are given as hospital admissions per 100,000 population.
Compared with benchmark
| Indicator | Period | England | Yorkshire and the Humber region (statistical) | Kingston upon Hull | East Riding of Yorkshire | North East Lincolnshire | North Lincolnshire | York | North Yorkshire UA | Barnsley | Doncaster | Rotherham | Sheffield | Bradford | Calderdale | Kirklees | Leeds | Wakefield |
|---|---|---|---|---|---|---|---|---|---|---|---|---|---|---|---|---|---|---|
Hospital admissions for asthma (under 19 years) (Persons 0-18 yrs) | 2023/24 | 148.6 | 149.4 | 100.9 | 98.7 | 156.7 | 137.8 | 120.4 | 144.0 | 167.5 | 207.9 | 147.3 | 98.8 | 251.1 | 189.2 | 211.0 | 75.9 | 137.9 |
Hospital admissions for diabetes (under 19 years) (Persons 0-18 yrs) | 2023/24 | 49.8 | 57.6 | 69.9 | 60.8 | 71.2 | 82.7 | 26.8 | 49.4 | 46.5 | 86.0 | 40.9 | 45.3 | 53.6 | 84.1 | 67.1 | 46.1 | 75.2 |
Hospital admissions for epilepsy (under 19 years) (Persons 0-18 yrs) | 2023/24 | 79.3 | 98.6 | 108.7 | 76.0 | 99.7 | 192.9 | 147.1 | 205.7 | 121.0 | 100.4 | 73.6 | 41.2 | 103.8 | 73.6 | 86.3 | 46.1 | 106.5 |
Over the period 2013/14 and 2019/20, the hospital admission rate for asthma has reduced considerably in Hull, and whilst the rates had reduced in England, the decrease in Hull has been much greater. The admission rate fell by more than one-third from 272 to 81 asthma hospital admissions per 100,000 population between 2013/14 and 2019/20. The rate then halved to 40 admissions per 100,000 population for 2020/21, but it is possible that some of this decrease could be associated with the pandemic. Whilst the rate has increased slightly in the last three years, the rate for 2023/24 is still 63% lower than it was in 2013/14.
Overall for 2023/24, there were 65 admissions for asthma among children and young people aged 0-18 years in Hull (numbers rounded to nearest 10).
Compared with benchmark
Hospital admissions for asthma (under 19 years) (Persons 0-18 yrs)
|
Period
|
Kingston upon Hull |
Yorkshire and the Humber region (statistical)
|
England
|
||||
|---|---|---|---|---|---|---|---|
|
Count
|
Value
|
95%
Lower CI |
95%
Upper CI |
||||
| 2013/14 | • | 160 | 271.6 | 234.3 | 320.7 | 198.1 | 197.6 |
| 2014/15 | • | 145 | 244.5 | 207.9 | 289.5 | 210.1 | 217.1 |
| 2015/16 | • | 95 | 159.0 | 125.7 | 190.7 | 169.6 | 203.8 |
| 2016/17 | • | 75 | 124.4 | 96.4 | 154.1 | 182.4 | 204.7 |
| 2017/18 | • | 85 | 140.1 | 113.4 | 175.1 | 173.5 | 188.7 |
| 2018/19 | • | 60 | 98.4 | 73.6 | 124.8 | 164.0 | 181.3 |
| 2019/20 | • | 50 | 81.2 | 57.5 | 103.3 | 143.2 | 163.7 |
| 2020/21 | • | 25 | 40.4 | 24.8 | 57.7 | 68.2 | 76.0 |
| 2021/22 | • | 40 | 64.6 | 46.1 | 87.9 | 130.7 | 131.5 |
| 2022/23 | • | 45 | 71.3 | 53.4 | 97.3 | 112.9 | 122.2 |
| 2023/24 | • | 65 | 100.9 | 76.5 | 126.9 | 149.4 | 148.6 |
Source: OHID, based on NHS England and Office for National Statistics data
The rate of hospital admissions for diabetes has been quite variable in Hull prior to the pandemic ranging from 42 to 74 hospital admissions per 100,000 population among young people aged 0-18 years.
Due to the relatively small number of admissions, there was only one year (2018/19) where the rate in Hull was statistically significantly different than England.
The rate in 2020/21 was 40 admissions per 100,000 population which is the lowest it has been, but increased very sharply to 105 admissions per 100,000 population in 2021/22. As the rate measures the number of admissions, it is possible that the figures could be influenced by a small number of individuals (or even just one individual) having multiple admissions during the same financial year, and it is possible that this is the case for 2021/22 with the rate being so high.
The rate decreased to reasonably similar levels in 2022/23 and 2023/24 which were seen prior to the pandemic falling in the range observed prior to the pandemic (between 42 and 74 admissions per 100,000 population), although for both 2022/23 and 2023/24 with the rates being 63 and 70 admissions per 100,000 population respectively, the rates are currently at the top end of previously observed rates.
Overall for 2023/24, there were 45 admissions for diabetes among children and young people aged 0-18 years in Hull (numbers rounded to nearest 10).
Compared with benchmark
Hospital admissions for diabetes (under 19 years) (Persons 0-18 yrs)
|
Period
|
Kingston upon Hull |
Yorkshire and the Humber region (statistical)
|
England
|
||||
|---|---|---|---|---|---|---|---|
|
Count
|
Value
|
95%
Lower CI |
95%
Upper CI |
||||
| 2013/14 | • | 40 | 67.9 | 45.6 | 88.5 | 62.4 | 57.1 |
| 2014/15 | • | 25 | 42.2 | 25.9 | 60.2 | 51.1 | 56.1 |
| 2015/16 | • | 40 | 67.0 | 46.4 | 89.3 | 58.1 | 55.8 |
| 2016/17 | • | 35 | 58.1 | 39.1 | 78.8 | 60.8 | 55.6 |
| 2017/18 | • | 40 | 65.9 | 45.7 | 87.9 | 54.1 | 52.0 |
| 2018/19 | • | 45 | 73.8 | 53.8 | 98.7 | 57.0 | 51.5 |
| 2019/20 | • | 30 | 48.7 | 30.2 | 65.7 | 53.7 | 52.9 |
| 2020/21 | • | 25 | 40.4 | 24.8 | 57.7 | 48.3 | 49.4 |
| 2021/22 | • | 65 | 104.9 | 81.0 | 133.8 | 63.7 | 58.0 |
| 2022/23 | • | 40 | 63.4 | 42.6 | 82.7 | 54.8 | 52.4 |
| 2023/24 | • | 45 | 69.9 | 52.3 | 95.3 | 57.6 | 49.8 |
Source: OHID, based on NHS England and Office for National Statistics data
Whilst there has been considerably year-on-year variability due to the relatively small number of admissions and potentially differences in the average number of admissions per patient each year, the overall trend in the hospital admission rate for epilepsy for those aged 0-18 years has been decreasing in Hull since a high of 241 admissions per 100,000 population for 2010/11 and 170 admissions per 100,000 population for 2013/14. However, most of the decrease observed in the last decade between 2013/14 and 2023/24 occurred in the first half of the decade with no major change since 2017/18 (except for random variation).
Overall for 2023/24, there were 70 admissions for epilepsy among children and young people aged 0-18 years in Hull (numbers rounded to nearest 10).
Compared with benchmark
Hospital admissions for epilepsy (under 19 years) (Persons 0-18 yrs)
|
Period
|
Kingston upon Hull |
Yorkshire and the Humber region (statistical)
|
England
|
||||
|---|---|---|---|---|---|---|---|
|
Count
|
Value
|
95%
Lower CI |
95%
Upper CI |
||||
| 2013/14 | • | 100 | 169.7 | 135.0 | 202.7 | 88.6 | 77.8 |
| 2014/15 | • | 105 | 177.0 | 146.3 | 216.2 | 78.9 | 75.0 |
| 2015/16 | • | 75 | 125.6 | 95.8 | 153.7 | 81.7 | 77.1 |
| 2016/17 | • | 80 | 132.7 | 108.2 | 168.9 | 74.9 | 72.8 |
| 2017/18 | • | 70 | 115.4 | 87.1 | 142.1 | 76.8 | 73.5 |
| 2018/19 | • | 55 | 90.2 | 69.4 | 119.3 | 83.9 | 77.9 |
| 2019/20 | • | 75 | 121.8 | 97.2 | 154.5 | 84.2 | 79.6 |
| 2020/21 | • | 50 | 80.7 | 58.5 | 104.6 | 70.6 | 67.1 |
| 2021/22 | • | 75 | 121.1 | 95.2 | 151.8 | 80.6 | 73.5 |
| 2022/23 | • | 70 | 111.0 | 87.9 | 142.0 | 82.7 | 74.0 |
| 2023/24 | • | 70 | 108.7 | 84.7 | 137.3 | 98.6 | 79.3 |
Source: OHID, based on NHS England and Office for National Statistics data
Hospital Admissions for Accidents and Injuries
The emergency hospital admission rates for admissions caused by unintentional and deliberate injuries are statistically significantly higher in Hull compared to England in 2023/24 for those aged 0-4 years, those aged 0-14 years and .those aged 15-24 years.
Rates are given as emergency hospital admissions per 10,000 population.
Compared with benchmark
| Indicator | Period | England | Yorkshire and the Humber region (statistical) | Kingston upon Hull | East Riding of Yorkshire | North East Lincolnshire | North Lincolnshire | York | North Yorkshire UA | Barnsley | Doncaster | Rotherham | Sheffield | Bradford | Calderdale | Kirklees | Leeds | Wakefield |
|---|---|---|---|---|---|---|---|---|---|---|---|---|---|---|---|---|---|---|
Hospital admissions caused by unintentional and deliberate injuries in children (aged 0 to 4 years) (Persons 0-4 yrs) | 2023/24 | 93.2 | 112.1 | 108.2 | 95.5 | 155.3 | 137.3 | 119.6 | 141.8 | 108.4 | 100.1 | 124.2 | 65.2 | 139.5 | 147.0 | 116.9 | 77.4 | 126.9 |
Hospital admissions caused by unintentional and deliberate injuries in children (aged 0 to 14 years) (Persons <15 yrs) | 2023/24 | 72.7 | 81.7 | 94.2 | 82.4 | 119.6 | 101.0 | 82.8 | 95.1 | 75.2 | 82.3 | 93.4 | 54.1 | 91.2 | 94.5 | 77.2 | 65.0 | 82.9 |
Hospital admissions caused by unintentional and deliberate injuries in young people (aged 15 to 24 years) (Persons 15-24 yrs) | 2023/24 | 88.6 | 90.0 | 114.1 | 111.6 | 128.4 | 118.8 | 67.6 | 97.4 | 163.8 | 149.0 | 89.0 | 71.3 | 77.8 | 71.8 | 89.3 | 51.8 | 145.8 |
The rate of admissions in Hull has decreased among those aged 0-4 years. The rate reduced by one-third from 2011/12 when the rate was at its highest at 167.7 admissions per 10,000 population to 2019/20 (to 124.4 per 10,000 population). There was a relatively sharp decrease between 2019/20 and 2020/21 (decreasing by 22%), which is likely to have occurred – at least in part – due to the COVID-19 pandemic. People’s behaviours changed throughout the pandemic which could have influenced the number of accidents and injuries that occurred. Furthermore, people may have been less likely to attend A&E for instance which may have reduced the likelihood of hospital admission. Over the same period of time, the decreases in England and across the region have not been as marked. However, between 2020/21 and 2022/23, there have been further relatively large decreases in the admission rate in Hull such that the rate was lower in Hull compared to England for the first time. However, the rate has increased relatively sharply in the last year, and the rate in Hull is statistically significantly higher than England for the latest year 2023/24. Despite that increase in the last year, the admission rate in Hull is lower than pre-pandemic admission rates.
The rate has also decreased over time England and the region over the last decade.
Among children aged 0-4 years living in Hull, there were 175 hospital admissions caused by unintentional and deliberate injuries in 2023/24 which was almost half of the number for 2011/12 when there were a peak of 326 admissions (numbers generally are rounded to the nearest five on Fingertips).
Compared with benchmark
Hospital admissions caused by unintentional and deliberate injuries in children (aged 0 to 4 years) (Persons 0-4 yrs)
|
Period
|
Kingston upon Hull |
Yorkshire and the Humber region (statistical)
|
England
|
||||
|---|---|---|---|---|---|---|---|
|
Count
|
Value
|
95%
Lower CI |
95%
Upper CI |
||||
| 2010/11 | • | 265 | 156.1 | 137.9 | 176.1 | 153.1 | 143.4 |
| 2011/12 | • | 326 | 187.5 | 167.7 | 208.9 | 152.1 | 148.3 |
| 2012/13 | • | 305 | 170.0 | 150.9 | 189.6 | 136.2 | 135.1 |
| 2013/14 | • | 330 | 180.9 | 163.0 | 202.7 | 146.6 | 141.5 |
| 2014/15 | • | 315 | 172.5 | 155.0 | 193.8 | 136.3 | 138.7 |
| 2015/16 | • | 270 | 148.6 | 131.9 | 168.0 | 128.5 | 131.4 |
| 2016/17 | • | 260 | 144.2 | 128.2 | 164.0 | 127.7 | 128.8 |
| 2017/18 | • | 250 | 141.7 | 125.2 | 161.0 | 125.5 | 123.9 |
| 2018/19 | • | 235 | 137.2 | 120.2 | 155.9 | 130.0 | 126.5 |
| 2019/20 | • | 210 | 125.3 | 108.9 | 143.5 | 121.2 | 120.4 |
| 2020/21 | • | 160 | 97.4 | 82.9 | 113.7 | 107.8 | 112.1 |
| 2021/22 | • | 155 | 98.2 | 83.9 | 115.6 | 108.8 | 103.6 |
| 2022/23 | • | 120 | 75.9 | 64.1 | 92.1 | 101.9 | 92.0 |
| 2023/24 | • | 175 | 108.2 | 93.9 | 126.8 | 112.1 | 93.2 |
Source: OHID, based on NHS England and Office for National Statistics data
Further information is available on the type of injury from The Office for Health Improvement & Disparities’ Fingertips for those aged 0-4 years, and is presented within Accidents and Injuries Among Children and Young People under Health Factors under Children and Young People.
A reasonably similar pattern of decrease occurred in Hull among children and young people aged 0-14 years with the admission rates for unintentional and deliberate injuries falling from 157.6 to 106.3 per 10,000 population between 2011/12 and 2019/20. There was a sharp decrease between 2019/20 and 2020/21 with the hospital admission rate falling by 35% in Hull. Again, this is likely to have been caused – at least in part – by the COVID-19 pandemic. Whilst the rate has subsequently increased in Hull between 2020/21 and 2023/24, the rate is lower than pre-pandemic levels.
A similar pattern of change has occurred for England and the region with the rate decreasing over the last decade or so.
Among children aged 0-14 years living in Hull, there were 480 hospital admissions caused by unintentional and deliberate injuries in 2023/24 which is considerably lower than it was at its peak of 714 during 2011/12.
Compared with benchmark
Hospital admissions caused by unintentional and deliberate injuries in children (aged 0 to 14 years) (Persons <15 yrs)
|
Period
|
Kingston upon Hull |
Yorkshire and the Humber region (statistical)
|
England
|
||||
|---|---|---|---|---|---|---|---|
|
Count
|
Value
|
95%
Lower CI |
95%
Upper CI |
||||
| 2010/11 | • | 643 | 143.1 | 132.3 | 154.6 | 127.3 | 115.2 |
| 2011/12 | • | 714 | 157.6 | 146.3 | 169.6 | 128.0 | 118.3 |
| 2012/13 | • | 635 | 138.4 | 127.6 | 149.3 | 109.7 | 104.0 |
| 2013/14 | • | 655 | 140.1 | 129.8 | 151.5 | 121.2 | 112.5 |
| 2014/15 | • | 680 | 143.3 | 132.9 | 154.7 | 116.4 | 110.1 |
| 2015/16 | • | 635 | 131.3 | 121.7 | 142.4 | 108.8 | 104.9 |
| 2016/17 | • | 625 | 126.6 | 117.3 | 137.3 | 108.0 | 102.4 |
| 2017/18 | • | 600 | 119.9 | 110.3 | 129.7 | 106.4 | 97.8 |
| 2018/19 | • | 570 | 112.9 | 104.2 | 123.0 | 105.0 | 98.1 |
| 2019/20 | • | 525 | 103.7 | 94.8 | 112.8 | 97.5 | 93.6 |
| 2020/21 | • | 345 | 68.5 | 61.6 | 76.3 | 76.3 | 78.2 |
| 2021/22 | • | 455 | 91.4 | 83.2 | 100.2 | 85.4 | 84.3 |
| 2022/23 | • | 405 | 80.6 | 73.2 | 89.1 | 80.8 | 75.4 |
| 2023/24 | • | 480 | 94.2 | 85.8 | 102.8 | 81.7 | 72.7 |
Source: OHID, based on NHS England and Office for National Statistics data
Among young people aged 15-24 years, the admission rate for accidental and deliberate injuries decreased relatively sharply between 2010/11 and 2014/15, but remained relatively unchanged until 2018/19. The rate decreased, and in contrast to younger ages, there was relatively little change in the admission rate between 2019/20 and 2020/21 due to the pandemic. The rate has been around 110 admissions per 100,000 population since the pandemic (although the rate in 2022/23 was slightly higher). The latest rate in Hull for 2023/24 is lower than pre-pandemic levels.
In 2023/24, there were 395 hospital admissions caused by unintentional and deliberate injuries among those aged 15-24 years.
Compared with benchmark
Hospital admissions caused by unintentional and deliberate injuries in young people (aged 15 to 24 years) (Persons 15-24 yrs)
|
Period
|
Kingston upon Hull |
Yorkshire and the Humber region (statistical)
|
England
|
||||
|---|---|---|---|---|---|---|---|
|
Count
|
Value
|
95%
Lower CI |
95%
Upper CI |
||||
| 2010/11 | • | 899 | 215.3 | 201.4 | 229.8 | 167.4 | 154.9 |
| 2011/12 | • | 753 | 183.8 | 170.9 | 197.4 | 167.8 | 145.6 |
| 2012/13 | • | 655 | 160.5 | 148.2 | 173.0 | 145.9 | 131.5 |
| 2013/14 | • | 690 | 175.5 | 162.9 | 189.3 | 151.6 | 137.1 |
| 2014/15 | • | 555 | 143.2 | 131.8 | 155.9 | 139.0 | 131.9 |
| 2015/16 | • | 555 | 145.9 | 134.0 | 158.5 | 141.3 | 133.4 |
| 2016/17 | • | 600 | 160.9 | 148.8 | 174.9 | 141.2 | 128.2 |
| 2017/18 | • | 560 | 149.3 | 137.0 | 162.0 | 146.7 | 131.5 |
| 2018/19 | • | 540 | 147.1 | 135.2 | 160.4 | 145.9 | 135.7 |
| 2019/20 | • | 445 | 123.3 | 112.1 | 135.3 | 134.7 | 130.7 |
| 2020/21 | • | 395 | 112.8 | 102.3 | 124.8 | 106.5 | 112.1 |
| 2021/22 | • | 390 | 113.1 | 102.2 | 124.9 | 110.6 | 118.4 |
| 2022/23 | • | 430 | 125.3 | 113.2 | 137.1 | 92.6 | 93.9 |
| 2023/24 | • | 395 | 114.1 | 103.4 | 126.2 | 90.0 | 88.6 |
Source: OHID, based on NHS England and Office for National Statistics data
With such a large relatively decrease in the admission rate during the COVID-19 pandemic for the younger ages, it might be expected the rates would ‘bounce back’ and increase subsequently, and whilst an increase has occurred, the admission rates for 2023/24 are slightly lower than pre-pandemic admission rates.
Further information is presented within Accidents and Injuries Among Children and Young People under Health Factors under Children and Young People.
Hospital Admissions for Self-Harm
The Office for Health Improvement & Disparities’ Fingertips provides information relating to hospital admissions for intentional self-harm. In contrast to all the other hospital admission rates presented above, the hospital admission rate for self-harm is presented as the directly age standardised admission rates per 100,000 population (standardised to the European Standard Population). The rate is statistically significantly higher in Hull compared to England for 2023/24.
The activity levels are measured in terms of the number of hospital admissions, and it is possible that there could be multiple admissions from the same individual within a single financial year.
Compared with benchmark
| Indicator | Period | England | Yorkshire and the Humber region (statistical) | Kingston upon Hull | East Riding of Yorkshire | North East Lincolnshire | North Lincolnshire | York | North Yorkshire UA | Barnsley | Doncaster | Rotherham | Sheffield | Bradford | Calderdale | Kirklees | Leeds | Wakefield |
|---|---|---|---|---|---|---|---|---|---|---|---|---|---|---|---|---|---|---|
Hospital admissions as a result of self-harm (10 to 24 years) (Persons 10-24 yrs) | 2023/24 | 266.6 | 219.2 | 331.7 | 212.6 | 214.8 | 177.1 | 178.3 | 237.0 | 486.0 | 340.8 | 167.9 | 224.9 | 196.7 | 202.6 | 197.8 | 154.3 | 247.7 |
The age standardised hospital admission rate for self-harm in Hull fell between 2011/12 and 2021/22 among those aged 10-24 years from 556 to a low of 308 admissions per 100,000 population. However, the rates have increased in 2022/23 and then remained relatively unchanged in 2023/24. Whilst the rate in Hull is reasonably similar to what it was prior to the pandemic, the rate is now statistically significantly higher for the first time since prior to 2014/15.
For 2023/24, there were a total of 170 hospital admissions for self-harm in Hull among young people aged 10-24 years.
Compared with benchmark
Hospital admissions as a result of self-harm (10 to 24 years) (Persons 10-24 yrs)
|
Period
|
Kingston upon Hull |
Yorkshire and the Humber region (statistical)
|
England
|
||||
|---|---|---|---|---|---|---|---|
|
Count
|
Value
|
95%
Lower CI |
95%
Upper CI |
||||
| 2011/12 | • | 325 | 556.1 | 496.4 | 621.0 | 386.4 | 347.4 |
| 2012/13 | • | 245 | 427.9 | 375.2 | 485.9 | 344.1 | 349.0 |
| 2013/14 | • | 305 | 557.3 | 495.3 | 624.8 | 396.1 | 414.6 |
| 2014/15 | • | 210 | 400.0 | 346.8 | 459.0 | 369.2 | 400.7 |
| 2015/16 | • | 155 | 290.8 | 245.8 | 341.5 | 387.3 | 429.3 |
| 2016/17 | • | 220 | 413.3 | 359.6 | 472.7 | 404.3 | 405.3 |
| 2017/18 | • | 220 | 414.7 | 360.6 | 474.5 | 407.3 | 419.0 |
| 2018/19 | • | 190 | 359.8 | 309.7 | 415.6 | 428.2 | 441.7 |
| 2019/20 | • | 175 | 333.3 | 285.2 | 387.1 | 416.3 | 436.1 |
| 2020/21 | • | 185 | 364.1 | 313.1 | 421.1 | 364.0 | 421.2 |
| 2021/22 | • | 155 | 308.1 | 261.4 | 360.7 | 320.5 | 426.7 |
| 2022/23 | • | 170 | 331.5 | 283.6 | 385.3 | 255.0 | 318.5 |
| 2023/24 | • | 170 | 331.7 | 283.8 | 385.4 | 219.2 | 266.6 |
Source: OHID, based on NHS England and Office for National Statistics data
Hospital Admissions for Mental Health
The number of inpatient hospital admissions for mental health conditions among those aged under 18 years per 100,000 population in Hull is statistically significantly higher than England for 2023/24 (123 versus 80 admissions per 100,000 population). The rate in Hull for 2023/24 is also much higher than other local authorities in the region.
Compared with benchmark
| Indicator | Period | England | Yorkshire and the Humber region (statistical) | Kingston upon Hull | East Riding of Yorkshire | North East Lincolnshire | North Lincolnshire | York | North Yorkshire UA | Barnsley | Doncaster | Rotherham | Sheffield | Bradford | Calderdale | Kirklees | Leeds | Wakefield |
|---|---|---|---|---|---|---|---|---|---|---|---|---|---|---|---|---|---|---|
Hospital admissions for mental health conditions (under 18 years) (Persons <18 yrs) | 2023/24 | 80.2 | 70.4 | 122.8 | 104.5 | 105.2 | 72.8 | 115.6 | 87.2 | 68.6 | 52.8 | 68.9 | 83.1 | 56.6 | 55.5 | 50.6 | 37.3 | 79.1 |
The rate in Hull has been consistently lower than England between 2010/11 and 2020/21 with around 40 hospital admissions each year for mental health conditions among Hull residents aged under 18 years. However, this increased considerably to 110 admissions for 2021/22, although the number has since fallen to 100 admissions for 2022/23 and 75 admissions for 2023/24.
As this measure examines the total number of hospital admissions over a single financial year, it is possible that the increase in Hull is caused by a small number of patients with multiple admissions.
Compared with benchmark
Hospital admissions for mental health conditions (under 18 years) (Persons <18 yrs)
|
Period
|
Kingston upon Hull |
Yorkshire and the Humber region (statistical)
|
England
|
||||
|---|---|---|---|---|---|---|---|
|
Count
|
Value
|
95%
Lower CI |
95%
Upper CI |
||||
| 2010/11 | • | 30 | 55.0 | 37.1 | 78.6 | 58.2 | 92.1 |
| 2011/12 | • | 30 | 54.8 | 37.0 | 78.3 | 58.5 | 91.5 |
| 2012/13 | • | 35 | 63.5 | 42.7 | 86.3 | 57.9 | 88.1 |
| 2013/14 | • | 35 | 62.8 | 46.7 | 91.5 | 62.1 | 87.7 |
| 2014/15 | • | 40 | 71.2 | 52.4 | 99.1 | 69.5 | 88.1 |
| 2015/16 | • | 45 | 79.6 | 55.1 | 102.5 | 66.7 | 86.5 |
| 2016/17 | • | 30 | 52.4 | 35.4 | 74.8 | 59.0 | 82.3 |
| 2017/18 | • | 35 | 60.6 | 45.1 | 88.3 | 59.3 | 85.8 |
| 2018/19 | • | 45 | 77.2 | 57.8 | 105.3 | 71.0 | 89.8 |
| 2019/20 | • | 45 | 76.5 | 58.7 | 106.2 | 74.8 | 91.2 |
| 2020/21 | • | 40 | 67.6 | 51.2 | 96.0 | 76.2 | 89.8 |
| 2021/22 | • | 110 | 186.3 | 150.0 | 220.8 | 91.1 | 99.8 |
| 2022/23 | • | 100 | 167.0 | 137.4 | 204.9 | 75.3 | 80.8 |
| 2023/24 | • | 75 | 122.8 | 98.0 | 155.8 | 70.4 | 80.2 |
Source: OHID, based on NHS England and Office for National Statistics data
Hospital Admissions Due to Alcohol
Over the last three years 2021/22 to 2023/24, hospital admissions due to alcohol-specific conditions among under 18s have been lower in Hull compared to England.
For adults, the admission rates for alcohol-specific conditions are significantly higher for men compared to women generally around twice as high among men. However, the pattern is the reverse for under 18s with more women admitted to hospital for alcohol-specific conditions. This is not unique to Hull as the admission rates are higher among women compared to men for local authorities across the region for 2021/22-2023/24 with the exception of York and Bradford.
Rates are given as hospital admissions per 100,000 population. Alcohol-specific conditions are all conditions that are 100% or wholly related to alcohol such as alcohol poisoning or mental and behavioural disorders due to alcohol (which covers acute intoxication, harmful use, dependence syndrome, and withdrawal). A full list of diseases and conditions which are included in the alcohol-specific / wholly attributable to alcohol measure is given under Alcohol Specific Admissions and Deaths. The number of hospital admissions is a count of the total hospital admissions where the primary or any of the secondary diagnosis codes related to an alcohol-specific or wholly attributable condition. Thus the rate does not include hospital admissions where alcohol is a factor in the hospital admission such as road traffic accidents or falls unless the primary or any of the secondary diagnoses codes have an alcohol-specific diagnosis code such as alcohol poisoning or acute intoxication. Thus the rate does not necessarily take into consideration the overall impact on the hospital system of alcohol in relation to young people. Clearly, there will be a much higher number of attendances at A&E which are wholly attributable or related to alcohol, and alcohol will probably have a greater impact on A&E in terms of numbers although admission to hospital costs significantly more and results in more resources being used than an A&E attendance.
Compared with benchmark
| Indicator | Period | England | Yorkshire and the Humber region (statistical) | Kingston upon Hull | East Riding of Yorkshire | North East Lincolnshire | North Lincolnshire | York | North Yorkshire UA | Barnsley | Doncaster | Rotherham | Sheffield | Bradford | Calderdale | Kirklees | Leeds | Wakefield |
|---|---|---|---|---|---|---|---|---|---|---|---|---|---|---|---|---|---|---|
Admission episodes for alcohol-specific conditions (under 18 years) (Persons <18 yrs) | 2021/22 - 23/24 | 22.6 | 19.0 | 18.3 | 14.6 | 27.2 | 14.6 | 29.9 | 25.7 | 32.9 | 14.8 | 17.5 | 25.6 | 15.4 | 23.7 | 11.5 | 12.2 | 21.0 |
Admission episodes for alcohol-specific conditions (under 18 years) (Male <18 yrs) | 2021/22 - 23/24 | 15.4 | 14.6 | 16.3 | 13.5 | 23.5 | - | 37.8 | 19.8 | 16.7 | - | 13.7 | 16.7 | 15.9 | 14.5 | 7.9 | 7.5 | 17.4 |
Admission episodes for alcohol-specific conditions (under 18 years) (Female <18 yrs) | 2021/22 - 23/24 | 30.0 | 23.5 | 20.5 | 15.7 | 31.0 | - | 21.6 | 31.9 | 49.9 | 22.1 | 21.5 | 34.9 | 14.9 | 33.4 | 15.3 | 17.1 | 24.8 |
For males and females, the hospital admission rate for alcohol-specific conditions among under 18s was particularly high during the three year period 2016/17-2018/19 at 60.6 admissions per 100,000 population (105 admissions in total). The rate was almost twice as high in Hull compared to England at that time (60.6 versus 32.0 admissions per 100,000 population). The rate has deceased sharply in Hull compared to a relatively small reduction nationally. The admission rate in Hull has been comparable to England for the last three years.
Over the three year period, there were 33 alcohol-specific admissions in Hull so an average of just 11 per year.
Compared with benchmark
Admission episodes for alcohol-specific conditions (under 18 years) (Persons <18 yrs)
|
Period
|
Kingston upon Hull |
Yorkshire and the Humber region (statistical)
|
England
|
||||
|---|---|---|---|---|---|---|---|
|
Count
|
Value
|
95%
Lower CI |
95%
Upper CI |
||||
| 2012/13 - 14/15 | • | 75 | 44.9 | 35.3 | 56.3 | 37.2 | 39.2 |
| 2013/14 - 15/16 | • | 60 | 35.6 | 26.2 | 44.5 | 35.9 | 37.6 |
| 2014/15 - 16/17 | • | 65 | 38.3 | 29.0 | 48.1 | 33.5 | 34.4 |
| 2015/16 - 17/18 | • | 80 | 46.7 | 36.5 | 57.4 | 33.7 | 33.2 |
| 2016/17 - 18/19 | • | 105 | 60.6 | 49.1 | 72.7 | 32.6 | 32.0 |
| 2017/18 - 19/20 | • | 100 | 57.2 | 45.5 | 68.3 | 30.6 | 31.2 |
| 2018/19 - 20/21 | • | 70 | 39.7 | 32.0 | 51.5 | 27.7 | 29.9 |
| 2019/20 - 21/22 | • | 50 | 28.2 | 21.0 | 37.2 | 23.8 | 28.8 |
| 2020/21 - 22/23 | • | 34 | 19.1 | 13.2 | 26.7 | 21.5 | 26.1 |
| 2021/22 - 23/24 | • | 33 | 18.3 | 12.6 | 25.7 | 19.0 | 22.6 |
Source: OHID, based on NHS England and Office for National Statistics data
Over the three year period 2021/22-2023/24, there were an average of five admissions per year among males aged under 18 years in Hull for alcohol-specific conditions.
Compared with benchmark
Admission episodes for alcohol-specific conditions (under 18 years) (Male <18 yrs)
|
Period
|
Kingston upon Hull |
Yorkshire and the Humber region (statistical)
|
England
|
||||
|---|---|---|---|---|---|---|---|
|
Count
|
Value
|
95%
Lower CI |
95%
Upper CI |
||||
| 2012/13 - 14/15 | • | 40 | 46.5 | 31.2 | 60.6 | 33.7 | 30.6 |
| 2013/14 - 15/16 | • | 30 | 34.6 | 24.3 | 50.7 | 31.0 | 29.5 |
| 2014/15 - 16/17 | • | 35 | 40.0 | 26.9 | 54.2 | 29.2 | 27.6 |
| 2015/16 - 17/18 | • | 45 | 50.9 | 38.1 | 69.4 | 28.5 | 26.7 |
| 2016/17 - 18/19 | • | 60 | 67.2 | 50.3 | 85.2 | 28.1 | 26.2 |
| 2017/18 - 19/20 | • | 60 | 66.6 | 52.8 | 88.3 | 26.6 | 25.3 |
| 2018/19 - 20/21 | • | 45 | 49.7 | 34.4 | 64.0 | 23.8 | 23.3 |
| 2019/20 - 21/22 | • | 30 | 33.0 | 22.3 | 47.1 | 19.3 | 20.7 |
| 2020/21 - 22/23 | • | 17 | 18.6 | 10.8 | 29.8 | 16.2 | 17.8 |
| 2021/22 - 23/24 | • | 15 | 16.3 | 9.1 | 26.9 | 14.6 | 15.4 |
Source: OHID, based on NHS England and Office for National Statistics data
For females aged under 18 years over the three year period, there were 18 alcohol-specific admissions in Hull so an average of six per year.
Compared with benchmark
Admission episodes for alcohol-specific conditions (under 18 years) (Female <18 yrs)
|
Period
|
Kingston upon Hull |
Yorkshire and the Humber region (statistical)
|
England
|
||||
|---|---|---|---|---|---|---|---|
|
Count
|
Value
|
95%
Lower CI |
95%
Upper CI |
||||
| 2012/13 - 14/15 | • | 35 | 43.3 | 32.2 | 63.0 | 40.8 | 48.2 |
| 2013/14 - 15/16 | • | 25 | 30.6 | 21.8 | 48.1 | 41.1 | 46.0 |
| 2014/15 - 16/17 | • | 30 | 36.5 | 24.6 | 52.0 | 38.3 | 41.6 |
| 2015/16 - 17/18 | • | 35 | 42.1 | 27.4 | 55.8 | 39.1 | 40.0 |
| 2016/17 - 18/19 | • | 45 | 53.6 | 39.1 | 71.7 | 37.0 | 38.0 |
| 2017/18 - 19/20 | • | 35 | 41.3 | 29.7 | 58.8 | 34.8 | 37.3 |
| 2018/19 - 20/21 | • | 30 | 35.0 | 22.7 | 48.6 | 31.8 | 36.9 |
| 2019/20 - 21/22 | • | 20 | 23.2 | 14.2 | 35.9 | 28.9 | 37.2 |
| 2020/21 - 22/23 | • | 17 | 19.6 | 11.4 | 31.4 | 27.0 | 34.7 |
| 2021/22 - 23/24 | • | 18 | 20.5 | 12.1 | 32.4 | 23.5 | 30.0 |
Source: OHID, based on NHS England and Office for National Statistics data
Further information is available on Alcohol Consumption Among Young People within Lifestyle Factors under Children and Young People.
Hospital Admissions due to Substance Misuse
In contrast to all the other hospital admission rates presented above (except self-harm), the hospital admission rate for substance misuse is presented as the directly age standardised admission rate per 100,000 population (standardised to the European Standard Population).
The rate in Hull for the three year period 2021/22-2023/24 was higher than England, but not statistically significantly higher.
Compared with benchmark
| Indicator | Period | England | Yorkshire and the Humber region (statistical) | Kingston upon Hull | East Riding of Yorkshire | North East Lincolnshire | North Lincolnshire | York | North Yorkshire UA | Barnsley | Doncaster | Rotherham | Sheffield | Bradford | Calderdale | Kirklees | Leeds | Wakefield |
|---|---|---|---|---|---|---|---|---|---|---|---|---|---|---|---|---|---|---|
Hospital admissions due to substance misuse (15 to 24 years) (Persons 15-24 yrs) | 2021/22 - 23/24 | 47.4 | 36.6 | 57.7 | 37.5 | 48.2 | 42.6 | 26.5 | 19.7 | 94.0 | 59.5 | 47.9 | 22.2 | 37.8 | 45.8 | 38.0 | 25.1 | 49.2 |
The standardised hospital admission rate due to substance misuse has increased between 2008/09-2010/11 and 2013/14-2015/16 from 85 to 156 admissions per 100,000 population. The rate decreased to 138 admissions per 100,000 population for 2014/15-2016/17, and then remained relatively unchanged until 2017/18-2019/20 reducing only to 131 admissions per 100,000 population. Throughout the entire period 2008/09-2010/11 to 2018/19-2020/21, the admission rate in Hull was statistically significantly higher than England for substance misuse.
However, in recent years there has been a steady decreased in the admission rate due to substance use in Hull among young people aged 15-24 years with the rate decreasing from 131 to 57 admissions per 100,000 population between 2017/18-2019/20 and 2021/22-2023/24. It is possible that some of the decrease could be related to a reduced admission rate during the COVID-19 pandemic, although the recent decreases follow the same overall trend observed in the couple of years prior to the pandemic. This reduction is levelled off in the last year though with only a small reduction between 2020/21-2022/23 and 2021/22-2023/24.
Over the three year period 2021/22-2023/24, there were 60 substance related admissions among 15-24 year olds in Hull equating to an average of 20 each year (numbers rounded to nearest 10).
Compared with benchmark
Hospital admissions due to substance misuse (15 to 24 years) (Persons 15-24 yrs)
|
Period
|
Kingston upon Hull |
Yorkshire and the Humber region (statistical)
|
England
|
||||
|---|---|---|---|---|---|---|---|
|
Count
|
Value
|
95%
Lower CI |
95%
Upper CI |
||||
| 2008/09 - 10/11 | • | 117 | 84.9 | 71.2 | 103.2 | 67.9 | 63.5 |
| 2009/10 - 11/12 | • | 156 | 116.5 | 98.6 | 136.6 | 80.7 | 69.4 |
| 2010/11 - 12/13 | • | 170 | 136.8 | 117.0 | 159.0 | 89.2 | 76.5 |
| 2011/12 - 13/14 | • | 175 | 142.5 | 122.0 | 165.4 | 92.5 | 82.7 |
| 2012/13 - 14/15 | • | 175 | 144.8 | 123.8 | 168.3 | 95.4 | 90.3 |
| 2013/14 - 15/16 | • | 180 | 155.9 | 133.7 | 180.6 | 98.9 | 94.9 |
| 2014/15 - 16/17 | • | 160 | 137.8 | 116.8 | 161.4 | 93.8 | 91.0 |
| 2015/16 - 17/18 | • | 155 | 136.3 | 115.4 | 159.8 | 88.5 | 87.2 |
| 2016/17 - 18/19 | • | 150 | 130.6 | 110.2 | 153.7 | 84.9 | 83.8 |
| 2017/18 - 19/20 | • | 145 | 130.5 | 109.9 | 153.7 | 85.0 | 83.8 |
| 2018/19 - 20/21 | • | 120 | 110.8 | 91.8 | 132.5 | 78.6 | 80.5 |
| 2019/20 - 21/22 | • | 90 | 81.2 | 65.1 | 100.2 | 63.4 | 71.0 |
| 2020/21 - 22/23 | • | 60 | 58.9 | 45.1 | 75.5 | 46.7 | 58.3 |
| 2021/22 - 23/24 | • | 60 | 57.7 | 44.1 | 74.3 | 36.6 | 47.4 |
Source: OHID, based on NHS England and Office for National Statistics data
Further information is available on Alcohol Consumption Among Young People and Drug Use Among Young People within Lifestyle Factors under Children and Young People.
Strategic Need and Service Provision
Hospitals and the NHS are currently under an excess stress and pressure in terms of increased numbers of people attending A&E and being admitted to hospital. This has always been the case during winter months but increasingly this pressure is felt throughout the entire year, and this has increased dramatically with the COVID pandemic.
Thus, whilst it is important that people seek medical help early in an emergency or where there is serious medical need, it is also important that people know what services to access, how they can access services and know if what circumstances they should access specific services. Access to services should be based on specific needs, and needs to be made as efficiently as possible so that people do not need to access multiple services unnecessarily.
Furthermore, it is important that messaging and advice continues including Make Every Contact Count around prevention as a significant number of A&E attendances and hospital admissions, particularly emergency hospital admissions, would not have been necessary if risk factors has been reduced, such as exposure to second-hand smoke, accident prevention, improved road safety, and access to other early help community services such as pharmacies and urgent treatment centres.
Resources
The Office for Health Improvement & Disparities’ Fingertips: https://fingertips.phe.org.uk/
Updates
This page was last updated / checked on 19 March 2026.
This page is due to be updated / checked in September 2026.