Index
This topic area covers statistics and information relating to healthy weight among adults in Hull including local strategic need and service provision. Further information relating to Healthy Weight Among Children and Young People is given under Lifestyle Factors within Children and Young People. Healthy weight information has been collected within Hull’s Health and Wellbeing Surveys and full reports are available under Surveys within Tools and Resources.
This page contains information from the Office for Health Improvement & Disparities’ Fingertips. Information is taken ‘live’ from the site so uses the latest available data from Fingertips and displays it on this page. As a result, some comments on this page may relate to an earlier period of time until this page is next updated (see review dates at the end of this page).
Headlines
- Obesity can reduce life expectancy by up to ten years, and increases the risk of numerous diseases and medical conditions. It is the leading cause of type 2 diabetes, heart disease and cancer. Excess weight can also reduce people’s prospects in life, as well as affecting their self-esteem and emotional wellbeing.
- Excess weight has also increased among children and young people, who are more likely to go onto become overweight and obese as adults.
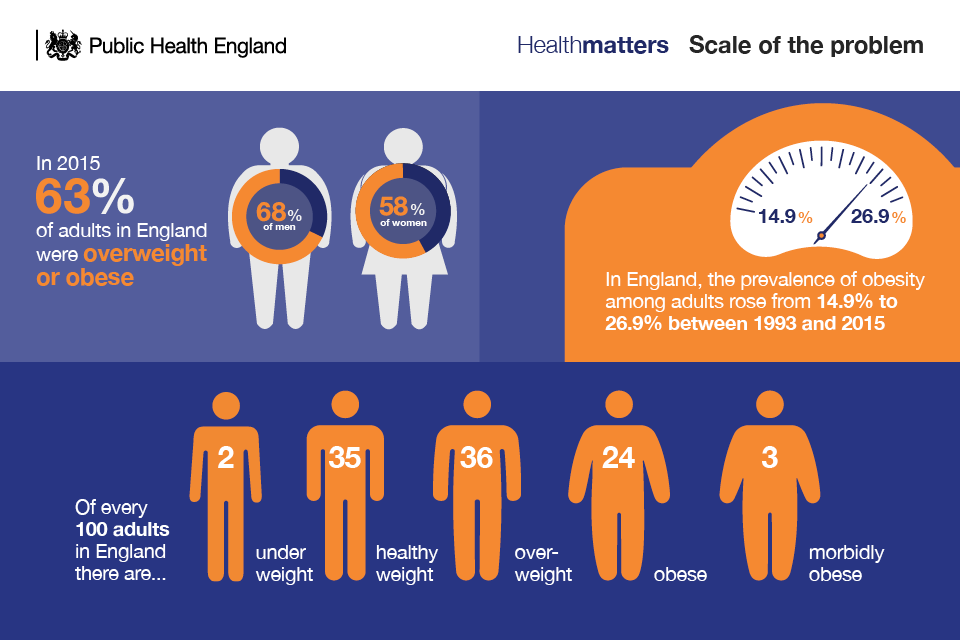
- In 2023/24, it is estimated that three-quarters (74.9%) adults aged 18+ years in Hull are overweight or obese which is higher than England (64.5%).
- In the local Health and Wellbeing Survey conducted during 2019, 69.7% of adults (aged 16+ years) were are overweight or obese. This included just under one-third of adults who were obese (31%). It is estimated that 145,500 adults in Hull are overweight or obese including 64,850 people who are obese. From local Health and Wellbeing Surveys, the prevalence of overweight and obesity have increased by 10% from 62% in 2003 to 70% in 2019. However, the greatest increases occurred for obesity which increased by almost 50% from 22% in 2003 to 31% in 2019.
- Hull has a high density of fast food outlets which in part will be associated with the fact that Hull is a city and that the Hull local authority has tight boundaries, although this has reduced in recent years due to a restriction on new take away planning applications (not within 400 metres of a secondary school or playing field). Despite this recent reduction, all of Hull residents live within a five minute drive of the nearest fast food outlet, and those without access to a car will have plenty of options for fast food delivery.
- The cost of being overweight and obese to society and the economy is estimated to be £27 billion per year.
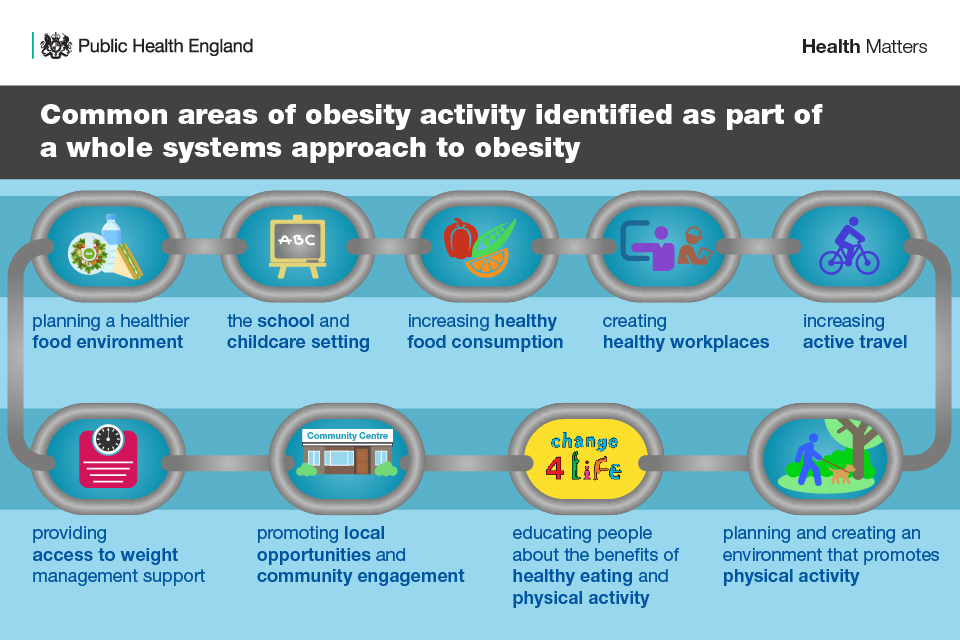
- Hull has developed a whole-system approach to promoting a healthy weight which considers the multi-factorial drivers of overweight and obesity and involves transformative co-ordination action across a broad range of disciplines and stakeholders.
The Population Affected – Why Is It Important?
Obesity can reduce life expectancy by between three and ten years, depending on the severity of the obesity. Excess weight increases the risk of numerous daily problems and health conditions, and is the leading cause of type 2 diabetes, heart disease and cancer, and alongside the ill health issues, it can reduce people’s prospects in life, affecting their ability to get and hold down work, their self-esteem and their underlying mental health. There are also increased complications in pregnancy such as gestational diabetes and pre-eclampsia.
It is estimated that obesity is responsible for more than 30,000 premature deaths each year. On average, obesity deprives an individual of an extra nine years of life, preventing many individuals from reaching retirement age. In the future, obesity could overtake tobacco smoking as the biggest cause of preventable death.
It is difficult to estimate the total cost to society of overweight and obesity, and different cost estimates have been produced over time, but they do differ as some relate to the costs to government only, whereas other estimates include estimates relating to wider society including the economy. The definitions, criteria and assumptions will also differ too, but nevertheless they illustrate the huge cost of obesity to society.
The cost of being overweight and obese to society and the economy has been estimated to be £27 billion per year. The cost could increase to just under £50 billion in 2050 if obesity rates continue to rise. It is predicted that there will be 11 million more obese adults in the UK by 2030, with combined medical costs for treatment of associated diseases estimated to increase by up to £2 billion per year.
In the National Food Strategy: An Independent Review for Government published in 2019, it was stated that the government spends an estimated £18 billion (8% of all government healthcare expenditure) on conditions related to high body mass index every year. In 2019/20, there were just over one million hospital admissions where obesity was recorded as the primary or secondary diagnosis – a 17% increase on 2018/19. They state that the Organisation of Economic Co-operation and Development estimates that the combined costs of conditions related to a high body mass index, in lost workforce productivity, reduction in life expectancy and NHS funds, is £74 billion every year. This is equivalent to cutting the UK’s Gross Domestic Product (GDP) by 3.4%.
Overweight is defined as having a body mass index (BMI) between 25 and 30kg/m2, and obesity is defined as having a BMI of 30kg/m2 (morbidly obese as 40kg/m2 or more).
Levels of overweight and obesity are high, and have increased in the last two decades.
The Hull Picture
Prevalence of Excess Weight
Height and weight were asked within Hull’s Adult Health and Wellbeing Survey conducted during 2019. The measurements were adjusted slightly to account for the fact that people tend to overestimate their height and underestimate their weight. Body mass was then calculated and survey responders were divided into weight categories.
From the local Health and Wellbeing Survey 2019, 4.7% adults were underweight, 25.7% were a healthy weight, 38.6% overweight, 27.4% obese and a further 3.7% morbidly obese. This equates to around 9,750 adults aged 16+ years in Hull who are overweight, 53,600 who have a healthy weight, 80,650 who are overweight, 57,200 who are obese, and 7,650 who are morbidly obese. Thus it is estimated that around 145,500 adults in Hull are overweight or obese including 64,850 who are obese.
Overweight
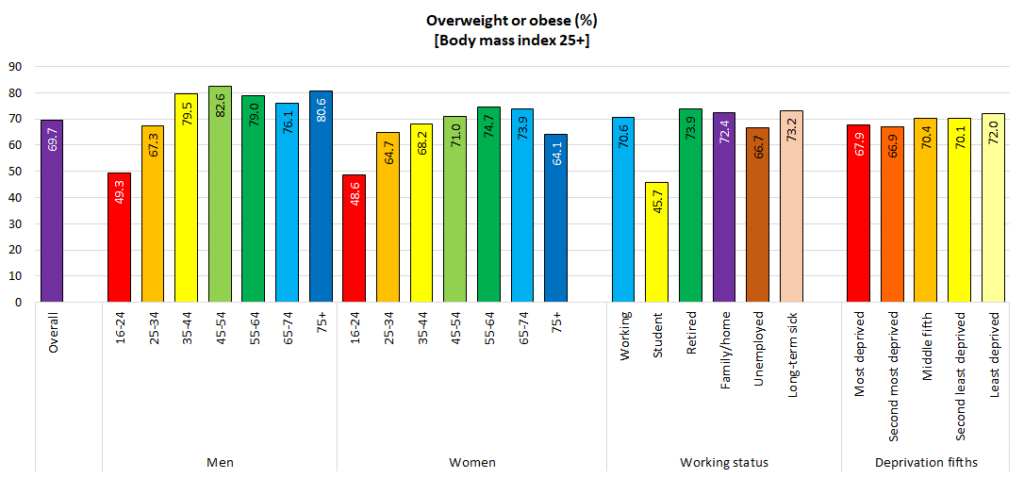
Seven in ten adults were classified as overweight or obese (with a body mass index (BMI) of 25 or more), with relatively small differences across the age groups except the youngest. The prevalence slightly lower among women (67.0%) compared to men (72.7%). There was a relatively small difference across the deprivation fifths, although the prevalence was slightly higher among people living in the least (72%) compared to most (68%) deprived fifth of areas of Hull.
From the Health Survey for England 2018, 1.7% were underweight, 35.1% a healthy weight, 34.3% overweight, 24.5% obese and 3.2% morbidly obese. Thus more people were underweight in Hull compared to the England average, which could be partly associated with the younger population in Hull, but there is a higher percentage of adults in Hull who are overweight and obese.
The Office for Health Improvement & Disparities’ Fingertips also present the prevalence of overweight and obesity among adults aged 18+ years. These national estimates of excess weight come from the Active Lives Survey undertaken by Sport England. This survey has around 500 survey responders in Hull each year, although this was higher at just under 900 survey responders for 2023/24. Due to the survey methodology it is possible that those that do take part are not representative of Hull’s general population. Hull’s Health and Wellbeing Survey conducted in 2019 had over 4,000 survey responders, and used quota sampling so that it is likely that the survey responders were much more representative of Hull’s population.
For 2023/24, the prevalence of excess weight in Hull (74.9%) was higher than the prevalence in England (64.5%). The difference was statistically significant. The percentage in Hull was the highest in the region for 2023/24.
Compared with benchmark
| Indicator | Period | England | Yorkshire and the Humber region (statistical) | Kingston upon Hull | East Riding of Yorkshire | North East Lincolnshire | North Lincolnshire | York | North Yorkshire UA | Barnsley | Doncaster | Rotherham | Sheffield | Bradford | Calderdale | Kirklees | Leeds | Wakefield |
|---|---|---|---|---|---|---|---|---|---|---|---|---|---|---|---|---|---|---|
Overweight (including obesity) prevalence in adults, (using adjusted self-reported height and weight) (Persons 18+ yrs) | 2023/24 | 64.5 | 67.2 | 74.9 | 69.2 | 71.6 | 69.4 | 60.1 | 61.5 | 72.8 | 73.8 | 74.0 | 61.3 | 69.7 | 71.0 | 67.7 | 63.9 | 69.8 |
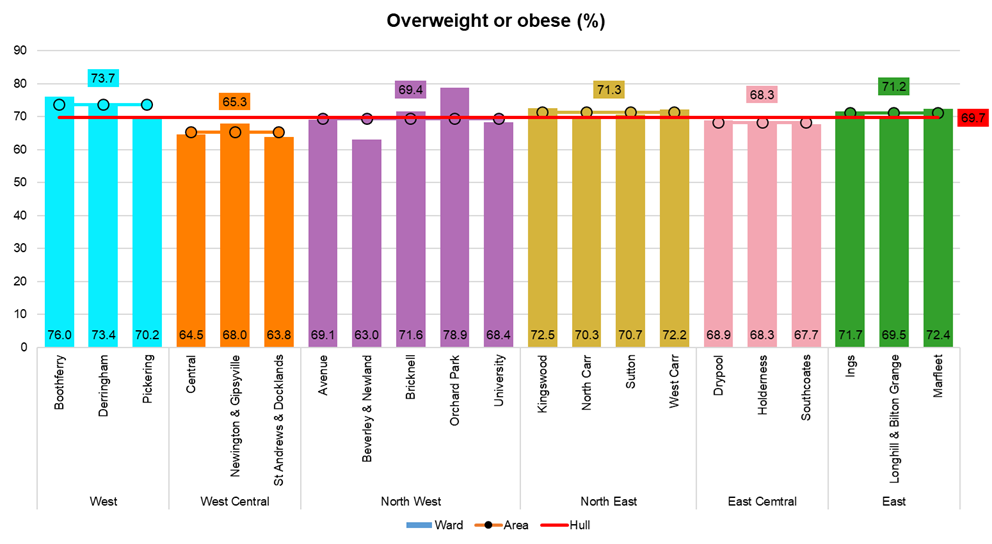
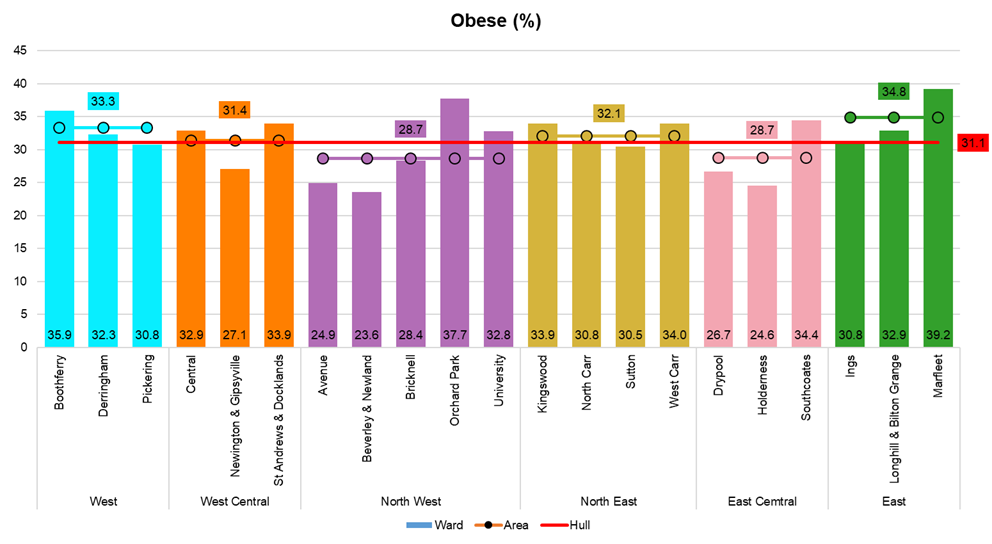
In the local survey, the highest prevalence of overweight and obesity occurred in Orchard Park (79%), Boothferry (76%) and Derringham (73%). The prevalence in each ward will depend on the age structure and deprivation levels of the wards. Beverley and Newland ward had the lowest percentage and has a relatively young population as a relatively large percentage of the residents are students.
Obese
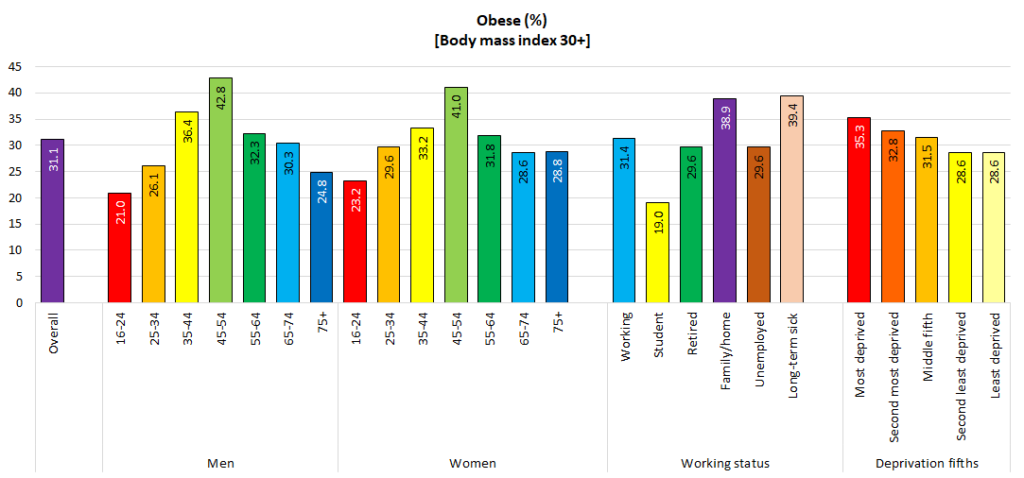
Almost one-third of people in the local survey were obese with the prevalence increasing with age to a peak among those aged 45-54 years before falling with age. In contrast to overweight, a higher percentage were obese in the most deprived areas of Hull compared to the least deprived areas. Almost four in ten people who were not working as they were looking after the home or family, or due to long-term illness or disability were classified as obese. Whilst men were more likely to have excessive weight (overweight and obesity combined), women were very slightly more likely to be obese (31.3% versus 30.8%).
Residents of Marfleet (39%), Orchard Park (38%) and Boothferry (36%) were the most likely to be classified as obese.
Morbidly Obese
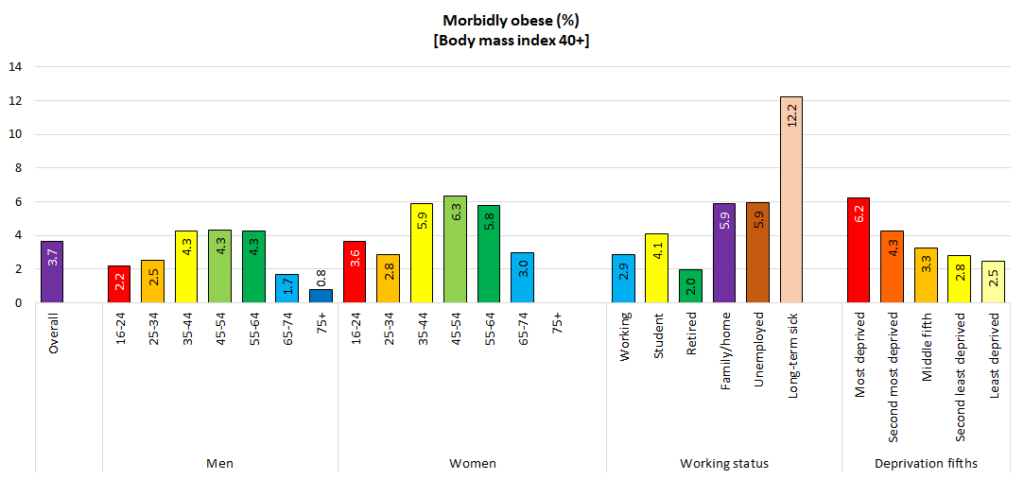
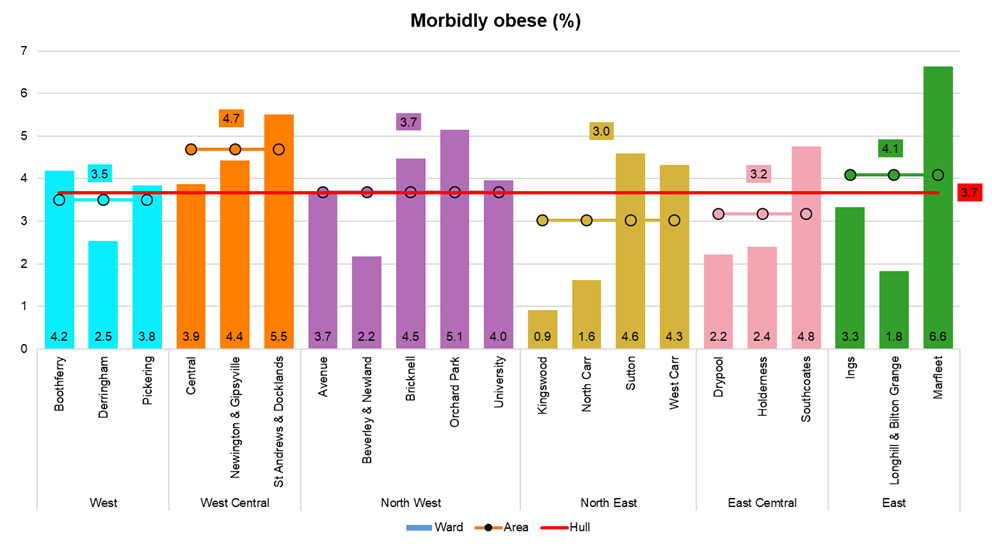
In the local Health and Wellbeing Survey 2019, the prevalence of morbidly obese was 3.7% overall, being higher among women compared to men, and highest among those aged 35-64 years. The prevalence was considerably higher among people living in the most deprived areas of Hull, and people who were not working due to long-term illness and disability. Again, whilst men were more likely to have excessive weight (overweight and obesity combined), women were very slightly more likely to be morbidly obese (4.2% versus 3.0%).
The prevalence of those classified as morbidly obese was highest in Marfleet (6.6%), St Andrew’s & Docklands (5.5%) and Orchard Park (5.1%).
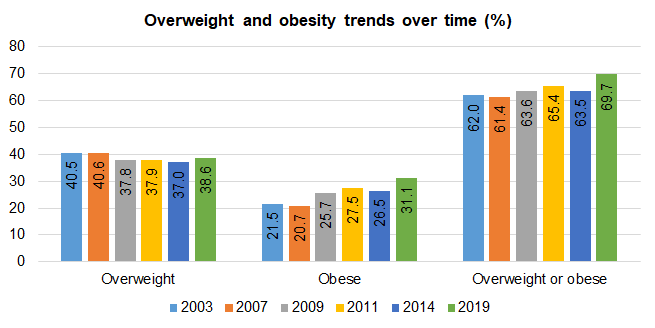
Trends Over Time
During the period 2003 to 2014 using information from different local surveys conducted over time, there was a shift from overweight to obese. The percentage in the overweight and obese combined category had increased slightly but the percentage in the overweight alone category had fallen, so the increase in prevalence had mainly come from an increase in the percentage who were obese. However, in the latest period from 2014 to 2019, there has been both an increase in the prevalence of overweight (increasing from 37% to 39%) and the prevalence of obesity (increasing from 26% to 31%), thus a considerable increase in the prevalence of overweight and obesity combined (increasing from 64% to 70%). So the greatest increases have occurred in the last five years.
The prevalence of overweight and obesity among adults in Hull has been around 71-72% between 2016/17 and 2022/23 (although 2019/20 slightly lower at 64%). However, the percentage has increased relatively sharply for 2023/24 with almost three-quarters (74.9%) of adults classified as overweight or obese.
As mentioned above, due to the way the Active Lives Survey is conducted and the small number of Hull people who participate in this survey, the survey responders might not be representative of Hull’s overall population. This might explain why there is more variability in the prevalence of excess weight for Hull. However, for 2023/24, the sample size was higher with almost 900 survey responders compared to around 500 in previous years.
Over the period 2015/16 to 2022/23, the prevalence of excess weight among adults has increased across the region and increased every year in England.
Compared with benchmark
Overweight (including obesity) prevalence in adults, (using adjusted self-reported height and weight) (Persons 18+ yrs)
|
Period
|
Kingston upon Hull |
Yorkshire and the Humber region (statistical)
|
England
|
||||
|---|---|---|---|---|---|---|---|
|
Count
|
Value
|
95%
Lower CI |
95%
Upper CI |
||||
| 2015/16 | • | - | 66.5% | 62.0% | 70.7% | 64.3% | 61.2% |
| 2016/17 | • | - | 70.4% | 66.1% | 74.8% | 65.6% | 61.3% |
| 2017/18 | • | - | 72.3% | 68.0% | 76.5% | 64.2% | 61.9% |
| 2018/19 | • | - | 71.5% | 66.9% | 75.7% | 65.0% | 62.0% |
| 2019/20 | • | - | 64.1% | 59.5% | 68.7% | 64.8% | 62.6% |
| 2020/21 | • | - | 70.7% | 66.2% | 75.1% | 66.3% | 63.3% |
| 2021/22 | • | - | 71.7% | 67.4% | 75.9% | 66.5% | 63.8% |
| 2022/23 | • | - | 70.5% | 66.1% | 75.1% | 66.6% | 64.0% |
| 2023/24 | • | - | 74.9% | 71.7% | 78.2% | 67.2% | 64.5% |
Source: OHID, based on Sport England data
Perceptions of Obesity
Local qualitative work revealed a difference between clinical definitions and perceptions of obesity: “You don’t see loads of fat people wandering around”.
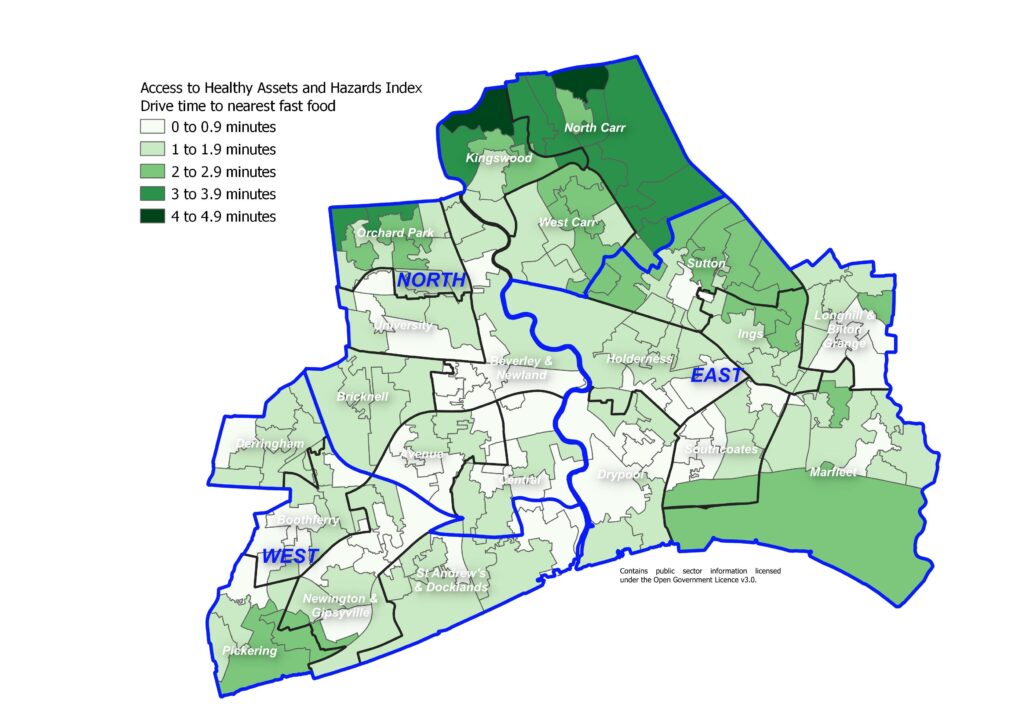
Access to Healthy Assets and Hazards Index
The Access to Healthy Assets and Hazards (AHAH) index is designed to allow policy and decision makers to understand which areas have poor environments for health, and to help move away from treating features of the environment in isolation.
The Access to Healthy Assets and Hazards index is comprised of four domains: access to retail services (fast food outlets, gambling outlets, pubs/bars/nightclubs, off licences, tobacconists), access to health services (GP surgeries, A&E hospitals, pharmacies, dentists and leisure centres), the physical environment (green and blue spaces) and levels of air pollution (nitrogen dioxide (NO2), particulate matter smaller than 10 microns (PM10) and sulphur dioxide (SO2)).
In 2024, the Access to Healthy Assets and Hazards Index is very high in Hull with 44.7% of Hull’s population residing in the bottom fifth of areas nationally in relation to the Access to Healthy Assets and Hazards Index. The percentage nationally is 20.9% and across the other 14 lower tier local authorities in the region the range is from 1.3% to 32.6%.
Compared with benchmark
| Indicator | Period | England | Yorkshire and the Humber region (statistical) | Kingston upon Hull | East Riding of Yorkshire | North East Lincolnshire | North Lincolnshire | York | North Yorkshire UA | Barnsley | Doncaster | Rotherham | Sheffield | Bradford | Calderdale | Kirklees | Leeds | Wakefield |
|---|---|---|---|---|---|---|---|---|---|---|---|---|---|---|---|---|---|---|
Access to Healthy Assets & Hazards Index (Persons All ages) | 2024 | 20.9 | 18.2 | 44.7 | 9.4 | 23.6 | 10.7 | 1.3 | 13.4 | 10.2 | 6.2 | 9.7 | 13.7 | 32.6 | 5.1 | 13.1 | 30.3 | 18.8 |
Despite the very high levels in Hull, the index has decreased considerably since 2016 when nine in ten residents lived in the worst fifth of areas of England in relation to the index, although there was a large decrease between 2016 and 2017 to 46% with only relatively minor changes to 2022 and 2023.
In 2024, it is estimated that 120,220 residents in Hull live within areas defined as the bottom fifth of areas nationally based on the Access to Healthy Assets and Hazards Index.
Compared with benchmark
Access to Healthy Assets & Hazards Index (Persons All ages)
|
Period
|
Kingston upon Hull |
Yorkshire and the Humber region (statistical)
|
England
|
||||
|---|---|---|---|---|---|---|---|
|
Count
|
Value
|
95%
Lower CI |
95%
Upper CI |
||||
| 2016 | • | 233157 | 90.0% | - | - | 22.2% | 21.2% |
| 2017 | • | 120814 | 46.3% | - | - | 14.1% | 21.1% |
| 2022 | • | 114694 | 44.3% | - | - | 19.9% | 22.6% |
| 2024 | • | 120220 | 44.7% | - | - | 18.2% | 20.9% |
Source: Consumer Data Research Centre
Information relating to version 4 of the Access to Healthy Assets and Hazards index is available at lower layer super output area geographical level. There are 33,755 lower layer super output areas in England, and the percentile score has been calculated for each of the 168 lower layer super output areas in Hull. The index was updated in July 2024, and information on the individual components is available which includes drive times to the nearest fast food outlet and drive times to the nearest leisure centre.
Information on the other indicators is available under Geographical Area under Place.
Density and Drive Times to Nearest Fast Food Outlet
Within local qualitative projects, participants always mentioned the excessive a number of takeaways in their local area. “I was terrible for it, takeaways everywhere. Temptation. I mean, I live across the road from a takeaway and it’s lovely and I wish it wasn’t there. I’m glad it’s there, but I wish it wasn’t there. It’s a kebab, pizza, Turkish takeaway. And within ten minutes’ walk, there’s four of that type, a couple of chicken places, two Chinese, an Indian, three chip shops, these are all in less than ten minute walk and I live in a council estate near the University”.
In 2014, Hull had a very high number of fast food outlets per 100,000 population and the highest in the Yorkshire and Humber region as measured from one of the indicators on the Office for Health Improvement Disparities’ Fingertips. However, the indicator had not been updated for a decade and has now been removed from Fingertips. There is a planning restriction to restrict new hot food takeaway applications from opening up with 400 metres of a secondary school or playing field in Hull over the last few years and this has reduced the number of hot foot takeaways by at least 40 over the last few years.
The Access to Healthy Assets and Hazards index has been updated in 2024 and this includes more up-to-date information on fast food outlets based on the drive time to the nearest fast food outlet.
The drive times to the nearest fast food outlet are low in Hull. Whilst not everyone in a city will have access to a car or van (35% of households in Hull compared to 23% of households in England), the map does illustrate the density of fast food outlets in Hull, and many people will likely be a relatively short walk away from the nearest outlet or be able to have fast food delivered directly to their home.
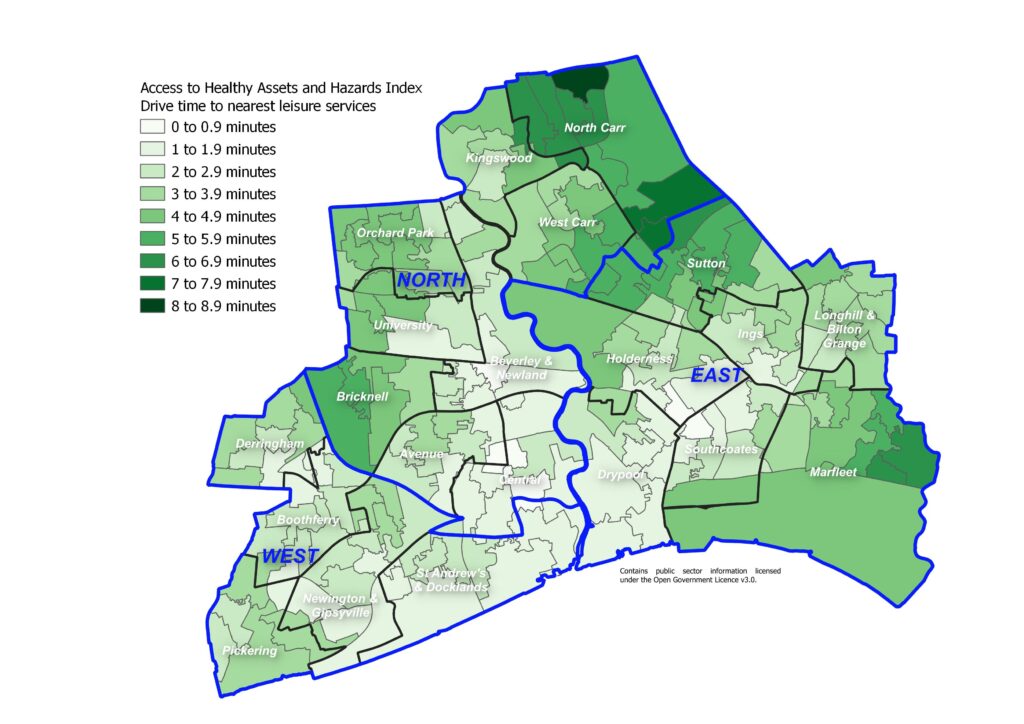
Drive Times to Nearest Leisure Centre
The majority of residents living around the city centre, to the south west of the city, and around the University are only a few minutes drive from the nearest leisure centre. Residents living on the north, north west and east boundaries of Hull have a slightly longer drive time, although all residents are within a nine minute drive of the nearest leisure centre.
Projection of People with Obesity
The Projecting Older People Population Information (POPPI) provided current estimates and future projections at local authority level of the number of people aged 65+ years with different health needs. The prevalence for different age groups and for males and females estimated from different surveys and research has been applied to current population estimates and population projections to provide estimates for each local authority.
Rates of obesity from the Health Survey for England 2018 are 31.6% for men and 32.8% for women aged 65-74 years (including 1.2% of men and 5.3% of women morbidly obese), and 28.4% of men and 27.8% of women aged 75+ years (including 0.7% of men and 2.7% of women morbidly obese).
The obesity prevalence estimates from Hull’s adult Health and Wellbeing Survey 2019 were 30.3% for men and 28.6% for women aged 65-74 years and 24.8% for men and 28.8% for women aged 75+ years. Using 2020 population estimates for Hull, this would give an estimated 11,226 people who are aged 65+ years who are obese, slightly lower than those estimated by POPPI.
Applying these estimates to Hull’s population estimates, it is estimated that there are more than 13,500 people in Hull aged 65+ years who are obese, and with the ageing population this will increase to over 15,700 by 2045. This assumes that the prevalence of obesity among these age and gender groups remains the same over time, but if the prevalence increases, then clearly the estimated number of people who are obese in Hull will increase even further.
| Gender/age | 2025 | 2030 | 2035 | 2040 | 2045 |
| Males aged 65-69 | 2,388 | 2,605 | 2,533 | 2,316 | 2,171 |
| Males aged 70-74 | 1,918 | 2,062 | 2,279 | 2,243 | 2,062 |
| Males aged 75+ | 2,245 | 2,509 | 2,747 | 3,064 | 3,275 |
| Males aged 65+ | 6,550 | 7,176 | 7,559 | 7,622 | 7,508 |
| Females aged 65-69 | 2,253 | 2,522 | 2,388 | 2,253 | 2,051 |
| Females aged 70-74 | 1,850 | 2,051 | 2,320 | 2,186 | 2,051 |
| Females aged 75+ | 2,895 | 3,108 | 3,426 | 3,878 | 4,117 |
| Females aged 65+ | 6,998 | 7,681 | 8,134 | 8,317 | 8,220 |
| All persons aged 65+ | 13,548 | 14,857 | 15,693 | 15,939 | 15,728 |
Strategic Need and Service Provision
Obesity is a complex problem with many drivers including behaviour, the environment, genetics, and culture. It is necessary to provide a healthy food and drink environment, and to increase physical activity and decrease sedentary behaviour.
Hull has developed a whole-system approach to promoting a healthy weight which considers the multi-factorial drivers of overweight and obesity and involves transformative co-ordinated action across a broad range of disciplines and stakeholders. This views actions and behaviours of individuals in the context of the continuum of their lives from pre-natal through to older ages, and the transition through various life stages and transition points. Also there is action to tackle the ‘obesogenic’ environment, and ensuring opens spaces and places to be active are accessible. Long term sustainable change will only be achieved through the active engagement of schools, communities, families and individuals.
Hull is recognised nationally as a bronze Sustainable Food City and is led locally by Hull Food Partnership.
Resources
Local Health and Wellbeing Surveys
NHS Digital. Health Survey for England: https://digital.nhs.uk/data-and-information/publications/statistical/health-survey-for-england
The Office for Health Improvement & Disparities’ Fingertips: https://fingertips.phe.org.uk/
Projecting Older People Population Information (POPPI). www.poppi.org.uk
Rayer M and Scarborough P. The burden of food related ill health in the UK. J Epidemiol Community Health, 2005;59:1054-1057.
Scarborough P, Bhatnagar P, Wickramasinghe KK, Allender S, Foster C and Rayner M. The economic burden of ill health due to diet, physical activity, smoking, alcohol and obesity in the UK: an update to 2006-07 NHS costs. Journal of Public Health, 2011;33(4):527-535.
Dimbleby H. National Food Strategy: An Independent Review for Government, 2019. https://www.nationalfoodstrategy.org/the-report/
Healthy Hull. Adult Tier 2 Weight Management Service. https://www.healthyhull.org.uk/
Updates
This page was last updated / checked on 23 February 2026.
This page is due to be updated / checked in October 2026.