Index
This topic area covers statistics and information relating to physical health status among adults in Hull including local strategic need and service provision. Further information relating to Physical Health Among Children and Young People is given under Lifestyle Factors within Children and Young People. A general measure of the health of the population is life expectancy at birth and this is covered under Life Expectancy and Healthy Life Expectancy within Population. General health information has been collected within Hull’s Health and Wellbeing Surveys and full reports are available under Surveys within Tools and Resources. Further information relating to Mental Health and Emotional Wellbeing can be found under Health Factors within Adults and Children and Young People.
The health of specific groups of individuals (carers, children in care, Gypsy and Travellers, people who are homeless, people with learning disabilities, people with sensory impairment, people with severe mental ill health and veterans) is also covered – where information is available – within Vulnerable Groups. However, information on general health among minority ethnic groups is included on this page (the population estimates by minority ethnic group are given within Race and Ethnicity under Population).
This page contains information from the Office for Health Improvement & Disparities’ Fingertips. Information is taken ‘live’ from the site so uses the latest available data from Fingertips and displays it on this page. As a result, some comments on this page may relate to an earlier period of time until this page is next updated (see review dates at the end of this page).
Headlines
- Better health is central to happiness and well-being. It also makes an important contribution to economic progress, as healthy populations live longer, are more productive, and save more. Poverty and deprivation as well as many other factors have an adverse impact on health.
- There are huge inequalities in Hull in relation to physical health which impacts hugely on all aspects of life and wellbeing.
- The latest Census data shows that over the past ten years people’s perceptions of their general health have stayed the same in Hull, whilst in the Yorkshire and Humber region and in England as a whole levels are higher and getter even higher over time.
- The 2021 Census identified that fewer people in Hull record that their day-to-day activities were limited a lot than compared to a similar question in the 2011 Census, although levels remain higher than those in the Yorkshire and The Humber region and England as a whole.
- In the Hull Heath and Wellbeing Survey involving over 4,000 adults (16+ years) in Hull, 35.7% reported their health as excellent or very good and 30.2% as fair or poor. This equates to around 74,600 adults in Hull having excellent or very good health, and around 63,200 adults having fair or poor health.
- From the 2021 Census, white British and Irish people living in Hull tended to have worse health but they were also older so it is likely that age is a partial or main reason. However, Gypsy and Travellers, Arabs, people from mixed and multiple white and black Caribbean backgrounds, and people from mixed and multiple other backgrounds also had poorer health, but their age profile did not really explain their poorer health.
- The Health Index for Hull for 2018 is 91.0 which is the second highest after Blackpool (86.4) with Wokingham having the best value for the Health Index (110.1). Hull has a score of 95.3 for Healthy Places, 89.2 for Healthy Lives and 88.6 for Healthy People.
- By far the majority of people remain independent, but it is estimated that there are around 8,700 adults in Hull aged 18-64 years with mobility impairment and a further 7,500 adults aged 65+ years unable to manage at least one mobility activity on their own. It is estimated that around 6,200 people aged 18-64 years in Hull have physical disabilities that require moderate levels of personal care and another 1,400 people aged 18-64 years who require severe levels of personal care. Among those aged 65+ years, it is estimated that there are around 11,000 people who need help to complete at least one domestic task and 11,000 who need help to complete at least one self-care task (some of these people will be the same people).
- Among those aged 65+ years, the numbers unable to complete mobility, domestic and self-care tasks, and the numbers with visual or hearing impairment are anticipated to increase due to the ageing population.
The Population Affected – Why Is It Important?
Better health is central to happiness and well-being, and contributes to economic progress, as healthy populations live longer, are more productive, and save more.
Health and physical abilities generally deteriorate with age, and this creates a challenge for society to identify opportunities and approaches to allow older adults to fully and safely participate in life.
Poverty and deprivation and many associated factors such as poor housing, crime, lack of qualifications and unemployment also indirectly influence health.
The number of people living with long-term illness is higher in poorer areas; perversely these individuals are often less able to access or make use of health or other services for a number of reasons including health literacy levels and the design and implementation of these services. The circumstances people live in can make it harder to live healthily, and psychosocial stress leads to physical harm.
Many people with disabilities or very poor health do not have the same educational, training and employment opportunities, and as a result are more likely to live in relative poverty which further impacts on physical health and emotional wellbeing, creating a vicious circle of cause and consequence.
The Hull Picture
General Physical Health
The most recent Census was carried out on 21 March 2021. A person’s assessment of the general state of their health on the day of the Census from very good to very bad was recorded. This assessment is not based on a person’s health over any specified period of time. This question, with similar description, was used for the first time in the 2011 Census allowing us to make comparisons with the data collected then.
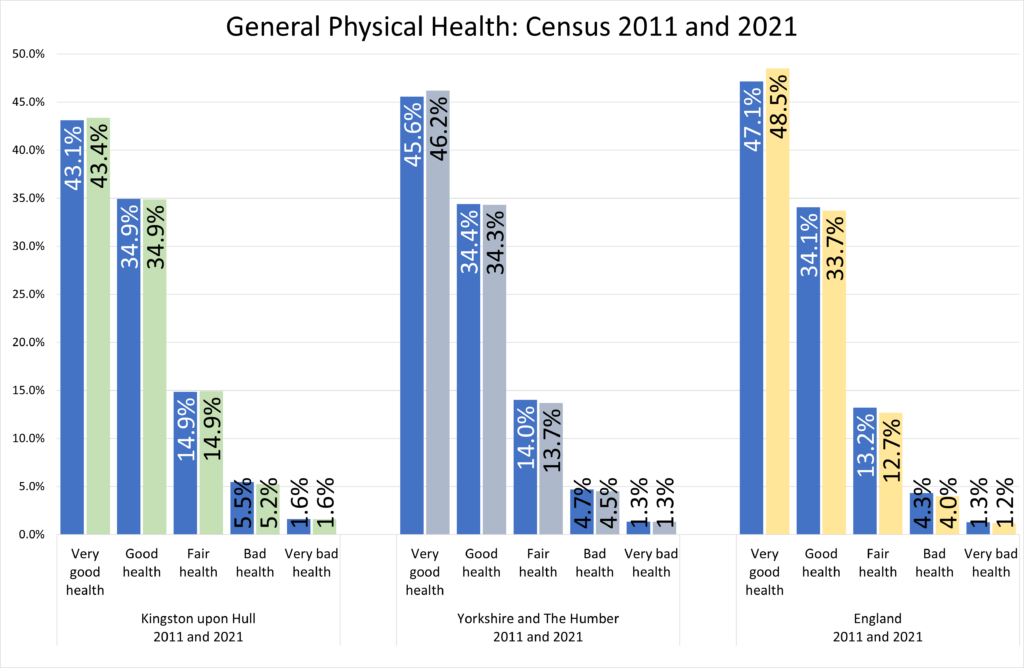
Little has changed in the percentage of responses for each individual category for the people of Hull and the picture is almost identical to that seen in 2011. 43.1% of people in Hull said that they were in very good health, whilst this changed to 43.4% in the 2021 Census. The percentages of people in Hull who said that they were in good health, fair health, bad health or very bad health remained almost the same for both the 2011 and 2021 Censuses.
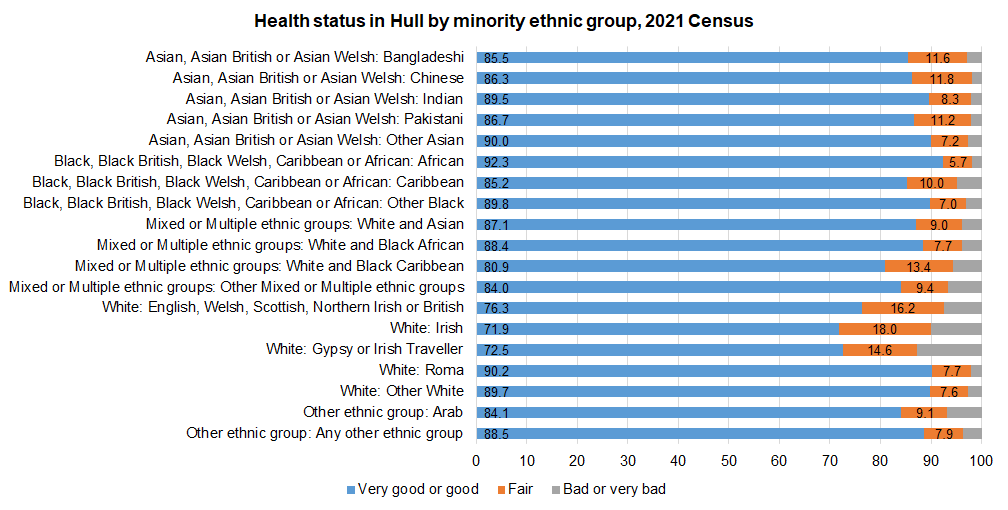
From the 2021 Census, the health status differs by minority ethnic group in Hull.
In Hull, the people who had the lowest percentages in very good or good health were Irish (71.9%), Gypsy or Irish Travellers (72.5%), white British (76.3%), people from mixed and multiple white and black Caribbean backgrounds (80.9%), people from mixed and multiple other ethnic backgrounds (84.0%) and Arabs (84.1%).
These five ethnic groups also had the highest percentages in poor or very poor health with 12.9% of Gypsy or Irish Travellers having poor or very poor health, 10.1% of Irish, 7.5% of white British, 6.8% of Arabs, 6.6% of people from mixed and multiple other ethnic backgrounds, and 5.7% of people from mixed and multiple white and black Caribbean backgrounds.
However, it should be noted that the age profile of the people in Hull from minority ethnic groups differed substantially in relation to white British so age will be a confounding factor (see Confounding in Glossary for more information). Health generally deteriorates with age, and the majority of people from minority ethnic groups are much younger than the white British population in Hull. Therefore, it would be expected that – on the whole – people from minority ethnic groups in Hull should have better health as they are generally younger.
Examining the age distribution of the different minority ethnic groups in Hull, it becomes apparent that the Irish people were considerably older than all other ethnic groups in Hull. Therefore, it is not surprising that their health is amongst the worst. Only 28% of them were aged under 35 years (compared to the majority for most other groups with the exception of white British (45%), Caribbeans (46%), and Gypsy and Travellers (48%)). Just under one-third (31%) of the Irish were aged 65+ years. This compares to 18% for white British, 8.7% for Chinese, 7.6% for people from mixed and multiple white and black Caribbean backgrounds, 5.2% for Caribbeans, 5.1% for Gypsy and Irish Travellers, and less than 5% for all other ethnic groups.
Six in ten (60.2%) of people in Hull who were not white British nor Irish were aged under 35 years, and 2.9% were aged 65+ years.
Whilst a relatively low percentage of Gypsy and Travellers were aged 65+ years (5.1%), they also had a relatively low percentage aged under 35 years (48%) so this is a potential reasons why their health is worse. However, from national evidence and local surveys conducted in Hull, it is well-known that the health of Gypsy and Travellers tends to be poorer than other people of the same age (see Gypsy and Travellers under Vulnerable Groups for more information).
White British also tend to have worse health, but fewer are aged under 35 years and more are aged 65+ years relative to most other ethnic groups, so their poorer health is likely due to their increased age.
People from mixed and multiple white and black Caribbean backgrounds, mixed and multiple other ethnic backgrounds and Arabs also have the worse health. However, their age distribution does not really ‘explain’ these higher rates of poor health, although people from mixed and multiple white and black Caribbean backgrounds are slightly older with 7.6% aged 65+ years (which is relatively high), but around two-thirds (66%) of them are aged under 35 years. Around tw0-thirds (65%) of Arabs are also aged under 35 years with only 3.1% aged 65+ years. People from mixed and multiple other ethnic backgrounds also have a similar age distribution to the Arabs with 67% aged under 35 years and 4.3% aged 65+ years. Therefore, it would appear that the age profile of people who are Irish and white British is at least a partial explanation of their poorer health, but is less the case for Gypsy and Travellers, Arabs, people from mixed and multiple white and black Caribbean backgrounds, and people from mixed and multiple other backgrounds.
The percentage of Hull people who described themselves as being in very good health is lower than that seen in the Yorkshire and the Humber region and in England as a whole – and at the same time the percentage of people who described their health in that way in the region and in England as a whole increased between the 2011 and 2021 Censuses (45.6% to 46.2% in Yorkshire and the Humber, and 47.1% to 48.5% in England).
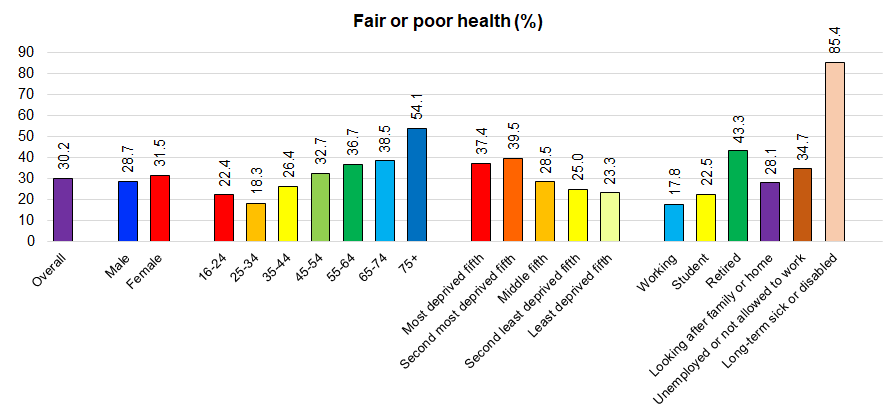
The Hull Heath and Wellbeing Survey was undertaken in 2019 and is a representative sample of over 4,000 adults aged 16 years and over in the city. The results are displayed in the figures below, which are grouped by those who reported their health as excellent or very good, and their health as fair or poor. The figure below for those reporting excellent or very good health demonstrates a socioeconomic gradient with a substantially smaller percentage of those in the most deprived fifth of areas of Hull reporting excellent of very good health than those in the least deprived fifth. Using these results from the survey, we can estimate that across the city, there are around 74,600 adults aged 16+ years are in excellent or very good health, 71,100 in good health, and 63,200 in fair or poor health. Whilst information was collected on survey responders on ethnicity, the numbers are too small and the data is not sufficiently robust to present (see Small Numbers for more information on the statistical problems associated with small numbers).
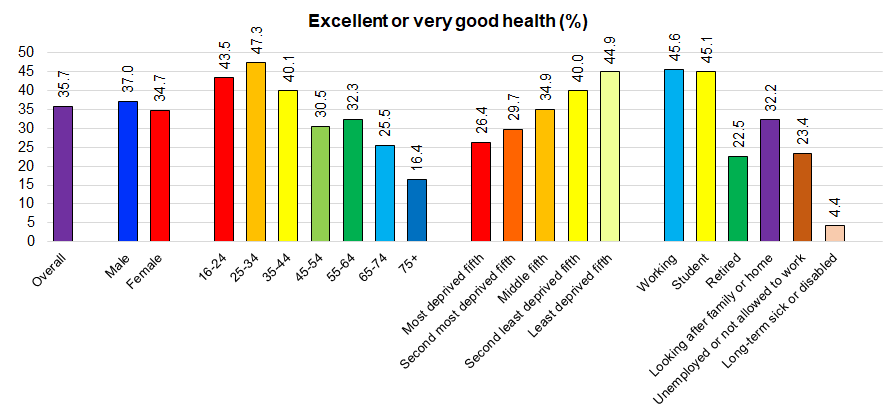
Around two in ten reported fair or poor health of those aged 16-34 years, but this was five in ten among those aged 75+ years. Among those who were not working due to long-term illness and disability, 85% reported fair or poor health.
The age structure, employment status (especially with regard to students) and deprivation levels of each ward differ, so it is not surprising that there were differences in self-reported health status across Hull’s 21 wards. Kingswood was the only ward where the majority reported excellent or very good health; this ward has the youngest average age of residents and is also the least deprived ward in Hull. St Andrew’s & Docklands, Orchard Park, Central and Marfleet are the most deprived four wards in Hull and they had among the highest percentages reporting fair or poor health. Kingswood, University, North Carr and Orchard Park had the youngest average age of their residents. Beverley & Newland and University wards had the highest percentages of students among those taking part in the local survey.
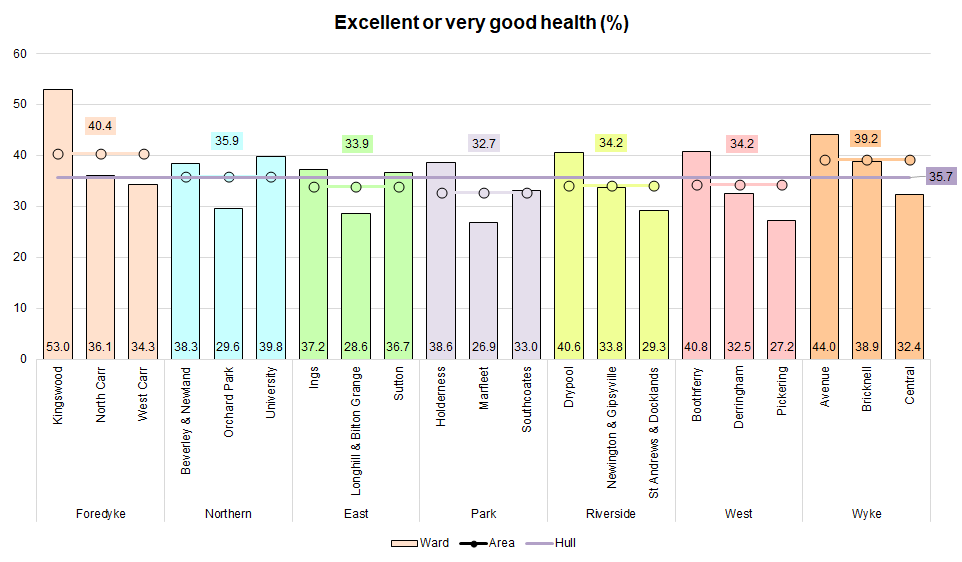
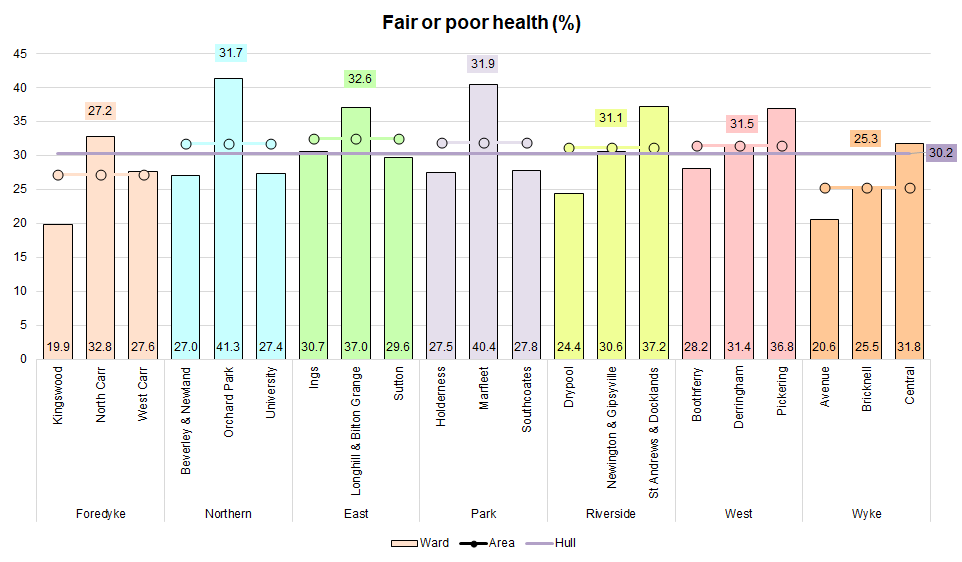
In general self-reported health has deteriorated over time in Hull. In the 2003 Health and Wellbeing Survey, 37.2% reported excellent or very good health and 27.3% reported fair or poor health. In subsequent surveys which are more representative of Hull’s overall population, 43.3% reported excellent or very good health and 21.2% reported fair or poor health in 2007, but percentages reporting excellent or very good health has gradually reduced over time in the 2009, 2011, 2014 and 2019 surveys to its current level of 35.9% whereas the percentages reporting fair or poor health has increased to its current level of 30.2%. The percentages reporting poor health has been more variable over time due to the smaller numbers, but it is the highest at 9.5% compared to all previous surveys.
Long Term Illness or Disability that Limits Daily Activities
Broadly similar questions were asked during the 2011 and 2021 censuses regarding disability and whether day-to-day activities were limited to some degree. 10.0% of the Hull population said that their day-to-day activities were limited a lot in the 2011 Census, whilst this decreased to 9.2% in the 2021 Census. Although a decrease, Hull’s rates of people whose day-to-day activities are limited a lot are consistently higher than those seen in the Yorkshire and The Humber region and England as a whole in both censuses.
The rate of Hull people whose day-to-day activities are limited a little increased between 2011 and 2021, but they are much closer to levels seen in the Yorkshire and The Humber region and England as a whole. 9.6% of people in Hull said that their day-to-day activities are limited a little in the 2011 Census, which increased to 10.8% in the 2021 Census. Rates in the Yorkshire and The Humber region and England as a whole increased by a similar amount to similar levels.
| Census | Level of disability | Hull (%) | Yorkshire and The Humber (%) | England (%) |
| 2011 Census | Day-to-day activities limited a lot | 10.0 | 9.1 | 8.3 |
| 2011 Census | Day-to-day activities limited a little | 9.6 | 9.8 | 9.3 |
| 2011 Census | Day-to-day activities not limited | 80.3 | 81.2 | 82.4 |
| 2021 Census | Disabled under the Equality Act: Day-to-day activities limited a lot | 9.2 | 8.1 | 7.3 |
| 2021 Census | Disabled under the Equality Act: Day-to-day activities limited a little | 10.8 | 10.5 | 10.0 |
| 2021 Census | Not disabled under the Equality Act: Has long term physical or mental health condition but day-to-day activities are not limited | 5.7 | 6.9 | 6.8 |
| 2021 Census | Not disabled under the Equality Act: No long term physical or mental health conditions | 74.3 | 74.4 | 75.9 |
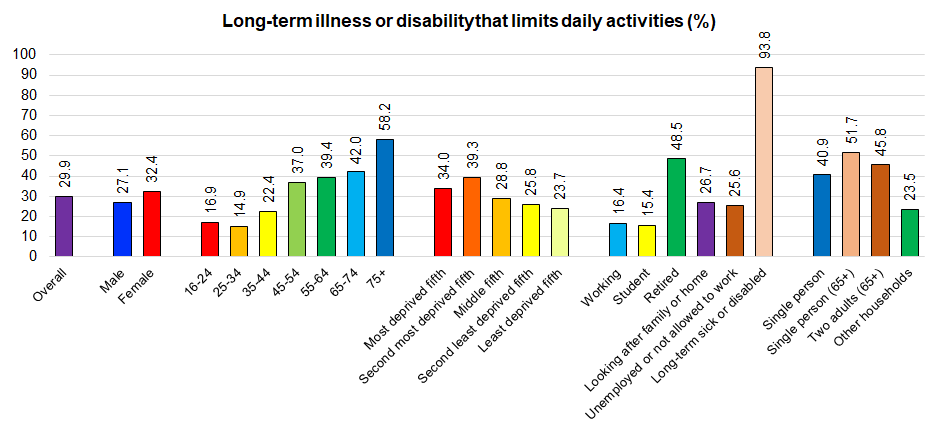
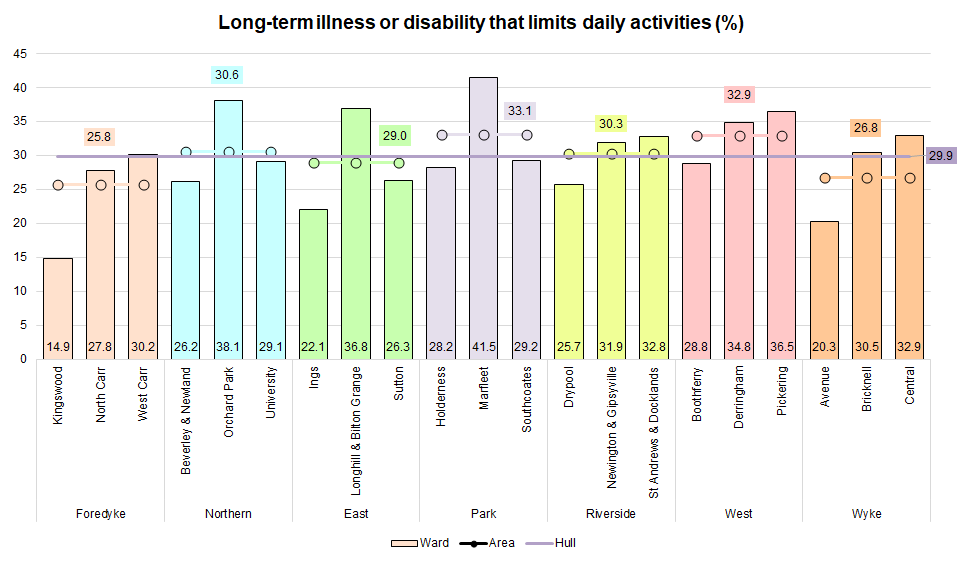
From the local survey, around three in ten people reported a long-term illness or disability that had lasted longer than a month and that limited their daily activities. This increased with age from around 15% among those aged 16-34 years to 58% of those aged 75+ years. The prevalence was also higher among people living in the most deprived areas of Hull. Overall, this equates to around 62,350 adults in Hull with a long-term illness or disability that limited their daily activities.
The most deprived wards (St Andrew’s & Docklands, Orchard Park, Marfleet and Central) had the the highest percentage with limiting long-term illness. Whilst Orchard Park was the second most deprived ward, it also had the fourth youngest average age of residents, so it is perhaps surprising that the prevalence of limiting long-term illness was the second highest among Hull’s 21 wards. St Andrew’s & Docklands (13.4%), Orchard Park (11.9%), Marfleet (11.8%) and Longhill & Bilton Grange (10.4%) did have over one in ten of the survey responders reporting that they were not working due to long-term illness and disability which would clearly influences the responses to this question.
The percentage reporting a long-term illness or disability that limited their daily activities has increased over time from 18.5% in the 2004 survey increasing to 29.9% in the 2019 survey.
Health Index
The LCP Insight Clarity Advice and Office for National Statistics have assigned a score on the Health Index for each local authority in England (https://healthindex.lcp.uk.com/).
Health Index for Hull for 2018 is 91.0 which is the second worst (ranked 148 out of 149) after Blackpool (86.4) with Wokingham having the best value for the Health Index (110.1). Hull has a score of 95.3 for Healthy Places, 89.2 for Healthy Lives and 88.6 for Healthy People. There are further breakdowns for Healthy Places, Healthy Lives and Healthy People.
Hull ranks in the bottom 5% overall and for crime, Healthy Lives, risk factors for children, behavioural risk factors, children and young people’s education, difficulties in daily live and mortality. However, Hull tends to score better in terms of Healthy Places with Hull better than the England average for access to green space, access to housing, working conditions, and physical health conditions.
| Overall | Domain | Sub-domain | Score | Rank | Percentile |
| Health Index | 91.0 | 148 | 1 | ||
| Healthy Places | 95.3 | 101 | 32 | ||
| Healthy Places | Crime | 65.9 | 147 | 1 | |
| Healthy Places | Access to green space | 102.6 | 54 | 74 | |
| Healthy Places | Access to services | 111.0 | 27 | 82 | |
| Healthy Places | Access to housing | 101.1 | 63 | 58 | |
| Healthy Places | Local environment | 95.9 | 100 | 33 | |
| Healthy Lives | 89.2 | 147 | 1 | ||
| Healthy Lives | Risk factors for children | 83.6 | 143 | 4 | |
| Healthy Lives | Behavioural risk factors | 75.2 | 149 | 1 | |
| Healthy Lives | Children and young people’s education | 89.6 | 145 | 3 | |
| Healthy Lives | Physiological risk factors | 88.6 | 122 | 18 | |
| Healthy Lives | Working conditions | 97.7 | 87 | 62 | |
| Healthy Lives | Protective measures | 95.7 | 99 | 34 | |
| Healthy Lives | Unemployment | 94.9 | 134 | 10 | |
| Healthy People | 88.6 | 130 | 13 | ||
| Healthy People | Physical health conditions | 97.3 | 57 | 62 | |
| Healthy People | Personal well-being | 98.0 | 102 | 32 | |
| Healthy People | Difficulties in daily life | 80.7 | 148 | 1 | |
| Healthy People | Mental health | 86.5 | 119 | 20 | |
| Healthy People | Mortality | 79.6 | 146 | 2 |
Each of these sub-domains are further broken down and Hull scores particularly well in relation to other local authorities for private outdoor space, access to pharmacies and GPs, housing affordability and transport noise.
Life Expectancy and Healthy Life Expectancy
The Office for Health Improvement and Disparities’ Fingertips provides estimates of life expectancy and healthy life expectancy at birth and at age 65 years, and local estimates have also been produced for life expectancy at birth and at age 65 years.
Life expectancy at birth is not a expected duration of life but based on contemporary mortality rates and as a result is a useful measure of the overall health of a population in an area in relation to another area, as well as a useful measure of the changing health of the population over time. Life expectancy calculations can be undertaken for any age, and there are life expectancy estimates are produced for age 65 years. These estimates will better reflect duration of life as the future mortality rates over the next 15-20 years are more likely to be similar to current mortality rates.
Life expectancy does not take into account the quality of life, and as a result healthy life expectancy has been calculated. This represents the life expectancy in ‘good’ health and combined population estimates, current mortality rates as well as prevalence estimates for good health.
Life expectancy at birth and at age 65 years for Hull, and the differences between Hull’s wards and differences by deprivation have been examined under Life Expectancy and Healthy Life Expectancy within Population. Healthy life expectancy at birth and at age 65 years have also been presented for Hull.
There are large differences in life expectancy across Hull’s wards for both men and women, which are predominately associated with deprivation.
Causes of Death
Further information relating to Causes of Death can be found within Population, and information relating to Palliative Care and End of Life can be found within Health Factors under Adults. The Causes of Death page includes information on the impact of the COVID-19 pandemic on mortality rates.
Medical Conditions and Diseases
Information relating to specific medical conditions and diseases is given in within Health Factors within Adults. Depending on the condition and data available, information relating to prevalence, hospital admissions and mortality are given, and additionally incidence and survival for the case of cancer. The following medical conditions and diseases are covered in more detail on individual topic pages:
- Cancer
- Cardiovascular Disease
- Coronavirus (COVID-19)
- Dementia
- Diabetes
- Infectious Diseases
- Kidney Disease
- Musculoskeletal Disorders
- Osteoporosis (see Falls and Frailty)
- Respiratory Disease
- Sexually Transmitted Infections
- Suicide and Self-Harm
Physical Health Among Different Groups of Individuals
The Joint Strategic Needs Assessment includes information on specific Vulnerable Groups. Where information is available, statistics and information about their physical health is given on the individual topic pages, although for a number of cases there is a focus on the numbers within Hull’s population as often health data relating to these inclusive groups is not available:
- Carers
- Children in Care and Care Leavers
- Gender Identity and LGBTQ+
- Gypsy and Travellers
- Homelessness
- Learning Disabilities
- Mental Ill Health
- Multiple Unmet Needs
- Sensory Impairment
- Veterans
Current and Projected Numbers in Hull with Various Health Needs
The Projecting Adult Needs and Service Information (PANSI) and the Projecting Older People Population Information Service (POPPI) provide current estimates and future projections at local authority level of the number of people with different health needs.
They use estimates for the estimated prevalence from different surveys and research which have generally been derived at a national level (generally different prevalence estimates for different age groups for men and women separately). They then apply these prevalence figures to Hull’s population. For instance, if the prevalence among males in England in a specific age group is 5% and there are an estimated 500 men living in Hull in that age groups, they would estimate there were 25 men in that age group living in Hull with that condition. For many conditions, there is an increased prevalence in populations with higher levels of deprivation, and in most cases, deprivation is not taken into consideration. Thus in many cases, these estimates for Hull are likely to underestimate the numbers in Hull due to the high levels of deprivation in Hull.
Further definitions and information is available from www.pansi.org.uk and www.poppi.org.uk.
Long-Term Illness or Disability That Limits Daily Activities
It is currently estimated that around 8,500 residents in Hull aged 65+ years have a long-term illness or disability that limits their daily activities a little and a further 10,000 have a long-term illness of disability that limits their daily activities a lot; both are projected to increase in the future.
| Limit on activities | Age | 2025 | 2030 | 2035 | 2040 | 2045 |
| A little | 65-74 | 4,276 | 4,702 | 4,844 | 4,578 | 4,259 |
| A little | 75-84 | 3,127 | 3,472 | 3,645 | 4,119 | 4,291 |
| A little | 85+ | 1,099 | 1,143 | 1,457 | 1,592 | 1,816 |
| A little | Total 65+ | 8,502 | 9,318 | 9,946 | 10,289 | 10,366 |
| A lot | 65-74 | 4,294 | 4,721 | 4,864 | 4,597 | 4,276 |
| A lot | 75-84 | 3,757 | 4,172 | 4,397 | 4,949 | 5,157 |
| A lot | 85+ | 1,925 | 2,003 | 2,553 | 2,789 | 3,182 |
| A lot | Total 65+ | 9,976 | 10,897 | 11,796 | 12,335 | 12,614 |
Mobility Problems
It is estimated that just over 8,000 adults aged 18-64 years have mobility impairment in that they experience either moderate, severe or complete difficulty with mobility, and certain activities are limited in any way as a result, such as walking or climbing stairs.
| Age | 2025 | 2030 | 2035 | 2040 | 2045 |
| 18-24 | 271 | 297 | 296 | 278 | 257 |
| 25-34 | 414 | 377 | 383 | 401 | 397 |
| 35-44 | 1,935 | 2,045 | 2,000 | 1,895 | 1,925 |
| 45-54 | 1,565 | 1,580 | 1,745 | 1,860 | 1,830 |
| 55-64 | 4,552 | 4,256 | 3,920 | 3,976 | 4,396 |
| Total 18-64 | 8,707 | 8,555 | 8,344 | 8,410 | 8,805 |
It is further estimated that over 7,500 adults in Hull aged 65+ years are unable to manage at least one mobility activity on their own; this is projected to increase by 34% to over 10,000 people by 2045.
| Age | 2025 | 2030 | 2035 | 2040 | 2045 |
| 65-69 | 1,131 | 1,251 | 1,199 | 1,115 | 1,029 |
| 70-74 | 1,410 | 1,546 | 1,734 | 1,660 | 1,546 |
| 75-79 | 1,557 | 1,503 | 1,677 | 1,896 | 1,842 |
| 80-84 | 1,255 | 1,707 | 1,631 | 1,877 | 2,141 |
| 85+ | 2,180 | 2,250 | 2,860 | 3,130 | 3,520 |
| Total 65+ | 7,533 | 8,257 | 9,101 | 9,678 | 10,078 |
Personal Care and Ability to Perform Household Chores
Among those aged 18-64 years, it is estimated that more than 6,000 adults in Hull have physical disabilities requiring moderate personal care and a further 1,400 adults have severe personal care needs. It is anticipated the numbers will increase slightly in Hull over time among this 18-64 year age group.
| Severity | Age | 2025 | 2030 | 2035 | 2040 | 2045 |
| Moderate | 18-24 | 163 | 178 | 178 | 167 | 154 |
| Moderate | 25-34 | 580 | 528 | 536 | 561 | 556 |
| Moderate | 35-44 | 1,122 | 1,186 | 1,710 | 1,099 | 1,117 |
| Moderate | 45-54 | 1,534 | 1,548 | 1,710 | 1,823 | 1,793 |
| Moderate | 55-64 | 2,842 | 2,675 | 2,464 | 2,499 | 2,763 |
| Moderate | Total 18-64 | 6,241 | 6,116 | 6,048 | 6,149 | 6,383 |
| Severe | 18-24 | 108 | 119 | 118 | 111 | 103 |
| Severe | 25-34 | 166 | 151 | 153 | 160 | 159 |
| Severe | 35-44 | 232 | 245 | 240 | 227 | 231 |
| Severe | 45-54 | 344 | 348 | 384 | 409 | 403 |
| Severe | 55-64 | 549 | 517 | 476 | 483 | 534 |
| Severe | Total 18-64 | 1,400 | 1,379 | 1,372 | 1,391 | 1,429 |
Among those aged 65+ years, it is estimated that there are over 11,000 people who cannot perform at least one domestic task. More women are estimated to not be able to perform at least one domestic task and this is partly associated with the higher number of women in the older ages compared to men. The total numbers are projected to increase by 31% to almost 14,500 people by 2045.
| Gender | Age | 2025 | 2030 | 2035 | 2040 | 2045 |
| Male | 65-69 | 878 | 958 | 935 | 851 | 797 |
| Male | 70-74 | 901 | 969 | 1,071 | 1,054 | 969 |
| Male | 75-79 | 827 | 808 | 884 | 996 | 978 |
| Male | 80+ | 1,521 | 1,929 | 2,115 | 2,337 | 2,671 |
| Female | 65-69 | 1,360 | 1,523 | 1,441 | 1,360 | 1,238 |
| Female | 70-74 | 1,150 | 1,275 | 1,442 | 1,359 | 1,275 |
| Female | 75-79 | 1,343 | 1,288 | 1,452 | 1,644 | 1,589 |
| Female | 80+ | 3,048 | 3,556 | 3,861 | 4,369 | 4,928 |
| Persons | Total 65+ | 11,027 | 12,305 | 13,197 | 13,970 | 14,446 |
Similar numbers aged 65+ years are also unable to manage at least one self-care task These numbers are also projected to increase over time.
| Gender | Age | 2025 | 2030 | 2035 | 2040 | 2045 |
| Male | 65-69 | 1,096 | 1,195 | 1,162 | 1,062 | 996 |
| Male | 70-74 | 1,049 | 1,129 | 1,247 | 1,228 | 1,129 |
| Male | 75-79 | 1,113 | 1,088 | 1,189 | 1,341 | 1,316 |
| Male | 80+ | 1,533 | 1,945 | 2,132 | 2,356 | 2,693 |
| Female | 65-69 | 1,246 | 1,395 | 1,321 | 1,246 | 1,135 |
| Female | 70-74 | 1,232 | 1,366 | 1,546 | 1,456 | 1,366 |
| Female | 75-79 | 1,460 | 1,401 | 1,579 | 1,788 | 1,728 |
| Female | 80+ | 2,556 | 2,982 | 3,238 | 3,664 | 4,132 |
| Persons | Total 65+ | 11,286 | 12,501 | 13,414 | 14,141 | 14,495 |
Sensory Impairment
Information on visual and hearing impairment can be found under Sensory Impairment under Vulnerable Groups.
Incontinence
It is estimated that almost 1,400 people aged 65+ years suffer with urinary incontinence less than once a week and a further 7,000 at least once a week.
| Severity | Age | 2025 | 2030 | 2035 | 2040 | 2045 |
| <1 per week | 65-69 | 332 | 366 | 352 | 326 | 302 |
| <1 per week | 70-74 | 324 | 354 | 396 | 381 | 354 |
| <1 per week | 75-79 | 279 | 270 | 300 | 339 | 330 |
| <1 per week | 80-84 | 214 | 291 | 278 | 320 | 365 |
| <1 per week | 85+ | 219 | 233 | 299 | 325 | 368 |
| <1 per week | Total 65+ | 1,368 | 1,514 | 1,625 | 1,691 | 1,719 |
| 1+ per week | 65-69 | 1,730 | 1,914 | 1,834 | 1,706 | 1,574 |
| 1+ per week | 70-74 | 1,455 | 1,587 | 1,773 | 1,710 | 1,587 |
| 1+ per week | 75-79 | 1,625 | 1,573 | 1,747 | 1,974 | 1,922 |
| 1+ per week | 80-84 | 976 | 1,335 | 1,280 | 1,466 | 1,673 |
| 1+ per week | 85+ | 1,210 | 1,248 | 1,586 | 1,736 | 1,952 |
| 1+ per week | Total 65+ | 6,996 | 7,657 | 8,220 | 8,592 | 8,708 |
Medical Conditions and Diseases
If information is available on PANSI or POPPI for specific medical conditions and diseases, the information is presented on the individual topic page for that condition and can be found under Health Factors within Adults.
Strategic Need and Service Provision
There are well documented inequalities in relation to socioeconomic status, with those living in poorer communities living shorter lives than those in more affluent communities, and spending a greater proportion of their lives living in ill-health.
Services need to consider whether there are barriers to access services that are driving some of these inequalities in outcomes, and whether there are opportunities to explore and reduce perceived ill-health, or reported morbidity identified in the Hull Health and Wellbeing Survey.
The population projections identify a potential population with correctible visual impairment; NHS services should consider whether their planning and commissioning processes are inadvertently worsening inequalities in these populations as they represent individuals with a potential unmet need.
Resources
Local Health and Wellbeing Surveys.
The Office for Health Improvement & Disparities’ Fingertips: https://fingertips.phe.org.uk/
Projecting Adult Needs and Service Information – PANSI. www.pansi.org.uk
Projecting Older People Population Information Service – POPPI. www.poppi.org.uk
World Health Organisation, Ageing and life course. World Health Organisation: Geneva. Accessed 2020.
World Health Organisation. Aging and Health. https://www.who.int/news-room/fact-sheets/detail/ageing-and-health
LCP Insight Clarity Advice and Office for National Statistics. Health Index. https://healthindex.lcp.uk.com/
Updates
This page was last updated / checked on 16 January 2026.
This page is due to be updated / checked in November 2026.