Index
This topic area covers statistics and information relating to COVID-19 in Hull including local strategic need and service provision. Further information relating to deaths from COVID-19 is given within Causes of Death under Population as the pattern and trends in different causes of death were affected with more people (often the frail and vulnerable) dying of COVID-19 rather than other diseases and conditions (such as dementia).
Headlines
- Since the beginning of the COVID-19 pandemic in the UK in March 2020, there has been a significant impact on the health, education, mental, social and financial wellbeing of the population. Some of the impacts are still being felt particularly in terms of financial insecurity and the impact on young people in terms of development, education and emotional wellbeing, although many other subsequent factors will also be having an influence.
- Waves of infection have been experienced throughout the pandemic with the infection rate in Hull often very high including being highest in the country. Areas with dense populations and/or areas with high levels of deprivation did tend to have higher infection rates, which will be associated with a number of factors including differences in the labour market and the ability to work from home. The true prevalence of COVID-19 in the community is now difficult to identify due to a reduced testing offer.
- For some people, the symptoms of COVID-19 infection can last longer than the original 10-days, with symptoms of “long COVID” having a profound impact on individual’s everyday life.
- The levels of admission to hospital due to COVID-19 was high during the pandemic with more than 250 patients in Hull University Teaching Hospitals NHS Trust in occupied beds at the peak periods.
- Over the five year period, there have been 902 deaths registered in Hull were COVID-19 was the underlying cause of death with the number of deaths reducing over time (389 deaths registered in 2020, 323 in 2021, 116 in 2022, 44 in 2023 and 30 in 2024). The directly standardised mortality rates were statistically significantly higher in Hull compared to England for 2020 and 2021 for both men and women, and higher for 2022 for men. More recently, the mortality rates have been higher in Hull but not significantly so. Mortality rates were much higher among men compared to women both in Hull and elsewhere. The mortality rate for deaths involving COVID-19 in Hull remain statistically significantly higher than England for 2022-24 though. This includes all deaths where COVID-19 is the underlying cause and deaths where COVID-19 is not the underlying cause of death but it is mentioned on the death certificate and may be a causal factor.
- The success of the COVID-19 vaccination programme reduced the need for population level non-pharmaceutical interventions however inequalities in the vaccine uptake mean that groups within the population are still high risk for adverse health outcomes as a result of COVID-19 infection. The routine vaccination of people based on age ended on 30 June 2023. Vaccinations the NHS offer are now more targeted to those at increased risk, usually during seasonal campaigns.
The Population Affected – Why Is It Important?
COVID-19 and our response to it affected the entire population. This page focusses primarily on the direct effects of infection with COVID-19, but the indirect effects of restrictions to prevent spread are also widespread across the population. The effects of COVID-19 have been unequal. Those already in poorer health were disproportionately affected, as were those from poorer communities. People aged under 65 in the poorest 10% of areas in England were almost four times as likely to die from COVID-19 than those in the most affluent 10% of areas (Health Foundation).
There are several risk factors for a fatal outcome associated with coronavirus including: chronic comorbidities, underlying respiratory conditions, older age population, diabetes, hypertension and obesity. The risk of death involving COVID-19 is also higher for disabled people according to statistical analysis by The Office for National Statistics. The rates of death involving COVID-19 of both disabled and non-disabled people significantly decreased between the second and third waves of the pandemic in England however in each wave, analyses identified mortality rates involving COVID-19 for more- and less-disabled people of both sexes remained higher compared with non-disabled people.
The Hull Picture
Pattern of Incidence
Community testing was stood down on 1st April 2022, so the daily confirmed COVID-19 cases after this time no longer accurately presents the number of cases within the community as testing only occurs in specific limited places like hospital and care homes. Up until 24th March 2023, the Office for National Statistics (ONS) provided population estimates on the current prevalence of COVID-19 within the community which estimated community prevalence is 2-3 times higher than the daily confirmed case count. Therefore, the incidence charts illustrated below are from March 2020 to July 2023 and show the historical incidence of the pandemic.
The first cases of COVID-19 were identified on 29 January 2020 in York, and were taken to the Castle Hill Hospital infectious diseases unit. Over the course of the pandemic in the UK, there has been four distinct waves of infection which have been influenced by the emergence of new variants (namely Delta and Omicron) and the easing of COVID-19 restrictions.
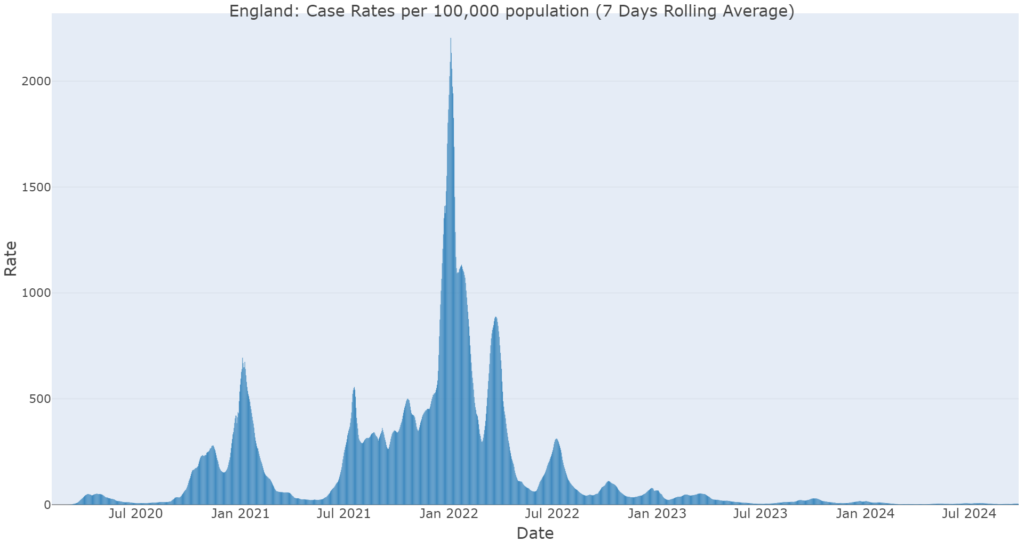
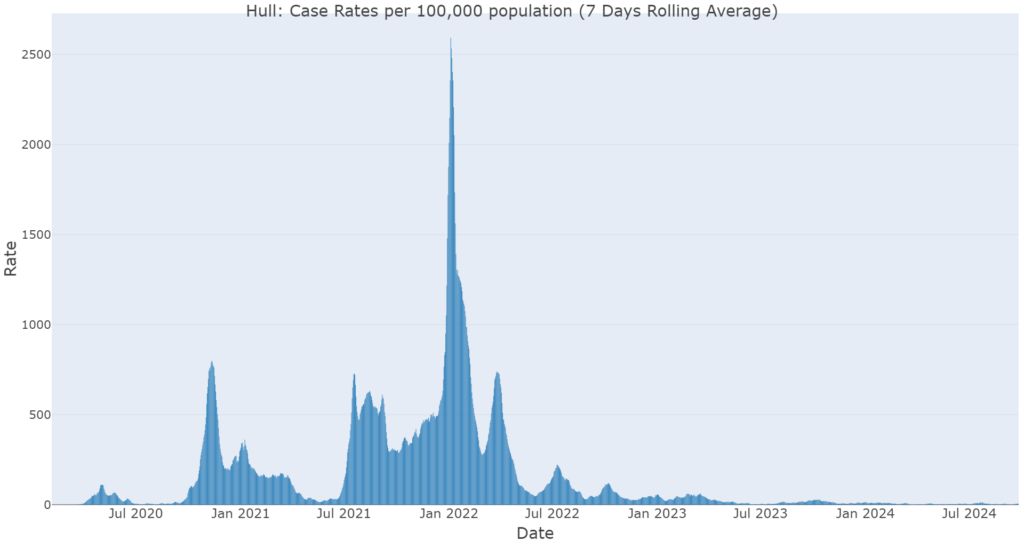
The pattern of infections for Hull has followed the national pattern of COVID-19 cases although Hull has experienced periods of high enduring transmission.
The non-pharmaceutical interventions (NPIs) including lockdown, social distancing and face coverings were introduced at various points of the UK Government’s response to try and reduce COVID-19 spread. A full timeline of the UK response has been produced by the Institute for Government.
COVID-19 Variants
All viruses, including SARS-CoV-2, the virus that causes COVID-19, change over time. Whilst most changes have little to no impact on the properties of the virus, those that do may alter how easily it spreads, the associated disease severity, the performance of vaccines, therapeutic medicines, diagnostic tools, or other public health and social measures.
Whilst monitoring variants, they can be classified as ‘Variants of Interest (VOIs)’ or ‘Variants of Concern (VOCs)’. Continued evaluation of new variants is a normal part of infectious disease surveillance.
Since the end of June 2022, most COVID-19 infections in the UK have been Omicron variant BA.5 or its sub-lineages. This variant was first identified in April 2022 and has driven the wave of infection seen over the summer, autumn and going into the winter of 2022/23. One of these BA.5 sub-lineages, BQ.1, has been increasing. In the week ending 25 December 2022, BQ.1 comprised 55.1%, and other BA.5 variants (and sub-lineages, excluding BQ.1) comprised 9.7% of all sequenced COVID-19 infections.
Omicron BA.5 has not been found to have a higher risk of hospitalisation and does not have vaccine evading qualities.
Full technical briefings and variants information is available from the UK Health Security Agency (all available here).
Hospitalisations
COVID-19 hospitalisations have fluctuated throughout the pandemic in a similar pattern to the case rates for both England and Hull shown below. COVID-19 hospitalisations have included individuals who are admitted due to COVID-19 illness and those who are identified to have COVID-19 upon admission for other conditions.
The following chart illustrates the number of beds occupied by patients with COVID-19 at Hull Teaching University NHS Trust between 1 August 2020 when information was first collected for hospitals until the end of August 2024.
The chart will include all patients at the hospital regardless of where they live. It is likely that the majority of people living in Hull would have been admitted to Hull Teaching University NHS Trust but they could have been admitted to other hospitals. The chart will also include residents from East Riding of Yorkshire and potentially residents of other local authorities.
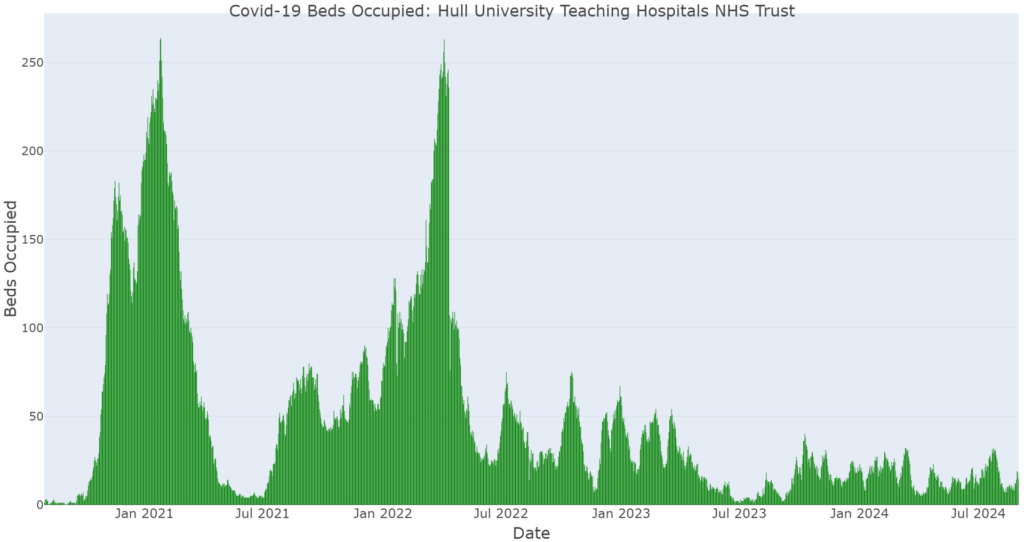
The patterns shown in hospitalisations follows a similar pattern to the infection patterns around a week delayed. The Office for National Statistics infection survey reported a median delay between symptom onset and hospital admission varies between one and seven days depending on age and whether the patient lives in a nursing home. Hospitalisation is higher in older age groups and those with underlying health conditions.
During hospital admissions, individuals were in isolation or within COVID-19 specific quarantine wards. Visitors were not permitted to visit unless under exceptional circumstances such as end of life visits. This has been reported to have caused considerable distress amongst families due to an inability to visit loved ones when unwell and potentially in the last few days of life.
Mortality
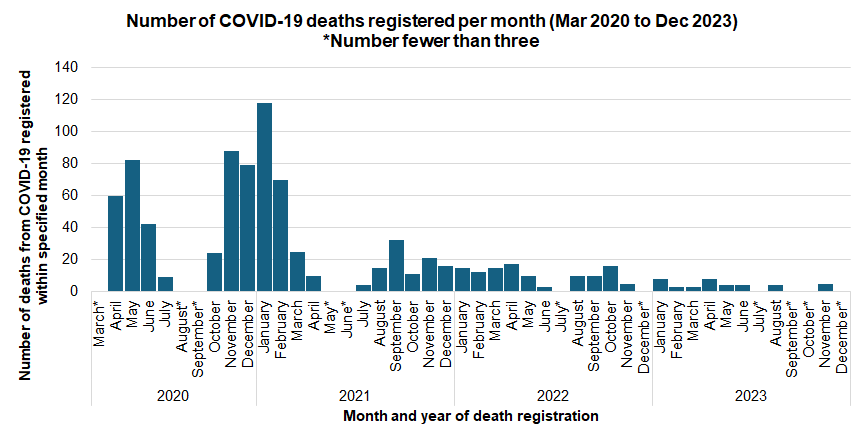
There have been 871 deaths from COVID-19 that have been registered during March 2020 to December 2023 among Hull residents with 388 deaths registered during 2020, 323 deaths registered during 2021, 116 deaths registered during 2022 and 44 deaths registered during 2023.
The majority of deaths to Hull residents from COVID-19 occurred between April and June 2020 and over the winter 2020/21. There were 184 at the start of the pandemic between April and June 2020, and there were 355 deaths between November 2020 and February 2021.
For deaths registered during 2022-24, the directly age standardised mortality rate from COVID-19 was statistically significantly higher in Hull compared to England being around one-third higher than England for both men and women.
For all geographical areas, the mortality rate was much higher among men compared to women. In Hull, the mortality rate was 55% higher in men than women.
Compared with benchmark
| Indicator | Period | England | Yorkshire and the Humber region (statistical) | Kingston upon Hull | East Riding of Yorkshire | North East Lincolnshire | North Lincolnshire | York | North Yorkshire UA | Barnsley | Doncaster | Rotherham | Sheffield | Bradford | Calderdale | Kirklees | Leeds | Wakefield |
|---|---|---|---|---|---|---|---|---|---|---|---|---|---|---|---|---|---|---|
Mortality rate for deaths due to COVID-19, all ages (Persons All ages) | 2022 - 24 | 22.5 | 24.3 | 30.7 | 21.8 | 21.7 | 26.4 | 21.5 | 21.6 | 28.1 | 25.8 | 23.3 | 25.8 | 23.6 | 26.1 | 23.3 | 28.7 | 19.0 |
Mortality rate for deaths due to COVID-19, all ages (Male All ages) | 2022 - 24 | 29.7 | 31.4 | 38.8 | 27.6 | 28.0 | 31.5 | 29.8 | 27.8 | 37.0 | 34.5 | 24.9 | 33.0 | 29.1 | 35.9 | 32.9 | 38.7 | 25.2 |
Mortality rate for deaths due to COVID-19, all ages (Female All ages) | 2022 - 24 | 17.5 | 19.5 | 25.0 | 17.2 | 16.8 | 22.9 | 16.1 | 17.3 | 22.1 | 19.7 | 22.2 | 20.9 | 19.8 | 20.2 | 17.1 | 22.5 | 15.4 |
The mortality rate from COVID-19 was the highest in Hull compared to all the other local authorities in the region for 2022-24.
Compared with benchmark
Mortality rate for deaths due to COVID-19, all ages (Persons All ages) 2022 - 24
| Area |
Recent
Trend |
Count
|
Value
|
95%
Lower CI |
95%
Upper CI |
|
|---|---|---|---|---|---|---|
| England | 38234 | 22.5 | 22.3 | 22.7 | ||
| Yorkshire and the Humber region (statistical) | 4019 | 24.3 | 23.6 | 25.1 | ||
| Kingston upon Hull | 190 | 30.7 | 26.5 | 35.5 | ||
| East Riding of Yorkshire | 318 | 21.8 | 19.5 | 24.4 | ||
| North East Lincolnshire | 115 | 21.7 | 17.9 | 26.1 | ||
| North Lincolnshire | 155 | 26.4 | 22.4 | 31.0 | ||
| York | 140 | 21.5 | 18.1 | 25.4 | ||
| North Yorkshire UA | 539 | 21.6 | 19.8 | 23.5 | ||
| Barnsley | 203 | 28.1 | 24.3 | 32.3 | ||
| Doncaster | 238 | 25.8 | 22.6 | 29.3 | ||
| Rotherham | 189 | 23.3 | 20.1 | 26.9 | ||
| Sheffield | 397 | 25.8 | 23.3 | 28.5 | ||
| Bradford | 313 | 23.6 | 21.0 | 26.4 | ||
| Calderdale | 157 | 26.1 | 22.1 | 30.5 | ||
| Kirklees | 282 | 23.3 | 20.7 | 26.2 | ||
| Leeds | 589 | 28.7 | 26.4 | 31.1 | ||
| Wakefield | 194 | 19.0 | 16.4 | 21.9 |
Source: OHID, based on Office for National Statistics data
Mortality rate for deaths due to COVID-19, all ages (Male All ages) 2022 - 24
| Area |
Recent
Trend |
Count
|
Value
|
95%
Lower CI |
95%
Upper CI |
|
|---|---|---|---|---|---|---|
| England | 20861 | 29.7 | 29.3 | 30.1 | ||
| Yorkshire and the Humber region (statistical) | 2142 | 31.4 | 30.1 | 32.8 | ||
| Kingston upon Hull | 100 | 38.8 | 31.2 | 47.6 | ||
| East Riding of Yorkshire | 171 | 27.6 | 23.6 | 32.2 | ||
| North East Lincolnshire | 65 | 28.0 | 21.5 | 35.7 | ||
| North Lincolnshire | 79 | 31.5 | 24.8 | 39.4 | ||
| York | 77 | 29.8 | 23.4 | 37.3 | ||
| North Yorkshire UA | 286 | 27.8 | 24.6 | 31.3 | ||
| Barnsley | 111 | 37.0 | 30.1 | 44.9 | ||
| Doncaster | 133 | 34.5 | 28.7 | 41.1 | ||
| Rotherham | 88 | 24.9 | 19.8 | 30.8 | ||
| Sheffield | 207 | 33.0 | 28.6 | 37.9 | ||
| Bradford | 158 | 29.1 | 24.7 | 34.2 | ||
| Calderdale | 86 | 35.9 | 28.4 | 44.7 | ||
| Kirklees | 161 | 32.9 | 27.8 | 38.6 | ||
| Leeds | 317 | 38.7 | 34.4 | 43.3 | ||
| Wakefield | 103 | 25.2 | 20.3 | 30.8 |
Source: OHID, based on Office for National Statistics data
Mortality rate for deaths due to COVID-19, all ages (Female All ages) 2022 - 24
| Area |
Recent
Trend |
Count
|
Value
|
95%
Lower CI |
95%
Upper CI |
|
|---|---|---|---|---|---|---|
| England | 17373 | 17.5 | 17.3 | 17.8 | ||
| Yorkshire and the Humber region (statistical) | 1877 | 19.5 | 18.6 | 20.4 | ||
| Kingston upon Hull | 90 | 25.0 | 20.1 | 30.7 | ||
| East Riding of Yorkshire | 147 | 17.2 | 14.5 | 20.3 | ||
| North East Lincolnshire | 50 | 16.8 | 12.4 | 22.1 | ||
| North Lincolnshire | 76 | 22.9 | 18.0 | 28.7 | ||
| York | 63 | 16.1 | 12.3 | 20.6 | ||
| North Yorkshire UA | 253 | 17.3 | 15.2 | 19.5 | ||
| Barnsley | 92 | 22.1 | 17.8 | 27.1 | ||
| Doncaster | 105 | 19.7 | 16.1 | 23.9 | ||
| Rotherham | 101 | 22.2 | 18.1 | 27.1 | ||
| Sheffield | 190 | 20.9 | 18.0 | 24.1 | ||
| Bradford | 155 | 19.8 | 16.8 | 23.2 | ||
| Calderdale | 71 | 20.2 | 15.8 | 25.5 | ||
| Kirklees | 121 | 17.1 | 14.2 | 20.5 | ||
| Leeds | 272 | 22.5 | 19.9 | 25.4 | ||
| Wakefield | 91 | 15.4 | 12.4 | 18.9 |
Source: OHID, based on Office for National Statistics data
Over the five-year period, there have been 902 deaths registered in Hull where COVID-19 was the underlying cause of death. However, the mortality rates have decreased drastically since the start of the pandemic.
Whilst there were a few cases and deaths in February and March, the first wave of the pandemic commenced at the end of March (first lockdown commenced 23 March 2020) with deaths mainly occurring from April onwards, so the mortality rate for 2020 would actually be higher (around one-third higher) than this as the population-at-risk was nine-twelfths of the population.
Whilst the mortality rate for the 2022-24 is statistically significantly higher in Hull compared to England, it can be seen that the inequalities gap between Hull and England has reduced over the four year period, and there is no statistically significant difference between Hull and England for 2024.
Compared with benchmark
Mortality rate for deaths due to COVID-19, all ages (Persons All ages)
|
Period
|
Kingston upon Hull |
Yorkshire and the Humber region (statistical)
|
England
|
||||
|---|---|---|---|---|---|---|---|
|
Count
|
Value
|
95%
Lower CI |
95%
Upper CI |
||||
| 2020 | • | 389 | 194.3 | 175.3 | 214.8 | 157.0 | 128.8 |
| 2021 | • | 323 | 155.4 | 138.8 | 173.5 | 97.5 | 116.6 |
| 2022 | • | 116 | 57.1 | 47.1 | 68.5 | 42.1 | 37.9 |
| 2023 | • | 44 | 21.0 | 15.2 | 28.3 | 20.1 | 19.5 |
| 2024 | • | 30 | 14.5 | 9.8 | 20.8 | 11.3 | 10.6 |
Source: OHID, based on Office for National Statistics data
Among men, mortality rates were statistically significantly higher in Hull compared to England for 2020 and 2021, but not for 2022, 2023 and 2024.
In total, there have been 512 deaths from COVID-19 among Hull men registered between 2020 and 2024.
Compared with benchmark
Mortality rate for deaths due to COVID-19, all ages (Male All ages)
|
Period
|
Kingston upon Hull |
Yorkshire and the Humber region (statistical)
|
England
|
||||
|---|---|---|---|---|---|---|---|
|
Count
|
Value
|
95%
Lower CI |
95%
Upper CI |
||||
| 2020 | • | 225 | 273.6 | 237.3 | 313.7 | 207.4 | 169.9 |
| 2021 | • | 187 | 203.6 | 174.4 | 236.1 | 125.4 | 148.7 |
| 2022 | • | 55 | 65.2 | 48.4 | 85.7 | 55.6 | 50.2 |
| 2023 | • | 25 | 29.0 | 18.3 | 43.4 | 26.0 | 25.7 |
| 2024 | • | 20 | 23.1 | 13.6 | 36.5 | 13.6 | 14.1 |
Source: OHID, based on Office for National Statistics data
Among women, mortality rates were statistically significantly higher in Hull compared to England for 2020, 2021 and 2022, but not for 2023 and 2024.
In total, there have been 390 deaths from COVID-19 among Hull women registered between 2020 and 2024.
Compared with benchmark
Mortality rate for deaths due to COVID-19, all ages (Female All ages)
|
Period
|
Kingston upon Hull |
Yorkshire and the Humber region (statistical)
|
England
|
||||
|---|---|---|---|---|---|---|---|
|
Count
|
Value
|
95%
Lower CI |
95%
Upper CI |
||||
| 2020 | • | 164 | 142.9 | 121.7 | 166.7 | 120.5 | 97.9 |
| 2021 | • | 136 | 115.5 | 96.8 | 136.7 | 76.4 | 91.8 |
| 2022 | • | 61 | 51.2 | 39.1 | 65.8 | 32.9 | 29.5 |
| 2023 | • | 19 | 15.7 | 9.5 | 24.6 | 16.2 | 15.2 |
| 2024 | • | 10 | 8.1 | 3.9 | 14.9 | 9.6 | 8.2 |
Source: OHID, based on Office for National Statistics data
For deaths registered during 2022-24, the mortality rate for premature deaths – deaths that occurred prior to the age of 75 years – from COVID-19 was also relatively high in Hull, 35% higher than England. However, the difference was greatest among males where rates in Hull were 47% higher than England (12% higher for women). The premature mortality rate for men was statistically significantly higher than England, and the highest in the region, but for women, there was no statistically significant difference between Hull and England.
Compared with benchmark
| Indicator | Period | England | Yorkshire and the Humber region (statistical) | Kingston upon Hull | East Riding of Yorkshire | North East Lincolnshire | North Lincolnshire | York | North Yorkshire UA | Barnsley | Doncaster | Rotherham | Sheffield | Bradford | Calderdale | Kirklees | Leeds | Wakefield |
|---|---|---|---|---|---|---|---|---|---|---|---|---|---|---|---|---|---|---|
Under 75 mortality rate for deaths due to COVID-19 (Persons <75 yrs) | 2022 - 24 | 5.4 | 5.8 | 7.3 | 4.4 | 7.1 | 7.0 | 4.7 | 4.2 | 7.3 | 6.8 | 6.9 | 6.2 | 6.2 | 6.2 | 4.6 | 6.6 | 4.9 |
Under 75 mortality rate for deaths due to COVID-19 (Male <75 yrs) | 2022 - 24 | 6.6 | 6.9 | 9.7 | 6.5 | 9.2 | 7.6 | 6.1 | 5.6 | 8.6 | 8.8 | 6.9 | 7.4 | 7.4 | 6.4 | 5.5 | 7.2 | 5.3 |
Under 75 mortality rate for deaths due to COVID-19 (Female <75 yrs) | 2022 - 24 | 4.3 | 4.7 | 4.8 | 2.5 | 5.1 | 6.3 | - | 2.9 | 6.0 | 4.9 | 7.0 | 5.0 | 5.0 | 6.0 | 3.7 | 6.0 | 4.4 |
There were 275 deaths registered in the four year period 2022-24 in Hull from COVID-19 which occurred under the age of 75 years. Mortality rates were statistically significantly higher for the single years 2020, 2021 and 2024, but not for 2022 and 2023.
Compared with benchmark
Under 75 mortality rate for deaths due to COVID-19 (Persons <75 yrs)
|
Period
|
Kingston upon Hull |
Yorkshire and the Humber region (statistical)
|
England
|
||||
|---|---|---|---|---|---|---|---|
|
Count
|
Value
|
95%
Lower CI |
95%
Upper CI |
||||
| 2020 | • | 103 | 48.7 | 39.7 | 59.0 | 38.7 | 35.2 |
| 2021 | • | 125 | 58.3 | 48.5 | 69.5 | 36.2 | 42.1 |
| 2022 | • | 23 | 10.9 | 6.9 | 16.3 | 10.5 | 9.7 |
| 2023 | • | 12 | 5.3 | 2.7 | 9.3 | 4.4 | 4.1 |
| 2024 | • | 12 | 5.6 | 2.9 | 9.7 | 2.5 | 2.3 |
Source: OHID, based on Office for National Statistics data
At least 184 of the 263 premature deaths in Hull were among men which is around two-thirds of all COVID-19 premature deaths. The number of deaths in 2023 was too low to present in Hull (less than 10).
Compared with benchmark
Under 75 mortality rate for deaths due to COVID-19 (Male <75 yrs)
|
Period
|
Kingston upon Hull |
Yorkshire and the Humber region (statistical)
|
England
|
||||
|---|---|---|---|---|---|---|---|
|
Count
|
Value
|
95%
Lower CI |
95%
Upper CI |
||||
| 2020 | • | 71 | 67.5 | 52.7 | 85.2 | 52.2 | 47.2 |
| 2021 | • | 88 | 82.6 | 66.2 | 101.9 | 46.0 | 54.1 |
| 2022 | • | 15 | 14.4 | 8.0 | 23.8 | 13.1 | 12.0 |
| 2024 | • | 10 | 9.5 | 4.6 | 17.6 | 2.8 | 2.8 |
Source: OHID, based on Office for National Statistics data
At least 69 of the premature deaths in Hull were among women, but figures are not presented for Hull women for 2022, 2023 and 2024 as there were fewer than 10 premature deaths in each of these years.
Compared with benchmark
Under 75 mortality rate for deaths due to COVID-19 (Female <75 yrs)
|
Period
|
Kingston upon Hull |
Yorkshire and the Humber region (statistical)
|
England
|
||||
|---|---|---|---|---|---|---|---|
|
Count
|
Value
|
95%
Lower CI |
95%
Upper CI |
||||
| 2020 | • | 32 | 30.0 | 20.5 | 42.4 | 25.8 | 23.9 |
| 2021 | • | 37 | 34.4 | 24.2 | 47.5 | 26.8 | 30.9 |
Source: OHID, based on Office for National Statistics data
As the mortality rate from COVID-19 was higher in Hull, it is not surprising that the mortality rate for deaths involving COVID-19 was also higher. These include deaths that were due to COVID-19 but also deaths where COVID-19 was not the underlying cause of death but it was mentioned on the death certificate as a secondary cause of death.
The number of deaths involving COVID-19 was highest in Hull compared to all other local authorities in the region for 2022-24 for both men and women.
Compared with benchmark
| Indicator | Period | England | Yorkshire and the Humber region (statistical) | Kingston upon Hull | East Riding of Yorkshire | North East Lincolnshire | North Lincolnshire | York | North Yorkshire UA | Barnsley | Doncaster | Rotherham | Sheffield | Bradford | Calderdale | Kirklees | Leeds | Wakefield |
|---|---|---|---|---|---|---|---|---|---|---|---|---|---|---|---|---|---|---|
Mortality rate for deaths involving COVID-19, all ages (Persons All ages) | 2022 - 24 | 34.2 | 36.2 | 47.3 | 34.4 | 34.0 | 39.5 | 31.2 | 32.5 | 38.2 | 36.4 | 31.3 | 37.9 | 36.3 | 39.1 | 33.9 | 42.9 | 30.0 |
Mortality rate for deaths involving COVID-19, all ages (Male All ages) | 2022 - 24 | 44.9 | 46.6 | 58.9 | 41.9 | 43.3 | 44.6 | 43.8 | 43.1 | 49.3 | 46.9 | 33.8 | 48.0 | 47.1 | 52.7 | 46.9 | 57.5 | 39.0 |
Mortality rate for deaths involving COVID-19, all ages (Female All ages) | 2022 - 24 | 26.7 | 29.1 | 38.8 | 28.5 | 26.2 | 36.3 | 22.9 | 24.9 | 30.1 | 29.5 | 29.6 | 31.3 | 28.7 | 30.3 | 25.4 | 33.7 | 24.9 |
There were 1,126 deaths in Hull that were registered during 2020 to 2024 where COVID-19 was mentioned as the underlying cause of death or mentioned as a secondary cause.
Of the these 1,126 deaths mentioning COVID-19 on the death certificate, 902 (80%) had COVID-19 as the underlying cause of death.
Compared with benchmark
Mortality rate for deaths involving COVID-19, all ages (Persons All ages)
|
Period
|
Kingston upon Hull |
Yorkshire and the Humber region (statistical)
|
England
|
||||
|---|---|---|---|---|---|---|---|
|
Count
|
Value
|
95%
Lower CI |
95%
Upper CI |
||||
| 2020 | • | 436 | 217.4 | 197.3 | 239.1 | 173.7 | 142.6 |
| 2021 | • | 394 | 189.5 | 171.1 | 209.3 | 114.5 | 134.5 |
| 2022 | • | 188 | 90.9 | 78.3 | 104.9 | 63.1 | 58.1 |
| 2023 | • | 66 | 31.2 | 24.1 | 39.8 | 29.5 | 29.4 |
| 2024 | • | 42 | 20.3 | 14.6 | 27.5 | 16.8 | 16.0 |
Source: OHID, based on Office for National Statistics data
Overall, 56% of all these deaths were among men.
Among men, the mortality rates were statistically significantly higher in Hull compared to England for 2020, 2021 and 2022, but not for 2023 and 2024.
Compared with benchmark
Mortality rate for deaths involving COVID-19, all ages (Male All ages)
|
Period
|
Kingston upon Hull |
Yorkshire and the Humber region (statistical)
|
England
|
||||
|---|---|---|---|---|---|---|---|
|
Count
|
Value
|
95%
Lower CI |
95%
Upper CI |
||||
| 2020 | • | 245 | 295.4 | 257.8 | 336.8 | 227.5 | 187.2 |
| 2021 | • | 226 | 248.2 | 215.8 | 284.0 | 146.9 | 170.8 |
| 2022 | • | 94 | 108.1 | 86.5 | 133.2 | 81.8 | 76.1 |
| 2023 | • | 37 | 40.9 | 28.3 | 57.0 | 38.8 | 38.7 |
| 2024 | • | 26 | 29.1 | 18.5 | 43.3 | 20.5 | 21.3 |
Source: OHID, based on Office for National Statistics data
Among women, the mortality rates were statistically significantly higher in Hull compared to England for 2020, 2021 and 2022, but not for 2023 and 2024.
Compared with benchmark
Mortality rate for deaths involving COVID-19, all ages (Female All ages)
|
Period
|
Kingston upon Hull |
Yorkshire and the Humber region (statistical)
|
England
|
||||
|---|---|---|---|---|---|---|---|
|
Count
|
Value
|
95%
Lower CI |
95%
Upper CI |
||||
| 2020 | • | 191 | 165.2 | 142.5 | 190.6 | 134.4 | 109.0 |
| 2021 | • | 168 | 143.1 | 122.2 | 166.6 | 90.3 | 106.4 |
| 2022 | • | 94 | 79.2 | 64.0 | 97.0 | 50.4 | 45.5 |
| 2023 | • | 29 | 24.1 | 16.1 | 34.6 | 23.2 | 22.8 |
| 2024 | • | 16 | 13.2 | 7.5 | 21.5 | 14.3 | 12.2 |
Source: OHID, based on Office for National Statistics data
The premature mortality rate for deaths where COVID-19 was the underlying cause or mentioned on the death certificate was higher in Hull compared to England, and it was statistically significantly higher. The rate was also the highest in the region for men, and the third highest among women.
Compared with benchmark
| Indicator | Period | England | Yorkshire and the Humber region (statistical) | Kingston upon Hull | East Riding of Yorkshire | North East Lincolnshire | North Lincolnshire | York | North Yorkshire UA | Barnsley | Doncaster | Rotherham | Sheffield | Bradford | Calderdale | Kirklees | Leeds | Wakefield |
|---|---|---|---|---|---|---|---|---|---|---|---|---|---|---|---|---|---|---|
Under 75 mortality rate for deaths involving COVID-19 (Persons <75 yrs) | 2022 - 24 | 9.1 | 9.6 | 13.3 | 8.5 | 12.8 | 11.2 | 7.9 | 7.3 | 10.8 | 10.2 | 10.5 | 9.9 | 10.2 | 10.2 | 7.6 | 10.3 | 9.4 |
Under 75 mortality rate for deaths involving COVID-19 (Male <75 yrs) | 2022 - 24 | 11.1 | 11.4 | 16.8 | 11.0 | 16.9 | 10.0 | 10.6 | 9.8 | 13.0 | 11.8 | 10.5 | 11.6 | 12.8 | 11.9 | 9.1 | 11.3 | 10.1 |
Under 75 mortality rate for deaths involving COVID-19 (Female <75 yrs) | 2022 - 24 | 7.2 | 7.9 | 9.9 | 6.1 | 8.9 | 12.4 | 5.3 | 4.9 | 8.8 | 8.8 | 10.5 | 8.3 | 7.6 | 8.7 | 6.1 | 9.3 | 8.7 |
The premature mortality rate was statistically significantly higher in Hull compared to England for 2020, 2021, 2022 and 2024, but not for 2023.
Of the 348 premature deaths mentioning COVID-19 on the death certificate, 275 (79%) had COVID-19 as the underlying cause of death.
Compared with benchmark
Under 75 mortality rate for deaths involving COVID-19 (Persons <75 yrs)
|
Period
|
Kingston upon Hull |
Yorkshire and the Humber region (statistical)
|
England
|
||||
|---|---|---|---|---|---|---|---|
|
Count
|
Value
|
95%
Lower CI |
95%
Upper CI |
||||
| 2020 | • | 113 | 53.3 | 43.9 | 64.2 | 43.4 | 39.4 |
| 2021 | • | 150 | 69.7 | 59.0 | 81.8 | 41.2 | 48.0 |
| 2022 | • | 47 | 22.1 | 16.2 | 29.4 | 17.3 | 16.0 |
| 2023 | • | 19 | 8.7 | 5.2 | 13.6 | 7.2 | 7.1 |
| 2024 | • | 19 | 9.0 | 5.4 | 14.1 | 4.3 | 4.1 |
Source: OHID, based on Office for National Statistics data
For men, the premature mortality rate was statistically significantly higher in Hull compared to England for 2020, 2021 and 2024 with no statistically significant difference between Hull and England for 2022 or 2023.
Compared with benchmark
Under 75 mortality rate for deaths involving COVID-19 (Male <75 yrs)
|
Period
|
Kingston upon Hull |
Yorkshire and the Humber region (statistical)
|
England
|
||||
|---|---|---|---|---|---|---|---|
|
Count
|
Value
|
95%
Lower CI |
95%
Upper CI |
||||
| 2020 | • | 79 | 75.1 | 59.4 | 93.7 | 58.5 | 52.5 |
| 2021 | • | 103 | 96.6 | 78.8 | 117.2 | 52.2 | 61.5 |
| 2022 | • | 29 | 27.4 | 18.3 | 39.4 | 21.1 | 19.6 |
| 2023 | • | 10 | 9.3 | 4.4 | 17.1 | 8.4 | 8.7 |
| 2024 | • | 14 | 13.6 | 7.4 | 22.9 | 4.7 | 5.1 |
Source: OHID, based on Office for National Statistics data
For women, the premature mortality rate for deaths involving COVID-19 was higher in Hull than England, but not statistically so. The numbers of deaths for Hull women that were registered during each of 2023 and 2024 was fewer than 10 so are not presented.
Compared with benchmark
Under 75 mortality rate for deaths involving COVID-19 (Female <75 yrs)
|
Period
|
Kingston upon Hull |
Yorkshire and the Humber region (statistical)
|
England
|
||||
|---|---|---|---|---|---|---|---|
|
Count
|
Value
|
95%
Lower CI |
95%
Upper CI |
||||
| 2020 | • | 34 | 31.9 | 22.1 | 44.6 | 29.0 | 27.2 |
| 2021 | • | 47 | 43.2 | 31.7 | 57.5 | 30.7 | 35.3 |
| 2022 | • | 18 | 16.9 | 10.0 | 26.8 | 13.7 | 12.6 |
Source: OHID, based on Office for National Statistics data
Many people who were frail and vulnerable died of COVID-19 during 2020 and 2021 rather than from other diseases and conditions, and this affected the trends over time in relation to patterns of causes of death. For instance, the mortality rate for dementia and mortality rate from COVID-19 for people with dementia was particularly high. This is likely associated with a higher percentage of people with dementia living in care homes, and social distancing might have been more difficult among people with dementia. This change in the pattern of deaths is examined further in relation to COVID-19 and the secondary causes of death among people who died from COVID-19 within Causes of Death under Population.
Long COVID
For some adults and children, coronavirus infection can cause symptoms that last weeks or months after the infection has gone. This is sometimes called post-COVID-19 syndrome or “long COVID”. Symptoms of long COVID include: extreme tiredness/fatigue, shortness of breath, chest pain or tightness, “brain fog” including problems with memory and concentration, difficulty sleeping, heart palpitations, dizziness, pins and needles, depression and anxiety, joint pain, feeling sick, diarrhoea, stomach aches, loss of appetite, high temperature, cough, headaches, sore throat, changes to sense of smell or taste, and rashes.
The evidence base for Long COVID is growing as we learn more about the consequence of infection. COVID-19 infection has been found to impact memory and cause fatigue particularly in adults aged 25+ years. Whilst memory and fatigue can improve over time it can be a slow recovery. Similarly, individuals who experience ongoing COVID-19 symptoms (such as cough, fever, gastrointestinal issues) can have a slower memory and fatigue recovery than those who have asymptomatic infection.
Long COVID can have a big impact on an individual’s life and may require referral to a specialist rehabilitation service or a service that specialises in the specific symptoms that an individual has.
An estimated 2.1 million people living in private households in the UK (3.3% of the population) were experiencing self-reported long COVID (symptoms continuing for more than four weeks after the first confirmed or suspected coronavirus (COVID-19) infection that were not explained by something else) as of 4 December 2022. Of people with self-reported long COVID, 191,000 (9%) first had (or suspected they had) COVID-19 less than 12 weeks previously, 1.9 million people (87%) at least 12 weeks previously, 1.2 million (57%) at least one year previously and 645,000 (30%) at least two years previously. Of people with self-reported long COVID, 637,000 (30%) first had (or suspected they had) COVID-19 before Alpha became the main variant; this figure was 251,000 (12%) in the Alpha period, 382,000 (18%) in the Delta period and 778,000 (37%) in the Omicron period. Long COVID symptoms adversely affected the day-to-day activities of 1.6 million people (76% of those with self-reported long COVID), with 389,000 (18%) reporting that their ability to undertake their day-to-day activities had been “limited a lot”. Fatigue continued to be the most common self-reported symptom of long COVID (71%), followed by difficulty concentrating (49%), shortness of breath (47%) and muscle ache (46%). As a proportion of the UK population, the prevalence of self-reported long COVID was greatest in people aged 35 to 69 years, females, people living in more deprived areas, those working in social care, those aged 16 years and over who were not working and not looking for work, and those with another activity-limiting health condition or disability. The Office for National Statistics (ONS) Long COVID study was updated until March 2023 (can can be found on the ONS website).
According to a review conducted by the UK Health Security Agency (UKHSA) in February 2022, individuals who have had one or more doses of a Covid-19 vaccine are less likely to develop long COVID than those who remain unvaccinated. Vaccination prior to infection has a lower association with long COVID, although studies have identified that vaccination after infection can ease symptoms of long COVID.
For more information on the signs of long COVID and how to access support services, visit the NHS website.
COVID-19 Vaccination Programme
The COVID-19 vaccination programme began in the UK on 8 December 2020. National totals ceased to be updated after 13 July 2023, at which point 151, 248,820 had been given. The vaccines are delivered through two primary doses and a booster dose; eligible individuals (those aged over 50 years and immunosuppressed) are also offered seasonal boosters. For more information on the vaccination offer, you can visit the NHS website here. The COVID-19 vaccination programme was rolled-out across the UK by using an invitation-based prioritisation programme based on age and health risk.
Although individuals may not develop symptoms of COVID-19 after vaccination, it is possible that they could still be infected with the virus and could transmit to others. Several studies have estimated vaccine effectiveness against hospitalisation, indicating high levels of protection particularly after three doses. The vaccines (Moderna, Astrazeneca, Novavax and Pfizer) offer high levels of protection (over 90%) against mortality for COVID-19 Alpha and Delta variants. The UK Health Security Agency continuously monitored vaccine effectiveness.
The autumn 2025 vaccination campaign concentrated on those people aged 75 years old and above, residents in a care home for older adults, and individuals aged 6 months or older who are immuno-suppressed. In Hull (as of 30 June 2024) 58.6% of this cohort have received a spring booster, compared to 65.5% in Yorkshire and the Humber and 62.3% in England as a whole.
Inequalities in vaccination uptake are evidenced by the ONS research which identified vaccination rates were lower in those who lived in deprived areas, those who identified as being from a non-white ethnic minority, worked outside the home for five or more days a week, or who had previously been infected with COVID-19 (using information from survey visits between 21 February and 20 March 2022), although the page is no longer being updated by ONS (last updated March 2023).
Impact of COVID-19
The COVID-19 pandemic has been an international public health incident effecting all countries, people of all ages and backgrounds. Short term impacts of lockdown such as inability to see friends and family dissipated as travel restrictions have lifted both nationally and internationally. However, longer term impacts such a health anxiety, community cohesion, skills, employment and the economy will have a lasting impact. Further information can be found within a study commissioned by the UK Government from the British Academy, which details some of the long-term impacts of COVID-19 expected to be experienced over the next few years.
Research conducted by the Health Foundation has identified that the UK entered the pandemic with life expectancy stalling for the first time in a century and falling for some. The pandemic and response to it have further exposed the inequalities in our society. Some additional impacts that have been identified by the Health Foundation are:
- The pandemic has revealed stark differences in the health of the working age population – those younger than 65 in the poorest 10% of areas in England were almost four times more likely to die from COVID-19 than those in the wealthiest areas.
- Government restrictions, although required to limit COVID-19’s spread, have had wide-ranging consequences, creating a vast amount of unmet health needs and mental health problems, education gaps, early years development gaps, lost employment and financial insecurity.
- Some groups including young people, disabled people, from minority ethnic communities and care home residents have been more affected than others.
Further research conducted by the Health Foundation on the impact of COVID-19 pandemic on the population is available here.
Strategic Need and Service Provision
Ongoing vaccination promotion of additional doses as recommended by the Joint Committee on Vaccinations and Immunisations (JCVI) and promotion of the ‘evergreen’ offer. The vaccine promotion should aim to reduce inequalities in uptake, particularly in high risk groups including elderly individuals, people with severe mental illness and learning difficulties.
Healthcare services will need to consider how services can provide “long COVID” symptom management – service to manage the symptoms but also understanding of employers regarding the difficulty returning to work.
Mental health and wellbeing services will need to consider the mental health impacts of the COVID-19 pandemic both exacerbating existing conditions and consider treatment requirement for individuals with new conditions.
Many people in Hull may have lost employment or have financial implications following COVID-19 lockdown measures. The increasing cost of living and financial hardship will be a potential source of financial instability and stress within households. The knock on and cumulative effects of financial instability and insecurity with increased debt and financial problems and worries are likely to continue for some time.
The full extent of the long-term consequences of the impact on children and young people are continually being recognised. Decreased social interactions impacted on learning, speech and development for pre-school children and school-age children. The gaps in education, much higher rates of school absence including persistence absence from school, and electively home educated children will continue to impact on young people’s future lives particularly those who were affected at key transitional stages of their lives. Levels of poor emotional wellbeing have increased in recent years among children and young people, and it is likely that the pandemic has – at least in part – has been causal.
Resources
Institute for Government. Timeline of UK government coronavirus lockdowns and restrictions. https://www.instituteforgovernment.org.uk/charts/uk-government-coronavirus-lockdowns
Coronavirus (COVID-19) in the UK: https://ukhsa-dashboard.data.gov.uk/
Office for National Statistics. Coronavirus (COVID-19) latest insights – infections: https://www.ons.gov.uk/peoplepopulationandcommunity/healthandsocialcare/conditionsanddiseases/articles/coronaviruscovid19latestinsights/infections
Office for National Statistics. Coronavirus (COVID-19) Infection Survey technical article: waves and lags of COVID-19 in England, June 2021. https://www.ons.gov.uk/peoplepopulationandcommunity/healthandsocialcare/conditionsanddiseases/articles/coronaviruscovid19infectionsurveytechnicalarticle/wavesandlagsofcovid19inenglandjune2021
Office for National Statistics. Updated estimates of coronavirus (COVID-19) related deaths by disability status, England. https://www.ons.gov.uk/releases/updatedestimatesofcoronaviruscovid19relateddeathsbydisabilitystatusengland
Office for National Statistics. Prevalence of ongoing symptoms following coronavirus (COVID-19) infection in the UK. https://www.ons.gov.uk/peoplepopulationandcommunity/healthandsocialcare/conditionsanddiseases/datasets/alldatarelatingtoprevalenceofongoingsymptomsfollowingcoronaviruscovid19infectionintheuk
UK Health Security Agency. The effectiveness of vaccination against long COVID: A rapid evidence briefing. https://ukhsa.koha-ptfs.co.uk/cgi-bin/koha/opac-detail.pl?biblionumber=64359
NHS. Long-term effects of coronavirus (Long COVID). https://www.nhs.uk/conditions/coronavirus-covid-19/long-term-effects-of-coronavirus-long-covid/
NHS. Book or manage a coronavirus (COVID-19) vaccination. https://www.nhs.uk/conditions/coronavirus-covid-19/coronavirus-vaccination/book-coronavirus-vaccination/
UK Government. COVID-19 vaccine surveillance reports. Data on the real-world effectiveness and impact of the COVID-19 vaccines. https://www.gov.uk/government/publications/covid-19-vaccine-surveillance-report
The British Academy. The COVID Decade: understanding the long-term societal impacts of COVID-19. https://www.thebritishacademy.ac.uk/publications/covid-decade-understanding-the-long-term-societal-impacts-of-covid-19/
The Health Foundation. COVID-19 impact inquiry. https://health.org.uk/what-we-do/a-healthier-uk-population/mobilising-action-for-healthy-lives/covid-19-impact-inquiry
Updates
This page was last updated / checked on 19 March 2026.
This page is due to be updated / checked in August 2026.